SEWAGE COLLECTION SYSTEM INSPECTION … COLLECTION SYSTEM INSPECTION FORM (EPA Reg 9; ... a copy of...
34
SEWAGE COLLECTION SYSTEM INSPECTION FORM (EPA Reg 9; form revised September 23, 2010) GENERAL INFORMATION Inspection Date: October 28, 2010 Utility Name: City of Avalon Wastewater Treatment Plant Address:123 Pebbly Beach Road Avalon, CA 90704 Contact Person: Charlie Wagner, Chief Administrative Officer, City of Avalon Phone: 310-510-0220 Cell: Fax: Email: Inspectors Names Agency/Contractor JoAnn Cola U.S. EPA, Region 9 Russ Colby State of California RWQCB, Region 4 Raul Medina State of California RWQCB, Region 4 Ivar K. Ridgeway State of California RWQCB, Region 4 L.B. Nye State of California RWQCB, Region 4 Hugh Marley State of California RWQCB, Region 4 Brandi Outwin State of California RWQCB, Region 4 Noah Golden-Krasner State of California Attorney General’s Office, Los Angeles Utility personnel who accompanied inspectors Name Title Charlie Wagner Chief Administrative Officer, City of Avalon Denise Radde City Manager’s Office, City of Avalon Pastor Lopez Director of Public Works, City of Avalon Vic Savage Area Manager, United Water Brent Brady Project Manager, United Water Ralph Sogliuzzo Assistant Project Manager, United Water Mike Jones Former Avalon Project Manager, United Water Shawn Hagerty BBK, representing City Attorney’s Office
Transcript of SEWAGE COLLECTION SYSTEM INSPECTION … COLLECTION SYSTEM INSPECTION FORM (EPA Reg 9; ... a copy of...

SEWAGE COLLECTION SYSTEM INSPECTION FORM
(EPA Reg 9; form revised September 23, 2010)
GENERAL INFORMATION
Inspection Date: October 28, 2010
Utility Name: City of Avalon Wastewater Treatment Plant
Address:123 Pebbly Beach Road
Avalon, CA 90704
Contact Person: Charlie Wagner, Chief Administrative Officer, City of Avalon
Phone: 310-510-0220 Cell: Fax:
Email:
Inspectors Names Agency/Contractor
JoAnn Cola U.S. EPA, Region 9
Russ Colby State of California RWQCB, Region 4
Raul Medina State of California RWQCB, Region 4
Ivar K. Ridgeway State of California RWQCB, Region 4
L.B. Nye State of California RWQCB, Region 4
Hugh Marley State of California RWQCB, Region 4
Brandi Outwin State of California RWQCB, Region 4
Noah Golden-Krasner State of California Attorney General’s
Office, Los Angeles
Utility personnel who accompanied inspectors
Name Title
Charlie Wagner Chief Administrative Officer, City of
Avalon
Denise Radde City Manager’s Office, City of Avalon
Pastor Lopez Director of Public Works, City of Avalon
Vic Savage Area Manager, United Water
Brent Brady Project Manager, United Water
Ralph Sogliuzzo Assistant Project Manager, United
Water
Mike Jones Former Avalon Project Manager, United
Water
Shawn Hagerty BBK, representing City Attorney’s
Office

2
SYSTEM OVERVIEW
(This inspection form was filled out by the City of Avalon and e-mailed to EPA after the
inspection. Inspector has added notes.)
Population:____3,800______ Service Area (Sqr. Miles):____1.4_______
Service Area Description: The City of Avalon is an island resort community.
Residential Commercial Industrial Total
Number of
service
connections
1,500 200
Combined Sewers (% of system): <2% (Inspector is unclear as to the meaning of this
response.)
Name and NPDES permit number for WWTP(s) owned or operated by the collection system
utility: Waste Discharge Requirements for the City of Avalon Order No. R4-2008-0028
NPDES No. CA0054372
Name and NPDES permit number for WWTP(s) that receive flow from the collection system
utility: None
Names of upstream collection systems sending flow to the collection system utility:
None
Names of downstream collection systems receiving flow from the collection system utility:
N/A
__________________________
__________________________
Do any interagency agreements exit with upstream collection systems? (Y/N) N/A
Does the utility maintain the legal authority to limit flow from upstream satellite collection
systems? (Y/N) N/A
SYSTEM INVENTORY (LIST ONLY ASSETS OWNED BY UTILITY)
Miles of
gravity main
Miles of
force main
Miles of
Laterals
Number of
maintenance
access
structures
Number of
pump
stations
Number of
siphons
11 1.25 Unknown Appx. 125 2 0
Utility responsibility for laterals (none, whole, lower) lower

3
Size Distribution of Collection System
Diameter in inches Gravity Sewer (miles) Force Mains (miles)
6 inches or less 8.25 0
8 inches 1.75 0.9
9 - 18 inches 0.5 0.3
19 - 36 inches 0.5 0
> 36 inches 0 0
Age Distribution of Collection System
Age Sewer Mains, miles # of Pump Stations
0 - 25 years 6.7 0
26 - 50 years 5.5 2
51 - 75 years 0 0
> 76 years 0 0
(City’s response appears reflective of pipe lining work. During the interview, the City
indicated that pipes were installed 100 years ago.)
SYSTEM FLOW CHARACTERISTICS
Collection System
Average Daily Dry Weather
Flow (MGD)
Peak Daily Wet Weather Flow
(MGD)
Peak Instantaneous Wet
Weather Flow (MGD)
0.4 0.7 (Summer Q) 2.0
Location of flow monitor(s) from which above information obtained: WWTP effluent meter
Period over which flow was monitored: 24 hours/day
Agency conducting the flow monitoring: United Water Environmental Services, Inc.
If no flow monitors, describe method for estimating flows:
Wastewater Treatment Plant
Average Daily Dry Weather
Flow (MGD)
Peak Daily Wet Weather Flow
(MGD)
Peak Instantaneous Wet
Weather Flow (MGD)
0.4 0.7 2.0

4
Upstream Satellite Name Avg. Dry Weather Flow Peak Flow
(MGD)
Flow based on
meter or
estimate? (MGD) % of total flow
Hamilton Cove 0.02 4.0 .05 estimate
Constructed Overflow Points
Overflow
Point
Location Number of Discharges/Year
None
REGULATORY BACKGROUND
Does the system operate under the provisions of an NPDES permit (either their own or under
provisions of another agencies permit)? (Y/N) Y
Permit holder: City of Avalon Permit # NPDES Permit No. CA0054372
List provision of the permit that apply (If permit holder is other than the agency being inspected)
______________________________________________________________________________
______________________________________________________________________________
______________________________________________________________________________
______________________________________________________________________________
___________________________________________
Does the system operate under a state permit? (Y/N) Y
Are there any spill reporting requirements? (Y/N) Y
Which agency (or agencies) promulgates the spill reporting requirements? Los Angeles County
Health Department; California Office of Emergency Services; California Regional Water
Quality Control Board, Los Angeles Region
Outline the spill reporting requirements (summarize spill reporting requirement for each
applicable statute, regulation and permit): __See spill reporting
plan._________________________________________________________________________
______________________________________________________________________________
______________________________________________________________________________
_____

5
SPILLS
Sanitary Sewer Overflows From and Caused by Utility
Note: Spill Rate = number of SSOs/100 miles of sewer pipe/year
Year Mains
(Miles of Mains 11)
Laterals
(Miles of Laterals _0_)
Totals
(Total Miles_11_)
#SSOs (1)Spill
Rate
(see
below)
Gross
Spill
Volume
#SSOs (2)Spill
Rate
(see
below)
Gross
Spill
Volume
Total
SSOs
(3)Total
Spill
Rate
(see
below)
Total
Gross
Spill
Volume
2010 3 27 29,200 NR -- -- 3 27 29,200
2009 2 18 14,300 NR -- -- 2 18 14,300
2005 1 9 1,300 NR -- -- 1 9 1,300
Total 6 44,800 NR -- --
(1)Spill Rate = [(#SSOs in main pipe) X 100]/Miles of Main Pipe in System
(2)Spill Rate = [(#SSOs in laterals) X 100]/Miles of Lateral in System
(3)Total Spill Rate = [(#SSOs in Main + #SSOs in Laterals)X100]/[Miles of Main + Miles of
Laterals]
Spill Cause
Year
(as
listed in
Table
above)
Blockage Gravity
Pipe
Break
Force
Main
Break
Pump
Station
Capacity
Grease Roots Debris Multiple
# % # % # % # % # % # % # % # %
2010 2 66 1 34
2009 2 100
2005 1 100
Total
Please attach a copy of facility spill records for each of the past five years. The information for
each spill should include, at a minimum, the following: Date of spill, time spill reported,
location of spill (address and city), whether the spill occurred in a private lateral, whether it
reached a surface water, total volume of the spill, volume of spill recovered, volume of spill that
reached a surface water, the appearance point of the spill, final spill destination, spill cause and
explanation, whether a health warning was posted.

6
BUILDING BACKUPS (list only backups caused by problems in sewer mains)
Year Number of backups Cost of Settled Claims
2010 1 In process
TOTAL 1
STAFFING
Indicate *Number of Staff – As pertaining specifically to collection system responsibilities
*Provided as numerical or FTEs or positions
Management and Administrative: Budgeted_0.2_ Filled___0.2___
Maintenance: Budgeted__0.0__ Filled__0.0_______
Electricians and Mechanical Technicians: Budgeted _0.0__ Filled __0.0_____
Operators: Budgeted _0.6_ Filled _0.6____
Engineering: Budgeted _0.0_ Filled _0.0____________
Number of Certified Collection System Operators/Certification Program: _0.0____________
Number of Sewer Cleaning Crews: _1.0__
Sewer Cleaning Crew Size: _0.6_
Contractor Services Contractor Name(s)
(NA if contractors not used) Cost ($/year)
Sewer Cleaning Performance Pipeline $20,000
Chemical Root Control None $0
Spot Repairs Jamison Eng. $10,000
CCTV Performance Pipeline $20,000
Spill Response None $0
Other:

7
EQUIPMENT
List Major Equipment Owned by the Utility:
Equipment Number Number in Service
Combination Trucks
(hydroflush and vactor)
1 1
Hydroflusher 0 0
Mechanical Rodder 0 0
CCTV Truck 0 0
Utility Truck 2 2
Portable Pumps 3 3
Portable Generator 3 3
FINANCIAL
Does the collection system operate from an enterprise fund? Yes/No
REVENUES
Revenue Source Annual Revenue ($/year)
User Fees $1,330,632
Connection Fees $10,000
Grants
Bonds
SRF Loans
Interest $15,100
TOTAL
EXPENSES
Expense Annual Cost
($/year)
Cost / Mile of Pipe
(Total Pipe Mileage: 12.5__)
Maintenance $225,753 $18,060
Operations (electric, fuel, etc.) $15,000 $1,200
Salaries and Benefits $45,573 $3,646
Capital Improvements (See ACIA budget)
Debt payments
Contract services $878,685 $70,295
TOTAL $1,165,011 $93,201

8
Average Monthly Household User Fee for Sewage Collection: $36.06 ($432.71 billed annually)
Wastewater Treatment: No separate charge
Total Wastewater Fees: $36.06 ($432.71 billed
annually)
Sewer Fee Rate Basis (i.e. water consumption, flat rate, etc.): Flat rate based on number of
units
Last Fee Increase (Date): 7/01/2009
Planned Fee Increases: A fee increase is expected in FY2011 - 2012 as the sewer master plan
is developed.
Capital Improvement Fund: $885,000 for one years (see ACIA budget) (City’s budget is
attached.)
SPILL RESPONSE, NOTIFICATION AND REPORTING
Does the Utility Have a Written Spill Response Plan? Yes
Is the Plan Carried by Maintenance/Spill Response Crews? No
Indicate Elements Included In the Spill Response Plan
Element Y/N Comment
Identification of Responsible Staff Y United Water emergency call-out sheet
DISPATCH
System for Becoming Aware of Spills Y
System for Receiving Public Calls Y
Dispatch Procedures – Normal Hours Y
Dispatch Procedures – After Hours Y
Coordination with First Responders
(police, fire department) Y
Response Time Goal 20 min.
SPILL CONTROL/MITIGATION
Spill Response Activity Sequence Y
Spill Site Security Y Local sheriff as needed
Procedures for Stopping Spills Y
Spill Containment Y
Protection of Storm Drains N Storm drain system provides containment
Cleanup/Mitigation Y
DOCUMENTATION
Spill Volume Estimation Method
(list method in comment field) Volume based on pump rate and time
element involved
Determination of Spill Start Time Y
Spill Sampling N
Receiving Water Sampling Y
Photographing Spill Site Y
Field Notes Form N

9
Spill Report Form Y
NOTIFICATION
Notification of Affected Public
(schools, recreational users, etc.) Y
Posting Warning Signs Y
Sanitation Information re: building
backups Y
REPORTING
Reporting Procedures Y
Spill Report Forms Y
Persons Responsible for Filing Reports Y Plant manager
Are all spills reported regardless of volume? Yes
Are Contractors Required to Follow Spill Response Procedures? Yes
Average Spill Response Time (normal work hours): 0.3 hours
Average Spill Response Time (after hours/holidays): 0.5 hours
Does the Utility CCTV Pipes Following Spill? No
Are Cleaning Schedules Adjusted in Response to Spills? No
SEWER CLEANING AND MAINTENANCE
Does the Utility Have Detailed Sewer System Maps? No
Are Maps on GIS Database? No
Are Maps Available to Maintenance Crews? No
Maintenance Management System is (check whichever is applicable):
Written ____ Computerized __X___ Both ________ Other (describe) ________________
ANNUAL SEWER CLEANING – Include hydroflushing, mechanical and hand rodding
Pipe Cleaning excluding repeats Pipe Cleaning Including Repeats
(miles/year) % of system/year (miles/year)
2 20 2
What does the crew report for total length of pipe cleaned in a single visit if they clean the same
pipe segment more than once during that visit?
System Cleaning Frequency (years to clean entire system): _5____
Types of problems subject to hot spot cleaning? _None__________________________
HOT SPOT CLEANING SCHEDULE
Cleaning Frequency Number of
Locations
Pipe length excluding
repeats (miles)
Pipe length including
repeats (miles)
1/month
6/year
4/year
2/year
1/year 3 < 1 mile < 1 mile

10
CHEMICAL ROOT TREATMENTS
Length of pipe subject to chemical root treatments (miles/year): _______
Chemical treatment frequency: Never
Root treatment chemicals used: ____________________________________________
SPOT REPAIRS
Spot repairs completed annually: ________ (#/year); _______ (miles/year)
Spot repair budget ($/year): _______
Spot repair expenditures last year: $_________; year: ________
ODORS
Annual number of complaints: _3___
Odor hot spot locations: __Pebbly Beach_________________________________
Odor treatment facilities: __2____________________________________________
EASEMENT PIPE CLEANING
Total length of easement pipes (miles): _0____
Annual easement pipe cleaning (miles/year): _0____
Do maintenance workers have access to all easements? _________________________
(The section on cleaning and preventive maintenance differs from what the City said to
inspection team during the interview. The City said during the interview that it does not
have preventive maintenance schedules, but does respond to “problem spots” and reacts to
problems. Preventive maintenance is performed only at the pump stations.)
FATS, OILS AND GREASE (FOG) CONTROL
Does the Utility have a FOG source control ordinance? _No_
Ordinance Citation: __________________________________
Agency responsible for implementing the FOG control program: _City of Avalon_
Number of Food Service Establishments (FSEs) in service area: ___________
Number of FSEs subject to FOG ordinance: _0______
Indicate Elements Included In the Food Service Establishment FOG Source Control
Program
Element Y/N Comment
FSE Permits N
FSE inspections N
FSE enforcement N
Oil & grease discharge concentration
limit N
Grease removal device (GRD)
requirements:
traps N

11
interceptors N
Automatic cleaning traps N
FSEs subject to GRD installation:
all FSEs (new and existing) N
new FSEs N
remodeled FSEs N
for cause at existing FSEs N
GRD maintenance requirements:
Cleaning frequency 0
25% rule (grease and solids
accumulation) N
Kitchen BMP Requirements
(list required BMPs below)
Allowance for chemical additives? N/A
Allowance for biological additives? N/A
FOG Disposal Requirements N/A
FOG Disposal Manifest System N/A
Number of FOG Program staff:
Inspectors _0_
Permit writers _0_
Other _0__
FSE Inspection frequency: _N/A_
Annual number of FSE inspections: _0___
Does Utility use CCTV to identify FOG sources? _No__
Does sewer maintenance staff coordinate with FOG source control program staff? _No_
Cleaning targeted to FOG hot spots? _N/A_
Maintenance crew referrals to FOG program? _N/A_
Pipe repairs at FOG hot spots? _N/A_
Describe program for public outreach and education related to residential FOG sources:
______________________________________________________________________
______________________________________________________________________
_______________________________________________________________________

12
PIPE INSPECTION AND CONDITION ASSESSMENT
Gravity Main Inspection
Describe Pipe Inspection Methods: Gravity sewers are inspected using a CCTV system.
Miles of Pipe Inspected in the Last 10 Years and Planned Inspection Next 10 Years
Date Range Inspection
Method
Miles of Pipe
without repeats
Useable Condition Assessment
Miles of Pipe
(without repeats)
% of System
(System miles: )
2000 to present CCTV 8.25 8.25 75%
2000 to present Other -- -- --
Present to 2020 CCTV 11 11 100%
Present to 2020 Other 2.2 2.2 20%
Describe Planned Pipe Inspection: 20% (2.2 miles/year)
Summary of Condition Assessment Findings:
Force Mains
Describe Force Main Inspection Methods: None
Describe Program for Inspecting Air Relief Valves: N/A
Private Laterals
Does the Utility Inspect Private Laterals? __Yes__
Number of Private Laterals Inspected 2006 to Present: _325__
Summary of Inspection Findings: 129 laterals relined, 196 replaced (2008).
Number of Private Laterals Planned for Inspection Present to 2020_____________

13
CAPACITY ASSURANCE
List Locations and Dates of Repeats Capacity Spills:
Pebbly Beach Pump Station
8/31/10
8/22/10
10/5/05
List Locations of Known Capacity Bottlenecks:
Dry Weather: Pebbly Beach Pump Station
Catherine Pump Station
Wet Weather: Pebbly Beach Pump Station
Catherine Pump Station
Describe I&I Assessments Completed by the Utility (dates, area covered, findings, etc.):
A hydraulic and infiltration analysis was conducted for each site/basin for the flow
monitoring period of March 12, 2004 to May 01, 2004. A summary of the relevant data is
provided in Table 5.1 (below).
Net daily average and diurnal flows from each metered area were typical of other like sized
areas with similar land uses. Estimated base infiltration (BI) rates system-wide do not
appear to be unreasonably high, although there is evidence to suggest that some isolated
zones within the system may be experiencing above standard BI rates. The BI rates since
1993 appear to have decreased in Basins 003 and 004 as well as system-wide.
Hydraulic performance at each metered site indicates the system is not experiencing any
significant dry-weather capacity issues.
Flow Meters (number, locations):

14
Describe Flow Model Used by the Utility:
Inflow
Does the Utility Prohibit Storm Water Connections to the Sanitary Sewer (roof drains, sump
pumps, etc.)? Unknown
Describe Program for Enforcing Ban on Illicit Connections: Unknown
Describe Program for Locating Illicit Connections (smoke testing, etc.): Smoke testing done in
1999.
Locations Subject to Street Flooding: Clarissa and Crescent Streets.
Has the Utility Sealed Manholes in Locations Subject to Street Flooding: Yes
I&I Control
Describe I&I Control Projects (miles of pipe rehabilitated or replaced for I&I Control)
Recently Completed Projects: All manholes in “the Flats” sealed; all mains in “the
Flats” sliplined.
Planned Projects: Unknown
Describe Capacity Control Measures (relief sewers, storage, WWTP expansion, etc.)
Recently Completed Projects: None.
Planned Projects: Unknown.
INFRASTRUCTURE RENEWAL AND CAPITAL IMPROVEMENTS
Pipe Rehabilitation and Replacement Methods Used:
Miles of Pipe Rehabilitated or Replaced: Last 10 Years and Planned Next 10 Years
Date Range Miles of Pipe % of System
(System miles: )
1999 to present 6.7 55%
Present to 20__ Unknown N/A
Describe Capacity Improvement Program: N/A
List Major Planned Improvements:

15
Per City of Avalon: The FY 2010-2011 ACIA sewer budget
contains $885,000 for capital improvements. Listed below:
Decant Tank Refit 245,000 Casino Sewer Laterals 120,000 Slip Lining ‐ Falls Canyon 25,000 Camera ‐ Marilla, et al 20,000 Slip Lining ‐ Marilla, et al 350,000 Emergency Generator ‐WWTP 125,000 Total $885,000
Describe Master Plan:
Per City of Avalon: The City will award a contract to RBF Consulting on November 16,
2010. This contract will be the basis of developing a master plan to map, grade and
improve the system, city wide.
(During the inspection, the City indicated that, although the funds listed above had been
budgeted, the projects were “on hold” pending review by the new contractor. The City
indicated uncertainty that the projects had been properly described and prioritized, as it
was in the middle of a contract dispute with its O&M contractor.)

16
PUMP STATIONS
(Please complete one sheet for EACH pump station)
Name and Location of Pump Station: __Pebbly Beach Pump Station_________
Pump Information
Pump #/Name Dry or
Submersible
Capacity Constant or
Variable
In Service?
Pebbly Beach #1 Drywell Sub 700 gpm Variable Yes
Pebbly Beach #2 Drywell Sub 700 gpm Variable Yes
Pebbly Beach #3 Drywell Sub 700 gpm Variable Yes
Pump Station Information:
A. Average flow: __0.46 MGD___________________________
B. Holding Time: __10 minutes__________________________
C. Does station have sufficient pumping capacity with the largest pump out of
service during:
Peak Dry Weather Flow: Yes
Peak Wet Weather Flow: Yes
D. Dry weather capacity limitations? Y/N (if yes, describe) No_____
E. Wet weather capacity limitations? Y/N (if yes, describe) No______
F. Number of failures resulting in overflows/bypass or backup, in the last five
years _3____
G. Total quantity of overflow/bypass: Gallons or MG 24,300 gallons
H. Is dry well protected from wet well overflow? Yes_X_ No_____
I. How often is pump station inspected? _Bi-weekly________________
J. Back up power sources and type:
On-site
generators
Portable
Generators
Back-Up Line
from same grid?
Back-up Line
from different
grid?
Other (describe)
Yes_X_No____ Yes____No_X_ Yes____No_X Yes____No_X_
If generators on-site, describe testing and maintenance procedures: Annual
inspection and load test. Weekly run testing.
K. Station Alarms:
Low Wet Well High Wet Well Power Loss Unauthorized
Entry
Other
(Describe)
Yes___No_X Yes X No____ Yes_X_No____ Yes___No_X_
a) Is there 24 hour coverage for alarms? Yes__X______No_______________
b) Alarm signal sent to: Duty operator cell phone______________________
L. What equipment is available for emergency response? Service truck
M. Are there SCADA controls? Yes ______________ No __X__________
If yes, ability to operate station remotely? Yes __________ No___________

17
PUMP STATIONS
(Please complete one sheet for EACH pump station)
Name and Location of Pump Station: __Catherine Pump Station_________
Pump Information
Pump #/Name Dry or
Submersible
Capacity Constant or
Variable
In Service?
Catherine #1 Drywell Sub 850 gpm Variable Yes
Catherine #2 Drywell Sub 850 gpm Variable Yes
Pump Station Information:
A. Average flow: _0.46 GPM_______________________________
B. Holding Time: _10 minutes___________________________
C. Does station have sufficient pumping capacity with the largest pump out of
service during:
Peak Dry Weather Flow: Yes__X___No_________
Peak Wet Weather Flow: Yes__X________No___________
D. Dry weather capacity limitations? Y/N (if yes, describe) __No____
E. Wet weather capacity limitations? Y/N (if yes, describe) ___No____
F. Number of failures resulting in overflows/bypass or backup, in the last five
years __0____
G. Total quantity of overflow/bypass: Gallons or MG _0 gallons___
H. Is dry well protected from wet well overflow? Yes_X_ No_____
I. How often is pump station inspected? __Bi-weekly______________
J. Back up power sources and type:
On-site
generators
Portable
Generators
Back-Up Line
from same grid?
Back-up Line
from different
grid?
Other (describe)
Yes_X_No____ Yes____No_X_ Yes____No_X_ Yes____No_X_
If generators on-site, describe testing and maintenance procedures: Annual
inspection and load testing. Weekly run testing.
K. Station Alarms:
Low Wet Well High Wet Well Power Loss Unauthorized
Entry
Other
(Describe)
Yes___No_X Yes_X_No____ Yes_X_No____ Yes___No_X_
a) Is there 24 hour coverage for alarms? Yes__X_____No_______________
b) Alarm signal sent to: Duty officer cell phone_________________________
L. What equipment is available for emergency response? Service truck
M. Are there SCADA controls? Yes ______________ No ___X_________
If yes, ability to operate station remotely? Yes __________ No___________

18
ATTACHMENT 1
PHOTOGRAPHS TAKEN DURING INSPECTION OF CITY OF
AVALON, CALIFORNIA
Photographs IMG_3259 through IMG_3268 were taken by JoAnn Cola on October 28, 2010
Figure 1: IMG_3259. Pump station for the low-flow diversion station at “Busy Bee” location. The City told
the inspection team that the sewer system uses the low-flow diversion system to capture sewer system spills,
which can then be pumped back to the WWTP. The system is a separate sewer system but is, in effect,
operated similarly to a combined system.

19
Figure 2: IMG_3260. Low-flow diversion system.
Figure 3: IMG_3261. Manhole located in the alley behind the El Galleon restaurant. Small amount of
grease is visible, lots of soap suds.

20
Figure 4: IMG_3262. Mike Jones of United Water opening the cover at the Catherine lift station.
Figure 5: IMG_3263. Catherine lift station.
21
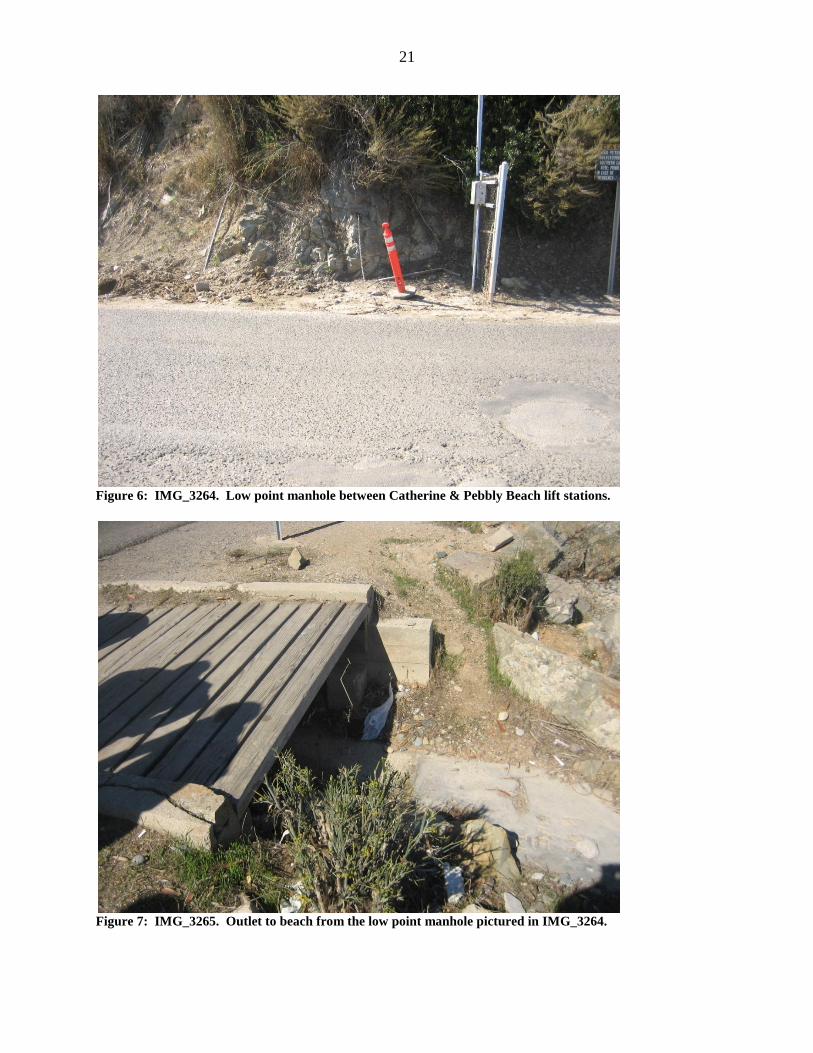
Figure 6: IMG_3264. Low point manhole between Catherine & Pebbly Beach lift stations.
Figure 7: IMG_3265. Outlet to beach from the low point manhole pictured in IMG_3264.

22
Figure 8: IMG_3266. Site of spill at Pebbly Beach lift station.
Figure 9: IMG_3267. Pebbly Beach lift station.

23
Figure 10: IMG_3268. Control panel and wet well area at Pebbly Beach lift station.
The following photos, IMG_3269 through IMG_3275, were taken at the Avalon wastewater
treatment plant by Brandi Outwin, RWQCB4 on October 28, 2010.

24
Figure 11: IMG_3269. Rotoscreens at wastewater treatment plant, site of an in-plant spill.
Figure 12: IMG_3270. Aeration basins.

25
Figure 13: IMG_3271. Aeration basins. Original image has been rotated 90
o clockwise.

26
Figure 14: IMG_3272. Aeration basins. Original image has been rotated 90
o clockwise.

27
Figure 15: IMG_3273. Digesters. Original image has been rotated 90
o clockwise.

28
Figure 16: IMG_3274. Clarifiers.
Figure 17: IMG_3275. Pumps and blowers.

29
ATTACHMENT 2
INSPECTION SUMMARY
1. Introduction. On October 28, 2010, EPA Region 9, accompanied by Regional Board 4
and the State Attorney General’s Office inspected the City of Avalon’s wastewater
collection system. Information provided by Avalon’s representatives is summarized in
the Sewage Collection System Inspection Form, above. This summary provides
highlights of EPA’s inspection findings.
The City of Avalon is located on Catalina Island in Los Angeles County, California.
Avalon is approximately 22 miles SSW from Los Angeles Harbor. Avalon is primarily a
resort community. Local businesses consist primarily of tourist-related hospitality and
retail, with few industrial facilities. Avalon owns 11 miles of sewage collection pipe,
including two lift stations, and a waste water treatment plant (“WWTP”). In addition, the
City also has a dual piping system to enable it to use saltwater for fire suppression,
irrigation, and toilet flushing at elevations of less than 180 feet. The City of Avalon has
contracted with United Water for the past 20 years to operate its WWTP, sewage
collection system, and the saltwater system. The City of Avalon expects to have a new
contract for operation in March 2011. Average daily dry weather flow is 0.49 MGD.
Because Avalon is a resort community, high flows typically occur during the summer,
when the average daily flow is 1.8 MGD. The influent to the WWTP is approximately
50% saltwater.
2. Occurrence of Sanitary System Overflows (“SSOs”). Discharges to waters of the
United States without a permit are prohibited by Section 301(a) of the Clean Water Act.
Part C.1 Prohibitions of the Statewide General Waste Discharge Requirements for
Sanitary Sewer Systems, DWQ No. 2006-0003, states that any spill that results in a
discharge of untreated or partially treated wastewater to waters of the United States is
prohibited. Part III of the Waste Discharge Requirements for the City of Avalon Order
No. R4-2008-0028 NPDES No. CA0054372 also prohibits discharges at locations other
than that described in the Permit, and prohibits overflows of untreated wastewater to
surface waters or surface water drainage courses.
The City owns and is responsible for the operation and maintenance of 11 miles of pipe.
According to responses on the inspection questionnaire submitted by Avalon to EPA
following the inspection, from January 1, 2005 through September 30, 2010, 6 SSOs
occurred. The spill rate is 10 spills/year/100 miles pipe, when averaged over the 5.75
year period. Of the spills reported during 2009 and 2010, the total spill volume was
43,500 gallons, of which only 600 gallons was recovered. During 2010, all SSOs were
reported to CIWQS to have affected surface waters. Recommendation: In order to fully
comply with the Clean Water Act, the Statewide General Waste Discharge Requirements

30
for Sanitary Sewer Systems, DWQ No. 2006-0003, and its NPDES Permit, the City must
make all reasonable efforts to eliminate SSOs.
3. Documentation of SSOs. The State Water Resources Control Board’s Order No. 2006-
0003DWQ Statewide General Waste Discharge Requirements also require Avalon to
develop and implement a Sewer System Management plan (“SSMP”), including a Sewer
System Overflow Response Plan (“SSORP”). State Water Resources Control Board’s
Monitoring and Reporting Program No. 2006-003-DWQ Statewide General Waste
Discharge Requirements for Sanitary Sewer Systems establishes requirements for
monitoring, recordkeeping, and reporting. Paragraph B of the Monitoring Program
requires that the documentation related to SSOs must be maintained by Enrollee for a
period of five years. The required documents include copies of the report submitted to
California Integrated Water Quality System (“CIWQS”), logs of SSO calls, service call
records, SSO records, complaints, and maintenance records.
Except for 911 call audio tapes of those calls made to the sheriff’s department, there is no
record or log kept of sewer trouble calls made by the public to the City. Both City and
United Water representatives told the inspection team that spills are sometimes reported
by the public in person to City or United Water staff. United Water representatives said
that a log book for the WWTP is maintained, and an entry is made to record trouble call
outs.
The City of Avalon’s Sewer System Management Plan (“SSMP”) is dated September
2010 and was adopted by the City Council in October 2010. Section 5, page 17 of the
SSMP describes the actions for staff to take when responding to spills. It says the
response staff is to first call to dispatch equipment, then, “…2) determine the flow path,
width, length, and depth in order to document the volume of the spill. 3) If possible, take
pictures to document the spill and your efforts to contain the flow and restore the area.”
United Water’s Sewer System Overflow Response Plan (“SSORP”) is attached as an
appendix to the SSMP. Item three of the SSORP instructs response staff to “take camera,
GPS, and reporting packet”. Based on the statements made by the City during the
interview, response personnel do not follow the procedures established by the City’s
SSMP and SSORP for documenting SSOs. City staff told inspectors that the city
vehicles used for spill response do not contain either spill response forms or cameras, and
that the response staff does not photograph spills. Although the CIWQS reports prepared
by United Water do contain the coordinates of the spill location, the City staff told
inspectors that the City has no GPS capability, nor any staff currently trained to use it.
United Water staff said that response staff used a photo chart to estimate spill volume.
The SSORP contains a “sewer overflow volume estimation guide” comprised of a series
of nine photos depicting manhole overflows ranging from 5 to 275 gallons per minute, it
is a very poor quality copy, and the SSORP includes no alternate methodology for
estimating spill volume. During the interview, the City staff told inspectors that the spill

31
responders do not take any notes at the spill site. The City told inspectors that, except for
the trouble call log binder kept at the WWTP, it does not maintain any written
documentation of the spill. United Water staff said that the project manager writes and
submits spill reports to CIWQS, with a copy furnished to the City. The inspection team
viewed the trouble call binder, which contained copies of the spill response forms
submitted to CIWQS, but it contained neither supporting documentation nor other spill
documentation required to be maintained under the Statewide General Waste Discharge
Requirements. Recommendation: To comply with the Statewide General Waste
Discharge Requirements for Sanitary Sewer Systems, the City should fully implement its
SSMP, and establish standard procedures for preparing complete and accurate spill
documentation, beginning with logging initial calls from the public until the final spill
report is submitted to CIWQS. The City should also consider preparing spill response
documentation kits to be maintained in service vehicles, consistent with its SSMP and
Overflow Response Plan. Staff should receive additional training in preparing and
maintaining SSO documentation.
4. Reporting of SSOs. According to the State Water Resources Control Board’s Order No.
2006-0003-DWQ Statewide General Waste Discharge Requirements, the City of Avalon,
was required to commence reporting all SSOs to the State’s CIWQS database on August
17, 2006.
According to the State’s CIWQS database, no spills were reported by Avalon to CIWQS
prior to July 2010. Three spills were reported during 2010. However, the inspection
form filled out by Avalon representatives and submitted to EPA, listed a total of six
public SSOs and one building backup as having occurred during the past five years. All
SSOs are required to be reported under the State’s Order No. 2006-0003-DWQ.
During the interview, City of Avalon representatives told the inspection team that spills
in Avalon’s downtown area flowed via the storm drain system into the storm water low-
flow diversion system at Crescent Ave. near Metropole Ave. and then pumped to the
treatment plant. However, the City staff also said that the diversion system was such that
runoff went directly to the ocean after about an hour of heavy rainfall. Although the City
did state to inspectors that such downtown SSOs were “usually due to pipe failure”, the
number of such spills was not stated, and no such spills have been reported to CIWQS.
All spills from the sewage collection system are required to be reported to CIWQS,
regardless the spill is pumped from the low-flow diversion system to the treatment plant.
Recommendation: The City is required to report all SSOs, including spills that may
occur on private property but are due to blockages in a city-owned pipe, as required by
the State’s Monitoring and Reporting Program No. 2006-0003-DWQ. The City should
provide EPA with an explanation of the reasons any SSOs were not reported to CIWQS.
The City should report all missing spill data to CIWQS, as appropriate.

32
5. SSO Containment and Mitigation. Part D.3. of the State Water Resources Control
Board Order No. 2006-0003-DWQ states that in the event of a spill, the Enrollee shall
take all feasible steps to contain and mitigate the effects of an SSO.
Of the three SSOs reported to CIWQS, the total volume reported is 29,000 gallons. 600
gallons, or 2%, was reported as recovered. United Water has a service truck and also a
trailer available for response to SSOs. The trailer is equipped with bypass pumps, sewer
snake, and jetter. The City of Avalon owns a combination truck, but United Water must
call to request it from the City’s Department of Public Works; city staff operates the
combination truck. According to the City, Public Works does not usually get calls to
respond to spills. Two of the reported spills were reported to have occurred at Pebbly
Beach Pump Station; which carries virtually all of the City’s flow. The first reported
SSO, on August 21, 2010 was caused by corrosion of the control system due to hydrogen
sulfide and saltwater. United Water representatives told inspectors that the pump station
was serviced weekly; however, the stainless steel support in the control panel failed due
to corrosion and the SSO occurred before the panel was repaired. United Water
contracted electricians from the mainland to make the extensive repairs. The second SSO
occurred ten days later and was caused by a pump becoming vapor locked while the
repairs were ongoing. The third SSO occurred at the WWTP following an electrical
“brownout”. When asked whether the pump station was routinely checked out following
electrical problems, United Water representatives stated that “someone should”, but did
not state that this was actually a standard procedure. Recommendation: The City should
fully implement its SSMP, and improve its efforts to contain and mitigate SSOs. Because
of the proximity of the sewage collection system to the Pacific Ocean, the City should
consider developing and implementing spill contingency plans.
6. Sewer System Maintenance. State Water Resources Control Board Order No. 2006-
0003-DWQ requires Enrollees to develop an SSMP, including an Operation and
Maintenance Program and Preventative Maintenance Program. Although the City
indicated on the inspection form that 20% of the system is cleaned annually, the City told
inspectors during the interview that sewer cleaning is not done on a schedule, but that
cleaning is reactive to a problem. United Water staff told inspectors that it was “aware of
several problem spots”, but there is no accelerated cleaning schedule. Avalon owns a
vactor truck and jet rodder, but this equipment is used by the City Public Works staff
primarily for the low-flow diversion system, and not used for cleaning the sewage
collection system. Preventive maintenance is done only at pump stations. There are no
programs established for either grease or root control. The City of Avalon provided
copies of CCTV work done during July 2010, which shows evidence of both heavy root
intrusion and pipes in need of urgent repair in the west side of the city. According to
statements made by the City during the interview, there is no maintenance management
system, no written work orders, no preventive maintenance schedules, and no long-term
capital improvement plan. This appears to conflict with information provided on the
33
inspection form. There is only one hard copy sewer map, which the City told inspectors
was “not accurate”. The inspection team visited the WWTP, and noted that although
some refurbishment had occurred, the decant tank appeared to be in need of urgent repair,
and was not being used. Recommendation: To fully comply with State Water Resources
Control Board Order No. 2006-0003-DWQ , the City should fully implement its SSMP.
The City must have an accurate sewer map. In addition, the City must plan, budget, and
complete appropriate maintenance measures, including preventive maintenance and pipe
repairs, in a timely manner to prevent failure and repeat SSOs. Scheduled preventive
maintenance may also help to reduce costs by reducing costly emergency repairs.
7. Maintenance Management System and Record Keeping. State Water Resources
Control Board Order No. 2006-0003-DWQ requires all Enrollees to maintain records of
all SSO calls, spill records, work orders, and lists of complaints from the public. When
requested by the inspection team, the City had no such documentation available. The
inspection team was also told by the City that Avalon has no digitized sewer system
maps, no computerized maintenance management system, and no automated system for
generating work orders. There is no system for scheduling routine maintenance, tracking
maintenance completed, for facilitating or adjusting the frequency of maintenance, or for
generating work orders following SSOs. Recommendation: The City should implement
its SSMP and adopt a maintenance management system that would more efficiently allow
the City to integrate, track, and record maintenance, spills, inspection history, and
condition assessment of its pipes. In addition, it would provide a system for maintaining
the SSO documentation required by the State’s Order No. 2006-0003-DWQ.
8. Capital Improvement Program and Aging Infrastructure. State Water Resources
Control Board Order No. 2006-0003-DWQ requires all Enrollees to develop an SSMP
which “should include a capital improvement plan that addresses proper management and
protection of the infrastructure assets. The plan shall include a time schedule for
implementing the short- and long-term plans plus a schedule for developing the funds
needed for the capital improvement plan.” Although the City lists several projects on the
inspection form, the City told inspectors that there is no long-term plan currently in place
for capital improvements. During the inspection, the City told inspectors that it had
refurbished the WWTP, but the inspection team observed a decant tank at the WWTP
that had been taken out of service and was clearly in need of repair. The City told
inspectors that the funds for repairing the decant tank is in the budget and the project is
authorized. The City explained to inspectors that the work had not been done because it
doesn’t have confidence that projects had been correctly prioritized. The City said that it
has had the funds budgeted for its capital improvement projects, but has not started work
because it has been awaiting the award of a contract with a consultant to reevaluate and
rank proposed improvements.

34
During the inspection, the City staff said that most of the sewer pipe was installed
approximately 100 years ago. Much of the downtown pipe has been slip-lined, which
may account for the apparent conflict with pipe ages listed by the City on the inspection
form that indicate no pipe older than 50 years. Most of the city’s pipe is clay, although
some is of cast iron. Although the lifespan of clay sewer pipe does vary, the average life
of a clay sewer pipe is often considered to be approximately 70 years. According to the
City staff’s statements during the interview, approximately 80% of the City’s system has
been CCTV inspected, and 50% of that was slip lined approximately 7 to 8 years ago,
mainly in the flat area of the City. Therefore, approximately 4.5 miles of the 11 mile
system has been slip lined, and 6.5 miles of unrehabilitated pipe remains, mainly in the
west side on the slope above downtown. However, the inspection form filled out by the
City says that 6.7 miles of the pipe had been rehabilitated during the past 10 years.
During the inspection, the City told inspectors that it currently makes repairs upon
failure, and rehabilitates its sewer pipes in conjunction with street repairs. Although
approximately half of the system has been slip lined, the City stated that there is currently
no long range program in place to systematically repair, rehabilitate, or replace
components of the sewage collection system before it fails. Recommendation: The City
should fully implement its SSMP and consider instituting a Capital Improvement
Program that includes sufficient funding to refurbish its wastewater infrastructure over
time so as to avoid failure.