Severfield–Rowen Plc Growth buIlT ON success · Severfield—Rowen Plc Annual Report 2010 ......
112
Severfield-Rowen Plc GROWTH BUILT ON SUCCESS ANNUAL REPORT & ACCOUNTS FOR THE YEAR ENDED 31 DECEMBER 2010
Transcript of Severfield–Rowen Plc Growth buIlT ON success · Severfield—Rowen Plc Annual Report 2010 ......

20155-04 27/04/2011 Proof 11 20155-04 27/04/2011 Proof 11
Severfield-Rowen Plc
Severfield–Rowen PlcDalton Airfield Industrial Estate, Dalton, Thirsk, North Yorkshire, YO7 3JN
Tel: (01845) 577896 Fax: (01845) 577411
www.sfrplc.com
Growth buIlT ON success
AnnuAl RePoRt & AccountSfor the year ended 31 december 2010
Severfield–R
owen P
lc an
nu
al r
eport 2010

20155-04 27/04/2011 Proof 11 20155-04 27/04/2011 Proof 11
Severfield—Rowen Plc Annual Report 2010
SEvERFIElD–ROwEN Plc IS ThE lARgEST SPEcIAlIST STRucTuRAl STEElwORK gROuP IN ThE uK, wITh A REPuTATION FOR PERFORmANcE AND vAluE.
GRouP STRENgThS
For more information visit:
www.sfrplc.com
severfield-reeve structures LtdDalton Airfield Industrial EstateDaltonThirskNorth YorkshireYO7 3JNTel: 01845 577 896Fax: 01845 577 411
Fisher engineering LtdballinamallardEnniskillenco FermanaghNorthern IrelandbT94 2FYTel: 02866 388 521Fax: 02866 388 706
rowen structures Ltd17 maisies wayThe villageSouth NormantonDerbyshireDE55 2DSTel: 01773 860 086Fax: 01773 814 077
Atlas ward structures LtdSherburnmaltonNorth YorkshireYO17 8PZTel: 01944 710 421Fax: 01944 710 387
severfield-reeve International LtdPO box 519Abu Dhabiunited Arab EmiratesTel: +971 2 644 2600Fax: +971 2 644 2387
engineering construction training LtdDalton Airfield Industrial EstateDaltonThirskNorth YorkshireYO7 3JNTel: 01845 576 807Fax: 01845 577 942
watson steel structures Ltdlostock lanelostockboltonlancashirebl6 4blTel: 01204 699 999Fax: 01204 694 543
Jsw severfield structures Ltd401 Deluxe courtR v bambardekar RoadStation Roadbandra west mumbaiTel: +91 22 6731 7000Fax: +91 22 2651 2685
steelcraft erection services LtdDalton Airfield Industrial EstateDaltonThirskNorth YorkshireYO7 3JNTel: 01845 577 896Fax: 01845 578 477
JSW SeverfieldStructures
Severfield–ReeveStructures
Atlas WardStructures
Watson SteelStructures
Fisher engineering
Steelcraft erectionServices
engineering construction
training
RowenStructures
Severfield–ReeveInternational
(project office, abu dhabi)
severfield–rowen PlcDalton Airfield Industrial EstateDaltonThirskNorth YorkshireYO7 3JNTel: 01845 577 896Fax: 01845 577 411
oPeRAtIonAl PeRFoRmAnce & cuStomeR SeRvIce
multI-SectoR FlexIbIlIty
eARly PRoJect deSIGn enhAncement, PRoGRAmmInG And coStInG
PRoduct And SeRvIce RAnGe
uk And oveRSeAS mAnuFActuRInG And netWoRk
FActoRy And SIte eFFIcIencIeS
PeoPle And SkIllS
FInAncIAl StRenGth
ScAle And coSt bASe
heAlth, SAFety And SuStAInAbIlIty
www.sfrplc.com
Stratford, London

01OUR BUSINESS 01
20155-04 27/04/2011 Proof 10
Our Business
04 What We Do
06 Our Operations
08 Group at a Glance
10 India Joint Venture
12 Year at a Glance
14 Chairman’s Statement
16 Chief Executive’s Review
20 Financial Review
25 Key Performance Indicators
Our GOvernance
28 Directors and Advisers
30 Executive Committee
32 Corporate Objectives
34 Principal Risks and Uncertainties
36 Directors’ Report
41 Corporate Social Responsibility
45 Corporate Governance
50 Directors’ Remuneration Report
59 Directors’ Responsibilities Statement
GrOup accOunts
62 Independent Auditor’s Report
63 Consolidated Income Statement
64 Consolidated Statement of Comprehensive Income
65 Consolidated Balance Sheet
66 Consolidated Statement of Changes in Equity
67 Consolidated Cash Flow Statement
68 Notes to the Consolidated Financial Statements
99 Five Year Summary
99 Financial Calendar
cOmpany accOunts
102 Independent Auditor’s Report
103 Company Balance Sheet
104 Notes to the Company Financial Statements
Revenue decreased by £82.7m to £266.7m (2009: £349.4m)
Underlying operating margin at 6.1% (2009: 14.8%)
Underlying profit before tax margin at 5.7% (2009: 14.5%)
Underlying profit before tax decreased to £15.3m (2009: £50.8m)
Profit after tax (reflecting non-underlying items) of £7.6m (2009: £31.3m)
Basic earnings per share of 8.58p (2009: 35.34p)
Recommended final dividend per share of 2.5p giving total dividend of 7.5p (2009: 15.00p)
Year end net debt of £15.0m (2009: £11.5m net cash)
UK order book value of £226m at 22 March 2011
JSSL (India) order book value of £33m at 22 March 2011
cOntents
Financial HiGHliGHts
revenue
£266.7m
06 07 08 09 10
underlying* profit Before tax
£15.3m
06 07 08 09 10
underlying* Operating margin
6.1%
06 07 08 09 10
retained profit Before tax
£7.6m
06 07 08 09 10
Dividend per share
7.50p
06 07 08 09 10
underlying* Basic earnings per share
12.50p
06 07 08 09 10
* Underlying is before:• the amortisation of acquired intangible assets — £2.7m (2009: £4.4m)• share of pre-operating losses of Indian joint venture — £1.4m (2009: £1.0m, re-classified
for consistency) • impairment in valuation of investment property — £2.1m (2009: nil)
• movements in the valuation of derivative financial instruments — nil (2009: gain £3.4m)• release of provisions no longer required — £2.0m gain (2009: nil)• the associated tax impact of the above and the effect of future corporation tax rate reductions — £0.7m
gain (2009: £1.6m).

02 severfield—rowen plc Annual Report 2010
20155-04 27/04/2011 Proof 10
Our Business cOntents
04 What We Do
06 Our Operations
08 Group at a Glance
10 India Joint Venture
12 Year at a Glance
14 Chairman’s Statement
16 Chief Executive’s Review
20 Financial Review
25 Key Performance Indicators

03OUR BUSINESS 03
20155-04 27/04/2011 Proof 10
cOmmercial OFFices sectOr
pROjEct Heron Tower
lOcatION London
pROjEct Cannon Place
lOcatION London
pROjEct Ropemaker Place
lOcatION London
pROjEct 30 Crown Place
lOcatION London
pROjEct The Shard lOcatION London Bridge
04 severfield—rowen plc Annual Report 2010
20155-04 27/04/2011 Proof 10
sustainaBility
susta
ina
Bility
sustainaBility
sust
ain
aB
ilit
y
sustainaBility
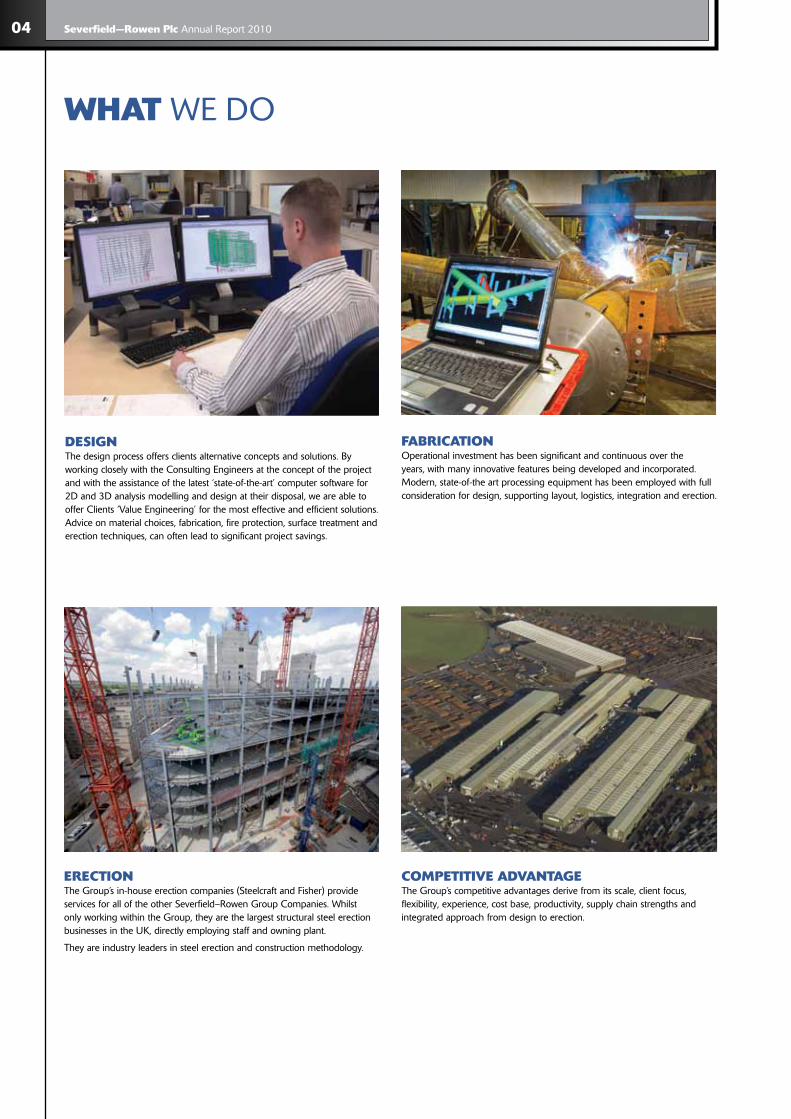
WHat WE DO
cOmpetitive aDvantaGe The Group’s competitive advantages derive from its scale, client focus, flexibility, experience, cost base, productivity, supply chain strengths and integrated approach from design to erection.
erectiOn The Group’s in-house erection companies (Steelcraft and Fisher) provide services for all of the other Severfield–Rowen Group Companies. Whilst only working within the Group, they are the largest structural steel erection businesses in the UK, directly employing staff and owning plant.
They are industry leaders in steel erection and construction methodology.
FaBricatiOn Operational investment has been significant and continuous over the years, with many innovative features being developed and incorporated. Modern, state-of-the art processing equipment has been employed with full consideration for design, supporting layout, logistics, integration and erection.
DesiGn The design process offers clients alternative concepts and solutions. By working closely with the Consulting Engineers at the concept of the project and with the assistance of the latest ‘state-of-the-art’ computer software for 2D and 3D analysis modelling and design at their disposal, we are able to offer Clients ‘Value Engineering’ for the most effective and efficient solutions. Advice on material choices, fabrication, fire protection, surface treatment and erection techniques, can often lead to significant project savings.

05OUR BUSINESS 05
20155-04 27/04/2011 Proof 10
HealtH & saFety Q
ua
lity
inn
OvatiO
n
cO
mp
etit
ive
aD
va
nta
Ge
scale
sustainaBility
susta
ina
Bility
sustainaBility
sust
ain
aB
ilit
y
sustainaBility
The Group proactively seeks to continue its industry leading position in the areas of health, safety and sustainability. The Group’s “Steel Futures” strategy promotes Sustainable Future, Safe Future and Zero Carbon Future.
1
DesiGn
FaBricatiOnerectiOn
eFFective cOntract manaGement

06 severfield—rowen plc Annual Report 2010
20155-04 27/04/2011 Proof 10
staDiums &leisure
The Group has an unrivalled record in the design, engineering and building of many of the UK’s best known stadiums and has provided timely and cost-effective solutions for long spanning, architecturally innovative structures. Group successes include Arsenal’s Emirates Stadium, Wimbledon Centre Court, Wales Millennium Centre and Riverside Museum, Glasgow.
Our OPERATIONS
market SECTORS
The Group’s state-of-the-art facilities provide clients with unrivalled services and value in the execution of their projects.
pOWer & enerGy
Power Stations in the UK, Ireland and overseas have always been an important element for the Group where its capability to deal with special construction and engineering requirements leads to its unrivalled success in this sector. Our experience and professionalism in delivering such projects enables the Group to continue in its pivotal role in supply to this growing sector.
eDucatiOn
Group companies have extensive experience in the provision of structural steelwork for the education sector. The Company has undertaken numerous school and further education projects. Leeds Metropolitan University was awarded a commendation for its structural steel design.
HealtH
Many hospitals are specified with structural steel frames. Span length, enhanced flexibility, adaptability and speed of construction are key factors conferring advantages to the Group in this sector. Example illustrated is Victoria Hospital in Kirkcaldy.

07OUR BUSINESS 07
20155-04 27/04/2011 Proof 10
cOmmercialOFFices
Performance benefits from Fabsec and Firebeam, together with other initiatives, have underpinned the Group’s success in this sector. Example illustrated is Watermark Place, London.
city centre& retail
Project management and supply chain linkage are vital aspects in the provision of successful execution in these challenging city centre and out of town projects. Example illustrated is Bristol Broadmead Shopping Centre.
transpOrt, BriDGes& car parks
The Group has a strong reputation for successful delivery of major transportation related projects both in the UK and overseas, including airports, and has extensive experience for all types of bridgework. Group successes include Heathrow’s Terminal 5, Gatwick Pier 6 passenger bridge, the multi award winning Gateshead Millennium Bridge, Midland Mainline bridge and Stratford City Footbridge.
DistriButiOn & inDustrial
The Group’s competitive strengths, including design capability, supply chain co-ordination and fabrication/erection speeds are key to their success in this sector. Group contracts include projects for Tesco, Asda and Morrisons. The project illustrated is located at Stoke-on-Trent.

08 severfield—rowen plc Annual Report 2010
20155-04 27/04/2011 Proof 10
GrOup AT A GLANCEThe combined resources of our Group of Companies have the design, engineering skills and experience to handle complex projects over a diverse range of market sectors. We can facilitate the production of a wide range of steelwork packages, including projects requiring high added value engineering content to basic structural work.
fIShERENgINEERINg
SEvERfIEld-REEvEStRUctURES
SEvERfIEld-REEvE INtERNatIONal
(abu dhabi project Office)
jSW SEvERfIEldStRUctURES
WatSON StEElStRUctURES
atlaS WaRdStRUctURES
severFielD-reeve structures ltDLocated at Dalton in North Yorkshire, this is the largest of the operating Companies and is the hub of much of the Group’s activity. On its 55 acre site it has 10 production lines where the manufacturing process is undertaken in a controlled environment.
Queen Elizabeth Hospital, Birmingham
WatsOn steel structures ltDThis world famous business, founded in 1933, is one of the larger UK structural steelwork companies in its own right. It is internationally respected, with a reputation for having specialist skills in relation to the design and engineering of high added value steelwork.
Wimbledon Centre Court Roof, London
ENgINEERINg cONStRUctION
tRaININg
StEElcRaft EREctION SERvIcES
ROWENStRUctURES

09OUR BUSINESS 09
20155-04 27/04/2011 Proof 10
FisHer enGineerinG ltDLocated in Northern Ireland, Fisher Engineering Ltd is recognised to be one of Europe’s leading constructional steel fabricators. The Company has a highly skilled workforce and is equipped with the latest state-of-the-art manufacturing processes.
National Conference Centre, Dublin
atlas WarD structures ltDLocated in Sherburn, Nr Scarborough, North Yorkshire, Atlas Ward is the leading Design and Build Steelwork Contractor for Distribution Warehouses in the UK. Atlas Ward designs, fabricates and erects structural steelwork principally for the warehouse sector and has a business, skill base and client profile which is complementary to the rest of the Group.
3 Individual Distribution Centres, Prologis Park, Wellingborough
jsW severFielD structures ltDLocated adjacent to JSW Steel’s Plant at Vidyanagar, in the District of Bellary, Karnataka, India, the plant consists of 2 fabrication lines and a plate line. Plant investment has been significant, with many of Severfield–Rowen’s innovative features being incorporated into the Joint Venture. The Company is involved in the design, fabrication and erection of structural steelwork to principally service the Indian markets.
JSW CTL Building, Bellary, India

10 severfield—rowen plc Annual Report 2010
20155-04 27/04/2011 Proof 10
inDia JOINT VENTURE
Severfield–Rowen’s new joint venture and operations in India are of significant importance in achieving our strategic growth ambitions.
In November 2010 JSW Severfield Structures Limited formally opened its new plant in Vidyanagar, Bellary, Karnataka. This was a milestone in the Company’s history, being the first manufacturing unit outside of the UK.
JSSL (JSW/SFR) provides a new service in India, incorporating the benefits and efficiencies of the Group’s experience, in terms of design, manufacture and erection.
The plant’s location is shown below and it currently utilises 26,000 m² of workspace and 52,000 m² of logistics and storage area.
The Indian market is growing at some 8-10% per annum and is enjoying considerable infrastructure/construction spends. Steel is already used significantly in the power and infrastructure sectors.
The use of steel in construction is anticipated to become more widespread in the coming years as its overall value benefits are realised.
inDia
neW plantIn Vidyanagar, Bellary, KarnatakaThe plant has been designed to optimise product range, quality and productivity, as befitting the demands of the construction industry in India.
Incorporating state-of-the-art technology and processing equipment, the plant is managed and operated by high quality, experienced and dedicated people.
Bespoke plated products and are manufactured on site at Bellary, offering clients a range of benefits.
key service OFFerinGs
Design guidance
Quality products
Efficient erection programmes
Customer solutions

11OUR BUSINESS 11
20155-04 27/04/2011 Proof 10
First prOjectsSome of the first projects engaged by JSW Severfield Structures Ltd demonstrate the value and speed benefits of our new service offering in India.
OvervieW
inDustrial
cOmmercial
pOWer & enerGy
●● 35,000 tonnes capacity
●● 2 Fabrication lines
●● 1 line
●● 270 employees
●● 2nd JV for floor metal decking line in Bellary
Greensol, Hospital
JSW CTL Building, Bellary
Prestige, Bangalore

12 severfield—rowen plc Annual Report 2010
20155-04 27/04/2011 Proof 10
year AT A GLANCE
Despite difficult trading conditions during 2010, the Group illustrates some of its significant highlights through the year.
Quarter 1 Quarter 2
JAN FEB MAR APR MAY JUN
jaNUaRyaward of titanic signature Building, Belfast contractThe Titanic Signature Building is iconic in design and is located in the Titanic Quarter of East Belfast. The building, housing a world class visitor attraction will be the subject of Belfast’s shipbuilding and maritime heritage and will become Northern Ireland’s largest built attraction.
fEBRUaRycompletion of 2012 Olympic stadiumFollowing 72 weeks on site, February saw the completion of 10,800 tonnes (20,000 pieces) of constructed steelwork for the 2012 Olympic Stadium.
MaRchcredit FacilityThe Group agreed a new £40m revolving credit facility with RBS and Yorkshire Bank, a member of the National Australia Bank.
apRIlcompletion of staythorpe power stationErection of approximately 5,000 tonnes of structural steelwork was completed for Staythorpe Power Station, following an extensive 16 month programme.
Mayaward of Heathrow terminal 2 contractThe Group was awarded the contract for Heathrow’s new Terminal 2, which will consist of approximately 25,000 tonnes of fabricated steelwork.
jUNEinvestor Open Day, london The Company organised an Open Day for its investors which included tours of Heron Tower and Westfield Stratford Shopping Centre.

13OUR BUSINESS 13
20155-04 27/04/2011 Proof 10
Quarter 3 Quarter 4
JUL AUg SEP oCT NoV dEC
jUlyThe Group received Structural Steel Design Awards for Dublin Airport’s Terminal 2 and the world’s largest Audi Centre in West London, plus a Certificate of Merit for the Riverside Museum in Glasgow.
aUgUStstart of construction of temporary stand at 2012 Olympic stadiumConstruction of the temporary tier, housing 55,000 seats commenced this month, which will give the stadium a capacity of 80,000 for the Games.
SEptEMBERaward of morrisons regional Distribution centre, BridgwaterAtlas Ward was awarded this contract which consists of 2,500 tonnes of structural steelwork.
OctOBER completion of the vestas Blade technology centre on isle of WightSteelcraft Erection Services, the Group’s in-house construction company, completed this project, which covers 20,000 sqm and utilises 2,250 tonnes of structural steelwork.
NOvEMBERjsW severfield structures ltd Opening ceremonyTwo years after signing the agreement with its partner JSW Steel, 17 November saw the official opening ceremony of the fully commissioned plant.
dEcEMBERaward of amazon regional Distribution centre, DunfermlineAtlas Ward was awarded Amazon’s new regional distribution centre. The project will consist of approximately 3,400 tonnes of structural steelwork.

14 severfield—rowen plc Annual Report 2010
20155-04 27/04/2011 Proof 10
cHairman’s STATEMENTtOBy HayWarD, CHAIRMAN
In 2010 the Company produced lower but
creditable profits in an extremely harsh business
environment for the structural steel sector in the UK. The Company continues to extend its leading position in the market, reflected by its
financial performance and market share gains.
OvervieW
In 2010 the Company produced lower but creditable profits in an extremely harsh business environment for the structural steel sector in the UK. The Company continues to extend its leading position in the market, reflected by its financial performance and market share gains.
The Company anticipates that trading conditions will only improve marginally towards the end of 2011, before a richer vein of project opportunities materialises in 2012.
results
The Group made an underlying operating profit of £16.2 million (2009: £51.8 million) on revenue of £266.7 million (2009: £349.4 million). Group profit after tax is £7.6 million (2009: £31.3 million), with basic earnings per share of 8.58p (2009: 35.34p), both reflecting the impact of non-underlying items.
DiviDenD
The Company, while optimistic for 2012 and beyond, feels that trading in the UK market in 2011 will remain very tough. In remaining prudent against this outlook, it will recommend a final dividend payment of 2.50p, giving 7.50p for the full year (2009: 15.00p).
BOarD cHanGes
The Board is pleased to announce that Derek Randall, currently Executive Director with responsibility for Business Development and International, including JSW Severfield Structures Ltd in India, joined the Company’s main Board in February 2011.
The Company is also pleased to welcome John Dodds to its Plc Board as a non-executive director in October 2010. John retired from Kier Group last year, after working for the company for 40 years. John became CEO of Kier Group in 2003
and, with his wealth of experience in the construction industry, will be a valuable asset to our Board.
peOple
Our employees continue to be our key competitive advantage, with their experience and commitment contributing to our relative success and development.
OutlOOk
2011 will be a tough trading year. The macro-economic situation in the UK has been and remains difficult to interpret and predict. Clearer consensus is emerging that recovery will be apparent in GDP growth in 2012. Privately led investment in a few key sectors will provide improved prospects for us in 2012. The Company expects that the remainder of 2011 will be notable for the absence of large, major project starts with an improvement being seen in our pipeline for 2012.
In our overseas target markets, we are demonstrating that our experience, methods and capability can be transferred successfully as we attempt to offset the impact of tough trading conditions in the UK. Progress in India is extremely good where exciting prospects are in the pipeline and growth potential is strong.

15OUR BUSINESS 15
20155-04 27/04/2011 Proof 10
tHe pOrtFOliO
pROjEct 2012 olympic Stadium lOcatION Stratford, London

16 severfield—rowen plc Annual Report 2010
20155-04 27/04/2011 Proof 10
cHieF executive’s REVIEWtOm HauGHey, CHIEF ExECUTIVE OFFICER
In 2010 Severfield–Rowen traded through
some of the most difficult conditions seen by the
UK industry in the last few decades.
In 2010 Severfield–Rowen traded through some of the most difficult conditions seen by the UK industry in the last few decades.
It faces the challenges of 2011 in a determined but pragmatic manner and is now more optimistic of a partial recovery in demand during 2012.
Business
The companies within the Group have displayed their individual strengths which have collectively enabled the Group to trade profitably and competitively in the last 12 months. Features such as close commercial interaction, design capability, cost base, volume outputs, experience and co-ordinated steel erection, together with product range have been key in growing market share in such difficult circumstances.
Internationally, the Company is successfully establishing long-term positions in India and the Middle East.
OrDer BOOk
The order book for the UK based operations (as at 22 March 2011) stood at a healthy £226m, as it continues to secure business from all of the sectors making up UK demand.
The pipeline of enquiries is more encouraging than six months ago, however a large proportion of the work will be for commencement in 2012.
cOsts
The Company specifically targeted cost reductions across all businesses at the end of 2009. These improvements have provided for our resultant competitiveness throughout 2010. Further cost reduction initiatives remain under review and development, including a procurement related initiative.
prices anD marGins
Market prices bottomed in the first half of 2010 and, while remaining relatively low, have moved in line with the steel material developments of the international market.
Margins have remained subdued with little improvement in the supply/demand balance of the UK market.
inDia
In November 2010, the joint venture (JSSL) manufacturing facilities at Bellary were officially opened and attended by approximately 200 guests from the Indian construction industry.
The business is now designing, drawing, fabricating and erecting quality structural steelwork for the growing Indian market.
Four months after the opening, the order book (as at 22 March 2011) stands at £33m, demonstrating the value of the new service on offer to clients in India.
These developments underpin the Company’s confidence that it can realise its financial and growth ambitions in India.
prOjects
A significant number of major projects have been completed or undertaken during the past 12 months, including:
●● 2012 Olympic Stadium
●● 2012 Olympic Media Centre
●● 2012 Olympic Handball Arena
●● 2012 Olympic Basketball Arena
●● 2012 Velodrome
●● ArcelorMittal Orbit
●● Heathrow Terminal 3
●● Sirius Academy, Hull
●● Co-op, Glasgow
●● Mann Island Development, Liverpool
●● Baker Street Commercial Office, London

17OUR BUSINESS 17
20155-04 27/04/2011 Proof 10
●● Chivas Bros Warehouses, Mulben
●● Thameslink Viaduct Borough Market, London
●● Saica Paper Mill Development, Partington
●● Winifred & Holtby School Development, Hull
●● Melior College Development, Scunthorpe
●● The Shard of Glass Commercial Office, London
●● Vestas Manufacturing Facility, Isle of Wight
●● National Indoor Sports Arena & Velodrome, Glasgow
●● Blackfriars Bridge & Thameslink Station, London
●● Heathrow Terminal 2A
●● Portlaiose Retail Development, Ireland
●● Titanic Quarter Development, Belfast
●● Brighton FC Stadium
●● Co-op, Andover
●● Sackville Street Commercial Office, London
●● Bombardier Aerospace Development, Belfast
●● Gatwick North Terminal
●● Cannon Place Commercial Office, London
●● Medical Research Council, LMB, Cambridge
●● Bankside Residential Building, London
Business investment
UK investment was at reduced levels compared to recent years but included state-of-the-art milling capability at Watson’s (for high tolerance steelwork) which is being used on the ArcelorMittal Orbit structure at the 2012 Olympic site.
tHe pOrtFOliO
pROjEct Heathrow Terminal 2A lOcatION London

18 severfield—rowen plc Annual Report 2010
20155-04 27/04/2011 Proof 10
cHieF executive’s REVIEW continued cOrpOrate sOcial respOnsiBility
The Company is proactively seeking to take a leadership position in the areas of health, safety and sustainability and is implementing a strategy of continuous improvement in these key areas of our business.
There are three branded strands to our “Steel Futures” strategy:
SUSTAINABLE FUTURE
●● Community and stakeholder engagement
●● Leadership and people development
●● Cost reconciliation and profitable growth
●● Market leading innovation
●● Performance management and development
●● Supply chain partnering
SAFE FUTURE
●● Safety leadership
●● Behavioural Safety
●● Safety ‘Golden Rules’
●● Health and wellbeing
●● Safety in design
●● Communications
ZERo CARBoN FUTURE
●● Carbon management and reduction
●● Transport policy and strategy
●● Waste and recycling
●● Renewable energy
●● Responsible sourcing of materials
●● Water management
A challenging plan supporting this vision has been implemented and we look forward to reporting good progress in 2011.
risk manaGement
The Company has a proactive and formal approach to Risk Management. During the year, another comprehensive review of its risk profile and risk management process was undertaken in conjunction with Willis. The emphasis changed from previous reviews to reflect the more challenging environment within which it is now operating and the greater international dimension to its business. A more complete review of the principal risks which the business faces is set out on pages 34 to 35.
summary
The Company remains pleased with its relative performance in the very challenging UK market place. The UK based operations have shown their strengths and competitiveness to produce an overall successful performance in the last 12 months. We commence this year with a good order book, but recognise that UK demand in 2011 remains weak.
In India, we now have a very strong order book and will continue our drive for growth in those markets.
We see a partial improvement in UK demand and mix emerging in 2012, which, while not a comprehensive recovery, will present the Company with good opportunities.

19OUR BUSINESS 19
20155-04 27/04/2011 Proof 10
tHe pOrtFOliO
pROjEct West Burton Power Station lOcatION Retford

20 severfield—rowen plc Annual Report 2010
20155-04 27/04/2011 Proof 10
Financial REVIEWalan DunsmOre, FINANCE DIRECTOR
The Group’s results for 2010 reflect the impact
of the continuing difficult trading conditions in the
UK market. Capacity was reduced by 20% at the
end of 2009 and the Group was able to operate
at this new capacity throughout the year,
increase its market share and maintain a relatively
strong order book in these difficult conditions.
OvervieW
The Group’s results for 2010 reflect the impact of the continuing difficult trading conditions in the UK market. Capacity was reduced by 20% at the end of 2009 and the Group was able to operate at this new capacity throughout the year, increase its market share and maintain a relatively strong order book in these difficult conditions.
During the year, the Company’s Indian joint venture business commenced trading on schedule and good progress is being made as this business moves towards its initial full operating capacity.
revenue anD OperatinG prOFit
Revenue fell by 24% to £266.7m (2009: £349.4m). This reflects the reduction in production capacity and lower contract pricing compared with the previous year. Pricing reached its nadir in the first half of the year but a combination of increasing steel prices and continuing capacity reductions by our competitors led to more stable pricing towards the year end, although still at very tight margins.
The operating profit before non-underlying items of £16.2m was 69% down on the previous year (2009: £51.8m). Operating profit margins reduced from 14.8% to 6.1% in the year, reflecting the reduced capacity and lower margins highlighted above, although the worst pricing impacts were, to some extent, compensated by the successful conclusion of more profitable contracts which commenced in the previous years.
sHare OF lOsses OF assOciate cOmpanies
Operating profit includes the Group’s 50% share of the results of its Indian joint venture. There is both an underlying and a non-underlying element to these results. The underlying loss of £0.4m (2009: nil) represents the initial losses after the commencement of commercial production towards the end of 2010. The non-underlying loss of £1.4m (2009: £1.0m) represents the Group’s share of the joint venture’s pre-operating costs throughout the year. The Group’s share of losses from the joint venture for 2009, which also related to pre-operating costs, have been re-classified as non-underlying for consistency.
Finance cOsts
Net finance costs for the Group amounted to £0.9m (2009: £1.0m). The reduction reflects a lower level of average net debt levels throughout the year, compared with the previous year.
2010 2009 £000 £000
Revenue 266.7 349.4Operating profit before non-underlying items 16.2 51.8Profit before tax and non-underlying items 15.3 50.8Profit before tax 11.1 44.1Profit after tax 7.6 31.3Year end (debt)/cash (15.0) 11.5

21OUR BUSINESS 21
20155-04 27/04/2011 Proof 10
tHe pOrtFOliO
pROjEct Cannon Place lOcatION London
nOn-unDerlyinG items
Non-underlying items reduced the profit before tax for the year by £4.2m (2009: £6.7m) and include the following:
●● Amortisation of acquired intangibles — £2.7m (2009: £4.4m).
●● Share of pre-operating losses of Indian joint venture — £1.4m (2009: £1.0m).
●● Impairment in valuation of Investment Property — £2.1m (2009: nil). The Group has an investment property, purchased in 2007, which was previously held at its fair value of £6.1m. The Directors have reviewed both the resale and rental prospects for this property in light of the continuing market weakness for commercial property and have concluded that its fair value is £4.0m. Consequently, an impairment charge of £2.1m has been taken in the year.
●● Movements in the valuation of derivative financial instruments — nil (2009: gain £3.4m).
●● Release of provisions no longer required — £2.0m gain (2009: nil). During the year, good progress was made in reducing the Group’s exposure to potential liabilities under legal claims. Consequently, the Directors’ best estimate of known legal claims in process has reduced from £2.6m to £0.6m.

22 severfield—rowen plc Annual Report 2010
20155-04 27/04/2011 Proof 10
taxatiOn
The underlying tax charge of £4.2m represents an effective rate of 26.6% (on applicable profit which excludes results of associates) compared with 28.3% in the previous year. This was aided by the satisfactory conclusion of some outstanding matters relating to previous years.
The total tax charge for the year was £3.5m which represents an effective tax rate of 27.0%. The impairment of the investment property does not attract tax relief and the negative impact of this is partially offset by the deferred tax benefit from the reduction of the UK corporation tax rate to 27.0%. As the impact of both of these points is non-underlying, it is reflected in Other Items.
earninGs per sHare
Underlying basic earnings per share was at 12.50p, a decrease of 70% over the previous year. This calculation is based on the underlying profit after tax of £11.1m and 88,973,821 shares, being the weighted average number of shares in issue during the year.
Basic earnings per share, based on profit after tax after non-underlying items is 8.58p (2009: 35.34p).
For 2010, there is no difference between basic and diluted earnings per share (2009: underlying 40.91p, total 35.16p).
DiviDenD
The Board recommends a final dividend of 2.50p payable on 16 June 2011 to shareholders on the register at the close of business on 20 May 2011. This will give a total dividend for the year of 7.50p.
Balance sHeet
Shareholders’ funds decreased slightly during the year from £132.5m to £130.9m. This equates to a total equity value per share at 31 December 2010 of 146.7p, compared with 149.5p at the end of 2009. This decrease reflects the dividend paid during the year being higher than the profit after tax.
Goodwill on the Balance Sheet is valued at £54.7m (2009: £54.7m) and is subject to an annual impairment review under IFRS 3. No impairment existed at either 31 December 2010 or 2009.
Other intangible assets on the Balance Sheet are valued at £20.5m (2009: £23.2m) and represent the net book value of the intangible assets identified on the acquisition of Fisher Engineering in 2007. Each class of asset identified is being amortised on a straight line basis over varying periods. The amortisation charged in the year was £2.7m (2009: £4.4m), giving a total amortised at the year-end of £18.5m (2009: £15.8m).
The Group now has property, plant and equipment and investment property totalling £86.9m (2009: £91.0m). Depreciation charged in the year amounted to £4.5m (2009: £5.2m) and the investment property was impaired by £2.1m (2009: nil). Capital expenditure in the year was £3.0m (2009: £4.8m). This included some replacement of older equipment across the Group and also some safety equipment for protection of site workers on high-rise buildings.
During the year the Group invested £2.9m (2009: £2.4m) as equity into the joint venture company in India.
The Group’s capital expenditure in 2011 in the UK is not expected to be more than £3m.
Unlike the rest of the Group, Atlas Ward has a defined benefit pension scheme which, although closed to new members, had an IAS 19 deficit of £8.4m as at 31 December 2009. At 31 December 2010, the deficit increased to £8.5m and is shown as a liability in the Group Balance Sheet. The increase in the deficit is as a result of the changes in the assumptions made, including a reduction in corporate bond yields and an increase in mortality rates, offset by slightly lower inflation expectations.
casH FlOW
There was an expected outflow of cash during the year to leave year end net debt at £15.0m (2009: net cash £11.5m). This movement reflects an outflow from operating activities of £11.2m, and also includes dividends of £8.9m and investment in capital expenditure and the Indian joint venture of £3.0m and £2.9m, respectively. The outflow from operating activities reflects the reversal of the particularly favourable contract working capital position at 31 December 2009, but also reflects the impact of higher steel prices on working capital and an overall extension
of customer payment cycles as weak market conditions persist. Management continues to monitor customer credit risk very closely and credit insurance remains a key factor in mitigating this risk. The outflow also includes corporation tax payments of £5.4m.
The Group continues to operate within the parameters of its £40m revolving credit facility, renewed during the year, with RBS and Yorkshire Bank, a member of National Australia Bank Group.
treasury
Group treasury activities are managed and controlled centrally. Risks to assets and potential liabilities to customers, employees and the public continue to be insured. The Group maintains its low risk financial management policy by insuring all significant trade debtors.
The treasury function seeks to reduce the Group’s exposure to any interest rate, foreign exchange and other financial risks, to ensure that adequate, secure and cost effective funding arrangements are maintained to finance current and planned future activities and to invest cash assets safely and profitably.
The Group continues to have some exposure to exchange rate fluctuations, currently between Sterling, the Euro and the US Dollar. In order to maintain the projected level of profit budgeted on contracts foreign exchange contracts are taken out to convert into Sterling at the expected date of receipt.
GOinG cOncern
In determining whether the Group’s annual consolidated financial statements can be prepared on a going concern basis, the Directors considered all factors likely to affect its future development, performance and its financial position, including cash flows, liquidity position and borrowing facilities and the risks and uncertainties relating to its business activities. The key areas of uncertainty considered by the Directors were as follows:
●● The UK order book, which currently stands at £226m, the pipeline of potential orders, including the relative attractiveness of the market sectors which are feeding that pipeline, and the anticipated conversion of this pipeline.
Financial REVIEW continued

23OUR BUSINESS 23
20155-04 27/04/2011 Proof 10
●● The implications of the continuing challenging economic environment on the Group’s revenues and profits. The Group undertakes forecasts and projections of trading and cash flows on a regular basis. Whilst this is essential for targeting performance and identifying areas of focus for management to improve performance and mitigate the possible adverse impact of a deteriorating economic outlook, they also provide projections of working capital requirements.
●● The impact of the very competitive environment within which the Group operates, including pressures on margins and counterparty risks. This included an assessment of the current stage of the economic cycle of the construction industry, the prospects for any recovery in the short to medium term, and the potential development of the competitive environment.
●● The impact on our business of key suppliers being unable to meet their obligations to the Group including the ability of the Group to find alternative suppliers who could also enable the business to continue trading satisfactorily.
●● The potential mitigating actions that could be taken in the event that revenues are worse than expected, to ensure that operating profit and cash flows are protected.
●● The committed finance facilities to the Group, including both the level of the facilities and the banking covenants attached to them. The Group has access to a £40m revolving credit facility to meet day to day working capital requirements, which is available until March 2013. This facility provides the Group with sufficient headroom both on the facility itself and on the bank covenants in place. This position is forecast to continue for the foreseeable future.
tHe pOrtFOliO
pROjEct The Shard lOcatION London Bridge

24 severfield—rowen plc Annual Report 2010
20155-04 27/04/2011 Proof 10
Having considered all the factors impacting the Group’s business, including downside sensitivities, the Directors are satisfied that the Group will be able to operate within the terms and conditions of the Group financing facilities for the foreseeable future.
The Directors have a reasonable expectation that the Company and the Group have adequate resources to continue in operational existence for the foreseeable future. Accordingly, they continue to adopt the going concern basis in preparing the 2010 Annual Report.
summary
The Group continues to perform profitably and in line with expectations despite the existing poor market conditions. In 2010, overall margins were under sustained pressure but remained positive. While overall net debt has increased during the year, it remains at levels with which management is comfortable. All aspects of the business will continue to be managed tightly in order that it emerges stronger and fitter when growth in its key sectors is anticipated to return in 2012.
cautiOnary statementThe Chairman’s Statement, Chief Executive’s Review and Financial Review on pages 14 to 24 have been prepared solely to provide additional information to shareholders to assess the Company’s strategies and the potential for those strategies to succeed. They should not be relied on by any other party or for any other purpose.
They contain certain forward-looking statements which are made by the Directors in good faith based on the information available to them up to the time of their approval of this report and such statements should be treated with caution due to the inherent uncertainties, including both economic and business risk factors, underlying any such forward-looking information.
Financial REVIEW continued
tHe pOrtFOliO
pROjEct Bankside lOcatION London
25OUR BUSINESS 25
20155-04 27/04/2011 Proof 10
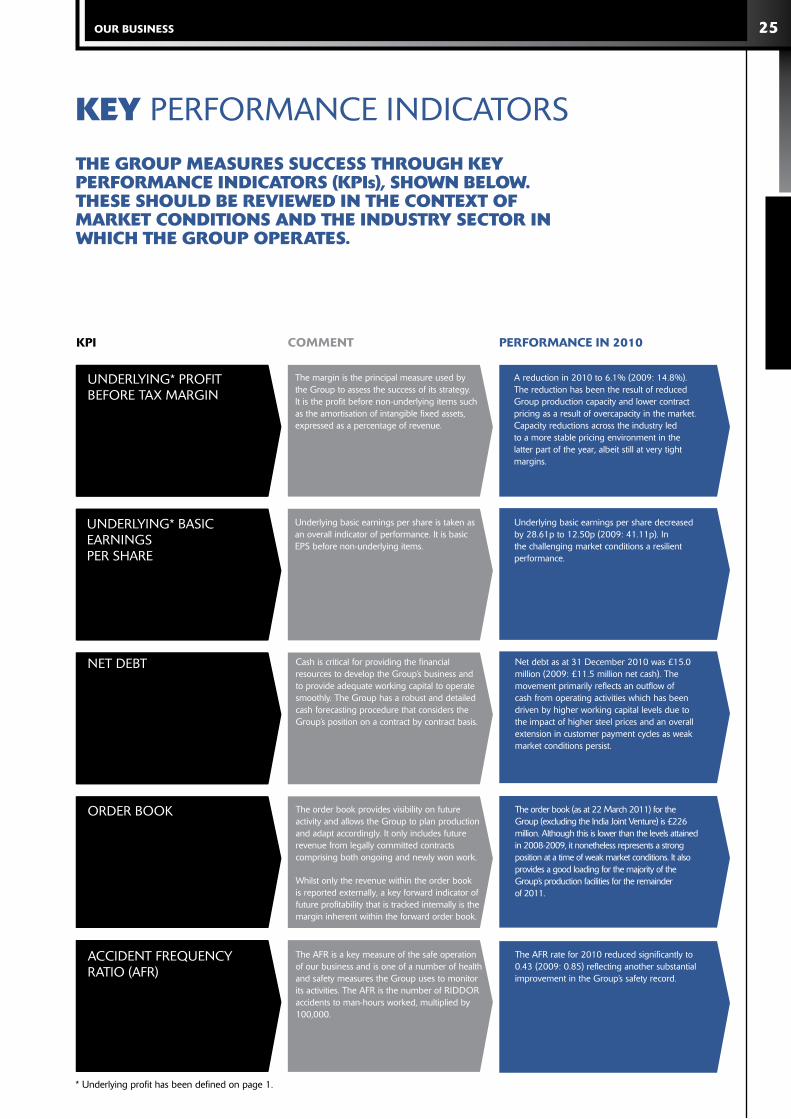
key PERFORMANCE INDICATORS tHe GrOup measures success tHrOuGH key perFOrmance inDicatOrs (kpis), sHOWn BelOW. tHese sHOulD Be revieWeD in tHe cOntext OF market cOnDitiOns anD tHe inDustry sectOr in WHicH tHe GrOup Operates.
UNDERLYING* PROFIT BEFORE TAx MARGIN
The margin is the principal measure used by the Group to assess the success of its strategy. It is the profit before non-underlying items such as the amortisation of intangible fixed assets, expressed as a percentage of revenue.
A reduction in 2010 to 6.1% (2009: 14.8%). The reduction has been the result of reduced Group production capacity and lower contract pricing as a result of overcapacity in the market. Capacity reductions across the industry led to a more stable pricing environment in the latter part of the year, albeit still at very tight margins.
UNDERLYING* BASIC EARNINGS PER SHARE
Underlying basic earnings per share is taken as an overall indicator of performance. It is basic EPS before non-underlying items.
Underlying basic earnings per share decreased by 28.61p to 12.50p (2009: 41.11p). In the challenging market conditions a resilient performance.
NET DEBT Cash is critical for providing the financial resources to develop the Group’s business and to provide adequate working capital to operate smoothly. The Group has a robust and detailed cash forecasting procedure that considers the Group’s position on a contract by contract basis.
Net debt as at 31 December 2010 was £15.0 million (2009: £11.5 million net cash). The movement primarily reflects an outflow of cash from operating activities which has been driven by higher working capital levels due to the impact of higher steel prices and an overall extension in customer payment cycles as weak market conditions persist.
ORDER BOOK The order book provides visibility on future activity and allows the Group to plan production and adapt accordingly. It only includes future revenue from legally committed contracts comprising both ongoing and newly won work.
Whilst only the revenue within the order book is reported externally, a key forward indicator of future profitability that is tracked internally is the margin inherent within the forward order book.
The order book (as at 22 March 2011) for the Group (excluding the India Joint Venture) is £226 million. Although this is lower than the levels attained in 2008-2009, it nonetheless represents a strong position at a time of weak market conditions. It also provides a good loading for the majority of the Group’s production facilities for the remainder of 2011.
ACCIDENT FREQUENCY RATIO (AFR)
The AFR is a key measure of the safe operation of our business and is one of a number of health and safety measures the Group uses to monitor its activities. The AFR is the number of RIDDOR accidents to man-hours worked, multiplied by 100,000.
The AFR rate for 2010 reduced significantly to 0.43 (2009: 0.85) reflecting another substantial improvement in the Group’s safety record.
KpI cOMMENt pERfORMaNcE IN 2010
* Underlying profit has been defined on page 1.

26 severfield—rowen plc Annual Report 2010
20155-04 27/04/2011 Proof 10
Our GOvernance cOntents
28 Directors and Advisers
30 Executive Committee
32 Corporate Objectives
34 Principal Risks and Uncertainties
36 Directors’ Report
41 Corporate Social Responsibility
45 Corporate Governance
50 Directors’ Remuneration Report
59 Directors’ Responsibilities Statement

27 27
20155-04 27/04/2011 Proof 10
OUR gOvERNaNcE
pOWer & enerGy sectOr
pROjEct Staythorpe Power Station lOcatION Newark
pROjEct Spalding Power Station lOcatION Spalding
pROjEct Jersey Waste to Energy lOcatION Jersey
pROjEct West Burton Power Station lOcatION Retford
pROjEct Lakeside Waste to Energy lOcatION Slough

28 severfield—rowen plc Annual Report 2010
20155-04 27/04/2011 Proof 10
meet THE BOARD
auditordeloitte llpChartered Accountants and Statutory Auditor1 City SquareLeeds, LS1 2AL
solicitorsashurst llpBroadwalk House 5 Appold StreetLondon, EC2A 2HA
irwin mitchell21 Queen Street Leeds, LS1 2TW
stockbrokersRBS hoare govett ltd250 Bishopsgate London, EC2M 4AA
registrars and transfer Officecomputershare Investor Services plcPO Box 82 The PavilionsBridgwater RoadBristol, BS99 7NP
public relationspelham Bell pottinger12 Arthur StreetLondon, EC4R 9AB
BankersNational australia Bank ltd(Yorkshire Bank)94 Albion Street Leeds, LS1 6AG
the Royal Bank of Scotland plc3rd Floor2 Whitehall Quay, Leeds LS1 4HR
Bank of ScotlandLisbon House116 Wellington Street, Leeds LS1 4LT
Northern Bank ltdMain StreetIrvinestown, Co Fermanagh BT94 1GJ
secretary and registered Officepeter j davison BA FCADalton Airfield Industrial Estate Dalton, ThirskNorth Yorkshire YO7 3JN
registered number
1721262
Registered in England
advisers
4
3
6
7
1 2
8
9
5

29 29
20155-04 27/04/2011 Proof 10
OUR gOvERNaNcE
4 alan D DunsmoreFINANCE DIRECTOR
Alan Dunsmore joined the Company in March 2010 from Smiths Group Plc. Alan joined Smiths Group Medical Division in 1995, holding various positions throughout the business and from 2004 was Director of Finance for Smiths Detection. Prior to joining Smiths, he was with Coopers and Lybrand in Glasgow, where he qualified as a Chartered Accountant in 1992.
2 tom G HaugheyCHIEF ExECUTIVE OFFICER
Tom Haughey joined the Company as Group Commercial Director in February 2002. He graduated from Strathclyde University in 1978 and his career until joining the Group was within Corus (formerly British Steel) where his last position was Commercial Director of Corus Construction and Industrial. In November 2005 Tom was appointed Joint Group Managing Director and in July 2007 was appointed Chief Executive Officer.
Tom has Board responsibility for the Group’s Health and Safety and HR strategy.
3 peter a emersonCHIEF OPERATING OFFICER
Peter Emerson has worked in the Specialist Contracting Industry since 1974, initially in the concrete contracting sector. He joined Rowen Structures in 1984 as a quantity surveyor, rising to Deputy Managing Director in 1996. Peter was appointed Group Commercial Director in April 1998, and in December 2001 was appointed to the key role of Managing Director of Watson Steel Structures Ltd and also to Chief Operating Officer in July 2007.
Peter has Board responsibility for the Group’s Corporate and Social Responsibility strategy.
1 toby j l Hayward CHAIRMAN
Toby Hayward was appointed non-executive Chairman in June 2008. He qualified as a Chartered Accountant with Deloitte in 1984 and became an Investment Banker. He was a Director of Corporate Finance at Singer & Friedlander Ltd and Henry Ansbacher & Co Ltd before working in the Equity Capital Markets team at Canaccord Capital Ltd. He joined Jefferies International Ltd as Managing Director in 2005 with responsibility for UK Corporate Broking and left Jefferies in June 2008 to concentrate on Consultancy and non-executive work.
7 David p ridleyNON-ExECUTIVE DIRECTOR
David Ridley was appointed a non-executive director of the Company in June 2002. He previously held the Chairmanship of Faithful and Gould, the quantity surveyor and cost management consultants, which forms part of the W S Atkins Group of Companies. He has a wealth of experience and contacts within a number of strategic sectors for the Group, including infrastructure and transportation.
8 Geoff H Wright NON-ExECUTIVE DIRECTOR
Geoff Wright was appointed as a non-executive director of the Company in September 2006. He retired from Hammerson plc, where he was Director of Project Management and Construction, having worked there for 37 years. He is well known in the property and construction industries and was previously President of the Chartered Institute of Building. He is a non-executive Director of Waterman plc and several private companies.
9 john DoddsNON-ExECUTIVE DIRECTOR
John Dodds joined the Company as a non-executive director in October 2010. He retired in March 2010 from Kier Group plc, the construction and property services group, after serving for seven years as Group Chief Executive. He worked for Kier, both in the UK and overseas, for nearly 40 years and held a main board position through the employee buy-out process in 1992 and the subsequent flotation of the Group on the London Stock Exchange in 1996.
John is a non-executive director of Newbury Racecourse PLC and Lagan Construction Holdings Limited.
5 Derek randallExECUTIVE DIRECTOR
Derek Randall was appointed Executive Director, Business Development in May 2008. He is a Master of Business Administration (Warwick Business School), Doctor of Business Administration (Nottingham Business School) and the Visiting Professor of International Management and Development at Birmingham City University’s Business School. Before joining the Group, most of his career was with Corus Group latterly as Commercial Director of Long Products Division. Derek has served on the Executive Council of The Steel Construction Institute.
6 j keith elliott SENIOR NON-ExECUTIVE DIRECTOR
Keith Elliott joined the Company as a non-executive director in October 1998. He retired in July that year from Bechtel, the international engineering and construction group, where he was a partner in Bechtel Corporation and Senior Vice President responsible for its petroleum and chemical business. He is a graduate chemical engineer and serves as non-executive Chairman of Keltbray Group.

30 severfield—rowen plc Annual Report 2010
20155-04 27/04/2011 Proof 10
executive COMMITTEE
3
1 28
64
7 5 9

31 31
20155-04 27/04/2011 Proof 10
OUR gOvERNaNcE
1 tom G Haughey BACHIEF ExECUTIVE OFFICER
2 peter a emersonCHIEF OPERATING OFFICER ANDMANAGING DIRECTOR Watson Steel Structures
3 alan D Dunsmore BAcc CAFINANCE DIRECTOR
4 Derek randall MBA, DBAExECUTIVE DIRECTOR
5 nigel pickardMANAGING DIRECTORatlas Ward Structures
Nigel Pickard joined the Group in 2005 following the acquisition of Atlas Ward Structures. He has 30 years’ experience in the structural steel industry, working both in the UK and overseas markets. In 2000, Nigel was appointed Operations Director of Atlas Ward where he took full responsibility for production. Appointed as Managing Director in October 2002, Nigel transformed Atlas Ward’s business, turning its substantial losses to profit and laid the foundations for further development in the future.
7 paul thompsonExECUTIVE DIRECTORSeverfield-Reeve Structures
Paul Thompson joined the Group as Production Director of Watson Steel in 2002 and has 33 years of experience in the structural steel industry. In 2005 Paul was appointed Deputy Managing Director of Watson Steel and in January 2010, became Executive Director Group Business Operations. In 2011 Paul was appointed Executive Director responsible for operations at Severfield-Reeve Structures whilst also retaining his Group position.
9 David larterGROUP DIRECTORBusiness Sustainability
David Larter joined the Group in 2010 as Group Director – Business Sustainability. David has worked in the construction industry for 28 years and has held senior management and corporate strategic positions in international contracting and design consultancy businesses. He brings a wealth of experience in design, build-ability and construction techniques on international major projects across a diverse range of sectors.
6 ian r s cochraneMANAGING DIRECTORfisher Engineering
Ian Cochrane joined the Group in 2007, following the acquisition of Fisher Engineering. Ian has worked at Fisher Engineering for 23 years, starting in the drawing office and progressing to Project Management. In January 2004, he was appointed Project Director and in October 2007, Managing Director. Ian has a comprehensive understanding of all aspects of the business and has been involved in many major projects in the UK and Ireland, representing a range of market sectors.
8 mike ashtonMANAGING DIRECTORSteelcraft Erection Services
Mike Ashton has worked in the steel construction industry since 1977 and joined Steelcraft Erection Services in 1994. Mike was appointed Erection Director in 1998 and Managing Director in 2010. Mike has a wealth of experience in steel construction and site management.

32 severfield—rowen plc Annual Report 2010
20155-04 27/04/2011 Proof 10
cOrpOrate OBJECTIVES
GrOWtH Built On success
Since becoming a public company in 1988, Severfield–Rowen has grown to become market leader in the design, fabrication and erection of structural steel. Our leading position provides competitive advantage through production capacity, quality, delivery, the assumption of complexity and project management. We will leverage this advantage through continuing investment in human and capital resources, the application of emerging technologies and the constant refinement of our design, production and erection processes — the cornerstones of our success.
GeOGrapHic DiversiFicatiOn
These process improvements will be applied at our production facilities and construction sites at home and overseas. We will continue to seek out international opportunities which
enhance growth and value for the Group. Such investments will frequently be made in partnership with premier local companies who can provide value enhancement and established routes into our core markets around the world.
cOntriButiOn tO cOmmunity & envirOnment
In all of our production centres and work sites we will operate within an overriding sense of commitment to our surroundings. We will focus on training local people, we will set new standards for health and safety, our environmental policies will aim to surpass local requirements and we will introduce leading edge technologies to the regions in which we operate.
enHanceD sHareHOlDer value
Through these strategies we aim to grow in size and market value and continue to provide attractive returns to our shareholders. As a unique player in the engineering sector and as a British manufacturing business, we will offer a valuable diversification to many of our shareholders’ portfolios.
tHe pOrtFOliO
pROjEct NISA & Velodrome lOcatION glasgow

33 33
20155-04 27/04/2011 Proof 10
OUR gOvERNaNcE
tHe pOrtFOliO
pROjEct Brighton and Hove Albion Stadium lOcatION Brighton

34 severfield—rowen plc Annual Report 2010
20155-04 27/04/2011 Proof 10
principal RISKS AND UNCERTAINTIES
The Group’s ongoing operations and growth plans are subject to a number of different risks and uncertainties. Risk management processes are put in place to assess, manage and control these on an ongoing basis. The principal ones facing the business are set out below, and are listed in no particular order.
Risk
people/skills
Steel price movements
The Group has established a market leading position over many years due in large part to the experience and skills of its key people.
Steel is the key material used within the business and the largest single cost within a contract. Steel prices have varied by >50% both positively and negatively over the past two years.
commercial and market environment
The UK construction market, within which the Group operates, is currently at the bottom of the economic cycle, placing significant pressure on all parts of the supply chain, from end customers through to material and subcontract suppliers.
Weak demand is resulting in increased competition, tighter margins and the transfer of commercial, technical and financial risk down the supply chain, through more demanding contract terms and longer payment cycles.
Loss of key people could adversely impact the Group’s existing market position. Insufficient growth and development of its people and skillsets could restrict its growth ambitions both in the UK and overseas.
Such movements have the potential to impact the profitability of both individual contracts and the whole business significantly, particularly given the long duration of many of its contracts.
●● Increased senior management review of technical and commercial risks within each contract before acceptance.
●● Strengthening of commercial functions to manage contract progress and variations.
●● Close engagement with both customers and suppliers and monitoring of payment cycles.
●● Continuing use of credit insurance to minimise impact of customer failure.
●● Talent reviews undertaken regularly.
●● Development opportunities identified for staff to broaden their range of skills and experience.
●● A staff appraisal process continues to align the short and long term needs and goals of the business with those of key staff.
●● Remuneration policy is regularly reviewed to ensure that it is competitive and strikes the appropriate balance between short and long term rewards and incentives.
●● Skills gaps are continually identified and actions put in place to bridge these by either training, development or external recruitment.
●● Supply and pricing agreements with steel suppliers are negotiated to minimise individual contract risk.
●● Customer bids are structured to reflect the prevailing conditions within the market for raw steel.
Explanation Impact Mitigation/comment

35 35
20155-04 27/04/2011 Proof 10
OUR gOvERNaNcE
Risk
health & Safety
Indian joint venture
The Construction Industry sets very high standards of Health and Safety which the Group aims to exceed to maintain the health and wellbeing of its employees.
The Group has invested in a joint venture in India, where the growth prospects are believed to be substantial.
Interruption to fabrication facilities
The Group’s production facilities are at the core of its business and the Group relies on smooth continued operation of them.
Interruption could impact both the Group’s performance on existing contracts and its ability to bid for future contracts, thereby impacting its financial performance.
Construction activities can result in injury or death to employees, with subsequent financial loss to the business, potential loss of reputation, where at fault, and ultimately exclusion from future business.
The growth, management and performance of this business will be a key element of the Group’s development for the foreseeable future. Effective management of the joint venture is therefore key to the Group’s continuing success.
●● Drive market leading standards for all employees at all times.
●● Director led safety leadership teams established to bring innovative solutions and to engage with all stakeholders to deliver continuous improvement in standards across the business and wider industry.
●● Regular Board review of performance.
●● Achievement of challenging Health and Safety performance targets is a key element of management remuneration.
●● Robust joint venture agreement.
●● Two members of Group Board of Directors are members of joint venture Board.
●● Strong governance in place at joint venture.
●● Regular formal and informal meetings held with both joint venture management and joint venture partners.
●● Key positions within joint venture management structure are occupied with Group employees seconded to the joint venture.
Explanation Impact Mitigation/comment
●● The Group has four main production facilities so interruption at one facility could to some extent be absorbed by increasing capacity at a sister facility.
●● A wide network of sub-contract fabricators is used on a recurring basis, both for short term peak capacity requirements and for more specialised fabrication. This network could also be used to mitigate disruption to the Group’s own fabrication facilities.
●● Appropriate levels of Business Interruption insurance cover are maintained and reviewed regularly with the assistance of independent advisors and brokers.
Financial risks and uncertainties are separately described in the Financial Review on pages 22 to 24, and within note 21 of the Consolidated Financial Statements.

36 severfield—rowen plc Annual Report 2010
20155-04 27/04/2011 Proof 10
DirectOrs’ REPORT
The directors present their annual report and the audited financial statements for the year ended 31 December 2010.
principal activity anD Business revieW
The principal activity of the Group continues to be the design, fabrication and erection of structural steelwork, specialist claddings and ancillary products.
The subsidiary and associated undertakings principally affecting the profits or net assets of the Group in the year are listed in notes 13 and 14 to the financial statements.
A review of the Group’s progress during the year and of its future prospects is contained in the Chairman’s Statement on page 14, the Chief Executive’s Review on pages 16 to 18 and the Financial Review on pages 20 to 24.
The key performance indicators of the Group are presented and discussed on page 25.
Explanation of the Group’s approach to financial risk management is given in the treasury section on page 22 and in note 21.
A review of the Group’s performance in the area of health and safety, and its consideration of environmental and employment policies, is given in the Corporate Social Responsibility section on pages 41 to 44.
results anD DiviDenDs
The profit of the Group for the year after taxation amounted to £7,633,000 (2009: £31,313,000), details of which are set out in the Consolidated Income Statement on page 63.
An interim dividend of 5.00p net per share (2009: 10.00p) was paid on 22 October 2010. The directors recommend a final dividend for the year of 2.50p net per share (2009: £Nil) payable on 16 June 2011 to shareholders on the register on 20 May 2011.
For the year ended 31 December 2009 no final dividend was paid but was replaced by a second interim dividend of 5.00p net per share which was paid on 29 March 2010.
FixeD assets
Details of changes in the Group’s fixed assets are given in notes 10, 11 and 12 to the consolidated financial statements.
emplOyees
The Group’s principal employee policies are set out on page 42 within the Corporate Social Responsibility section.
BrancHes
The branches of the Group are set out on pages 8 and 9.
DirectOrs
The present membership of the Board is stated on page 29. A D Dunsmore, J Dodds
and D Randall were appointed as directors on 1 March 2010, 1 October 2010 and 28 February 2011 respectively. P Davison resigned on 3 June 2010. All of the other directors served throughout the year.
The directors’ interests in the share capital of the Company are set out on page 56 in the Directors’ Remuneration Report.
T G Haughey, J K Elliott, J Dodds and D Randall will retire at the Annual General Meeting in accordance with the Articles of Association and will offer themselves for re-election.
T J L Hayward (Chairman) believes that J K Elliott continues to be committed to the role of non-executive director and to show effective performance and consequently supports his nomination.
DirectOrs anD OFFicers liaBility
Directors and Officers liability insurance has been purchased during the year.
aGreements WitH emplOyees anD siGniFicant aGreements
There are no agreements between the Group and its directors or employees providing for compensation for loss of office or employment that occurs because of a takeover bid.
The Group’s banking arrangements which expire in March 2013 can be terminated upon a change of control of the Group.
siGniFicant sHareHOlDinGs
As at 18 April 2011, the Company had been notified of the following voting rights to the Company’s shares in accordance with the Disclosure Rules and Transparency Rules of the UK Listing Authority:
2.5p Ordinary shares %
M & G Investment Management 11,305,473 12.67Rathbone Investment Management 5,511,370 6.18J O Hambro Capital Management 4,911,574 5.50BlackRock 4,601,924 5.16Threadneedle Asset Management 4,512,830 5.06Aviva 4,494,699 5.04Legal & General Investment Management 4,002,115 4.48Montanaro Fund Managers 3,806,145 4.26

37 37
20155-04 27/04/2011 Proof 10
OUR gOvERNaNcE
tHe severFielD–rOWen plc 2010 sHare incentive plan (sip)
Following approval at the 2010 Annual General Meeting of the new HMRC approved Share Incentive Plan the Company issued 202,384 new ordinary shares of 2.5p during the year to 973 qualifying employees.
sHare capital
The Company has a single class of share capital which is divided into ordinary shares of 2.5p each.
Three resolutions are to be proposed at the forthcoming Annual General Meeting relating to or concerning Share Capital.
(i) The directors are requesting that their authority to allot shares be renewed. The maximum amount of relevant securities that may be allotted pursuant to the authority is £743,015 in nominal value (29,720,608 shares) representing approximately 33.3% of the Company’s total share capital in issue as at 18 April 2011, being the latest practical date prior to the date of the Notice of Meeting. The Board has no present intention of exercising this authority, which will expire at the end of the 2012 Annual General Meeting, or on 30 June 2012, whichever is the earlier.
(ii) The directors’ power to allot equity securities conferred by the Special Resolution of the Company passed on 3 June 2010 will expire at the conclusion of the Annual General Meeting to be held on 8 June 2011, unless otherwise varied, revoked or renewed. Your directors consider it desirable that this power, being a limited disapplication of pre-emption rights, should be renewed at the forthcoming Annual General Meeting, such authority to expire at the end of the 2012 Annual General Meeting, or on 30 June 2012, whichever is the earlier. Apart from
rights issues, open offers and other pre-emptive issues, the aggregate nominal value of new shares for which power is being sought is not to exceed £111,564 (4,462,554 shares) representing 5% of the Company’s issued share capital. Other than the shares which may be issued under the SIP, described above, the directors have no present intention of exercising this power but should any further exercise be contemplated in the future they will have regard to the Investor Protection Committee guidelines.
(iii) The directors are requesting that at the forthcoming Annual General Meeting they are given the authority to buy, by way of market purchases, up to 10% of the issued share capital of the Company representing a maximum of 8,925,108 shares. The price to be paid will be no lower than 2.5p per share and no more than 5% above the average of the middle market quotations (as derived from the London Stock Exchange Daily Official List) for the five business days preceding the day on which the shares are purchased. Purchases would not be made in the close period preceding the announcement of the Company’s interim or final results. This proposal does not indicate that the Company will purchase shares at any particular time or price, or imply any opinion on the part of the directors as to the market or other value of the Company’s shares. This authority will expire at the end of the 2012 Annual General Meeting, or on 30 June 2012, whichever is the earlier. It is the present intention of the directors to seek a similar authority annually. The directors have no present intention of exercising this authority and will only do so at price levels which they consider to be in the interests of shareholders after taking account of the Group’s overall financial position, and which would lead to a beneficial impact on the earnings per share of the Company.
riGHts attacHinG tO sHares
The rights attaching to the ordinary shares are defined in the Company’s Articles of Association. The Articles of Association may be changed with the agreement of shareholders. A shareholder whose name appears on the Company’s Register of members can choose whether his shares are evidenced by share certificates (i.e. in certificated form) or held in electronic (i.e. uncertificated) form in CREST (the electronic settlement system in the UK).
Subject to any restrictions below, shareholders may attend any general meeting of the Company and, on a show of hands, every shareholder (or his representative) who is present at a general meeting has one vote on each resolution and, on a poll, every shareholder (or his representative) who is present has one vote on each resolution for every ordinaryshare of which they are the registered shareholder. A resolution put to the vote of a general meeting is decided on a show of hands unless before, or on the declaration of the result of, a vote on a show of hands, a poll is demanded by the chairman of the meeting, or by at least two shareholders (or their representatives) present in person and having the right to vote, or by any shareholders (or their representatives) present in person having at least 10% of the total voting rights of all shareholders, or by any shareholders (or their representatives) present in person holding ordinary shares in which an aggregate sum has been paid up of at least one-tenth of the total sum paid up on all ordinary shares.
Shareholders can declare final dividends by passing an ordinary resolution but the amount of the dividends cannot exceed the amount recommended by the Board. The Board can pay interim dividends on any class of shares of the amounts and on the dates and for the periods they decide the distributable profits of the Company justify such payment.

38 severfield—rowen plc Annual Report 2010
20155-04 27/04/2011 Proof 10
Any dividend which has not been claimed for twelve years after it became due for payment will be forfeited and will then belong to the Company, unless the directors decide otherwise.
If the Company is wound up, the liquidator can, with the sanction of an extraordinary resolution passed by the shareholders, divide among the shareholders all or any part of the assets of the Company and he can value any assets and determine how the division shall be carried out as between the members or different classes of members. The liquidator can also transfer the whole or any part of the assets
to trustees upon any trusts for the benefit of the members. No shareholders can be compelled to accept any asset which would give them a liability.
Details of share-based payment schemes are set out in note 22.
vOtinG at General meetinGs
Any form of proxy sent by the Company to shareholders in relation to any general meeting must be delivered to the Company, whether in written form or in electronic form, not less than 48 hours before the time appointed for holding the meeting or adjourned meeting at which the
person named in the appointment proposes to vote.
No shareholder is, unless the Board decides otherwise, entitled to attend or vote either personally or by proxy at a general meeting or to exercise any other right conferred by being a shareholder if he or any person with an interest in shares has been sent a notice under section 793 of the Companies Act 2006 (which confers upon public companies the power to require information with respect to interests in their voting shares) and he or any interested person failed to supply the Company with the information requested within 14 days after
tHe pOrtFOliO
pROjEct Blackfriars Bridge deck Replacement lOcatION London
DirectOrs’ REPORT continued

39 39
20155-04 27/04/2011 Proof 10
OUR gOvERNaNcE
delivery of that notice. The Board may also decide that no dividend is payable in respect of those default shares and that no transfer of any default shares shall be registered.
These restrictions end seven days after receipt by the Company of a notice of an approved transfer of the shares or all the information required by the relevant section 793 notice, whichever is the earlier.
transFer OF sHares
The Board may refuse to register a transfer of a certificated share which is not fully paid, provided that the refusal does not prevent dealings in shares in the Company from taking place on an open and proper basis. The Board may also refuse to register a transfer of a certificated share unless: (i) the instrument of transfer is lodged, duly stamped (if stampable), at the registered office of the Company or any other place decided by the Board, accompanied by a certificate for the share which it relates and such other evidence as the Board may reasonably require to show the right of the transferor to make the transfer; (ii) is in respect of only one class of shares; and (iii) is in favour of not more than four transferees.
Transfer of uncertificated shares must be carried out using CREST and the Board can refuse to register a transfer of an uncertificated share in accordance with the regulations governing the operation of CREST. The Board may decide to suspend the registration of transfers, for up to 30 days a year, by closing the Register of shareholders. The Board cannotsuspend the registration of transfers of any uncertificated shares without gaining consent from CREST.
There are no other limitations on the holding of ordinary shares in the Company.
variatiOn OF riGHts
If at any time the capital of the Company is divided into different classes of shares, the special rights attaching to any class may be varied or revoked either:
(i) with the written consent of the holders of at least 75% in nominal value of the issued shares of the class; or
(ii) with the sanction of an extraordinary resolution passed at a separate general meeting of the holders of the shares of the class.
The Company can issue new shares and attach any rights to them. If there is no restriction by special rights attaching to existing shares, rights attaching to new shares can take priority over the rights of existing shares, or the new shares and the existing shares are deemed to be varied (unless the rights expressly allow it) by a reduction of paid up capital or if another share of that same class is issued and ranks in priority for payment of dividend or in respect of capital or more favourable voting rights.
General meetinGs
A resolution is to be proposed at the forthcoming Annual General Meeting that a general meeting of the Company, other than an Annual General Meeting, can be called on not less than 14 clear days notice.
crest
The Company’s ordinary shares are in CREST, the settlement system for stocks and shares.
creDitOr payment pOlicy
The Group’s current policy concerning the payment of its trade creditors is to agree terms and conditions for its transactions with suppliers and to abide by those terms, subject to those terms and conditions being met by the supplier. At 31 December 2010 trade creditors of the Group represented 43 days of purchases (2009 reanalysed: 29 days).
cHaritaBle anD pOlitical cOntriButiOns
During the year the Group made charitable donations of £118,000 (2009: £81,000), principally to local charities serving the communities in which the Group operates.
No contributions were made to any political parties during the current or preceding year.
GOinG cOncern
After making enquiries, the directors have formed a judgement at the time of approving the financial statements that there is a reasonable expectation that the Group has adequate resources to continue in operational existence for the foreseeable future. For this reason the directors continue to adopt a going concern basis in preparing the financial statements.
The key factors considered by the directors in making the statement are set out in the Financial Review on pages 22 to 24.
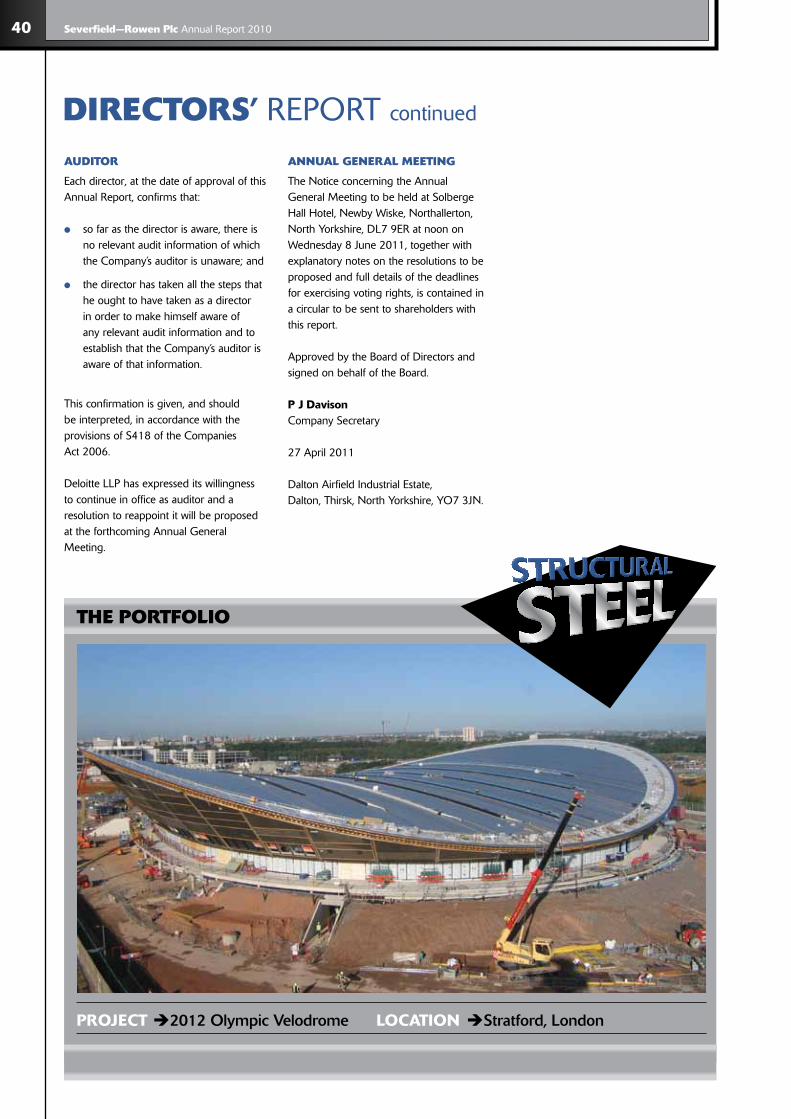
40 severfield—rowen plc Annual Report 2010
20155-04 27/04/2011 Proof 10
auDitOr
Each director, at the date of approval of this Annual Report, confirms that:
●● so far as the director is aware, there is no relevant audit information of which the Company’s auditor is unaware; and
●● the director has taken all the steps that he ought to have taken as a director in order to make himself aware of any relevant audit information and to establish that the Company’s auditor is aware of that information.
This confirmation is given, and should be interpreted, in accordance with the provisions of S418 of the Companies Act 2006.
Deloitte LLP has expressed its willingness to continue in office as auditor and a resolution to reappoint it will be proposed at the forthcoming Annual General Meeting.
annual General meetinG
The Notice concerning the Annual General Meeting to be held at Solberge Hall Hotel, Newby Wiske, Northallerton, North Yorkshire, DL7 9ER at noon on Wednesday 8 June 2011, together with explanatory notes on the resolutions to be proposed and full details of the deadlines for exercising voting rights, is contained in a circular to be sent to shareholders with this report.
Approved by the Board of Directors and signed on behalf of the Board.
p j davisonCompany Secretary
27 April 2011
Dalton Airfield Industrial Estate,Dalton, Thirsk, North Yorkshire, YO7 3JN.
tHe pOrtFOliO
pROjEct 2012 olympic Velodrome lOcatION Stratford, London
DirectOrs’ REPORT continued

41 41
20155-04 27/04/2011 Proof 10
OUR gOvERNaNcE
cOrpOrate SOCIAL RESPONSIBILITY
steel Futures
The Group has embarked upon a continuous improvement plan through the introduction of its ‘Steel Futures’ programme. This will underpin the strategic aspirations and further develop a market leading position for the businesses.
There are three strands to the Group’s Steel Futures approach in 2011:
intrODuctiOn
The Severfield–Rowen Board along with the Executive Committee and employees are committed to demonstrating leadership in its Corporate Social Responsibility activities.
The Group has made significant investment to develop a clear, differentiated position for its business, which includes:
●● the achievement of BES 6001 global standard for responsible sourcing of materials
●● Group-wide local community engagement activities to support development and interaction
●● working towards a sustainability agenda by rolling out a progressive company vehicle policy, including hybrid cars
●● achievement of the BCSA Gold Award for its sustainability performance for three consecutive years
●● investment in training for its people, promoting leadership and developing the skills necessary for the future success of our business
●● Safety Leadership
●● Behavioural Safety
●● Safety ‘Golden Rules’
●● Health & Wellbeing
●● Supporting Client Safety
●● Safety in Design
●● Safety & Risk Communication
●● Community & Stakeholder Engagement
●● Leadership & People Development
●● Cost Reconciliation & Profitable Growth
●● Market Leading Innovation
●● Performance Management
●● Supply Chain Partnering
●● Carbon Management & Reduction
●● Transport Policy & Strategy
●● Waste Management
●● Recycling
●● Renewable Energy
●● Responsible Sourcing of Materials
●● Water Management
Over the coming year the Group expects to demonstrate and report progress in these key areas.

42 severfield—rowen plc Annual Report 2010
20155-04 27/04/2011 Proof 10
HealtH anD saFety
The Group is committed to high standards of Health and Safety for all employees and is promoting safety excellence through all its operations. The Group has developed a continuous improvement strategy to drive and challenge current practices, with the intention of placing the business as a market leader in the implementation of Health and Safety.
At the start of 2011, the Group established a network of Safety Leadership Teams at each of its operating companies. Each team is headed by the Managing Director and consists of senior directors, managers, shopfloor and union representation. The SLTs will support the excellent work carried out by the Group’s in-house safety teams and worker safety committees and, by working with key clients, will assist in setting strategies and the introduction of new technologies to improve health and safety standards across the industry.
The Group’s fully functional Health and Safety department supports the operational directors in developing and maintaining a positive health and safety culture for all aspects of our operations. Each operating subsidiary has a worker health and safety committee with direct access to the main Board via monthly Health and Safety meetings.
The Group operates in some challenging working environments and the Board is proud of its good safety record. Despite this, the Board will continue to improve both health and safety awareness and the safety record throughout the Group.
The Group has successfully maintained accreditation for its Safety, Health and Environmental System and has achieved certification to OHSAS 18001 and BS EN ISO 14001.
In 2011 the focus is on the the development of leadership skills and the provision of behavioural safety training of employees and our subcontractors to help achieve our improvement strategy.
emplOyees
Severfield–Rowen recently launched an employee Share Incentive Scheme offering shares in the business to reward employees for their hard work in positioning the business as market leader.
Employees are regularly informed of matters concerning the performance and future developments of the Group.
The Group’s policy is to provide equal opportunities to all existing and prospective employees. The Group’s reputation is dependent on the quality, effectiveness and skill base of its employees and is committed to the fair and equitable treatment of all
its employees and specifically to prohibit discrimination on the grounds of race, religion, sex, sexual orientation, age, nationality or ethnic origin.
The Group has also continued with its established policy of employing disabled persons where practicable and endeavours to ensure that they benefit from training and career opportunities in common with all employees. In the event that employees become disabled every effort is made to ensure that their employment within the Group continues, with appropriate training and support.
HS&E Accreditation
Performance development Reviews
cOrpOrate SOCIAL RESPONSIBILITY continued

43 43
20155-04 27/04/2011 Proof 10
OUR gOvERNaNcE
18000
16000
14000
12000
10000
8000
6000
4000
2000
0FEL AW WSSL SRS GROUP
man
hou
rs
■●2008 ■ 2009 ■ 2010
Staff Training
envirOnment
The Group is committed to minimising the impact of its business and its processes on the natural environment and the community at large by going beyond basic compliance with applicable laws, directives and regulations pertaining to its field of operations.
The businesses work with local authorities to ensure they comply with all permits and authorisations required to carry out operations.
All operational companies within the Group have now been awarded Gold Standard in the Steel Construction Sustainability Charter. This is a milestone achievement and further demonstrates the Group’s ambition to generate an efficient sustainable business model.
Bes 6001 - GlOBal stanDarD FOr respOnsiBle sOurcinG OF materials
The Group is proud to be recognised as the first Steel Fabrication Contractor in the Industry to achieve the global standard of BES 6001 to demonstrate the responsible sourcing of materials for products fabricated for clients.
This accreditation gives the Group a leadership position in the market place,
enabling clients, architects and other designers to specify Severfield-Rowen steel products and attract additional BREEAM points.
The achievement to the level of ‘Very Good’ attained by the Group attracts the maximum BREEAM points attainable.
traininG
The in-house training company, ECTL, is manned by experienced training professionals whose primary purpose is to provide training to all employees and to update them with the necessary skills and professional development. The business recognises that as an organisation its employees must achieve the necessary competences and Health and Safety understanding to successfully manage any risks associated with the work undertaken by the business.
The team within ECTL provides approved training and accreditation to industry recognised standards across a significant range of management, supervisory, office and frontline roles. They are supplemented by external resource from many awarding bodies such as IPAF, City & Guilds and Learning Skills Council, to ensure that the Group’s workforce is effectively trained, qualified and experienced to perform their roles safely and in compliance with statutory and recommended practices.
During 2010 the Group committed significant financial and time resource to delivering training programmes for its direct employees and sub-contractors. Training was delivered from senior executive level to shop floor and on-site employees.
The Executive Committee recently undertook the Institute of Occupational Safety and Health, Directing Safely training course as part of the leadership development programme rollout across the business.
carBOn aGenDa
The Group is continuing to pursue a carbon agenda which will help to provide a clear business differentiator in the market place.
In 2010 the business took the decision to actively reduce the transport carbon footprint for the business. Company cars were a first step and by investing in a significant number of hybrid vehicles, a total of 17 Toyota Prius Hybrid cars were added to the Group fleet.
A corporate strategy of progressively moving towards low carbon vehicles with CO2 emissions of below 140kgs has been proactively implemented. The Company is benefiting in terms of cost reduction and its overall carbon footprint. 2008 = 24% of company cars under
140kgs/CO2. 2008 = 0 Hybrid vehicles 2009 = 28% of company cars under
140kgs/CO2. 2009 = 0 Hybrid vehicles 2010 = 73% of company cars under
140kgs/CO2. 2010 = 17 Hybrid vehicles

44 severfield—rowen plc Annual Report 2010
20155-04 27/04/2011 Proof 10
The business also invests in 9 minibuses at the Dalton works to reduce the number of vehicles on the road and limit the number of cars impacting the local community each day with less journeys by employees.
WOrkFOrce anD uniOn enGaGement
The Group has worked hard to promote an inclusive culture with effective two way communications with employees and union representatives to support the overall performance of the business.
Regular scheduled meetings help to create a meaningful and robust method of dealing with concerns and management issues across all aspects of the business.
cOmmunity enGaGement
Severfield–Rowen Plc recognises the importance of community involvement and proactively engages with organisations both locally and nationally. Group companies also recognise their duty as successful local employers and are involved directly with the local communities and residents, many of which are directly employed by the businesses.
Direct time and resource are involved to ensure the Group is properly engaged in these activities. During 2010 Severfield–Rowen Plc actively supported and donated to the following local organisations: Butterwick Hospice, Saint Michael’s Hospice, Bolton Hospice and Saint Catherine’s Hospice.
The Group companies also support and donate to other charities:
●● Macmillan Cancer Support
●● The Prince’s Trust
●● World Scout Jamboree 2011
●● Philip Green Memorial Trust
●● The Christie Charity
●● Dalton Village Support
●● Dales School
●● British Heart Foundation Northern
●● Downs Syndrome - Ireland
●● Rotary Club
●● Anthony Nolan trust
●● Barnados and Ronald McDonald charities
●● Lighthouse Club
●● Cancer Research
●● Muscular Dystrophy
●● Samaritans
●● Firefighters Charity
●● Mencap
Severfield–Rowen Plc also supports The Prince’s Trust and the provision of training placements within the organisation.
In partnership with Tesco our Atlas Ward business implements an effective apprenticeship training programme. The Group plans to recruit further apprentices in 2011.
Waste manaGement
The Group has introduced significant measures for recycling and diverting waste from landfill. These measures are externally audited and verified through our Group certification.
The business will continue to develop innovative processes to manage the recycling of steel products and mitigate the impact of its general waste.
Toyota Prius Hybrid Vehicles
100%90%80%70%60%50%40%30%20%10%0%
FEL AW WSSL SRS GROUP
■●landfill ■ recycled
Waste - diverted from Landfill
cOrpOrate SOCIAL RESPONSIBILITY continued
Vehicles Above 140Kgs/CO2
Vehicles BELOW 140Kgs/CO2
Total Hybrid Vehicles
100%
75%
50%
25%
0%
76% 72% 73%
24%28% 27%
1700
2008 2009 2010
A Progressive Carbon Agenda

45 45
20155-04 27/04/2011 Proof 10
OUR gOvERNaNcE
The Board is committed to high standards of corporate governance. It is accountable to the Company’s shareholders for good corporate governance.
This statement together with the Directors’ Remuneration Report on pages 50 to 58 describe how the principles of good governance, as set out in Section 1 of the Combined Code on Corporate Governance published in June 2008 by the Financial Reporting Council (“the Code”), are applied to the Company and the Company’s compliance with the Code provisions. The principles of good governance are split into the following areas: directors, directors’ remuneration, accountability and audit, and relations with shareholders.
DirectOrstHe BOarD
The Company is controlled through the Board of Directors which currently comprises four executive and five non-executive directors, all of which are considered as independent.
P J Davison resigned on 3 June 2010.
J Dodds was appointed as an additional non-executive director from 1 October 2010.
D Randall was appointed as a Main Board director with effect from 28 February 2011, increasing the number of executive directors to four.
T J L Hayward is the non-executive Chairman and was appointed on 1 June 2008.
The Board has a separate Chairman and Chief Executive in line with the Code. The Chairman is mainly responsible for the running of the Board, evaluating its performance and ensuring that all directors receive sufficient relevant information on financial, business and corporate issues prior to meetings. The Chief Executive’s responsibilities focus on co-ordinating the Company’s business and assessing and implementing Group strategy.
J K Elliott is the senior independent non-executive director and leads the performance review of the Chairman, taking into account the views of the executive directors.
All directors are able to take independent professional advice in furtherance of their duties if necessary.
The Board considers that the balance of relevant experience amongst the various Board members enables the Board to exercise effective leadership and control of the Group. It also ensures that the decision making process cannot be dominated by any individual or small group of individuals.
An Executive Committee consisting of the members indicated on page 31 was established in 2008. This Committee assists the main Board by focusing on strategic and operational performance matters relating to the business and meets formally on a monthly basis.
BOarD eFFectiveness
The Board has a formal schedule of matters reserved for it. It is responsible for overall Group strategy, acquisition and divestment policy, approval of major capital expenditure projects and consideration of significant financing matters. It monitors the exposure to key business risks including environmental and health and safety issues. It reviews the strategic direction of individual trading subsidiaries, codes of conduct, annual budgets, progress towards achievement of those budgets and significant capital expenditure programmes.
The Board also considers employee issues and key appointments. It also ensures that all directors receive appropriate training on appointment and then subsequently as appropriate. Other specific responsibilities are delegated to the Board committees described below. All directors, in accordance with the Code, will submit themselves for re-election at least once every three years. The performance of individual directors is evaluated annually in conjunction with the remuneration review.
The Board generally meets monthly and during the year met ten times. A formal agenda for each meeting is agreed with the Chairman and is circulated in advance of the meeting to allow time for proper consideration, together with relevant papers including key strategic, operational and financial information. Attendance of individual directors during 2010 at scheduled Board meetings and at meetings of the Remuneration, Audit and Nominations Committees is set out below.
cOrpOrate GOVERNANCE
Remuneration Audit Nominations Board Committee Committee Committee
Total number of meetings held 10 7 2 3T J L Hayward 10 7 2 3T G Haughey 10 — — —A D Dunsmore(1) 9 — — —P A Emerson 10 — — —P J Davison(2) 5 — — —J K Elliott 10 7 2 3D P Ridley 10 7 2 3G H Wright 8 7 2 3J Dodds(1) 3 2 1 1
(1) Full attendance at Board and relevant committee meetings following appointment.(2) Full attendance at Board meetings prior to resignation.

46 severfield—rowen plc Annual Report 2010
20155-04 27/04/2011 Proof 10
Non-attendance by directors at meetings was due to either conflicting commitments previously agreed or illness. The majority of the Board meetings are held at the Group’s Head Office in Dalton, North Yorkshire. However, during the year three of the meetings were held at the offices of the Group’s other operating subsidiaries providing non-executive directors the opportunity to increase their knowledge and understanding of the Group’s operations.This included one meeting held in India.
BOarD cOmmittees
The Board has established four standing committees, all of which operate within defined terms of reference.
The committees established are the Audit Committee, the Remuneration Committee, the Nomination Committee and the Health and Safety Committee. Trading companies
are managed by separate boards of directors. Any matters of a material nature concerning the trading companies are reported to the Group Board of directors on a monthly basis.
With the change in the executive management and chairmanship in 2008 plus the attendant Board restructuring, the new Board considered it important to retain a level of continuity in the Boardroom and asked J K Elliott to continue in his role as Senior Non-Executive Director for the immediate future notwithstanding that 2008 was his 10th year as a serving director; he therefore continues with his chairmanship of the Audit Committee and the Remuneration Committee. The Board acknowledges that he could be considered non independent due to tenure but believes that he continues to act independently and recognises his high level of commitment and effective contribution to the Board’s decision making process.
auDit cOmmittee
The Audit Committee comprises the non-executive directors and is chaired by J K Elliott. T J L Hayward is a Chartered Accountant and is considered by the Board to have the relevant financial experience to serve on the Audit Committee. The Committee has written terms of reference which will be available for inspection at the Annual General Meeting. Meetings are held at least twice a year and additional meetings may be requested by the auditors.
The responsibility of the Audit Committee principally falls into the following areas:
●● To monitor the integrity of the financial statements, formal announcements and to review significant financial reporting judgements.
tHe pOrtFOliO
pROjEct ExCel Phase 2 lOcatION London
cOrpOrate GOVERNANCE continued

47 47
20155-04 27/04/2011 Proof 10
OUR gOvERNaNcE
●● To review the Company’s internal financial controls.
●● To make recommendations to the Board in relation to the appointment and removal of the external auditor and to approve their remuneration and their terms of engagement.
●● To review the nature of non-audit services supplied and non-audit fees relative to the audit fee.
●● To provide independent oversight over the external audit process through agreeing the suitability of the scope and approach of the external auditor’s work, assessing their objectivity in undertaking their work and monitoring their independence taking into account relevant UK professional regulatory requirements and the auditor’s period in office and compensation
●● To oversee the effectiveness of the external audit process particularly with regard to the quality and cost-effectiveness of the auditor’s work.
●● To consider the need for an internal audit function. The Committee agrees with the directors’ opinion that the Group is not of sufficient size and complexity to require the need for an internal audit function.
Consistent with exercising these responsibilities the Committee has considered in detail both the final and interim results for 2010 specifically reviewing the appropriateness of significant accounting policies, financial reporting issues and judgements and relevant reports from both management and the external auditor. Throughout the year the Committee has continued to assist the Board in achieving its obligations under the Combined Code in areas of risk management and internal control, focussing particularly on areas of compliance with legal requirements, accounting standards and the Listing Rules, and ensuring that an effective system of internal financial and non-financial controls is maintained.
The Committee recognises that, given their knowledge of the business, there are often advantages in using the auditor to provide certain non-audit services. The Committee is satisfied that the independence of the auditor has not been impaired by providing these services. Non-audit services provided
by the auditor during the year ended 31 December 2010 included corporation tax compliance advice and advice in connection with the establishment of JSW Severfield Structures Limited. The Committee has a policy of limiting fees to the auditor for non-audit services to 100% of the audit fee and requiring competitive tender for all work with a fee over £30,000. There are no specific types of non-audit work from which the auditor is specifically excluded but the Committee may reserve the right to insist that the auditor be excluded from tendering for work that may present a potential conflict of interest. The auditor complies with the Accounting Practices Board (APB) Ethical Standards applying to non-audit services.
Details of the auditor’s fees are shown in note 4 on page 75.
On invitation, the Finance Director, other executive directors, Executive Committee members and the auditor attend meetings to assist the Committee to fulfil its duties. The Committee can access independent professional advice if it considers it necessary.
The Committee met on two occasions in 2010 with full attendance.
remuneratiOn cOmmittee
The Remuneration Committee operates under written terms of reference. These terms of reference are available for inspection at the Annual General Meeting and are published on the Company’s website. The Committee comprises the non-executive directors, and is chaired by J K Elliott. The Committee’s report is set out on pages 50 to 58.
nOminatiOns cOmmittee
The Nomination Committee comprises the non-executive directors and is chaired by G H Wright. The principal task of the Committee is to deal with key appointments to the Board, and related employment matters.
The Committee is responsible for proposing candidates for appointment to the Board, having regard to the balance and structure of the Board, and will meet as and when required.
The Committee met on three occasions during 2010 with full attendance to
discuss Finance Director succession and the appointment of a new non-executive director. The terms of reference for the Nomination Committee will be available for inspection at the Annual General Meeting.
All directors are required to seek re-election by the members at the Annual General Meeting following their appointment. Non-executive directors are not appointed for a fixed term.
The terms and conditions of appointment of non-executive directors will be available for inspection at the Annual General Meeting.
DirectOrs’ remuneratiOnThe Directors’ Remuneration Report is set out on pages 50 to 58 of the financial statements.
accOuntaBility anD auDitFinancial repOrtinG
The performance and financial position of the Company are provided in the Chief Executive’s Review on pages 16 to 18 and the Financial Review on pages 20 to 24, together with the Chairman’s Statement on page 14 and the Directors’ Report on pages 36 to 40.
These enable the Board to present a balanced and understandable assessment of the Company’s position and prospects. The directors’ responsibilities for the financial statements are described in the Directors’ Responsibilities Statement on page 59.
internal cOntrOl
An ongoing process has been established for identifying, evaluating and managing the significant risks faced by the Group, which involves working closely with independent risk management consultants. This process has been in place for the full financial year and up to the date of the approval of these financial statements and is regularly reviewed by the Board. This process is in accordance with the guidance provided by the Turnbull Report.
The Board has formally acknowledged its overall responsibility for reviewing the effectiveness of internal control. It believes that senior management within the Group’s operating businesses should also contribute in a substantial way and this has been built into the process.

48 severfield—rowen plc Annual Report 2010
20155-04 27/04/2011 Proof 10
tHe pOrtFOliO
pROjEct Titanic Signature Building lOcatION Belfast
There are inherent limitations in any system of internal control and, accordingly, even the most effective system can provide only reasonable, and not absolute, assurance with respect to the preparation of financial information and the safeguarding of assets. The system is designed to manage rather than eliminate the risk of failure to achieve business objectives.
In carrying out its review of the effectiveness of internal control in the Group the Board has taken into consideration the following key features of the risk management process and system of internal control:
●● Senior management from all key disciplines and subsidiary companies within the Group are involved in the process of risk assessment in order to identify and assess Group objectives, key issues and controls. A further
review has been performed to identify those risks relevant to the Group as a whole. This assessment encompassed all aspects of risk including operational, compliance, financial and strategic. A risk register is in place and is updated on an ongoing basis and a control strategy has been determined for each of the significant risks.
●● The risk management committee, chaired by T G Haughey, has the primary responsibility to identify, monitor and control the significant risks to an acceptable level throughout the Group. The committee receives information on relevant risk matters from line management and other sources on a regular basis.
●● The Group operates a comprehensive budgeting and financial reporting system which, as a matter of routine,
compares actual results with budgets. Management accounts are prepared for each subsidiary company and the Group on a monthly basis. Material variances from budget are thoroughly investigated. In addition, a more detailed profitability forecast based on actual contracts secured is regularly prepared to monitor the performance of the main operating company of the Group as the year progresses. Risks are identified and appraised throughout the annual process of preparing budgets. The Board approves the Group’s annual budget.
●● A credit insurance committee comprising T G Haughey, P A Emerson and A D Dunsmore has been established to review matters when adequate credit insurance on the Group’s customers cannot be purchased in the present economic climate.
cOrpOrate GOVERNANCE continued

49 49
20155-04 27/04/2011 Proof 10
OUR gOvERNaNcE
Cash flow forecasts are regularly prepared to ensure that the Group has adequate funds and resources for the foreseeable future.
Standard financial control procedures operate throughout the Group to ensure the integrity of the Group’s financial statements.
The Group operates a comprehensive “whistleblowing” policy, which is available on the Group’s website. Accordingly, staff may, in confidence, raise concerns about possible improprieties in matters of financial reporting or other matters. The Audit Committee reviews adherence with this policy on an ongoing basis.
Subsidiary company meetings consider and report on risk on a monthly basis as part of the monthly business review process. This process is followed to ensure that, as far as possible, the controls and safeguards are being operated in line with established procedures and standards.
Safety, Health and Environmental risks are continually monitored at all sites and are reviewed on a monthly basis by senior management and on a quarterly basis by the Health and Safety Committee.
Steps have been taken to embed internal control and risk management into the operations of the business and to deal with areas of improvement which come to management’s and the Board’s attention. This process is continuing to increase risk awareness throughout the Group.
relatiOns WitH sHareHOlDers
The Company encourages two-way communication with both its institutional and private investors and attempts to respond quickly to all queries received verbally or in writing.
T J L Hayward, T G Haughey, P A Emerson and A D Dunsmore attended several meetings with analysts, institutional shareholders and retail investors in the year ended 31 December 2010, either
at the time of the announcements of the Company’s interim or final results or during visits to the Company’s offices in North Yorkshire.
Feedback from these meetings is reported to the Board.
Direct discussions took place during the year between shareholders’ representatives and J K Elliott with particular reference to the Directors’ Remuneration Report.
The Board has sought to use the Annual General Meeting to communicate with private investors and encourages their participation.
cOmpliance statement
The Board has complied with the provisions of section 1 of the Code throughout the year ended 31 December 2010 and up to the date of this report.
tHe pOrtFOliO
pROjEct Thameslink Borough Viaduct Bridge lOcatION London

50 severfield—rowen plc Annual Report 2010
20155-04 27/04/2011 Proof 10
DirectOrs’ REMUNERATION REPORT
intrODuctiOnMy tenure as Chairman of the Remuneration Committee during the second part of the last decade saw significant fluctuations in the company’s results in line with changing market dynamics while at the same time investors realised generally steady increases in shareholder value. Attendant changes in the executive management of the business were implemented seamlessly and progressively during this time.
At the end of 2008 the UK construction industry experienced the commencement of the biggest and deepest retrenchment in modern history. You have heard from our CEO that expectations for market recovery in 2011 are now anticipated in 2012. This severe curtailment of the markets has seen an attendant rationalisation and shrinkage in the UK’s steel fabrication and erection industry. Across the industry management have been downsizing operations, losses have been widely acknowledged and some notable closures reported.
And yet Severfield–Rowen enters 2011 with a strong order book and a successful diversification strategy in hand. Revenue and profits have followed the downward spiral of the market but the company has increased market share, successfully diversified internationally and is well positioned for the recovery. It has retained and enhanced its UK market leader position.
The Remuneration Committee met many times throughout the past year, both formally and informally, seeking to develop remuneration policy consistent with management performance, company results and market conditions and outlook.
The report presents both our conclusions and our forward planning.
repOrtinG reGulatiOns This report, approved by the Board, has been prepared in accordance with the Companies Act 2006, Schedule 8 of the Large and Medium sized Companies and Groups (Accounts and Reports) Regulations 2008 (Schedule 8) and the Listing Rules of the Financial Services Authority. It also describes how the Board has applied the Principles of Good Governance relating to directors’ remuneration under the UK Corporate Governance Code. The Remuneration Committee has also taken into consideration guidelines published by institutional investor advisory bodies such as the ABI and RREV. As required by the legal regulations, a resolution to approve this report will be proposed at the Annual General Meeting of the Company at which time the financial statements will be approved.
The regulations require the auditor to report to the Company’s members on the “auditable part” of the Directors Remuneration Report and to state whether in their opinion that part of the report has been properly prepared in accordance with the Companies Act 2006. The report has therefore been divided into separate sections for audited and unaudited information.
unauDiteD inFOrmatiOnremuneratiOn cOmmittee
The Company has an established Remuneration Committee which is constituted in accordance with the recommendations of the Combined Code. The Committee comprises five non-executive directors, J K Elliott, T Hayward, G H Wright, D P Ridley and J Dodds, and is chaired by J K Elliott. The Committee met on seven occasions during the year with full attendance. John Dodds joined the Board on 1 October 2010 and attended all meetings subsequent to his appointment. The Company considers all members of the Committee to be independent. No executive directors attended Remuneration Committee meetings or otherwise play a part in any discussion about their own remuneration.
The statements made herein regarding remuneration policy apply equally to the five divisional directors who served on the Executive Committee and to the three executive directors who sat on the Board of Severfield–Rowen Plc during 2010. In 2011 there will be four Main Board directors and four divisional directors below Main Board on the Executive Committee.
Throughout 2010 Hewitt New Bridge Street (a trading name of AON Corporation) served as an independent adviser to the Remuneration Committee. Neither Hewitt New Bridge Street nor any other part of AON Corporation proved other services to the Company during the year.
The terms of reference for the Remuneration Committee are available from the Company Secretary and are published on the Company’s website.

51 51
20155-04 27/04/2011 Proof 10
OUR gOvERNaNcE
remuneratiOn pOlicy
In previous years in this report we have reiterated our policy of designing executive remuneration to attract executive directors of the highest calibre. This cornerstone of our policy remains unchanged. But there are today other parameters of equal bearing. Reward for performance, motivation and retention are major drivers. Moreover, alignment with corporate strategy and goals and alignment with compensation in the broader workforce are both fundamental drivers and underlying constraints.
Delivering the policy fundamentals requires careful consideration to achieve the correct balance between the various facets of our policy.
recent HistOry
Prior to 2004 executive pay was decided by the Remuneration Committee on a subjective basis taking into account the Company’s results and our assessment of individual contribution. A number of share option schemes had been adopted. Progressively a more structured cash bonus scheme tied to financial performance was introduced and share options were superseded by a share matching plan tied to longer term performance, which was later replaced by the current Performance Share Plan (PSP), also tied to three-year targets. Base salaries were set and reset, year on year, using traditional market benchmarking methods and taking account of individual experience and performance.
In 2007 executive salaries were reset mid-year when our current CEO assumed the role in July. These base salaries remained essentially unchanged (other than for a 3% inflationary adjustment on 1 January 2008) until the start of 2010.
In August 2009 the Company made a statement accompanying the interim results warning of extremely challenging market conditions and advising that a consultation process was in hand with management and the workforce to implement salary reductions and other cost savings. In the same announcement we advised that the Board and the Executive Committee had agreed to a reduction of 20% in base salaries effective 1 January 2010.
Consequently, current executive base salaries are significantly below 2007 levels.
In addition, we announced in 2009 our intention to replace the current single-tier approach to annual cash bonuses tied to financial performance to a broader based two-tier approach incorporating the measurement of success against non financial criteria, as well as financial metrics, thereby providing a more rounded assessment of management and company performance.
tHe status QuO
Recent benchmarking confirms that current base salaries of the executive directors are now significantly below market levels. This is entirely predictable as the salaries have been significantly reduced over a period of four years.
The benchmarking also indicated that the upper thresholds or caps of variable performance related pay, both short and long term were competitive or in some cases above market. However, earnings or vesting under these schemes will be limited by the market driven downturn for at least three years.
The benchmarking has been used for information and has not formed the basis for specific adjustments.
tOtal DirectOrs’ remuneratiOn
It is important to view overall directors’ remuneration against the backdrop of market movement and results. Looking at the group of eight directors within the purview of the Remuneration Committee, the payroll cost from 2009 to 2010 reduced by 25%. Bonus payments declined by 61%. Total remuneration is down by 42% in aggregate, a reduction of £1.5 million.
tHe Future
Future executive remuneration policy will incorporate our established principles and strive for consistency with best practice guidelines whilst creating a platform for a broader based policy incorporating the following precepts:
1) Alignment of total executive remuneration with shareholder return.
2) Fair reward for past achievement
3) Motivation for future achievement
4) Ensuring the package is sufficiently retentive, mitigating the replacement risk.
5) Realisation of non financial performance targets aligned with corporate strategy.
6) Establishment of an appropriate balance between fixed and performance related remuneration.
7) Avoidance of policies that incentivise executives to assume undue risk for the business.
The Remuneration Committee will seek to balance these objectives in all aspects of future remuneration.

52 severfield—rowen plc Annual Report 2010
20155-04 27/04/2011 Proof 10
tHe pOrtFOliO
pROjEct St Botolphs lOcatION London
DirectOrs’ REMUNERATION REPORT continued
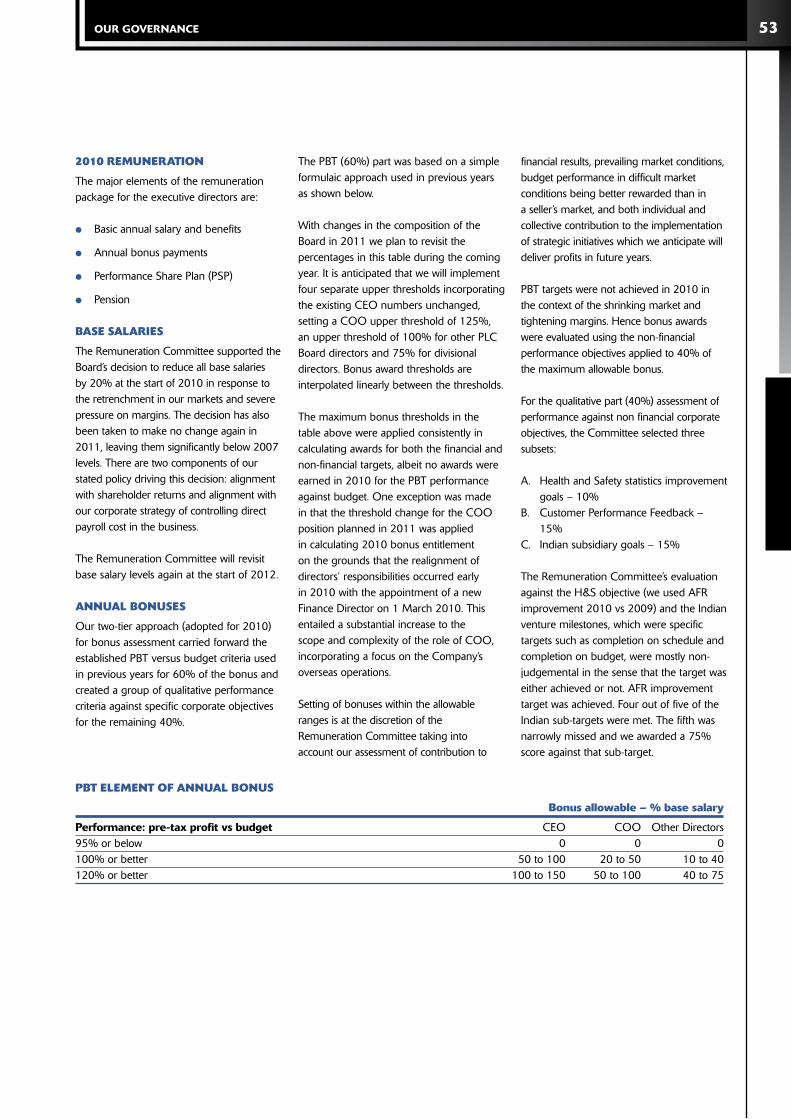
53 53
20155-04 27/04/2011 Proof 10
OUR gOvERNaNcE
2010 remuneratiOn
The major elements of the remuneration package for the executive directors are:
●● Basic annual salary and benefits
●● Annual bonus payments
●● Performance Share Plan (PSP)
●● Pension
Base salaries
The Remuneration Committee supported the Board’s decision to reduce all base salaries by 20% at the start of 2010 in response to the retrenchment in our markets and severe pressure on margins. The decision has also been taken to make no change again in 2011, leaving them significantly below 2007 levels. There are two components of our stated policy driving this decision: alignment with shareholder returns and alignment with our corporate strategy of controlling direct payroll cost in the business.
The Remuneration Committee will revisit base salary levels again at the start of 2012.
annual BOnuses
Our two-tier approach (adopted for 2010) for bonus assessment carried forward the established PBT versus budget criteria used in previous years for 60% of the bonus and created a group of qualitative performance criteria against specific corporate objectives for the remaining 40%.
The PBT (60%) part was based on a simple formulaic approach used in previous years as shown below.
With changes in the composition of the Board in 2011 we plan to revisit the percentages in this table during the coming year. It is anticipated that we will implement four separate upper thresholds incorporating the existing CEO numbers unchanged, setting a COO upper threshold of 125%, an upper threshold of 100% for other PLC Board directors and 75% for divisional directors. Bonus award thresholds are interpolated linearly between the thresholds.
The maximum bonus thresholds in the table above were applied consistently in calculating awards for both the financial and non-financial targets, albeit no awards were earned in 2010 for the PBT performance against budget. One exception was made in that the threshold change for the COO position planned in 2011 was applied in calculating 2010 bonus entitlement on the grounds that the realignment of directors’ responsibilities occurred early in 2010 with the appointment of a new Finance Director on 1 March 2010. This entailed a substantial increase to the scope and complexity of the role of COO, incorporating a focus on the Company’s overseas operations.
Setting of bonuses within the allowable ranges is at the discretion of the Remuneration Committee taking into account our assessment of contribution to
financial results, prevailing market conditions, budget performance in difficult market conditions being better rewarded than in a seller’s market, and both individual and collective contribution to the implementation of strategic initiatives which we anticipate will deliver profits in future years.
PBT targets were not achieved in 2010 in the context of the shrinking market and tightening margins. Hence bonus awards were evaluated using the non-financial performance objectives applied to 40% of the maximum allowable bonus.
For the qualitative part (40%) assessment of performance against non financial corporate objectives, the Committee selected three subsets:
A. Health and Safety statistics improvement goals – 10%
B. Customer Performance Feedback – 15%
C. Indian subsidiary goals – 15%
The Remuneration Committee’s evaluation against the H&S objective (we used AFR improvement 2010 vs 2009) and the Indian venture milestones, which were specific targets such as completion on schedule and completion on budget, were mostly non-judgemental in the sense that the target was either achieved or not. AFR improvement target was achieved. Four out of five of the Indian sub-targets were met. The fifth was narrowly missed and we awarded a 75% score against that sub-target.
pBt element OF annual BOnus
Bonus allowable – % base salary
performance: pre-tax profit vs budget CEO COO Other Directors95% or below 0 0 0100% or better 50 to 100 20 to 50 10 to 40120% or better 100 to 150 50 to 100 40 to 75

54 severfield—rowen plc Annual Report 2010
20155-04 27/04/2011 Proof 10
The customer feedback required judgement on behalf of both the customer and the Remuneration Committee. Five major customers were selected all of whom had active projects performed by Severfield–Rowen in 2010. The clients were given six categories of performance assessment including H&S, quality, cost, schedule and responsiveness. Each client designated a senior executive who was interviewed by a Remuneration Committee member after year-end and asked for assessments. The scores were consolidated and evaluated by the Remuneration Committee. Overall, the assessment was excellent with high scores from all clients in all categories and only very isolated negative comments. All five customers strongly affirmed their intention to work with Severfield–Rowen again in the future. The net result was an A+ scorecard evaluation by the Remuneration Committee.
In setting final bonuses the Remuneration Committee used the 2009 salaries as the reference point, having taken the view that it not been foreseen or planned to apply the percentages against reduced salaries.
Details of the bonuses paid for 2010 are set out in the table of directors’ emoluments on page 57. The bonus payments are not pensionable.
nOn-executive DirectOrs
The remuneration of non-executive directors is considered by the executive directors and reflects the time that they commit to the Company. Non-executive directors cannot participate in any of the annual bonus, long term incentive or the Company’s pension scheme.
The Executive Board has elected to reinstate the non-executives’ fees to pre-cut (2009) levels on 1 January 2011, recognising the generally held view that such fees are not intrinsically performance related, realising no benefit from profit improvement or shareholder returns.
perFOrmance sHare plan
Under the PSP rules shares are awarded at the start of a three-year period which can vest in whole or in part at the end of the
three year term subject to the achievement of a performance goal, the Performance Condition (PC). Participation is limited to the eight executive directors, comprising four Main Board directors and four divisional directors. The normal maximum limit for the value of shares comprising an award is 150% of salary in any year.
tHe perFOrmance cOnDitiOns
The PC is based on earnings per share (“EPS”) assessed at the end of a three-year performance period. The EPS targets range for each award is set by the Remuneration Committee, prior to grant, with a three-year look ahead.
vestinG recOrD & OutlOOk
2007–2009
The first awards under the PSP were made in 2007 to vest at the end of 2009 subject to achievement of the Performance Condition.
The Performance Condition target (EPS) at the end of 2009 fractionally exceeded that required to allow full vesting of the 2007 awards. These awards vested in 2010. The value of awards vesting in 2010 was relatively low at today’s share price as the number of shares awarded is factored against base salary at the time of the award and the prevailing share price at the time of award. The 2007 awards were made at a share price slightly above £5.
2008–2010
The 2008 awards will not vest in 2011 by reference to performance at the end of 2010. The PC was set at the start of 2008 when confidence was still good and a record year was ahead of us. The market, turnover and profit have all since declined in line with the market.
2009–2011
Based on the performance in 2010 the 2009 awards would not vest by reference to performance at the end of 2011. At the time of setting the PC a 2011 recovery was expected and a target range was set requiring 2011 EPS of between 25p and 40p. The CEO has announced previously
that this recovery has now slipped into 2012, meaning that the EPS range is currently well ahead of current analysts’ forecasts for 2011.
2010–2012
At the start of 2010 the lower threshold PC for the three-year period was carried forward unchanged from the last one at an EPS of 25p. The upper threshold was reduced from 40 to 35p. An EPS of 25p represents a PBT of approximately £30m, currently well ahead of analysts’ expectations for 2012.
2011–2013
Following three years of no vesting or at best low vesting we have elected this three-year cycle (2011–2013) to set a lower bottom threshold but an unchanged upper threshold; an EPS range 12.5p (PBT of approximately £15m) to 25.0p (PBT of approximately £30m). The Remuneration Committee is aiming to provide a meaningful incentive for the executives. Accordingly, the lower threshold is set taking into account Company and analysts’ forecasts and the upper thresholds at significantly more challenging levels.
psp aWarD levels
Attendant with setting the three year PC, as discussed in the previous paragraph, PSP awards will be granted at the start of 2011. The Remuneration Committee has elected to make awards in the range of 100% to 145% of base salary versus 150% maximum allowable in the PSP rules. Two Main Board directors will be granted 145% of base salary, two 125% and the four divisional directors will each receive 100% awards. Each award will only vest on achievement of the three year PC. The grant levels take account of the fact that these will be referenced off depressed base salary levels and are consistent with the philosophy expressed in the previous paragraph regarding incentives and director shareholdings.
DirectOrs’ REMUNERATION REPORT continued

55 55
20155-04 27/04/2011 Proof 10
OUR gOvERNaNcE
sHareHOlDinG GuiDeline
A policy was introduced in 2004 whereby executive directors will be required to retain shares acquired under long term incentive schemes until such time they have built up a holding equivalent in market value (at the date of vesting) to the executive’s base salary. Thereafter, the executive directors will be under a continuing obligation to maintain at least such a holding. The requirement underscores the Committee’s policy to align executive director remuneration and shareholder interests.
pensiOns
The Group contributes to each executive director’s money purchase pension fund. Contribution rates for each director are £50,000 pa plus 7% of base salary resulting in contribution levels in the range of 15–36% of base salary. Due to the widely publicised pension law changes the 7% contribution in future years will be expressed as base salary in lieu of pension contribution.
service cOntractsThe service contracts of executive directors run on a rolling basis and are no longer than 12 months duration. Notice periods of 12 months are required to be given by all parties.
Full details of the contracts of each director including the date, unexpired term and any payment obligations on early termination are available from the Company Secretary and will be available for inspection at the Annual General Meeting.
The 2009 Annual Report and Accounts confirmed the appointment of Alan Dunsmore as Finance Director on 1 March 2010 succeeding Peter Davison. Peter Davison stepped down as a director and employee at the annual general meeting on 3 June 2010 following 22 years of service.
The discussions on finance director succession planning had begun in mid 2009. The Board believed that the growth and diversification of the business warranted replacement planning with particular regard to international experience. Hence, the Board encouraged Peter Davison’s decision to accept early retirement. In this context the Remuneration Committee agreed to award Peter Davison an amount equivalent to 12 months’ salary and pension contributions in lieu of contractual notice on his departure.
In July 2010 Peter Davison was re-employed as Company Secretary on a part-time basis as an interim measure until such time as a new Company Secretary could be appointed. That appointment will be the subject of a separate announcement.

56 severfield—rowen plc Annual Report 2010
20155-04 27/04/2011 Proof 10
perFOrmance GrapH
The following graph shows the Company’s performance, measured by total shareholder return, compared with the performance of the FTSE Small Cap Index. It is based on the change in the value of a £100 investment made on 31 December 2005 over the five-year period ended 31 December 2010.
This index was selected as it represents a broad equity market index and an appropriate comparator group of companies over the period.
DirectOrs’ interests
The directors and their families had the following beneficial interests in the share capital of the Company: 31 december 31 December 2010 2009* 2.5p Ordinary 2.5p Ordinary Shares Shares
T J L Hayward 30,000 30,000T G Haughey 246,611 135,667P A Emerson 160,312 71,556A D Dunsmore 10,000 —J K Elliott 200,000 200,000D P Ridley 74,000 74,000G H Wright 4,000 4,000J Dodds — —* Or date of appointment
There have been no changes in the directors’ interests between the year end and 18 April 2011.
DirectOrs’ REMUNERATION REPORT continued
change in value of a £100 investment over 5 years
0
50
100
150
200
250
0
50
100
150
200
250
31 Dec 2005 31 Dec 2006 31 Dec 2007 31 Dec 2008 31 Dec 2009 31 Dec 2010
Severfield-Rowen
FTSE Small Cap Index

57 57
20155-04 27/04/2011 Proof 10
OUR gOvERNaNcE
auDiteD inFOrmatiOnaGGreGate DirectOrs’ remuneratiOn
The total amounts for directors’ remuneration were as follows: 2010 2009 £000 £000
Emoluments — salaries, bonus and taxable benefits 1,389 1,989 — fees 197 228 — compensation for loss of office 287 —Money purchase pension contributions 219 215 2,092 2,432
DirectOrs’ emOluments
Details of the directors’ emoluments are as follows: Compensation Basic for loss Taxable 2010 2009 salary Fees Bonus of office benefits total Total £000 £000 £000 £000 £000 £000 £000
ExecutiveT G Haughey 309 — 232 — 27 568 961P A Emerson 247 — 150 — 24 421 626A D Dunsmore (from 1/3/10) 184 — 65 — 62 311 —P J Davison (until 3/6/10) 74 — — 287 15 376 402Non-ExecutiveT J L Hayward 68 — — — 68 85J K Elliott 48 — — — 48 60D P Ridley 30 — — — 30 38G H Wright 36 — — — 36 45J Dodds (from 1/10/10) 15 — — — 15 —aggregate emoluments 814 197 447 287 128 1,873 2,217
Taxable benefits include the provision of company cars, fuel for company cars and private medical insurance. Additionally, in 2010 amounts include £45,000 in relation to relocation payments to A D Dunsmore.
Following his retirement as Finance Director P J Davison was paid £25,000 in his role as Company Secretary.

58 severfield—rowen plc Annual Report 2010
20155-04 27/04/2011 Proof 10
DirectOrs’ pensiOn entitlements
The executive directors are members of the Group’s money purchase pension schemes. Contributions paid by the Company in respect of these schemes in the year are as follows: 2010 2009 £000 £000
T G Haughey 72 77
P A Emerson 67 72A D Dunsmore (from 1/3/10) 54 —P J Davison (until 3/6/10) 26 66aggregate entitlements 219 215
DirectOrs’ sHare OptiOns
There are no share options outstanding at 31 December 2010 (2009: None).
The market price of the shares at 31 December 2010 was 308p and the range during the year was 177.2p to 313.2p.
annual DeFerreD BOnus sHare scHeme
Under the terms of the Severfield–Rowen Plc 1999 Annual Deferred Bonus Share Scheme no deferred share awards (as defined in the Scheme Rules) were made in 2010.
There were no bonus shares outstanding at 31 December 2010.
perFOrmance sHare plan
Under the Company’s Performance Share Plan the following awards over shares in issue at 31 December 2010 will vest with the directors subject to achievement of the performance criteria described on pages 54 and 55: Number of Number of Number of Total Shares vesting Shares vesting Shares vesting Number in 2011 in 2012 in 2013 of Shares
T G Haughey 182,912 252,451 189,338 624,701P A Emerson 146,330 201,961 151,471 499,762A D Dunsmore — — 125,613 125,613D Randall — 117,810 70,686 188,496total 329,242 572,222 537,108 1,438,572
Under the Company’s Performance Share Plan, the following shares vested during 2010:
Number of Shares
T G Haughey 110,944P A Emerson 88,756total 199,700
apprOval
This report was approved by the Board of directors and signed on behalf of the Board.
j K ElliottChairman of Remuneration Committee
27 April 2011
DirectOrs’ REMUNERATION REPORT continued

59 59
20155-04 27/04/2011 Proof 10
OUR gOvERNaNcE
DirectOrs’ RESPONSIBILITIES STATEMENT
The directors are responsible for preparing the Annual Report and the financial statements in accordance with applicable law and regulations.
Company law requires the directors to prepare financial statements for each financial year. Under that law the directors are required to prepare the Group financial statements in accordance with International Financial Reporting Standards (IFRSs) as adopted by the European Union and Article 4 of the IAS Regulation and have elected to prepare the parent company financial statements in accordance with United Kingdom Generally Accepted Accounting Practice (United Kingdom Accounting Standards and applicable law). Under company law the directors must not approve the accounts unless they are satisfied that they give a true and fair view of the state of affairs of the Company and of the profit or loss of the Company for that period.
In preparing the parent company financial statements, the directors are required to:
●● select suitable accounting policies and then apply them consistently;
●● make judgements and accounting estimates that are reasonable and prudent;
●● state whether applicable UK Accounting Standards have been followed, subject to any material departures disclosed and explained in the financial statements; and
●● prepare the financial statements on the going concern basis unless it is inappropriate to presume that the Company will continue in business.
In preparing the Group financial statements, International Accounting Standard 1 requires that directors:
●● properly select and apply accounting policies;
●● present information, including accounting policies, in a manner that provides relevant, reliable, comparable and understandable information;
●● provide additional disclosures when compliance with the specific requirements in IFRSs are insufficient to enable users to understand the impact of particular transactions, other events and conditions on the entity’s financial position and financial performance; and
●● make an assessment of the Company’s ability to continue as a going concern.
The directors are responsible for keeping adequate accounting records that are sufficient to show and explain the Company’s transactions and disclose with reasonable accuracy at any time the financial position of the Company and enable them to ensure that the financial statements comply with the Companies Act 2006. They are also responsible for safeguarding the assets of the Company and hence for taking reasonable steps for the prevention and detection of fraud and other irregularities.
The directors are responsible for the maintenance and integrity of the corporate and financial information included on the Company’s website. Legislation in the United Kingdom governing the preparation and dissemination of financial statements may differ from legislation in other jurisdictions.
respOnsiBility statement
We confirm that to the best of our knowledge:
●● the financial statements, prepared in accordance with the relevant financial reporting framework, give a true and fair view of the assets, liabilities, financial position and profit or loss of the Company and the undertakings included in the consolidation taken as a whole; and
●● the management report, which is incorporated into the Directors’ Report, includes a fair review of the development and performance of the business and the position of the Company and the undertakings included in the consolidation taken as a whole, together with a description of the principal risks and uncertainties that they face.
By order of the Board
t g haughey a d dunsmoreChief Executive Finance Director
27 April 2011

20155-04 27/04/2011 Proof 11
60 Severfield—Rowen Plc Annual Report 2010
GROUP ACCOUNTS CONTENTS
62 Independent Auditor’s Report
63 Consolidated Income Statement
64 Consolidated Statement of Comprehensive Income
65 Consolidated Balance Sheet
66 Consolidated Statement of Changes in Equity
67 Consolidated Cash Flow Statement
68 Notes to the Consolidated Financial Statements
99 Five Year Summary
99 Financial Calendar

61
20155-04 27/04/2011 Proof 11
GROUP ACCOUNTS 61
diSTRibUTiON & iNdUSTRiAl SECTORS
PROjeCT News International lOCATiON Broxbourne
PROjeCT British Gypsum lOCATiON East Leake
PROjeCT �Bombardier Manufacturing & Assembly Facility
lOCATiON Belfast
PROjeCT Co-op lOCATiON Andover

20155-04 27/04/2011 Proof 11
62 Severfield—Rowen Plc Annual Report 2010
iNdEPENdeNT AUDITOR’S REPORT TO THE MEMBERS OF SEVERFIELD–ROWEN PlcWe have audited the Group financial statements of Severfield–Rowen Plc for the year ended 31 December 2010 which comprise the Consolidated Income Statement, the Consolidated Statement of Comprehensive Income, the Consolidated Balance Sheet, the Consolidated Cash Flow Statement, the Consolidated Statement of Changes in Equity and the related notes 1 to 32. The financial reporting framework that has been applied in their preparation is applicable law and International Financial Reporting Standards (IFRSs) as adopted by the European Union.
This report is made solely to the Company’s members, as a body, in accordance with Chapter 3 of Part 16 of the Companies Act 2006. Our audit work has been undertaken so that we might state to the Company’s members those matters we are required to state to them in an auditor’s report and for no other purpose. To the fullest extent permitted by law, we do not accept or assume responsibility to anyone other than the Company and the Company’s members, as a body, for our audit work, for this report, or for the opinions we have formed.
RESPECTivE RESPONSibiliTiES Of diRECTORS ANd AUdiTOR
As explained more fully in the Directors’ Responsibilities Statement, the directors are responsible for the preparation of the Group financial statements and for being satisfied that they give a true and fair view. Our responsibility is to audit and express an opinion on the Group financial statements in accordance with applicable law and International Standards on Auditing (UK and Ireland). Those standards require us to comply with the Auditing Practices Board’s Ethical Standards for Auditors.
SCOPE Of ThE AUdiT Of ThE fiNANCiAl STATEmENTSAn audit involves obtaining evidence about the amounts and disclosures in the financial statements sufficient to give reasonable assurance that the financial statements are free from material misstatement, whether caused by fraud or error. This includes an assessment of: whether the accounting
policies are appropriate to the Group’s circumstances and have been consistently applied and adequately disclosed; the reasonableness of significant accounting estimates made by the Directors; and the overall presentation of the financial statements.
In addition, we read all the financial and non-financial information in the annual report to identify material inconsistencies with the audited financial statements. If we become aware of any apparent material misstatements or inconsistencies we consider the implications for our report.
OPiNiON ON fiNANCiAl STATEmENTS
In our opinion the Group financial statements:
●● give a true and fair view of the state of the Group’s affairs as at 31 December 2010 and of its profit for the year then ended;
●● have been properly prepared in accordance with IFRSs as adopted by the European Union; and
●● have been prepared in accordance with the requirements of the Companies Act 2006 and Article 4 of the IAS Regulation.
OPiNiON ON OThER mATTER PRESCRibEd by ThE COmPANiES ACT 2006
In our opinion:
●● the part of the Directors’ Remuneration Report to be audited has been properly prepared in accordance with the Companies Act 2006; and
●● the information given in the Directors’ Report for the financial year for which the financial statements are prepared is consistent with the Group financial statements.
mATTERS ON whiCh wE ARE REqUiREd TO REPORT by ExCEPTiONWe have nothing to report in respect of the following:
Under the Companies Act 2006 we are required to report to you if, in our opinion:
●● certain disclosures of Directors’ remuneration specified by law are not made; or
●● we have not received all the information and explanations we require for our audit.
Under the Listing Rules we are required to review:
●● the Directors’ statement contained within the Directors’ Report in relation to going concern;
●● the part of the corporate governance statement relating to the Company’s compliance with the nine provisions of the June 2008 Combined Code specified for our review; and
●● certain elements of the report to shareholders by the Board on Directors’ remuneration.
OThER mATTER
We have reported separately on the parent company financial statements of Severfield–Rowen Plc for the year ended 31 December 2010.
Simon Manning (Senior Statutory Auditor)for and on behalf of Deloitte LLPChartered Accountants and Statutory Auditor Leeds, United Kingdom28 April 2011

63
20155-04 27/04/2011 Proof 11
GROUP ACCOUNTS 63
CONSOlidATed INCOME STATEMENTYear ended 31 December 2010
Before Before Other Other Other Other items items Total Items Items Total 2010 2010 2010 2009 2009 2009 Note £000 £000 £000 £000 £000 £000
Continuing operations
Revenue 3 266,692 — 266,692 349,417 — 349,417
Cost of sales (242,568) 2,000 (240,568) (288,658) (2,283) (290,941)
Gross profit 24,124 2,000 26,124 60,759 (2,283) 58,476
Other operating income 510 — 510 568 — 568
Distribution costs (1,937) — (1,937) (2,123) — (2,123)
Administrative expenses (6,127) (4,821) (10,948) (7,425) (6,889) (14,314)
Movements in the valuation ofderivative financial instruments — 39 39 — 3,440 3,440
Operating profit before share ofresults of associates 16,570 (2,782) 13,788 51,779 (5,732) 46,047
Share of results of associates (366) (1,394) (1,760) 49 (991) (942)
Operating profit 4 16,204 (4,176) 12,028 51,828 (6,723) 45,105
Investment revenue 6 55 — 55 131 — 131
Finance costs 6 (976) — (976) (1,145) — (1,145)
Profit before tax 15,283 (4,176) 11,107 50,814 (6,723) 44,091
Tax 7 (4,160) 686 (3,474) (14,383) 1,605 (12,778)
Profit for the period attributable tothe equity holders of the parent 11,123 (3,490) 7,633 36,431 (5,118) 31,313
Earnings per share: 9
Basic 12.50p (3.92p) 8.58p 41.11p (5.77p) 35.34p
Diluted 12.50p (3.92p) 8.58p 40.91p (5.75p) 35.16p
Other items relate to pre-operating losses of the Group’s Indian Joint Venture, the amortisation of acquired intangibles, movements in the valuation of derivative financial instruments, the impairment of investment property, a partial release of a legal provision and the associated tax impact of these items together with the impact of corporation tax rate reductions on the Group’s deferred tax liability. In 2009, other items also included the one-off impairment of capitalised development costs and restructuring costs. The 2009 other items total has been reanalysed from the 2009 financial statements to present pre-operating loss for the Indian JV as a non-operating item consistent with 2010. These items have been disclosed separately in order to give an indication of the underlying earnings of the Group.

20155-04 27/04/2011 Proof 11
64 Severfield—Rowen Plc Annual Report 2010
CONSOlidATed STATEMENT OF COMPREHENSIVE INCOMEYear ended 31 December 2010
2010 2009 Note £000 £000
Total profit for the period attributable to equity holders of the parent 7,633 31,313
Actuarial loss on defined benefit pension scheme 30 (440) (2,091)
Tax relating to components of other comprehensive income 20 123 586
Total comprehensive income for the year attributable to equityholders of the parent 7,316 29,808

65
20155-04 27/04/2011 Proof 11
GROUP ACCOUNTS 65
CONSOlidATed BALANCE SHEET31 December 2010
2010 2009 Note £000 £000
Assets
Non-current assets
Goodwill 10 54,712 54,712
Other intangible assets 11 20,495 23,244
Property, plant and equipment 12 82,949 84,907
Investment property 12 4,000 6,135
Interests in associates 14 2,857 1,733
165,013 170,731
Current assets
Inventories 15 12,633 9,810
Trade and other receivables 17 71,861 54,655
Cash and cash equivalents 3,589 11,548
88,083 76,013
Total assets 253,096 246,744
liabilities
Current liabilities
Trade and other payables 18 75,868 82,565
Financial liabilities — borrowings 21 18,629 —
Financial liabilities — derivative financial instruments 21 108 147
Tax liabilities 5,217 6,034
99,822 88,746
Non-current liabilities
Retirement benefit obligations 30 8,532 8,407
Deferred tax liabilities 20 13,199 14,516
Provisions 19 600 2,600
22,331 25,523
Total liabilities 122,153 114,269
Net assets 130,943 132,475
Equity
Share capital 23 2,231 2,215
Share premium 46,152 46,152
Other reserves 24 169 1,065
Retained earnings 82,391 83,043
Total equity 130,943 132,475
The financial statements were approved by the Board of Directors on 27 April 2011 and signed on its behalf by:
T G Haughey A d dunsmoreDirector Director

20155-04 27/04/2011 Proof 11
66 Severfield—Rowen Plc Annual Report 2010
CONSOlidATed STATEMENT OF CHANGES IN EqUITYYear ended 31 December 2010
Share Share Other Retained Total capital premium reserves earnings equity £000 £000 £000 £000 £000
At 1 January 2009 2,215 46,152 439 70,957 119,763
Profit for the period (attributableto equity holders of the parent) — — — 31,313 31,313
Actuarial loss on definedbenefit pension scheme — — — (2,091) (2,091)
Deferred income taxes ondefined benefit pension scheme — — — 586 586
Dividends paid — — — (17,722) (17,722)
Share-based payments — — 626 — 626
At 31 December 2009 2,215 46,152 1,065 83,043 132,475
Share Share Other Retained Total capital premium reserves earnings equity £000 £000 £000 £000 £000
At 1 January 2010 2,215 46,152 1,065 83,043 132,475
Profit for the period (attributableto equity holders of the parent) — — — 7,633 7,633
Actuarial loss on definedbenefit pension scheme — — — (440) (440)
deferred income taxes ondefined benefit pension scheme — — — 123 123
dividends paid — — — (8,883) (8,883)
Share-based payments 16 — (896) 915 35
At 31 december 2010 2,231 46,152 169 82,391 130,943

67
20155-04 27/04/2011 Proof 11
GROUP ACCOUNTS 67
2010 2009 Note £000 £000
Net cash from operating activities 25 (11,203) 52,134
Cash flows from investing activities
Proceeds from sale of property, plant and equipment 225 1,260
Purchases of property, plant and equipment (3,025) (4,847)
Interest received 61 144
Purchases of shares of associates (2,884) (2,443)
Net cash used in investing activities (5,623) (5,886)
Cash flows from financing activities
Interest paid (879) (1,223)
Repayment of borrowings — (27,673)
Borrowings taken out 18,629 —
Dividends paid (8,883) (17,722)
Net cash used in financing activities 8,867 (46,618)
Net decrease in cash and cash equivalents (7,959) (370)
Cash and cash equivalents at beginning of period 11,548 11,918
Cash and cash equivalents at end of period 3,589 11,548
CONSOlidATed CASH FLOW STATEMENTYear ended 31 December 2010

20155-04 27/04/2011 Proof 11
68 Severfield—Rowen Plc Annual Report 2010
1. Significant accounting policies
Basis of accountingThe financial statements have been prepared in accordance with International Financial Reporting Standards (IFRS). The financial statements have also been prepared in accordance with IFRS adopted for use in the European Union and therefore comply with Article 4 of the EU IAS Regulation. The financial statements have been prepared on the historical cost basis, except for the revaluation of financial instruments. The principal accounting policies adopted are set out below.
The Group has applied IFRS 3 ‟Business Combinations” — revision effective for accounting periods beginning on or after 1 July 2009, in the year. IFRS 3 will impact upon the treatment of any acquisition-related costs (for instance finder’s fees, advisory, legal, accounting, valuation and other professional or consulting fees incurred on the acquisition of new businesses), with such costs being expensed in the period. IFRS 3 also impacts upon the treatment of contingent consideration associated with acquisitions. There has been no impact of the application of this standard in the current year. The impact on the Group’s Accounts in future periods will depend upon the number and significance of any acquisitions arising.
In addition to the standard detailed above, the following standards have been adopted in the current period, which have had no material impact on the Accounts:
●● IAS 24 (revised) “Related Party Disclosures”;
●● IAS 27 “Consolidated and Separate Financial Statements — Cost of an Investment in a Subsidiary, Jointly Controlled Entity or Associate” — (revised), effective for accounting periods beginning on or after 1 July 2009; and
●● IAS 39 “Financial Instruments: Recognition and Measurement — Eligible Hedged Items” revision applies retrospectively for accounting periods beginning on or after 1 July 2009.
Going concernAfter making enquiries, the directors have formed a judgement at the time of approving the financial statements that there is a reasonable expectation that the Group has adequate resources to continue in operational existence for the foreseeable future. For this reason the directors continue to adopt a going concern basis in preparing the financial statements. The key factors considered by the directors in making the statement are set out within the Financial Review on pages 22 to 24.
basis of consolidationThe consolidated financial statements incorporate the financial statements of the Company and all subsidiaries for the financial year ended 31 December 2010.
The results of subsidiaries acquired or disposed of during the year are included in the Consolidated Income Statement from the effective date of acquisition or up to the effective date of disposal, as appropriate.
Where necessary, adjustments are made to the financial statements of subsidiaries to bring the accounting policies used into line with those used by the Group.
All intra-Group transactions, balances, income and expenses are eliminated on consolidation.
Consolidated income statement disclosureIn order to give an indication of the underlying earnings of the Group, certain items are presented in the middle column of the Consolidated Income Statement entitled “Other Items”. In 2010 these comprise:
●● pre-operating losses of the Group’s Indian Joint Venture;
●● amortisation of acquired intangibles;
●● movements in the valuation of derivative financial instruments;
●● impairment of investment property;
●● partial release of a legal provision; and
●● the associated tax impact of the above items together with the impact of future reductions in corporation tax rates on the Group’s deferred tax liability.
business combinations The acquisition of subsidiaries is accounted for using the acquisition method. The cost of the acquisition is measured at the aggregate of the fair values, at the date of exchange, of assets given, liabilities incurred or assumed, and equity instruments issued by the Group in exchange for control of the acquiree, plus any costs directly attributable to the business combination. The acquiree’s identifiable assets, liabilities and contingent liabilities that meet the conditions for recognition under IFRS 3 are recognised at their fair value at the acquisition date.
NOTeS TO THe CONSOLIDATED FINANCIAL STATEMENTSYear ended 31 December 2010

69
20155-04 27/04/2011 Proof 11
GROUP ACCOUNTS 69
investments in associatesAn associate is an entity over which the Group is in a position to exercise significant influence, but not control through participation in the financial and operating policy decisions of the investee. Significant influence is the power to participate in the financial and operating policy decisions of the investee but is not control over those policies.
The results and assets and liabilities of associates are incorporated in these financial statements using the equity method of accounting unless it meets the exceptions described in IAS 28. Investments in associates are carried in the balance sheet at cost as adjusted by post-acquisition changes in the Group’s share of the net assets of the associate, less any impairment in the value of individual investments. Losses of the associates in excess of the Group’s interest in those associates are not recognised unless, and only to the extent that, the Group has incurred legal or constructive obligations on behalf of the associates.
Any excess of the cost of acquisition over the Group’s share of the fair values of the identifiable net assets of the associate at the date of acquisition is recognised as goodwill. Any deficiency of the cost of acquisition below the Group’s share of the fair values of the identifiable net assets of the associate at the date of acquisition (i.e. discount on acquisition) is credited in the Consolidated Income Statement in the period of acquisition.
The Consolidated Income Statement includes the Group’s share of associates’ profit less losses while the Group’s share of the net assets of the associates is shown in the Consolidated Balance Sheet.
GoodwillGoodwill which is recognised as an asset is reviewed for impairment at least annually. Any impairment is recognised immediately as a loss and is not subsequently reversed.
For the purpose of impairment testing, goodwill is allocated to each of the Group’s cash-generating units expected to benefit from the synergies of the combination. Cash-generating units to which goodwill has been allocated are tested for impairment annually, or more frequently when there is an indication that the unit may be impaired. If the recoverable amount of the cash-generating unit is less than the carrying amount of the unit, the impairment loss is allocated first to reduce the carrying amount of any goodwill allocated to the unit and then to the other assets of the unit pro rata on the basis of the carrying amount of each asset in the unit. An impairment loss recognised for goodwill is not reversed in a subsequent period.
On disposal of a subsidiary, associate or jointly controlled entity, the attributable amount of goodwill is included in the determination of the profit or loss on disposal.
Goodwill arising on acquisitions before the date of transition to IFRS has been retained at the previous UK GAAP amounts subject to being tested for impairment at that date. Goodwill arising prior to 1 January 1998 of £1,122,000 was taken directly to reserves in the year in which it arose. Such goodwill has not been reinstated on the balance sheet.
Negative goodwill arising on acquisition is recognised immediately in the Consolidated Income Statement.
Revenue recognitionRevenue from construction contracts is recognised in accordance with the Group’s accounting policy on construction contracts (see below).
Interest income is accrued on a time basis, by reference to the principal outstanding and at the effective interest rate applicable.
Dividend income from investments is recognised when the shareholders’ rights to receive payment have been established.
Construction contractsProfit is recognised on contracts, if the final outcome can be assessed reliably, by including in the income statement revenue and related cost as contract activity progresses. Revenue is calculated as the proportion of total contract value which corresponds to the proportion of costs incurred to date to total expected costs for that contract. Variations in contract work, claims and incentive payments are included in Revenue to the extent that there is appropriate certainty that they will be accepted by the customer and can be measured reliably.
Where the outcome of a construction contract cannot be estimated reliably, contract revenue is recognised to the extent contract costs have been incurred and it is probable they will be recoverable. Contract costs are recognised as expenses in the period in which they are incurred.
When it is probable that total contract costs will exceed total contract revenue, the expected loss is recognised as an expense immediately.

20155-04 27/04/2011 Proof 11
70 Severfield—Rowen Plc Annual Report 2010
leasesLeases are classified as finance leases whenever the terms of the lease transfer substantially all the risks and rewards of ownership to the lessee. All other leases are classified as operating leases.
Amounts payable under operating leases are charged to the income statement on a straight-line basis over the lease term.
Property, plant and equipment acquired under finance leases are capitalised in the balance sheet at fair value and depreciated in accordance with the Group’s accounting policy. The capital element of the leasing commitment is included as obligations under finance leases. The rentals payable are apportioned between interest, which is charged to the income statement, and capital, which reduces the outstanding obligation.
Operating profitOperating profit is stated after charging any restructuring costs, impairment and amortisation charges, gains or losses arising on the fair value of foreign exchange derivative contracts and after the share of results of associates and the impact of any movements in legal provisions but before investment income and finance costs.
Additionally, in 2010 we present an additional, non-statutory, heading, “Operating Profit before results of Associates” to assist in isolating the impact of the Group’s Indian Joint Venture. This also excludes the results of two other non-material Associates.
Retirement benefit costsThe Group operates two defined contribution pension schemes and costs of these schemes are charged to the income statement in the period in which they are incurred.
In addition, Atlas Ward, acquired on 31 March 2005, has a defined benefit scheme which is now closed. The liability in respect of this scheme is the present
value of the defined benefit obligation at the balance sheet date, less the fair value of the plan assets, together with adjustments for actuarial gains/losses.
The finance cost of liabilities and expected return of assets are included within administrative expenses in the Consolidated Income Statement.
The actuarial gain/loss is charged through the Consolidated Statement of Comprehensive Income and is made up of the difference between the expected return on assets and those actually achieved, the difference between the actuarial assumptions for liabilities and actual experience in the period and any changes in the assumptions used in the valuations.
The pension scheme deficit is recognised in full and presented on the face of the Consolidated Balance Sheet. The associated deferred tax asset is recognised within the net deferred tax liability within non-current liabilities in the Consolidated Balance Sheet.
TaxationThe tax expense represents the sum of the tax currently payable and deferred tax.
The tax currently payable is based on taxable profit for the year. Taxable profit differs from net profit as reported in the income statement because it excludes items of income or expense that are taxable or deductible in other years and it further excludes items that are never taxable or deductible. The Group’s liability for current tax is calculated using tax rates that have been enacted or substantively enacted by the balance sheet date. Deferred tax is the tax expected to be payable or recoverable on differences between the carrying amounts of assets and liabilities in the financial statements and the corresponding tax bases used in the computation of taxable profit, and is accounted for using the balance sheet liability method. Deferred tax
liabilities are generally recognised for all taxable temporary differences and deferred tax assets are recognised to the extent that it is probable that taxable profits will be available against which deductible temporary differences can be utilised. Such assets and liabilities are not recognised if the temporary difference arises from the initial recognition of goodwill or from the initial recognition (other than in a business combination) of other assets and liabilities in a transaction that affects neither the tax profit nor the accounting profit.
The carrying amount of deferred tax assets is reviewed at each balance sheet date and reduced to the extent that it is no longer probable that sufficient taxable profits will be available to allow all or part of the asset to be recovered.
Deferred tax is calculated at the tax rates that are expected to apply in the period when the liability is settled or the asset is realised. These are determined based on future changes in tax rates that have been enacted rather than simply future changes that have been proposed but not enacted. Deferred tax is charged or credited in the income statement, except when it relates to items charged or credited directly to equity, in which case the deferred tax is also dealt with in equity.
Deferred tax assets and liabilities are offset when there is a legally enforceable right to set off current tax assets against current tax liabilities and when they relate to income taxes levied by the same taxation authority and the Group intends to settle its current tax assets and liabilities on a net basis.
dividendsDividends are recorded in the Group’s financial statements in the period in which they are declared, appropriately authorised and no longer at the discretion of the Company.
NOTeS TO THe CONSOLIDATED FINANCIAL STATEMENTS continuedYear ended 31 December 2010

71
20155-04 27/04/2011 Proof 11
GROUP ACCOUNTS 71
Property, plant and equipmentLand and buildings held for use in the production or supply of goods or services, or for administrative purposes, and plant and machinery are currently stated at cost in the balance sheet. Depreciation on buildings is charged to income.
Depreciation is provided on other property, plant and equipment to write off the cost of each asset over its estimated useful life at the following rates:
Freehold buildings/ 1% straight-line Investment propertiesPlant and machinery 10% straight-lineFixtures, fittings 10% written downand office valueequipmentComputer 20% straight-lineequipment Motor vehicles 25% written down valueSite safety 20% straight-lineequipment
Assets held under finance leases are depreciated over their expected useful lives on the same basis as owned assets or, where shorter, over the term of the relevant lease.
The gain or loss arising on the disposal or retirement of an asset is determined as the difference between the sales proceeds and the carrying amount of the asset and is recognised in income.
investment propertyInvestment property, which is property held to earn rentals and/or for capital appreciation, is stated at the lower of cost or directors’ valuation. Depreciation will be charged annually based on the Group’s stated depreciation policy together with an annual impairment review. Where properties have been impaired below cost and are being held at directors’ valuation the directors have taken appropriate external guidance on the likely current value of properties. No investment properties have been subject to formal external valuation.
intangiblesThe Group recognises intangible assets at cost less accumulated amortisation and impairment losses. Acquired intangible assets arise as a result of applying IFRS 3 which requires the separate recognition of intangible assets from goodwill on all business combinations from 1 January 2004.
Intangible assets are amortised on a straight-line over their useful economic lives as follows:
Amortisation period
Customer relationships 10 yearsBrands 25 yearsKnow-how 10 yearsOrder book 18 months(now fully amortised)
impairment of tangible and intangible assets excluding goodwillAt each balance sheet date, the Group reviews the carrying amounts of its tangible and intangible assets to determine whether there is any indication that those assets have suffered an impairment loss. If any such indication exists, the recoverable amount of the asset is estimated in order to determine the extent of the impairment loss (if any). Where the asset does not generate cash flows that are independent from other assets, the Group estimates the recoverable amount of the cash-generating unit to which the asset belongs. An intangible asset with an indefinite useful life is tested for impairment annually and whenever there is an indication that the asset may be impaired.
Recoverable amount is the higher of fair value less costs to sell and value in use. In assessing value in use, the estimated future cash flows are discounted to their present value using a pre-tax discount rate that reflects current market assessments of the time value of money and the risks specific to the asset for which the estimates of future cash flows have not been adjusted.
If the recoverable amount of an asset (or cash-generating unit) is estimated to be less than its carrying amount, the carrying amount of the asset (or cash-generating unit) is reduced to its recoverable amount. An impairment loss is recognised as an expense immediately, unless the relevant asset is carried at a revalued amount, in which case the impairment loss is treated as a revaluation decrease.
Where an impairment loss subsequently reverses, the carrying amount of the asset (or cash-generating unit) is increased to the revised estimate of its recoverable amount, but so that the increased carrying amount does not exceed the carrying amount that would have been determined had no impairment loss been recognised for the asset (or cash-generating unit) in prior years. A reversal of an impairment loss is recognised as income immediately, unless the relevant asset is carried at a revalued amount, in which case the reversal of the impairment loss is treated as a revaluation increase.
inventoriesInventories are stated at the lower of cost and net realisable value. Cost comprises direct materials and, where applicable, direct labour costs and those overheads that have been incurred in bringing the inventories to their present location and condition. Net realisable value represents the estimated selling price less all estimated costs of completion and costs to be incurred in marketing, selling and distribution.

20155-04 27/04/2011 Proof 11
72 Severfield—Rowen Plc Annual Report 2010
financial instrumentsFinancial assets and financial liabilities are recognised on the Group’s Balance Sheet when the Group becomes a party to the contractual provisions of the instrument.
Trade receivablesTrade receivables are classified as loans and receivables, and therefore measured at amortised cost using the effective interest method.
Cash and cash equivalentsCash and cash equivalents comprise cash in hand and demand deposits, and other short-term highly liquid investments that are readily convertible to a known amount of cash and are subject to an insignificant risk of changes in value.
bank borrowingsInterest-bearing bank loans and overdrafts are recorded at the proceeds received, net of direct issue costs. Finance charges, including premiums payable on settlement or redemption and direct issue costs, are accounted for in the income statement using the effective interest method and are added to the carrying amount of the instrument to the extent that they are not settled in the period in which they arise. The effective interest method is a method of calculating the amortised cost of a financial liability and of allocating interest over the relevant period.
Trade payablesTrade payables are initially measured at fair value, and are subsequently measured at amortised cost.
Equity instrumentsEquity instruments issued by the Company are recorded at the proceeds received, net of direct issue costs.
Share-based payment transactionsThe Group issues equity-settled share-based payments. These share-based payments are measured at fair value at the date of grant based on the Group’s estimate of shares that will eventually vest. The fair value determined is then expensed in the Consolidated Income Statement on a straight-line basis over the vesting period, with a corresponding increase in equity. Details regarding the determination of the fair value of equity-settled share-based transactions are set out in note 22.
ProvisionsProvisions are recognised when the Group has a present obligation as a result of a past event, and it is probable that the Group will be required to settle that obligation. Provisions are measured at the directors’ best estimate of the expenditure required to settle the obligation at the balance sheet date, and are discounted to present value where the effect is material.
derivative financial instrumentsThe Group enters into certain foreign exchange forward contracts to manage its exposure to currency movements. Further details of derivative financial instruments are disclosed in note 21 to the financial statements.
Derivatives are initially recognised at fair value at the date a derivative contract is entered into and are subsequently remeasured to their fair value at each balance sheet date. The resulting gain or loss is recognised in profit or loss.
2. Critical accounting judgements and key sources of estimation uncertainty
Key sources of estimation uncertaintyThe key assumptions concerning the future, and other key sources of estimation uncertainty at the balance sheet date, that have a significant risk of causing a material adjustment to the carrying amounts of assets and liabilities within the next financial year, are also discussed below.
Revenue and margin recognitionThe Group’s revenue recognition and margin recognition are central to the way the Group values the work it has carried out in each financial year. These policies require forecasts to be made of the outcomes of long-term construction contracts, which require assessments and judgements to be made on recovery of pre-contract costs, changes in work scopes, contract programmes and maintenance liabilities.
The Group applies rigorous internal control procedures over the determination of each of the above variables to ensure that profit take as at the balance sheet date and the extent of future costs to contract completion are reasonably and consistently determined.
NOTeS TO THe CONSOLIDATED FINANCIAL STATEMENTS continuedYear ended 31 December 2010

73
20155-04 27/04/2011 Proof 11
GROUP ACCOUNTS 73
Retirement benefit obligationsDetails of the Group’s defined pension scheme are set out in note 30. The scheme has been valued in accordance with IAS 19 “Employee Benefits”. At 31 December 2010 the defined benefit obligation recognised on the Group’s balance sheet was £8,532,000. The benefit obligation is calculated using a number of assumptions including increases in pension benefits, mortality rates and inflation and the future investment returns from the scheme’s assets. The present value of the benefit obligations is calculated by discounting the benefit obligation using market rates on relevant AA corporate bonds at the balance sheet date.
The scheme’s assets are valued at market rates at the balance sheet date. Effects of changes in the actuarial assumptions underlying the benefit obligation, discount rates and the difference between expected and actual returns on the scheme’s assets are classified as actuarial gains and losses.
Critical judgements in applying the Group’s accounting policiesIn the process of applying the Group’s accounting policies, which are described in note 1, management has made the following judgements that have the most significant effect on the amounts recognised in the financial statements. Those judgements involving estimations are dealt with below.
Impairment of goodwill and intangible assets arising from acquisitionsDetermining whether goodwill or associated intangible assets are impaired requires an estimation of the value in use of the cash-generating units to which these assets have been allocated. The value in use calculation requires the entity to estimate the future cash flows expected to arise from the cash-generating unit and a suitable discount rate in order to calculate present value. The carrying amount of goodwill at the balance sheet date was £54,712,000 and of intangible assets arising from acquisitions was £20,495,000. No impairment adjustment has been made for the year ended 31 December 2010.
Impairment of investment propertyIn the absence of formal valuation, determining the carrying value of the Group’s investment property requires an assessment of fair value. The key factors considered by the directors in determining fair value are the possible open market valuation and rental yields on the property. The written down value of the Group’s investment property as at the balance sheet date was £4,000,000 following an impairment charge of £2,073,000 made in the year.

20155-04 27/04/2011 Proof 11
74 Severfield—Rowen Plc Annual Report 2010
NOTeS TO THe CONSOLIDATED FINANCIAL STATEMENTS continuedYear ended 31 December 2010
3. Revenue and segmental analysisRevenueAn analysis of the Group’s revenue is as follows: 2010 2009 £000 £000
Revenue from construction contracts 266,692 349,417Total revenue 266,692 349,417
Other operating income 510 568Interest received 55 131Total income 267,257 350,116
Segmental resultsFollowing adoption of IFRS 8, the Group has identified its operating segments as those upon which the Executive Committee regularly assesses performance.
The Group has deemed it appropriate to aggregate its operating segments into one reported segment. The constituent operating segments have been aggregated as they have businesses that have similar products and services, production processes, types of customer, methods of distribution, regulatory environments, and economic characteristics.
Revenue, which relates wholly to construction contracts and related activities in both years, originated from the United Kingdom.
Revenues by product groupAll revenue is derived from construction contracts and related assets.
Geographical informationThe Group’s revenue from external customers are detailed below: 2010 2009 £000 £000
Revenue by destination:United Kingdom 260,528 325,403Republic of Ireland and mainland Europe 3,632 23,227Other countries 2,532 787 266,692 349,417
All revenue originated from the United Kingdom and all non-current assets of the Group are located in the United Kingdom.
information about major customersIncluded in revenues is approximately £93.1 million (2009: £176.3 million) in relation to sales from three (2009: four) customers who individually contribute over 10% to combined Group revenue.

75
20155-04 27/04/2011 Proof 11
GROUP ACCOUNTS 75
4. Operating profit 2010 2009Operating profit for the year has been arrived at after crediting: £000 £000
Rent receivable 487 550Unrealised gains on derivative financial instruments 39 3,440
and after charging:Amortisation of intangible assets (note 11) 2,749 4,408Impairment of capitalised development costs (note 11) — 2,481Depreciation on owned assets (note 12) 4,503 5,173Depreciation and impairment of investment properties (note 12) 2,135 62Loss on sale of property, plant and equipment 165 220Auditor’s remuneration — audit 167 136 — other services 103 136Rentals under operating leases— hire of plant and machinery 2,542 3,137— other operating leases 2,068 2,407Staff costs (note 5) 52,166 64,009Restructuring costs — 2,283
The restructuring costs in 2009 were the redundancy costs in association with the reduction in capacity across the Group of approximately 20% which included a reduction of 15% in the number of employees.
The analysis of auditor’s remuneration is as follows: 2010 2009 £000 £000
Fees payable to the Company’s auditor for the audit of the Company’s annual accounts 16 16Fees payable to the Company’s auditor and their associates for other services to the Group— The audit of the Company’s subsidiaries pursuant to legislation 151 120Total audit fees 167 136
Tax services— advisory and compliance services 103 136
Total non-audit fees 103 136

20155-04 27/04/2011 Proof 11
76 Severfield—Rowen Plc Annual Report 2010
NOTeS TO THe CONSOLIDATED FINANCIAL STATEMENTS continuedYear ended 31 December 2010
5. directors and employeesDetails of directors’ remuneration for the year are provided in the audited part of the Directors’ Remuneration Report on pages 57 and 58.
The average number of persons employed by the Group (including executive directors) during the year was:
2010 2009 Number Number
Production 927 1,068Site 204 208Sales and administration 48 54 1,179 1,330
The aggregate payroll costs of these persons were as follows: 2010 2009 £000 £000
Wages and salaries 44,973 54,626Social security costs 5,199 6,487Other pension costs 1,994 2,896 52,166 64,009
6. investment revenue and finance costs 2010 2009 £000 £000
Interest receivable 55 131
Interest on bank borrowings (976) (1,145)
Net interest payable (921) (1,014)

77
20155-04 27/04/2011 Proof 11
GROUP ACCOUNTS 77
7. Taxa) The tax charge comprises: 2010 2009 £000 £000
Current taxUK corporation tax charge at 28.0% (2009: 28.0%) based on profits for the year 5,161 13,661Adjustments to prior years’ tax provision (586) (367)Total current tax 4,575 13,294
deferred taxCurrent year credit (note 20) (1,234) (542)Adjustments to prior years’ provision 133 26Total deferred tax (1,101) (516)
Total tax on profit on ordinary activities 3,474 12,778
b) Tax reconciliationThe charge for the year can be reconciled to the profit per the income statement as follows: 2010 2009 £000 £000
Profit before tax 11,107 44,091Tax on Group profit on ordinary activities at standardUK corporation tax rate of 28.0% (2009: 28.0%) 3,110 12,346Expenses not deductible for tax purposes 708 764Non-qualifying profit on disposal — 11Unprovided deferred tax movement (2) (2)Impairment of fixed assets 599 —Adjustments to prior years’ provisions (453) (341)Rate differences (488) —income tax expense for the year 3,474 12,778
Rate differences arise through the enacted reduction (as at 31 December 2010) in corporation tax rates from 28.0% to 27.0% effective April 2011 reducing the level of the Group’s deferred tax liabilities. This item is treated as non-underlying.
8. dividends 2010 2009 £000 £000
Amounts recognised as distributions to equity holders in the period:Second interim dividend for the year ended 31 December 2009 of 5.00p (2008: Nil) per share 4,430 —Final dividend for the year ended 31 December 2009 of Nil (2008: 10.00p) per share — 8,861Interim dividend for the year ended 31 December 2010 of 5.00p (2009: 10.00p) per share 4,453 8,861 8,883 17,722
Proposed final dividend for the year ended 31 December 2010 of 2.50p (2009: Nil) per share 2,231 —

20155-04 27/04/2011 Proof 11
78 Severfield—Rowen Plc Annual Report 2010
NOTeS TO THe CONSOLIDATED FINANCIAL STATEMENTS continuedYear ended 31 December 2010
9. Earnings per shareThe calculation of the basic and diluted earnings per share is based on the following data:
Earnings 2010 2009
£000 £000
Earnings for the purposes of basic earnings per share being net profit attributable to equity holders of the parent company 7,633 31,313Earnings for the purposes of underlying basic earnings per share being underlying net profit attributable to equity holders of the parent company 11,123 36,431
Number Number
Number of sharesWeighted average number of ordinary shares for the purposes of basic earnings per share 88,973,821 88,607,876Effect of dilutive potential ordinary shares:Share-based payments scheme — 440,816Weighted average number of ordinary shares for the purposes of diluted earnings per share 88,973,821 89,048,692
Basic earnings per share 8.58p 35.34pUnderlying basic earnings per share 12.50p 41.11pDiluted earnings per share 8.58p 35.16pUnderlying diluted earnings per share 12.50p 40.91p
Reconciliation of earnings 2010 2009 £000 £000
Net profit attributable to equity holders of the parent company 7,633 31,313Other items 3,490 5,118Underlying net profit attributable to equity holders of the parent company 11,123 36,431
Further details of others items are given in the Consolidated Income Statement.

79
20155-04 27/04/2011 Proof 11
GROUP ACCOUNTS 79
10. Goodwill £000
CostAt 1 January 2009 and 31 December 2010 54,740
Accumulated impairment lossesAt 1 January 2009 28Impairment losses for the year —At 1 January 2010 28Impairment losses for the year —At 31 december 2010 28
Carrying amountAt 31 december 2009 and 31 december 2010 54,712
The carrying value of goodwill is allocated to cash generating units (CGUs) as follows: £000
On the Fisher Engineering acquisition in 2007 47,980On the Atlas Ward acquisition in 2005 6,571On the Watson Steel Structures acquisition in 2001 161 54,712
The Group tests goodwill annually for impairment, or more frequently if there are indications that goodwill might be impaired.
The recoverable amounts of goodwill are determined from value in use calculations. The key assumptions for the value in use calculations are those regarding the discount rates, growth rates and expected changes to selling prices and direct costs during the period. The directors estimate discount rates using pre-tax rates that reflect current market assessments of the time value of money and the risks specific to the CGUs. Changes in selling prices and direct costs are based on past practices and expectations on future changes in the market. It is anticipated that sales volumes in the UK will not increase materially over the next three years.
The Group prepares forecast cash flows based on the following years operating budget, approved by the directors, together with cash flows based on budgets for the following two years which are derived from the directors’ views on revenue prospects to the end of 2013 (this equates to a compound annual growth rate from 2010 levels of 4%). After this period, the growth rate applied to the cash flow forecasts is the projected economic growth rate for the industry. The cash flow forecasts have been discounted using a pre-tax discount rate of 9% (2009: 11%).
The Group has conducted a sensitivity analysis on the impairment test for the Fisher Engineering goodwill. A reduction in growth rates to 1% in 2012–13 and flat thereafter would result in the recoverable amount of goodwill being reduced to its carrying value of £48.0 million.

20155-04 27/04/2011 Proof 11
80 Severfield—Rowen Plc Annual Report 2010
11. Other intangible assets Intangible assets
acquired on Development acquisition costs Total £000 £000 £000
CostAt 1 January 2009 39,000 2,756 41,756Additions — — —At 1 January 2010 39,000 2,756 41,756Additions — — —At 31 december 2010 39,000 2,756 41,756
AmortisationAt 1 January 2009 11,348 275 11,623Charge for the year 4,408 — 4,408Impairment loss — 2,481 2,481At 1 January 2010 15,756 2,756 18,512Charge for the year 2,749 — 2,749At 31 december 2010 18,505 2,756 21,261
Carrying amount At 31 december 2010 20,495 — 20,495At 31 December 2009 23,244 — 23,244
The intangible assets acquired on acquisition arise as a result of applying IFRS 3 which requires the separate recognition of acquired intangibles from goodwill. During 2007 the acquisition of Fisher Engineering Limited resulted in intangible assets as follows: Customer relationships Brands Order book Know-how Total £000 £000 £000 £000 £000
Cost At 1 january 2009 and 31 december 2010 25,800 3,200 9,600 400 39,000
AmortisationAt 1 January 2009 3,200 158 7,940 50 11,348Charge for the year 2,580 128 1,660 40 4,408At 31 December 2009 5,780 286 9,600 90 15,756Charge for the year 2,581 128 — 40 2,749At 31 december 2010 8,361 414 9,600 130 18,505
Net book valueAt 31 december 2010 17,439 2,786 — 270 20,495At 31 December 2009 20,020 2,914 — 310 23,244
Amortisation of acquired intangibles is included in the Consolidated Income Statement as part of Administrative expenses and is classified within the middle column entitled “Other items”.
The amortisation period for each category of intangible asset is disclosed in the Statement of Significant Accounting Policies on page 71.
NOTeS TO THe CONSOLIDATED FINANCIAL STATEMENTS continuedYear ended 31 December 2010

81
20155-04 27/04/2011 Proof 11
GROUP ACCOUNTS 81
12. Property, plant and equipment, investment property
Freehold and Fixtures, long leasehold fittings Investment land and Plant and and office Motor property buildings machinery equipment vehicles Total £000 £000 £000 £000 £000 £000
Cost At 1 January 2009 6,197 62,166 37,789 1,680 3,245 111,077Additions — 3,698 667 117 365 4,847Disposals — (253) (1,794) — (810) (2,857)At 1 January 2010 6,197 65,611 36,662 1,797 2,800 113,067Additions — 9 2,414 222 288 2,933Disposals — — (857) — (785) (1,642)At 31 december 2010 6,197 65,620 38,219 2,019 2,303 114,358
Accumulated depreciation Depreciation At 1 January 2009 — 981 14,997 987 1,202 18,167Charge for the year 62 434 3,997 214 528 5,235Disposals — — (896) — (481) (1,377)At 1 January 2010 62 1,415 18,098 1,201 1,249 22,025Charge for the year 62 468 3,522 174 339 4,565Impairment loss 2,073 — — — — 2,073Disposals — — (764) — (490) (1,254)At 31 december 2010 2,197 1,883 20,856 1,375 1,098 27,409
Carrying amountAt 31 december 2010 4,000 63,737 17,363 644 1,205 86,949At 31 December 2009 6,135 64,196 18,564 596 1,551 91,042

20155-04 27/04/2011 Proof 11
82 Severfield—Rowen Plc Annual Report 2010
12. Property, plant and equipment, investment property continuedThe Group operates a system of regular valuations of freehold and long leasehold land and buildings across its portfolio which have included using FPD Savills and Rushton International Chartered Surveyors who are independent valuers not connected to the Group. This operates on a rotational basis, with one of the four main properties reviewed each year. The four properties are the Severfield–Reeve Structures Ltd site at Dalton Airfield Industrial Estate, the Watson Steel Structures Ltd site at Lostock Lane, Bolton, the Atlas Ward Structures Ltd site at Sherburn and the Fisher Engineering Ltd steel storage site at Enniskillen in Northern Ireland.
To date, no material surplus or deficit over net book value has been identified, and accordingly no adjustment to revalue freehold and long leasehold land and buildings has been considered necessary.
The net book value of the Group’s plant and machinery includes £Nil (2009: £Nil) in respect of assets held under finance leases.
The investment property represents land and buildings held in Leeds. The Group is receiving rental income on this property until the end of 2012 at a current rate of £378,000 per annum. This has been subject to an annual depreciation charge at 1% as required under the Group’s depreciation policy. As at 1 January 2010 the fair value of the property was £6,135,000. The directors have reviewed this carrying value as at 31 December 2010 and in view of the continued poor state of the property market and approaching end of the current lease consider an impairment charge to be appropriate. Following soundings over future divestment and leasehold potential a revised valuation of £4,000,000 is now considered appropriate. No independent valuation by an appropriately qualified surveyor has been obtained.
13. SubsidiariesThe Company has investments in the following significant subsidiary undertakings. All of the companies listed are registered in England.
Severfield–Reeve Structures Ltd — steel fabricationWatson Steel Structures Ltd — steel fabricationAtlas Ward Structures Ltd — steel fabricationFisher Engineering Ltd — steel fabricationRowen Structures Ltd — project contractingSteelcraft Erection Services Ltd — steel erectionSeverfield–Reeve International Ltd — overseas contracts
The Company owns the whole of the issued share capital of the subsidiaries noted above.
14. interests in associatesThe Company has an interest in two associated companies and a joint venture as follows:
Associated Companies: Holding % Class of capitalKennedy Watts Partnership Ltd — CAD/CAM steelwork design 25.1 Preferred ordinaryFabsec Ltd — development of fire beam 25.0 Ordinaryjoint Venture:JSW Severfield Structures Ltd — structural steelwork serving the Indian market 50.0 Ordinary
On 17 November 2008 a formal agreement was signed in India with JSW Building Systems Ltd (a subsidiary of JSW Steel Ltd of India) to form a 50/50 joint venture, JSW Severfield Structures Limited, to create a structural steelwork business in Bellary and Mumbai, India, serving primarily the Indian market. As set out in pages 10 to 11 the joint venture is now established and now undertaking its first contracts serving the Indian market.
NOTeS TO THe CONSOLIDATED FINANCIAL STATEMENTS continuedYear ended 31 December 2010

83
20155-04 27/04/2011 Proof 11
GROUP ACCOUNTS 83
14. interests in associates continuedJSW Severfield Structures Limited is registered in India, and during the year, the Group invested a further £2,884,000 (2009: £2,443,000) in the joint venture.
Share of net Loans to assets/ associate Goodwill (liabilities) undertaking TotalGroup £000 £000 £000 £000
At 1 January 2009 362 (201) 71 232Losses retained — (942) — (942)Net assets acquired 208 2,235 — 2,443At 1 January 2010 570 1,092 71 1,733Net assets acquired (319) 3,203 — 2,884Losses retained — (1,760) — (1,760)At 31 december 2010 251 2,535 71 2,857
The Group’s share of the retained profit/(loss) for the year of the associates is made up as follows:
Kennedy Watts Partnership Fabsec JSW Severfield Ltd Ltd Structures Ltd Total £000 £000 £000 £000
Share of results (12) 10 (1,758) (1,760)
Summarised financial information in respect of the Group’s associates is as follows: 2010 2009 £000 £000
Total assets 34,125 6,125Total liabilities (29,423) (4,242)Net assets 4,702 1,883Group’s share of associates’ net assets 2,535 1,092Revenue 1,313 2,150(Loss)/profit after tax (3,582) (1,669)Group’s share of associates’ (loss)/profit after tax for the period (1,760) (942)
During the year ended 31 December 2005 the Board reviewed the investment of long-term loans outstanding from Fabsec Ltd of £614,000 and concluded that there was an element of doubt over the collection of this loan in the short to medium term. Consequently, after considering the net liabilities of Fabsec Ltd, a provision of £543,000 was made against the debt. This provision remains in place at 31 December 2010.
Additionally, on 3 February 2006 Severfield–Reeve Structures Ltd entered into a 50/50 joint venture agreement with Murray Metals Group Ltd to form Steel UK Ltd, a company involved in steel buying activities. To date, both parties have continued to purchase steel through the individual companies and no trade has passed through Steel UK Ltd. The share capital invested by the Group is a nominal sum of £50. Steel UK Ltd is registered in England.
15. inventories 2010 2009 £000 £000
Raw materials and consumables 3,518 3,345Work-in-progress 9,115 6,465 12,633 9,810
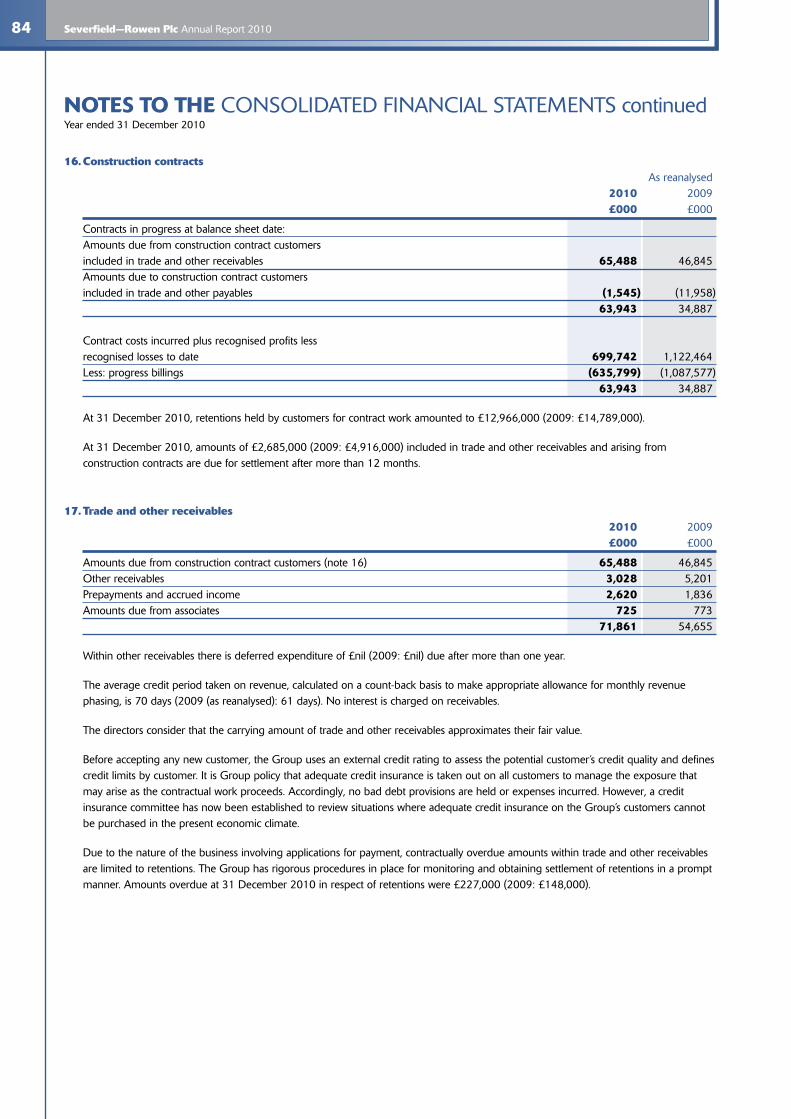
20155-04 27/04/2011 Proof 11
84 Severfield—Rowen Plc Annual Report 2010
NOTeS TO THe CONSOLIDATED FINANCIAL STATEMENTS continuedYear ended 31 December 2010
16. Construction contracts As reanalysed 2010 2009 £000 £000
Contracts in progress at balance sheet date:Amounts due from construction contract customers included in trade and other receivables 65,488 46,845Amounts due to construction contract customers included in trade and other payables (1,545) (11,958) 63,943 34,887
Contract costs incurred plus recognised profits less recognised losses to date 699,742 1,122,464Less: progress billings (635,799) (1,087,577) 63,943 34,887
At 31 December 2010, retentions held by customers for contract work amounted to £12,966,000 (2009: £14,789,000).
At 31 December 2010, amounts of £2,685,000 (2009: £4,916,000) included in trade and other receivables and arising from construction contracts are due for settlement after more than 12 months.
17. Trade and other receivables 2010 2009 £000 £000
Amounts due from construction contract customers (note 16) 65,488 46,845Other receivables 3,028 5,201Prepayments and accrued income 2,620 1,836Amounts due from associates 725 773 71,861 54,655
Within other receivables there is deferred expenditure of £nil (2009: £nil) due after more than one year.
The average credit period taken on revenue, calculated on a count-back basis to make appropriate allowance for monthly revenue phasing, is 70 days (2009 (as reanalysed): 61 days). No interest is charged on receivables.
The directors consider that the carrying amount of trade and other receivables approximates their fair value.
Before accepting any new customer, the Group uses an external credit rating to assess the potential customer’s credit quality and defines credit limits by customer. It is Group policy that adequate credit insurance is taken out on all customers to manage the exposure that may arise as the contractual work proceeds. Accordingly, no bad debt provisions are held or expenses incurred. However, a credit insurance committee has now been established to review situations where adequate credit insurance on the Group’s customers cannot be purchased in the present economic climate.
Due to the nature of the business involving applications for payment, contractually overdue amounts within trade and other receivables are limited to retentions. The Group has rigorous procedures in place for monitoring and obtaining settlement of retentions in a prompt manner. Amounts overdue at 31 December 2010 in respect of retentions were £227,000 (2009: £148,000).

85
20155-04 27/04/2011 Proof 11
GROUP ACCOUNTS 85
18. Trade and other payables As reanalysed 2010 2009 £000 £000
Trade creditors 31,314 18,172Other taxation and social security 3,795 6,283Other creditors and accruals 39,039 45,991Payments in advance (note 16) 1,545 11,958Amounts owed to associates and joint venture 175 161 75,868 82,565
The directors consider that the carrying amount of trade payables approximates their fair value.
The average credit period taken for trade purchases, calculated on a count-back basis to make appropriate allowance for monthly phasing, is 43 days (2009 (as reanalysed): 29 days).
The 2009 comparative figure has been reanalysed to better reflect the nature of the underlying balance; this also impacts the comparative payments in advance position in note 16.
19. Provisions 2010 2009 £000 £000
Contract legal provisions 600 2,600
Contract legal provisions relate to provisions on contracts including fault and warranty provisions, and are expected to be utilised within three years. Provision is made for the directors’ best estimate of known legal claims in progress.
20. deferred tax liabilitiesThe following are the major deferred tax liabilities and assets recognised by the Group and movements thereon during the current and prior reporting period. 2010 2009 £000 £000
Deferred tax liabilities (15,969) (17,299)Deferred tax assets 2,770 2,783Net deferred tax liability (13,199) (14,516)
The net deferred tax liability is made up as follows: 2010 2009 £000 £000
Excess capital allowances (10,312) (10,703)Other timing differences 314 300Intangible assets on acquisition of subsidiary (5,534) (6,508)Forward exchange contracts 29 41On retirement benefit obligations 2,304 2,354Net deferred tax liability (13,199) (14,516)

20155-04 27/04/2011 Proof 11
86 Severfield—Rowen Plc Annual Report 2010
NOTeS TO THe CONSOLIDATED FINANCIAL STATEMENTS continuedYear ended 31 December 2010
20. deferred tax liabilities continuedThe movement during the year in net deferred tax liability is as follows: 2010 2009 £000 £000
At 1 January (14,516) (15,618)Current year credit 1,234 542Adjustment in respect of prior years (40) (26)Deferred tax in relation to pension scheme losses 123 586At 31 December (13,199) (14,516)
The deferred tax assets reducing the deferred tax liability relate to 27% (2009: 28%) of the Group’s deficit on its defined benefit retirement scheme of £8,532,000, the valuation of financial instruments and other timing differences.
Unprovided deferred tax amounted to £71,000 (2009: Nil).
The Government announced in June 2010 that it intended to reduce the rate of corporation tax from 28% to 24% over four years, and the Finance Act 2010, which was substantively enacted in July 2010, includes provisions to reduce the rate of corporation tax to 27% with effect from 1 April 2011. Accordingly, deferred tax balances have been revalued to the lower rate of 27% in these accounts, which has resulted in a credit to the Consolidated Income Statement of £488,000.
On 23 March 2011 the Government announced that it intends to further reduce the rate of corporation tax to 26% with effect from 1 April 2011 and then by 1% per annum to 23% by 1 April 2014. As this legislation was not substantively enacted by 31 December 2010, the impact of the anticipated rate change is not reflected in the tax provisions reported in these accounts. If the deferred tax assets and liabilities of the Group were all to reverse after 1 April 2014, the effect of the changes from 27% to 23% would be to reduce the net deferred tax liability by approximately £1,900,000. To the extent that the deferred tax reverses more quickly than this the impact on the net deferred tax liability will be reduced.
21. financial instrumentsCapital risk managementThe Group manages its capital to ensure that entities in the Group will be able to continue as going concerns while maximising the return to stakeholders.
The capital structure of the Group consists of debt, which includes borrowings, cash and cash equivalents and equity attributable to equity holders of the parent, comprising issued capital, reserves and retained earnings.
Gearing ratioThe Board of Directors reviews the capital structure of the Group on a semi-annual basis. As part of this review, it considers the cost of capital and the risks associated with each class of capital.
The gearing ratio at the year end is as follows: 2010 2009 £000 £000
Borrowings (18,629) —Cash and cash equivalents 3,589 11,548Net (debt)/funds (15,040) 11,548Equity 130,943 132,475Net debt to equity ratio 11.5% Nil%
Equity includes all capital and reserves of the Group attributable to equity holders of the parent. There are no externally imposed capital requirements.
Significant accounting policiesDetails of the significant accounting policies and methods adopted, including the criteria for recognition, the basis of measurement and the basis on which income and expenses are recognised, in respect of each class of financial asset, financial liability and equity instrument are disclosed in note 1 to the financial statements.

87
20155-04 27/04/2011 Proof 11
GROUP ACCOUNTS 87
21. financial instruments continuedCategories of financial instruments Carrying value 2010 2009 £000 £000
Financial assetsCash and cash equivalents 3,589 11,548Amounts due from construction contract customers 65,488 46,845Financial liabilitiesTrade creditors (31,314) (18,172)Other payables (44,379) (64,232)Borrowings (18,629) —Derivative financial instruments (108) (147)
The Group is required to analyse financial instruments that are measured subsequent to initial recognition at fair value, grouped into Levels 1 to 3 based on the degree to which the fair value is observable:
●● Level 1 fair value measurements are those derived from quoted prices (unadjusted) in active markets for identical assets or liabilities;
●● Level 2 fair value measurements are those derived from inputs other than quoted prices included within Level 1 that are observable for the asset or liability, either directly (i.e. as prices) or indirectly (i.e. derived from prices); and
●● Level 3 fair value measurements are those derived from valuation techniques that include inputs for the asset or liability that are not based on observable market data (unobservable inputs).
Derivative financial instruments are the only instruments valued at fair value through profit or loss, and are valued as such on initial recognition. These relate to foreign currency forward contracts measured using quoted forward exchange rates and yield curves matching the maturities of the contracts. These derivative financial instruments are categorised as level 2 financial instruments. Except for derivative financial instruments, the carrying amounts of financial assets and financial liabilities are recorded at amortised cost in the financial statements and are considered to approximate their fair value.
Cash and cash equivalentsThis comprises cash held by the Group and short-term deposits with an original maturity of three months or less. The carrying amount of these assets approximates their fair value.
General risk management principlesThe Board has overall responsibility for the establishment and oversight of the Group’s risk management framework. A formal risk assessment and management framework for assessing, monitoring and managing the strategic operational and financial risks of the Group is in place to ensure appropriate risk management of its operations. Internal control and risk management systems are embedded in the operations of the divisions.

20155-04 27/04/2011 Proof 11
88 Severfield—Rowen Plc Annual Report 2010
21. financial instruments continuedfinancial risks and managementThe Group has exposure to a variety of financial risks through the conduct of its operations. Risk management is governed by the Group’s operational policies, which are subject to periodic review by the Board of directors.
Credit riskThe Group’s primary exposure to credit risk arises from the potential for non-payment or default from construction contract debtors. The degree to which the Group is exposed to this credit risk depends on the individual characteristics of the contract counterparty and the nature of the project. The Group’s credit risk is also influenced by the general macroeconomic conditions. The Group does not have significant concentration of risk in respect of amounts due from construction contract customers at the reporting date with them being spread across a wide range of customers. Due to the nature of the Group’s operations, it is normal practice for customers to hold retentions in respect of contracts completed. Retentions held by customers at 31 December 2010 were £12,966,000 (2009: £14,789,000).
The Group manages its exposure to credit risk through the application of its credit risk management policies which specify the minimum requirements in respect of the credit worthiness of potential customers, assessed through reports from credit agencies, and the timing and extent of progress payments in respect of contracts. In addition, before accepting any new customer adequate credit insurance is taken out as reported in Note 17. Where credit insurance is difficult to acquire, the credit insurance committee (comprising T G Haughey, P A Emerson and A D Dunsmore) convenes to determine the appropriate exposure for the Group to take with a customer.
The Group manages the collection of retentions through its post-completion project monitoring procedures and ongoing contact with customers so as to ensure that potential issues that could lead to the non-payment of retentions are addressed as soon as they are identified.
Amounts outstanding from construction contract customers are due with reference to the payment terms for each particular contract but the majority would be receivable within four months from the end of the reporting period. Amounts due for settlement after 12 months are disclosed in Note 16.
liquidity riskLiquidity risk is the risk that the Group will not be able to meet its financial obligations as and when they fall due. The ultimate responsibility for liquidity risk rests with the Board.
The Group generates cash through its operations and aims to manage liquidity by ensuring that it will always have sufficient liquidity to meet its liabilities when due, under both normal and stress conditions, without incurring unacceptable losses or risking damage to the Group’s reputation. Forecast and actual cash flow is continuously monitored.
Borrowings represent the Group’s revolving credit facility from the Royal Bank of Scotland and Clydesdale Bank Plc, a member of National Australia Bank Group jointly which provides credit support of up to £40 million at an interest rate of 2.25% or 2.75% above LIBOR subject to the ratio of Group net debt to EBITDA. This facility was renewed in March 2010 and is available for three years ending March 2013.
As at December 2010 £30 million was drawn down on this facility with £10 million of further facility not drawn but available.
NOTeS TO THe CONSOLIDATED FINANCIAL STATEMENTS continuedYear ended 31 December 2010

89
20155-04 27/04/2011 Proof 11
GROUP ACCOUNTS 89
21. financial instruments continuedliquidity risk continuedBorrowings outstanding, net of associated issue costs, at 31 December 2010 amounted to £18,629,000 (2009: £Nil).
IFRS 7 requires disclosure of the maturity of the Group’s remaining contractual financial liabilities. The tables below detail the Group’s remaining contractual maturity for its financial liabilities and assets:
2010 Analysis Maturity Analysis Balance sheet Less than 3 months 1–2 2–5 value 3 months to 1 year years years Total £000 £000 £000 £000 £000 £000
Current liabilitiesTrade and other payables 75,693 52,023 21,468 1,942 260 75,693Financial liabilities — borrowings1 18,629 — — 18,629 — 18,629Financial liabilities — derivativefinancial instruments2 108 72 36 — — 108Total 94,430 52,095 21,504 20,571 260 94,430
Current assetsCash and cash equivalents3 (3,589) (3,589) — — — (3,589)Total (3,589) (3,589) — — — (3,589)Grand total 90,841 48,506 21,504 20,571 260 90,841
2009 Analysis
Current liabilitiesTrade and other payables 82,404 62,766 18,580 1,058 — 82,404Financial liabilities — borrowings1 — — — — — —Financial liabilities — derivativefinancial instruments2 147 119 28 — — 147Total 82,551 62,885 18,608 1,058 — 82,551
Current assetsCash and cash equivalents3 (11,548) (11,548) — — — (11,548)Total (11,548) (11,548) — — — (11,548)Grand total 71,003 51,337 18,608 1,058 — 71,003
1 Details of the conditions applying to these borrowings are given above.2 The Group has no gross settled derivative financial instruments and, therefore, solely the pay leg has been disclosed within liabilities.3 Cash and cash equivalents have also been disclosed in order to present a full analysis of the Group’s financial assets.

20155-04 27/04/2011 Proof 11
90 Severfield—Rowen Plc Annual Report 2010
NOTeS TO THe CONSOLIDATED FINANCIAL STATEMENTS continuedYear ended 31 December 2010
21. financial instruments continuedmarket riskThe Group’s activities expose it primarily to the financial risks of changes in credit risks described above, in foreign currency exchange rates and interest rates. The Group has entered into a variety of derivative financial instruments to manage its exposure to foreign currency risk.
Market risk exposures are monitored and are supplemented by sensitivity analysis. There has been no change to the Group’s exposure to market risks or the manner in which it manages and measures the risk.
foreign currency risk managementThe Group undertakes certain transactions denominated in foreign currencies. Hence, exposures to exchange rate fluctuations arise. Exchange rate exposures are managed within approved policy parameters utilising forward foreign exchange contracts.
The Group seeks to minimise the effects of currency risks by using derivative financial instruments when appropriate to hedge these risk exposures against contracted sales. The use of financial derivatives is governed by the Group’s policies approved by the Board of Directors. The Group does not enter into or trade financial instruments including derivative financial instruments, for speculative purposes.
The carrying value of the Group’s foreign currency denominated monetary assets and monetary liabilities at the reporting date are as follows:
Liabilities Assets 2010 2009 2010 2009 £000 £000 £000 £000
Euro 97 (356) 2,065 3,575US dollar — — 1,348 11 97 (356) 3,413 3,586
foreign currency sensitivity analysisThe Group is only significantly exposed to the euro and US dollar.
The following table details the Group’s sensitivity to a 10% increase and decrease in sterling against the relevant foreign currencies. 10% is the sensitivity rate used when reporting foreign currency risk internally to key management personnel and represents management’s assessment of the reasonably possible change in foreign exchange rates. The sensitivity analysis includes only outstanding foreign currency denominated monetary items and derivative financial instruments, and adjusts their translation at the period end for a 10% change in foreign currency rates. A positive number below indicates an increase in profit and other equity where the sterling strengthens 10% against the relevant currency. For a 10% weakening of the sterling against the relevant currency, there would be an equal and opposite impact on the profit and other equity, and the balances below would be negative.
US dollar currency impact Euro currency impact 2010 2009 2010 2009 £000 £000 £000 £000
Profit or loss and equity 414 293 91 399
The Group’s sensitivity to euros has decreased in 2010 due to the reduced amount of work in the Republic of Ireland.
At present the Group’s translation exposure to the Indian Rupee via its Indian Joint Venture is not significant. Going forward, as the business grows, this exposure is expected to become more significant.
forward foreign exchange contractsIt is the policy of the Group to enter into forward foreign exchange contracts to cover future euro and US dollar currency receipts on relevant contracts.
At 31 December 2010, the Group had forward exchange contracts held for the sale of 1.20 million euros (2009: 6.78 million euros)and 8.49 million US dollars (2009: 6.40 million US dollars) at an average exchange rate of 1.1657 euros (2009: 1.1504 euros) and1.5720 US dollars (2009: 1.6045 US dollars) to the pound and maturing within 12 months of the year end.

91
20155-04 27/04/2011 Proof 11
GROUP ACCOUNTS 91
21. financial instruments continuedinterest rate risk managementThe Group is exposed to interest rate risk as described under the borrowings paragraph earlier in this note. The Group does not currently hedge any of its interest rate exposure.
interest rate sensitivity analysisThe sensitivity analysis below has been determined based on the exposure to interest rates at the balance sheet date. For floating rate liabilities, the analysis is prepared assuming the gross amount of liability outstanding at balance sheet date was outstanding for the whole year. A 0.5% increase or decrease is used when reporting interest rate risk internally to key management personnel and represents management’s assessment of the reasonably possible change in interest rates.
If interest rates had been 0.5% higher and all other variables were held constant, the Group’s profit for the year ended 31 December 2010 and the Group’s equity at that date would decrease by £150,000 (2009: £25,000). This is attributable to the Group’s exposure to interest rates on its variable rate borrowings. If the £40 million facility is fully utilised the exposure increases to £200,000.
The Group’s sensitivity to interest rates has increased during the current period due to the increase in the level of borrowings in the year. Current indications are that the level of Group borrowings will increase further during 2011 but remain within current facility limits.
22. Share-based paymentsThe Group operates a share-based incentive scheme open to all employees of the Group although the current intention is that only the Company’s executive directors (being both Main Board directors and certain members of the Executive Committee) and selected senior employees will participate in the scheme. Further details are given in the Directors’ Remuneration Report on pages 50 to 58. The Group recognised a total charge of £nil in the year (2009: charge of £626,000) with a corresponding entry to reserves.
Performance Share PlanThe vesting of awards is subject to performance conditions set by the Remuneration Committee. Four awards had been granted to 31 December 2010:
●● During 2007 the Remuneration Committee granted 65,827 ordinary shares of 10p each at nil value to the executive directors. Following the 4:1 share split in October 2007 these converted to 263,308 ordinary shares of 2.5p each. These shares vested during 2010.
●● During 2008 the Remuneration Committee granted a further 34,112 ordinary shares of 2.5p each at Nil value to the executive directors. These awards will not vest in 2011 by reference to the EPS performance over the performance period.
Company’s EPS performance over the performance period % of award vesting
Equal to less than RPI + 18% 0%Equal to RPI + 18% 25%Equal to RPI + 50% or better 100%Between RPI + 18% and RPI +50% Pro rata between 25% and 100%
The Black–Scholes pricing model has been used to measure the fair value of the shares granted. The assumptions used in the model are as follows:
Share price on date of grant £3.1675*Exercise price NilExpected volatility (using historic performance) 50%Risk-free rate 5%Dividend 20.0pExpected percentage options exercised versus granted NilActual life three years
* Granted on 30 April 2008.
The Black–Scholes model produced, using the above assumptions, an annual charge of £Nil.

20155-04 27/04/2011 Proof 11
92 Severfield—Rowen Plc Annual Report 2010
22. Share-based payments continued●● During 2009 the Remuneration Committee granted a further 599,151 ordinary shares of 2.5p each at Nil value to the executive
directors. The vesting of these awards will be dependent on the Company’s earnings per share performance over the three year period from 1 January 2009 to 31 December 2011, with the following vesting schedule to apply:
Company’s EPS performance for year ending 31 December 2011 % of award vesting
Equal to less than 25.0p 0%Equal to 30.0p 25%Equal to 40.0p or better 100%Between 25.0p and 30.0p Pro rata between 0% and 25%Between 30.0p and 40.0p Pro rata between 25% and 100%
The Black–Scholes pricing model has been used to measure the fair value of the shares granted. The assumptions used in the model are as follows:
Share price on date of grant £1.53*Exercise price NilExpected volatility (using historic performance) 50%Risk-free rate 5%Dividend 15.0pExpected percentage options exercised versus granted NilActual life three years
* Granted on 4 February 2009.
The Black–Scholes model produced, using the above assumptions, an annual charge of £Nil.
●● During 2010 the Remuneration Committee granted a further 793,072 ordinary shares of 2.5p each at Nil value to the executive directors. The vesting of these awards will be dependent on the Company’s earnings per share performance over the three year period from 1 January 2010 to 31 December 2012, with the following vesting vesting schedule to apply:
Company’s EPS performance for year ending 31 December 2012 % of award vesting
Equal to less than 25.0p 0%Equal to 35.0p or better 100%Between 25.0p and 35.0p Pro rata between 0% and 100%
The Black–Scholes pricing model has been used to measure the fair value of the shares granted. The assumptions used in the model are as follows:
Share price on date of grant £2.04*Exercise price NilExpected volatility (using historic performance) 50%Risk-free rate 5%Dividend 10.0pExpected percentage options exercised versus granted NilActual life three years
* Granted on 5 March 2010.
The Black–Scholes model produced, using the above assumptions, an annual charge of £Nil.
Share incentive PlanDuring 2010 the Group implemented a Share Incentive Plan for Group employees. As part of the scheme 202,384 new ordinary shares of 2.5p were issued which are being held in trust for a three year period on behalf of 973 Group employees. The vesting of these awards will be subject to continued employment for each of the relevant employees. Options are forfeited if the employee leaves the Group before the options vest. The share price on the date of issue of the shares (29 October 2010) was £2.41 and the fair value was measured based on the market price of the shares at the date of grant. The aggregate of the estimated values of the awards granted in 2010 is £488,000. A charge of £35,000 was recognised in the current year in relation to the Share Incentive Plan.
NOTeS TO THe CONSOLIDATED FINANCIAL STATEMENTS continuedYear ended 31 December 2010

93
20155-04 27/04/2011 Proof 11
GROUP ACCOUNTS 93
23. Share capital 2010 2009 £000 £000
Authorised:108,000,000 ordinary shares of 2.5p each 2,700 2,700
Issued and fully paid:89,251,076 ordinary shares of 2.5p each (2009: 88,607,876) 2,231 2,215
There are no share options outstanding as at 31 December 2010 (2009: Nil).
On 29 March 2010, 440,816 ordinary shares of 2.5p each were issued in relation to the vesting of shares under the Company’s Performance Share Plan. On 29 October 2010 202,384 ordinary shares of 2.5p each were issued in relation to the Group employee Share Incentive Plan.
24. Other reserves Share-based Other payment reserve reserves Total £000 £000 £000
Balance at 1 January 2009 300 139 439Share-based payments in year 626 — 626Balance at 1 January 2010 926 139 1,065Share-based payments in year (896) — (896)Balance at 31 december 2010 30 139 169
The movement in the share-based payment reserve comprises the following components: 2010 2009 £000 £000
Shares issued under Share Incentive Plan (5) —Share-based payments 35 626Vesting of shares under Share Performance Plan (926) —Total (896) 626
25. Notes to the cash flow statement 2010 2009 £000 £000
Operating profit from continuing operations 12,028 45,105Adjustments for:
Provision release (2,000) —Share of results of associated companies 1,760 942Depreciation of property, plant and equipment 4,503 5,173Depreciation/impairment of investment property 2,135 62Pension movements (317) (335)Loss on disposal of property, plant and equipment 165 220Share-based payments 35 626Amortisation of intangibles 2,749 4,408Impairment of capitalised development costs — 2,481Movement in valuation of derivative financial instruments (39) (3,440)
Operating cash flows before movements in working capital 21,019 55,242(Increase) in inventories (2,823) (1,483)(Increase)/decrease in receivables (17,212) 6,290(Decrease)/increase in payables (6,794) 5,320
Cash generated by operations (5,810) 65,369Tax paid (5,393) (13,235)Net cash flow (after tax) from operating activities (11,203) 52,134

20155-04 27/04/2011 Proof 11
94 Severfield—Rowen Plc Annual Report 2010
NOTeS TO THe CONSOLIDATED FINANCIAL STATEMENTS continuedYear ended 31 December 2010
26. Analysis of net funds/(debt) At At 31 1 January Cash december 2010 flow Borrowings 2010 £000 £000 £000 £000
Cash at bank and in hand 11,548 (7,959) — 3,589Borrowings — — (18,629) (18,629)Net funds/(debt) 11,548 (7,959) (18,629) (15,040)
27. Capital commitments 2010 2009 £000 £000
Contracted for but not provided in the financial statements 361 —
28. Contingent liabilitiesThe Company and its subsidiaries have provided unlimited multilateral guarantees to secure any bank overdrafts and loans of all other Group companies. At 31 December 2010 these amounted to £30,000,000 (2009: £29,472,0000). The Group has also given performance bonds in the normal course of trade.
29. Operating lease arrangementsThe Group as lesseeThe Group leases a number of its premises under operating leases which expire between 2010 and 2032.
The total future minimum lease rentals are as follows: 2010 2009 £000 £000
Minimum lease rentals due:— Within one year 1,297 —— After one year and within five years 5,436 18— After five years 11,484 19,338 18,217 19,356
The Group also leases certain items of plant and machinery and vehicles whose total future minimum lease rentals are as follows:
2010 2009 £000 £000
Minimum lease rentals due:— Within one year 1,923 344— After one year and within five years 1,142 3,620— After five years 133 998 3,198 4,962
The Group as lessorProperty rental income earned on owned properties during the year was £399,000 (2009: £444,000). The properties are expected to generate rental yields of 6.5% on an ongoing basis. The properties held have committed tenants for the next two to nine years. All operating lease contracts contain market review clauses in the event that the lessees exercise the options to renew. The lessees do not have an option to purchase the property at the expiry of the lease period.
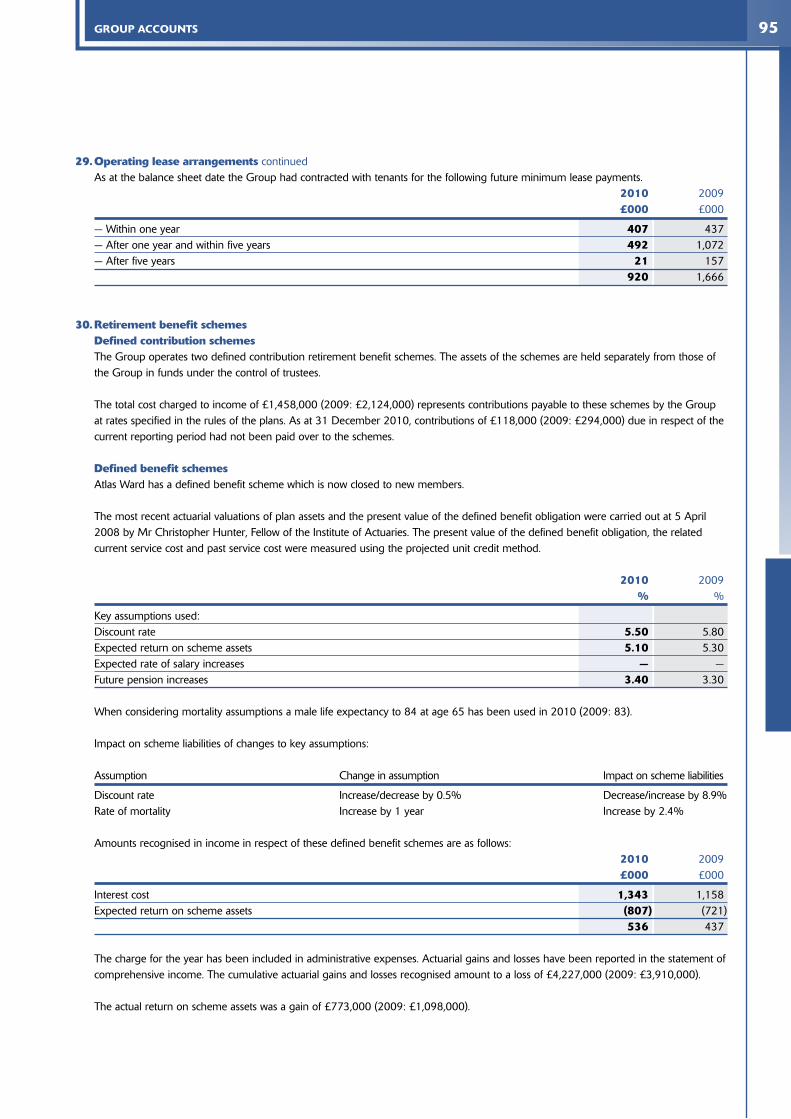
95
20155-04 27/04/2011 Proof 11
GROUP ACCOUNTS 95
29. Operating lease arrangements continuedAs at the balance sheet date the Group had contracted with tenants for the following future minimum lease payments. 2010 2009 £000 £000
— Within one year 407 437— After one year and within five years 492 1,072— After five years 21 157 920 1,666
30. Retirement benefit schemesdefined contribution schemesThe Group operates two defined contribution retirement benefit schemes. The assets of the schemes are held separately from those of the Group in funds under the control of trustees.
The total cost charged to income of £1,458,000 (2009: £2,124,000) represents contributions payable to these schemes by the Group at rates specified in the rules of the plans. As at 31 December 2010, contributions of £118,000 (2009: £294,000) due in respect of the current reporting period had not been paid over to the schemes.
defined benefit schemesAtlas Ward has a defined benefit scheme which is now closed to new members.
The most recent actuarial valuations of plan assets and the present value of the defined benefit obligation were carried out at 5 April 2008 by Mr Christopher Hunter, Fellow of the Institute of Actuaries. The present value of the defined benefit obligation, the related current service cost and past service cost were measured using the projected unit credit method.
2010 2009 % %
Key assumptions used:Discount rate 5.50 5.80Expected return on scheme assets 5.10 5.30Expected rate of salary increases — —Future pension increases 3.40 3.30
When considering mortality assumptions a male life expectancy to 84 at age 65 has been used in 2010 (2009: 83).
Impact on scheme liabilities of changes to key assumptions:
Assumption Change in assumption Impact on scheme liabilities
Discount rate Increase/decrease by 0.5% Decrease/increase by 8.9%Rate of mortality Increase by 1 year Increase by 2.4%
Amounts recognised in income in respect of these defined benefit schemes are as follows: 2010 2009 £000 £000
Interest cost 1,343 1,158Expected return on scheme assets (807) (721) 536 437
The charge for the year has been included in administrative expenses. Actuarial gains and losses have been reported in the statement of comprehensive income. The cumulative actuarial gains and losses recognised amount to a loss of £4,227,000 (2009: £3,910,000).
The actual return on scheme assets was a gain of £773,000 (2009: £1,098,000).

20155-04 27/04/2011 Proof 11
96 Severfield—Rowen Plc Annual Report 2010
NOTeS TO THe CONSOLIDATED FINANCIAL STATEMENTS continuedYear ended 31 December 2010NOTeS TO THe CONSOLIDATED FINANCIAL STATEMENTS continuedYear ended 31 December 2010
30. Retirement benefit schemes continuedThe amount included in the balance sheet arising from the Group’s obligations in respect of the Atlas Ward defined benefit retirement scheme is as follows: 2010 2009 2008 £000 £000 £000
Present value of defined benefit obligations (24,610) (23,459) (20,438)Fair value of scheme assets 16,078 15,052 13,787deficit in scheme (8,532) (8,407) (6,651)
Liability recognised in the balance sheet (8,532) (8,407) (6,651)
The major categories of scheme assets as a percentage of the total scheme assets are as follows:
2010 2009 % %
Equities 22.7 27.0Bonds 8.5 17.6Cash 65.6 45.9Property — 9.5Other 3.2 — 100.0 100.0
When investments are held in bonds and cash, the expected long-term rate of return is taken to be the yields generally prevailing on such assets at the balance sheet date. A higher rate of return is expected on equity investments, which is based more on realistic future expectations than on the returns that have been available historically. The overall expected long-term rate of return on assets is then the average of these rates taking into account the underlying asset portfolio of the pension plan.
Movements in the present value of defined benefit obligations were as follows: 2010 2009 £000 £000
At 1 January (23,459) (20,438)Interest cost (1,343) (1,158)Actuarial gains and losses (406) (2,468)Benefits paid 598 605At 31 december (24,610) (23,459)
Movements in the fair value of scheme assets were as follows: 2010 2009 £000 £000
At 1 January 15,052 13,787Expected return on scheme assets 807 721Actuarial gains and losses (34) 377Contributions from the sponsoring companies 851 772Benefits paid (598) (605)At 31 december 16,078 15,052
None of the scheme’s assets were invested in Atlas Ward or property occupied by Atlas Ward.
The Group expects to contribute £69,000 per month to its defined benefit pension scheme in the year to 31 December 2011.

97
20155-04 27/04/2011 Proof 11
GROUP ACCOUNTS 97
30. Retirement benefit schemes continuedHistory of experience of gains and losses: 2010 2009 2008 2007 2006
Experience gains and losses on scheme assets (£000) (34) 377 (1,674) (105) (418)Percentage of scheme assets (0.2%) 2.5% (12.1%) (0.7%) (3.0%)
Experience gains and losses on scheme liabilities (£000) 1,013 (223) (198) (373) 57Percentage of the present value of scheme liabilities 4.1% (1.0%) (1.0%) (1.8%) 0.3%
Total amount recognised in the Consolidated Statement of Comprehensive Income (£000) (440) (2,091) (190) 285 (1169)Percentage of the present value of scheme liabilities (1.8%) (8.9%) (0.9%) 1.3% (5.6%)
31. Related party transactionsThe remuneration of the directors, who are the key management personnel of the Group, is provided in the audited part of the Directors’ Remuneration Report on pages 57 and 58.
In addition to the Company’s executive directors members of the Executive Committee are also considered as key management personnel of the Group. Information about the remuneration of the additional directors who belong to the Executive Committee is as follows: 2010 2009 £000 £000
Short-term employee benefits 1,419 1,740Contributions into pension schemes 199 318 1,618 2,058
Short-term employee benefits include salary, bonus, the provision of company cars, fuel for company cars and private medical insurance.
The charge in relation to share-based payments is provided in Note 22 and relates to executive directors and members of the Executive Committee.
Transactions between the Company and its subsidiaries, which are related parties, have been eliminated on consolidation and are not disclosed in this note. Transactions between the Group and its associated undertakings are disclosed below.
During the year the Group purchased services in the ordinary course of business from Kennedy Watts Partnership Ltd at a cost of £751,000 (2009: £873,000). The amount outstanding at 31 December 2010 was £179,000 (2009: £161,000).
Loans outstanding from Fabsec Ltd at 31 December 2010 amounted to £594,000 (2009: £614,000). The directors continue to have doubts regarding the collectability of these loans and consequently a provision of £543,000 which was made in 2005 is still in place leaving a balance at 31 December 2010 of £51,000 (2009: £71,000). During the year the Group purchased services in the ordinary course of business from Fabsec Ltd at a cost of £132,000 (2009: £256,000). The amount outstanding at 31 December 2010 was £47,000 (2009: £19,000).
During the year the Group incurred additional operating costs in relation to the setting up and establishment of the joint venture in India of £1,004,000 (2009: £773,000). Those costs were re-charged to the joint venture company during the year and £725,000 remained outstanding at 31 December 2009.

20155-04 27/04/2011 Proof 11
98 Severfield—Rowen Plc Annual Report 2010
32. General informationSeverfield–Rowen Plc is a company incorporated in the United Kingdom under the Companies Act 2006. The address of the registered office is given on page 28. The nature of the Group’s operations and its principal activities are set out on pages 4 to 9. These financial statements are presented in pounds sterling because that is the currency of the primary economic environment in which the Group operates.
At the date of authorisation of these Accounts, there are a number of new standards and interpretations issued but not yet effective (some of which are pending endorsement by the European Union), which the Group has not applied in these Accounts. These principally include:
●● IFRS 7 (amendment) “Financial instruments: Disclosures on derecognition” — effective for accounting periods beginning on or after 1 July 2011;
●● IAS 12 (amendment) “Deferred tax: Recovery of underlying assets” — effective for accounting periods beginning on or after 1 January 2012;
●● IAS 32 (amendment) “Financial instruments: Presentation on classification of rights issues” — effective for accounting periods beginning on or after 1 February 2010;
●● IFRIC 14 “Prepayments of a minimum funding requirement” — effective for accounting periods beginning on or after 1 January 2011;
●● IFRIC 19 “Extinguishing financial liabilities with equity instruments” — effective for accounting periods beginning on or after 1 July 2010;
●● IFRS 1 (amendment) “Severe hyperinflation and removal of fixed dates for first time adopters” — effective for accounting periods beginning on or after 1 July 2011;
●● IFRS 9 “Financial Instruments” — revision effective for accounting periods beginning on or after 1 July 2013; and
●● Improvements to IFRS 2010 — effective for accounting periods beginning on or after 1 January 2011, with certain aspects on or after 1 July 2010.
The adoption of these standards in future periods is not expected to have a material impact on the financial results of the Group.
NOTeS TO THe CONSOLIDATED FINANCIAL STATEMENTS continuedYear ended 31 December 2010

99
20155-04 27/04/2011 Proof 11
GROUP ACCOUNTS 99
IFRS 2010 2009 2008 2007 2006 £000 £000 £000 £000 £000
Results
Revenue 266,692 349,417 394,325 300,656 295,084
Underlying* operating profit 16,204 51,828 55,107 42,684 29,118
Underlying* profit before tax 15,283 50,814 52,479 42,950 30,286
Non-underlying items (3,490) (5,118) (9,885) (4,590) —
Profit attributable to equity holdersof Severfield–Rowen Plc 7,633 31,313 23,976 26,434 20,921
Assets employed
Non-current assets 165,013 170,731 177,987 173,279 51,988
Net current (liabilities)/assets (11,739) (12,732) (33,355) (35,615) 25,266
Non-current liabilities (22,331) (25,524) (24,869) (20,835) (11,029)
Net assets 130,943 132,475 119,763 116,829 66,225
Key statistics
Earnings per share:
Basic — underlying* 12.50p 40.00p 42.20p 35.74p 25.64p
Basic 8.58p 35.34p 27.06p 31.77p 25.64p
Diluted — underlying* 12.50p 39.80p 42.15p 35.70p 25.64p
Diluted 8.58p 35.16p 27.02p 31.73p 25.64p
Dividends per share 7.50p 15.00p 20.00p 20.00p 14.25p
Dividend cover (times) — underlying* basis 1.3 2.7 2.1 1.8 1.8
Share price — high 313.20p 243.00p 460.00p 620.00p 412.00p
— low 177.20p 119.50p 131.25p 344.75p 241.50p
Key statistics for prior years have been restated to reflect the 4:1 share capital in October 2007.
* The basis of stating results on an underlying basis is set out on page 1.
Preliminary announcement of full year results 22 March 2011
Publication of Annual Report 28 April 2011
Annual General Meeting 8 June 2011
Payment of final dividend 16 June 2011
Announcement of interim results (provisional) 23 August 2011
fivE yEAR SUMMARY
fiNANCiAl CALENDAR

20155-04 27/04/2011 Proof 11
Severfield—Rowen Plc Annual Report 2010100
COmPANy ACCOUNTS CONTENTS
102 Independent Auditor’s Report
103 Company Balance Sheet
104 Notes to the Company Financial Statements

101
20155-04 27/04/2011 Proof 11
COMPANY ACCOUNTS 101
TRANSPORT, bRidGES & CAR PARKS SECTORS
PROjeCT Heathrow Terminal 2A lOCATiON London
PROjeCT Blackfriars Bridge Deck Replacement lOCATiON London
PROjeCT Thameslink Borough Viaduct Bridges lOCATiON London
PROjeCT St Pancras Station lOCATiON London
PROjeCT Link Bridge lOCATiON Stratford City, London

20155-04 27/04/2011 Proof 11
Severfield—Rowen Plc Annual Report 2010102
We have audited the parent company financial statements of Severfield–Rowen Plc for the year ended 31 December 2010 which comprise the Company Balance Sheet and the related notes 1 to 15. The financial reporting framework that has been applied in their preparation is applicable law and United Kingdom Accounting Standards (United Kingdom Generally Accepted Accounting Practice).
This report is made solely to the Company’s members, as a body, in accordance with Chapter 3 of Part 16 of the Companies Act 2006. Our audit work has been undertaken so that we might state to the Company’s members those matters we are required to state to them in an auditor’s report and for no other purpose. To the fullest extent permitted by law, we do not accept or assume responsibility to anyone other than the Company and the Company’s members as a body, for our audit work, for this report, or for the opinions we have formed.
Respective responsibilities of directors and auditorAs explained more fully in the Directors’ Responsibilities Statement, the directors are responsible for the preparation of the parent company financial statements and for being satisfied that they give a true and fair view. Our responsibility is to audit and express an opinion on the parent company financial statements in accordance with applicable law and International Standards on Auditing (UK and Ireland). Those standards require us to comply with the Auditing Practices Board’s Ethical Standards for Auditors.
Scope of the audit of the financial statementsAn audit involves obtaining evidence about the amounts and disclosures in the financial statements sufficient to give reasonable assurance that the financial statements are free from material misstatement, whether caused by fraud or error. This includes an assessment of: whether the accounting policies are appropriate to the Parent Company’s circumstances and have
been consistently applied and adequately disclosed; the reasonableness of significant accounting estimates made by the directors; and the overall presentation of the financial statements.
In addition, we read all the financial and non-financial information in the annual report to identify material inconsistencies with the audited financial statements. If we become aware of any apparent material misstatements or inconsistencies we consider the implications for our report.
Opinion on financial statementsIn our opinion the Parent Company financial statements:
●● give a true and fair view of the state of the Parent Company’s affairs as at 31 December 2010;
●● have been properly prepared in accordance with United Kingdom Generally Accepted Accounting Practice; and
●● have been prepared in accordance with the requirements of the Companies Act 2006.
Opinion on other matters prescribed by the Companies Act 2006In our opinion the information given in the Directors’ Report for the financial year for which the financial statements are prepared is consistent with the parent company financial statements.
matters on which we are required to report by exceptionWe have nothing to report in respect of the following matters where the Companies Act 2006 requires us to report to you if, in our opinion:
●● adequate accounting records have not been kept by the parent company, or returns adequate for our audit have not been received from branches not visited by us; or
●● the Parent Company financial
statements and the part of the Directors’ Remuneration Report to be audited are not in agreement with the accounting records and returns; or
●● certain disclosures of directors’ remuneration specified by law are not made; or
●● we have not received all the information and explanations we require for our audit.
Other matterWe have reported separately on the Group financial statements of Severfield–Rowen Plc for the year ended 31 December 2010 and on the information in the Directors’ Remuneration Report that is described as having been audited.
Simon Manning (Senior Statutory Auditor)for and on behalf of Deloitte LLPChartered Accountants and Statutory Auditor 28 April 2011
iNdEPENdeNT AUDITOR’S REPORT TO THE MEMBERS OF SEVERFIELD–ROWEN Plc

103
20155-04 27/04/2011 Proof 11
COMPANY ACCOUNTS 103
COMPANY BALANCE SHEET31 December 2010
2010 2009 Note £000 £000
Fixed assets
Tangible assets 4 62,064 62,339
Investments 5 106,117 110,532
168,181 172,871
Current assets
Debtors 6 49,426 39,649
Cash at bank and in hand 41 —
49,467 39,649
Creditors — amounts falling due within one year 7 (160,523) (147,932)
Net current liabilities 111,056 (108,283)
Total assets less current liabilities 57,125 64,588
Capital and reserves
Called-up share capital 9 2,231 2,215
Share premium account 10 46,152 46,152
Other reserves 11 55 951
Profit and loss account 12 8,687 15,270
Equity and total shareholders’ funds 57,125 64,588
The financial statements were approved by the Board of Directors on 27 April 2011 and signed on its behalf by:
T G Haughey A d dunsmoreDirector Director
Severfield–Rowen PlcRegistered in England No: 1721262

20155-04 27/04/2011 Proof 11
Severfield—Rowen Plc Annual Report 2010104
1. Significant accounting policiesbasis of accountingThe separate financial statements of the Company are presented as required by the Companies Act 2006. They have been prepared under the historical cost convention, as modified by the revaluation of freehold and long leasehold properties, and in accordance with applicable UK accounting standards (UK GAAP). Going concernAfter making enquiries, the directors have formed a judgement at the time of approving the financial statements that there is a reasonable expectation that the Group has adequate resources to continue in operational existence for the foreseeable future. For this reason the directors continue to adopt a going concern basis in preparing the financial statements. The key factors considered by the directors in making the statement are set out within the Financial Review on pages 22 to 24.
Profit and loss accountIn accordance with the exemption allowed by section 408 of the Companies Act 2006, the Company has not presented its own profit and loss account.
Cash flowThe Company is exempt from the requirements of Financial Reporting Standard No. 1 (Revised) “Cash Flow Statements”.
Tangible fixed assetsFreehold and long leasehold land is held at cost and not depreciated.
Depreciation is provided on other fixed assets to write off the cost of each asset over its estimated useful life at the following rates:
Freehold buildings 1% straight-line
investmentsFixed asset investments are shown at cost less provision for impairment.
TaxationCurrent tax, including UK corporation tax and foreign tax, is provided at amounts expected to be paid (or recovered) using the tax rates and laws that have been enacted or substantially enacted by the balance sheet date.
Deferred tax is provided in full on timing differences which result in an obligation at the balance sheet date to pay more tax, or a right to pay less tax, at a future date, at rates expected to apply when they crystallise based on current tax rates and law. Timing differences arise from the inclusion of items of income and expenditure in taxation computations in periods different from those which they are included in financial statements.
Deferred tax is not provided on timing differences arising from the revaluation of fixed assets where there is no commitment to sell the asset, or on unremitted earnings of subsidiaries and associates where there is no commitment to remit these earnings. Deferred tax assets are recognised to the extent that it is regarded as more likely than not that they will be recovered. Deferred tax assets and liabilities are not discounted.
Share-based paymentsShare-based payments are accounted for as described in the Group accounting policies on page 72.
Related Party TransactionsThe Company has taken advantage of the exemption granted by paragraph 3(b) of FRS 8 (Related Party Disclosures) not to disclose transactions with other Group companies.
NOTeS TO THe COMPANY FINANCIAL STATEMENTSYear ended 31 December 2010

105
20155-04 27/04/2011 Proof 11
COMPANY ACCOUNTS 105
2. Operating profitThe auditor’s remuneration for audit services to the Company was £16,000 (2009: £16,000).
The Company has no employees other than the directors whose remuneration was borne by subsidiary undertakings.
3. Profit of the CompanyThe Company has taken advantage of Section 408 of the Companies Act 2006 and consequently its profit and loss account is not presented as part of these accounts. The profit of the Company for the financial year amounted to £1,385,000 (2009 profit: £18,287,000). Dividends paid and proposed are disclosed in Note 8 to the Consolidated financial statements.
4. Tangible assets Freehold and long leasehold land and buildings £000
CostAt 1 January 2010 63,889Additions 341Disposals (42)At 31 december 2010 64,188
depreciationAt 1 January 2010 1,550Provided in year 598Disposals (24)At 31 december 2010 2,124
Net book valueAt 31 december 2010 62,064At 31 December 2009 62,339
The Company’s freehold and long leasehold land and buildings includes those which are occupied and used by some of the Company’s subsidiary undertakings.
The Company operates a system of regular valuations of freehold and long leasehold land and buildings across its portfolio which have included using FPD Savills and Rushton International Chartered Surveyors. This operates on a rotational basis, with one of the three main properties reviewed each year. The three properties are the Severfield–Reeve Structures Ltd site at Dalton Airfield Industrial Estate, the Watson Steel Structures Ltd site at Lostock Lane, Bolton and the Atlas Ward Structures Ltd site at Sherburn.
To date, no material surplus or deficit over net book value has been identified, and accordingly no adjustment to revalue freehold and long leasehold land and buildings has been considered necessary.
5. investments 2010 2009 £000 £000
Investment in subsidiaries 100,254 107,554Investment in associates 535 535Investment in joint ventures 5,328 2,443 106,117 110,532

20155-04 27/04/2011 Proof 11
Severfield—Rowen Plc Annual Report 2010106
NOTeS TO THe COMPANY FINANCIAL STATEMENTS continuedYear ended 31 December 2010
5. investments continuedinvestment in subsidiariesThe Company has investments in the following significant subsidiary undertakings. All of the companies listed are registered in England.
Severfield–Reeve Structures Ltd — steel fabricationWatson Steel Structures Ltd — steel fabricationAtlas Ward Structures Ltd — steel fabricationFisher Engineering Ltd — steel fabricationRowen Structures Ltd — project contractingSteelcraft Erection Services Ltd — steel erectionSeverfield–Reeve International Ltd — overseas contracts
The Company owns the whole of the issued share capital of the subsidiaries noted above.
Following the annual testing for impairment the carrying value of the company’s investment in Action Merchants Limited, the holding company for Fisher Engineering Limited, was impaired by £7,300,000 reducing the carrying value accordingly.
£000
CostAt 1 january 2010 and 31 december 2010 107,554
Provision for impairmentAt 1 January 2010 —Amount written off (7,300)At 31 december 2010 (7,300)
Net book valueAt 31 december 2010 100,254At 31 December 2009 107,554
investment in associatesThe Company has an interest in associated companies as follows:
Holding % Class of capitalKennedy Watts Partnership Ltd — CAD/CAM steelwork design 25.1 Preferred ordinaryFabsec Ltd — development of fire beam 25.0 Ordinary
£000
CostAt 31 december 2009 and 31 december 2010 535
investment in joint venturesOn 17 November 2008 a formal agreement was signed in India with JSW Building Systems Ltd (a subsidiary of JSW Steel Ltd of India) to form a 50/50 joint venture, JSW Severfield Structures Limited, to create a structural steelwork business in Bellary and Mumbai, India, serving primarily the Indian market.
JSW Severfield Structures Limited is registered in India and, during the year, the Group invested £2,884,000 (2009: £2,443,000) in the joint venture. £000
CostAt 1 January 2009 2,443Invested in year 2,884At 31 december 2009 5,327

107
20155-04 27/04/2011 Proof 11
COMPANY ACCOUNTS 107
6. debtors 2010 2009 £000 £000
Other debtors 659 —Amounts owed by subsidiary undertakings 47,872 39,450Deferred tax asset (note 8) 115 199Corporation tax recoverable 780 — 49,426 39,649
7. Creditors — amounts falling due within one year 2010 2009 £000 £000
Bank borrowings 29,704 29,472Other creditors and accruals 2,425 21Corporation tax — 125Amounts owed to subsidiary undertakings 128,394 118,314 160,523 147,932
Borrowings represent the Group’s revolving credit facility from the Royal Bank of Scotland and National Australia Bank jointly as disclosed in note 21 to the Consolidated financial statements. The facility is available until March 2013.
8. deferred tax Amount provided Amount unprovided 2010 2009 2010 2009 £000 £000 £000 £000
Excess capital allowances (115) (199) — —
Deferred Taxation — Movement for the year £000
At 1 January 2010 (note 6) 199Current year charge (84)At 31 december 2010 (note 6) 115
9. Share capital 2010 2009 £000 £000
Authorised:108,000,000 ordinary shares of 2.5p each 2,700 2,700issued and fully paid:89,251,076 ordinary shares of 2.5p each (2009: 88,607,876) 2,231 2,215
There are no share options outstanding as at 31 December 2010 (2009: Nil).
On 29 March 2010 440,816 ordinary shares of 2.5p each were issued in relation to the vesting of shares under the Company’s Performance Share Plan. On 29 October 2010 202,384 ordinary shares of 2.5p each were issued in relation to the Group employee Share Incentive Plan.

20155-04 27/04/2011 Proof 11
Severfield—Rowen Plc Annual Report 2010108
10. Share premium account 2010 2009 £000 £000
Balance at 1 january and 31 december 46,152 46,152
11. Other reserves 2010 2009 £000 £000
Balance at 1 January 951 325Share-based payment movements in year (896) 626Balance at 31 december 55 951
The movement in the share-based payment reserve comprises the following components: 2010 2009 £000 £000
Shares issued under Share Incentive Plan (5) —Share-based payments 35 626Vesting of shares under Share Performance Plan (926) — (896) 626
12. Profit and loss account 2010 2009 £000 £000
Balance at 1 January 15,270 14,705Dividends paid (8,883) (17,722)Net profit for the year 1,385 18,287Share-based payments 915 —Balance at 31 december 8,687 15,270
13. movement in shareholders’ funds 2010 2009 £000 £000
Balance at 1 January 64,588 63,397Dividends paid (8,883) (17,722)Net profit for the year 1,385 18,287Share-based payments 915 —Increase in share capital 16 —Movement in share-based payment reserve (896) 626Balance at 31 december 57,125 64,588
14. Capital commitments 2010 2009 £000 £000
Contracted for but not provided in the financial statements 265 —
15. Contingent liabilitiesThe Company has provided an unlimited guarantee to secure any bank overdrafts and loans of all other Group companies. At 31 December 2010 these amounted to £Nil (2009: £Nil).
NOTeS TO THe COMPANY FINANCIAL STATEMENTS continuedYear ended 31 December 2010

20155-04 27/04/2011 Proof 11 20155-04 27/04/2011 Proof 11
Severfield—Rowen Plc Annual Report 2010
SEvERFIElD–ROwEN Plc IS ThE lARgEST SPEcIAlIST STRucTuRAl STEElwORK gROuP IN ThE uK, wITh A REPuTATION FOR PERFORmANcE AND vAluE.
GRouP STRENgThS
For more information visit:
www.sfrplc.com
severfield-reeve structures LtdDalton Airfield Industrial EstateDaltonThirskNorth YorkshireYO7 3JNTel: 01845 577 896Fax: 01845 577 411
Fisher engineering LtdballinamallardEnniskillenco FermanaghNorthern IrelandbT94 2FYTel: 02866 388 521Fax: 02866 388 706
rowen structures Ltd17 maisies wayThe villageSouth NormantonDerbyshireDE55 2DSTel: 01773 860 086Fax: 01773 814 077
Atlas ward structures LtdSherburnmaltonNorth YorkshireYO17 8PZTel: 01944 710 421Fax: 01944 710 387
severfield-reeve International LtdPO box 519Abu Dhabiunited Arab EmiratesTel: +971 2 644 2600Fax: +971 2 644 2387
engineering construction training LtdDalton Airfield Industrial EstateDaltonThirskNorth YorkshireYO7 3JNTel: 01845 576 807Fax: 01845 577 942
watson steel structures Ltdlostock lanelostockboltonlancashirebl6 4blTel: 01204 699 999Fax: 01204 694 543
Jsw severfield structures Ltd401 Deluxe courtR v bambardekar RoadStation Roadbandra west mumbaiTel: +91 22 6731 7000Fax: +91 22 2651 2685
steelcraft erection services LtdDalton Airfield Industrial EstateDaltonThirskNorth YorkshireYO7 3JNTel: 01845 577 896Fax: 01845 578 477
JSW SeverfieldStructures
Severfield–ReeveStructures
Atlas WardStructures
Watson SteelStructures
Fisher engineering
Steelcraft erectionServices
engineering construction
training
RowenStructures
Severfield–ReeveInternational
(project office, abu dhabi)
severfield–rowen PlcDalton Airfield Industrial EstateDaltonThirskNorth YorkshireYO7 3JNTel: 01845 577 896Fax: 01845 577 411
oPeRAtIonAl PeRFoRmAnce & cuStomeR SeRvIce
multI-SectoR FlexIbIlIty
eARly PRoJect deSIGn enhAncement, PRoGRAmmInG And coStInG
PRoduct And SeRvIce RAnGe
uk And oveRSeAS mAnuFActuRInG And netWoRk
FActoRy And SIte eFFIcIencIeS
PeoPle And SkIllS
FInAncIAl StRenGth
ScAle And coSt bASe
heAlth, SAFety And SuStAInAbIlIty
www.sfrplc.com
Stratford, London

20155-04 27/04/2011 Proof 11 20155-04 27/04/2011 Proof 11
Severfield-Rowen Plc
Severfield–Rowen PlcDalton Airfield Industrial Estate, Dalton, Thirsk, North Yorkshire, YO7 3JN
Tel: (01845) 577896 Fax: (01845) 577411
www.sfrplc.com
Growth buIlT ON success
AnnuAl RePoRt & AccountSfor the year ended 31 december 2010
Severfield–R
owen P
lc an
nu
al r
eport 2010