Severe hypercapnia and outcome of mechanically ventilated...
9
Intensive Care Med DOI 10.1007/s00134-016-4611-1 ORIGINAL Severe hypercapnia and outcome of mechanically ventilated patients with moderate or severe acute respiratory distress syndrome Nicolas Nin 1,13 , Alfonso Muriel 2 , Oscar Peñuelas 3,33 , Laurent Brochard 4,5 , José Angel Lorente 3,33 , Niall D. Ferguson 6 , Konstantinos Raymondos 7 , Fernando Ríos 8 , Damian A. Violi 9 , Arnaud W. Thille 10 , Marco González 11 , Asisclo J. Villagomez 12 , Javier Hurtado 13 , Andrew R. Davies 14 , Bin Du 15 , Salvatore M. Maggiore 16 , Luis Soto 17 , Gabriel D’Empaire 18 , Dimitrios Matamis 19 , Fekri Abroug 20 , Rui P. Moreno 21 , Marco Antonio Soares 22 , Yaseen Arabi 23 , Freddy Sandi 24 , Manuel Jibaja 25 , Pravin Amin 26 , Younsuck Koh 27 , Michael A. Kuiper 28 , Hans‑Henrik Bülow 29 , Amine Ali Zeggwagh 30 , Antonio Anzueto 31 , Jacob I. Sznajder 32 , Andres Esteban 3,33* for the VENTILA Group © 2017 Springer‑Verlag Berlin Heidelberg and ESICM Abstract Purpose: To analyze the relationship between hypercapnia developing within the first 48 h after the start of mechan‑ ical ventilation and outcome in patients with acute respiratory distress syndrome (ARDS). Patients and methods: We performed a secondary analysis of three prospective non‑interventional cohort studies focusing on ARDS patients from 927 intensive care units (ICUs) in 40 countries. These patients received mechanical ventilation for more than 12 h during 1‑month periods in 1998, 2004, and 2010. We used multivariable logistic regres‑ sion and a propensity score analysis to examine the association between hypercapnia and ICU mortality. Main outcomes: We included 1899 patients with ARDS in this study. The relationship between maximum PaCO 2 in the first 48 h and mortality suggests higher mortality at or above PaCO 2 of ≥50 mmHg. Patients with severe hyper‑ capnia (PaCO 2 ≥50 mmHg) had higher complication rates, more organ failures, and worse outcomes. After adjusting for age, SAPS II score, respiratory rate, positive end‑expiratory pressure, PaO 2 /FiO 2 ratio, driving pressure, pressure/vol‑ ume limitation strategy (PLS), corrected minute ventilation, and presence of acidosis, severe hypercapnia was associ‑ ated with increased risk of ICU mortality [odds ratio (OR) 1.93, 95% confidence interval (CI) 1.32 to 2.81; p = 0.001]. In patients with severe hypercapnia matched for all other variables, ventilation with PLS was associated with higher ICU mortality (OR 1.58, CI 95% 1.04–2.41; p = 0.032). Conclusions: Severe hypercapnia appears to be independently associated with higher ICU mortality in patients with ARDS. *Correspondence: [email protected] 33 Hospital Universitario de Getafe, Carretera de Toledo, Km 12,500, 28905 Madrid, Spain Full author information is available at the end of the article Take-home message: Severe hypercapnia appears to be independently associated with higher ICU mortality in patients with ARD. The members of the VENTILA Group are listed in the electronic supplementary material (file ESM‑2).
Transcript of Severe hypercapnia and outcome of mechanically ventilated...
Intensive Care MedDOI 10.1007/s00134-016-4611-1
ORIGINAL
Severe hypercapnia and outcome of mechanically ventilated patients with moderate or severe acute respiratory distress syndromeNicolas Nin1,13, Alfonso Muriel2, Oscar Peñuelas3,33, Laurent Brochard4,5, José Angel Lorente3,33, Niall D. Ferguson6, Konstantinos Raymondos7, Fernando Ríos8, Damian A. Violi9, Arnaud W. Thille10, Marco González11, Asisclo J. Villagomez12, Javier Hurtado13, Andrew R. Davies14, Bin Du15, Salvatore M. Maggiore16, Luis Soto17, Gabriel D’Empaire18, Dimitrios Matamis19, Fekri Abroug20, Rui P. Moreno21, Marco Antonio Soares22, Yaseen Arabi23, Freddy Sandi24, Manuel Jibaja25, Pravin Amin26, Younsuck Koh27, Michael A. Kuiper28, Hans‑Henrik Bülow29, Amine Ali Zeggwagh30, Antonio Anzueto31, Jacob I. Sznajder32, Andres Esteban3,33* for the VENTILA Group
© 2017 Springer‑Verlag Berlin Heidelberg and ESICM
Abstract
Purpose: To analyze the relationship between hypercapnia developing within the first 48 h after the start of mechan‑ical ventilation and outcome in patients with acute respiratory distress syndrome (ARDS).
Patients and methods: We performed a secondary analysis of three prospective non‑interventional cohort studies focusing on ARDS patients from 927 intensive care units (ICUs) in 40 countries. These patients received mechanical ventilation for more than 12 h during 1‑month periods in 1998, 2004, and 2010. We used multivariable logistic regres‑sion and a propensity score analysis to examine the association between hypercapnia and ICU mortality.
Main outcomes: We included 1899 patients with ARDS in this study. The relationship between maximum PaCO2 in the first 48 h and mortality suggests higher mortality at or above PaCO2 of ≥50 mmHg. Patients with severe hyper‑capnia (PaCO2 ≥50 mmHg) had higher complication rates, more organ failures, and worse outcomes. After adjusting for age, SAPS II score, respiratory rate, positive end‑expiratory pressure, PaO2/FiO2 ratio, driving pressure, pressure/vol‑ume limitation strategy (PLS), corrected minute ventilation, and presence of acidosis, severe hypercapnia was associ‑ated with increased risk of ICU mortality [odds ratio (OR) 1.93, 95% confidence interval (CI) 1.32 to 2.81; p = 0.001]. In patients with severe hypercapnia matched for all other variables, ventilation with PLS was associated with higher ICU mortality (OR 1.58, CI 95% 1.04–2.41; p = 0.032).
Conclusions: Severe hypercapnia appears to be independently associated with higher ICU mortality in patients with ARDS.
*Correspondence: [email protected] 33 Hospital Universitario de Getafe, Carretera de Toledo, Km 12,500, 28905 Madrid, SpainFull author information is available at the end of the articleTake-home message: Severe hypercapnia appears to be independently associated with higher ICU mortality in patients with ARD.The members of the VENTILA Group are listed in the electronic supplementary material (file ESM‑2).
IntroductionMechanical ventilation (MV) with high tidal volumes has been shown to both cause and worsen lung injury [1–3]. Hickling et al. [4] reported that during MV of acute res-piratory distress syndrome (ARDS), limitation of airway pressure to <30 cmH2O was associated with lower mor-tality in patients with acute lung injury. Limitation of tidal volumes and airway pressure is now used as a lung protective strategy during MV in patients with ARDS. However, this strategy can sometimes result in high par-tial pressure of carbon dioxide in arterial blood (PaCO2) levels [5, 6]. In the early 1990s the concept of permis-sive hypercapnia was proposed for patients with acute lung injury. In the ARDS Network Study comparing low and high tidal volumes [7], patients in the low tidal volume group had only mild changes in PaCO2 (35 ± 8 vs. 40 ± 10 mmHg), probably due to higher respiratory rates in that group. Also, in experimental models of sep-sis-induced acute lung injury there were reports of the beneficial effects of hypercapnic acidosis [8, 9]. It was even suggested that “therapeutic hypercapnia” might be beneficial [10–12]. However, more recent studies have reported that hypercapnia has harmful effects, including impairment of alveolar epithelial function, cell prolifera-tion, and muscle function as well as of neutrophil func-tion and innate immunity [13–21]. Acute hypercapnia may also have significant hemodynamic consequences and lead to pulmonary hypertension, right ventricular dysfunction, and prolonged bronchopleural leakage [22].
In view of the prevalent paradigm of tolerance of hypercapnia in ARDS patients and recent conflicting reports on the biologic effects of hypercapnia, we sought to evaluate the impact of high PaCO2 on intensive care unit (ICU) outcomes in a large cohort of ARDS patients subjected to MV.
MethodsPatientsWe conducted a secondary analysis of data from 18,302 patients admitted to 927 ICUs in 40 countries who were enrolled in one of three international prospective, multi-center, non-interventional, observational studies carried out in 1998, 2004, and 2010 [23–25] and had received MV for >12 h during a 1-month period. The research eth-ics committee of each participating institution approved the study protocol. For the purpose of this study, we selected patients who received invasive MV for more than 24 h because of ARDS or who developed ARDS
after the first 24 h of MV. ARDS was defined by the cri-teria established by the American–European Consensus Conference: acute onset, PaO2/fraction of inspirted oxy-gen (FiO2) of <200 mmHg, bilateral infiltrates on chest radiograph, absence of heart failure, and diagnosis of ARDS by the clinician in charge. We considered these patients to have moderate or severe ARDS according to the Berlin definition.
We collected baseline characteristics, the first arterial blood gas measurement and the corresponding ventila-tor settings, daily gas exchange, clinical management, and complications while patients were being ventilated or until day 28. If several arterial blood gas measure-ments were available for the same patient during the first 24 h of MV, we used the worst PaCO2 value during this period for analysis. Hospital mortality and length of stay were documented. A full description of the methodology has been published previously [25]. Our primary objec-tive was to assess the independent effect of PaCO2 on ICU mortality rate in patients with ARDS. The secondary objectives were to determine the effects of PaCO2 on ICU length of stay, hospital length of stay, and complications over the course of MV.
Statistical analysisData are expressed as the mean ± standard deviation, the median with the interquartile range, and proportions (absolute and relative frequencies) as appropriate. Student’s t test or the Mann–Whitney test was used to compare con-tinuous variables, while the χ2 test or Fisher’s exact test was used to compare proportions. A p value of <0.05 was con-sidered to show a statistically significant difference.
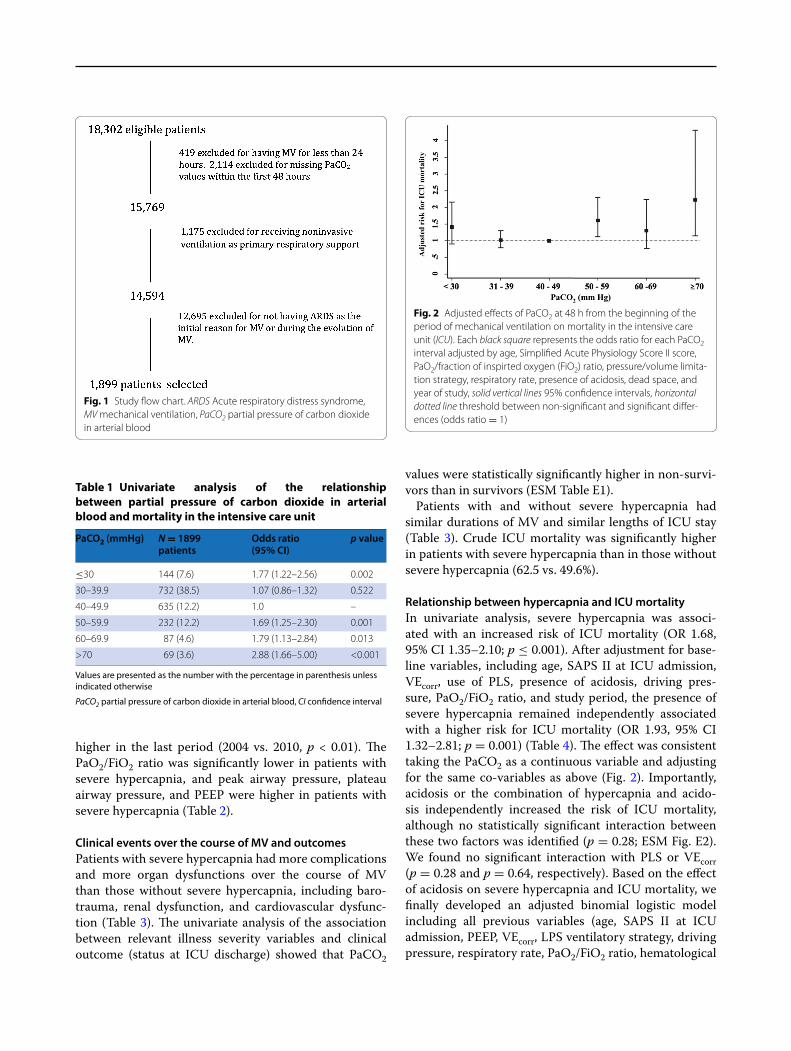
Maximum PaCO2 in the first 48 h after initiation of MV was categorized into six groups (<30, 30–39, 40–49, 50–59, 60–69, and >70 mmHg); the cutoffs corresponded approximately to the 5th, 35th, 70th, 85th, and 95th per-centiles of higher PaCO2 within 48 h after the diagno-sis of ARDS, respectively. The groups with a PaCO2 of 30–39 and 40–49 mmHg had the lowest ICU mortality. PaCO2 values associated with significantly increased ICU mortality were defined as “severe hypercapnia”. We also performed recursive partitioning, showing the effects of hypercapnia and hypocapnia (defined as PaCO2 > 30 mmHg) on ICU mortality.
To assess the independent effect of hypercapnia on outcome (ICU mortality), we performed a full univariate analysis of the association between relevant illness sever-ity variables and ICU mortality. A maximum model was
Trial registration: Clinicaltrials.gov identifier, NCT01093482.
Keywords: Mechanical ventilation, Acute respiratory distress syndrome, Hypercapnia, ICU mortality
then constructed by performing a predictive multivariate logistic regression model, including all variables selected in the univariate analysis that were measured in 80% of patients and showed a significant statistically associa-tion (p < 0.10) in the univariate analysis. Thus, the final model was chosen based on the highest area under the receiver operating characteristic curve after backward elimination of non-significant variables. Moreover, some other variables were included in a full multivariate model to explore unmeasured confounders probably related with ICU mortality, such as driving pressure [defined as plateau pressure minus positive end-expiratory pres-sure (PEEP)] and the use of a pressure/volume limitation strategy (PLS). This was defined by consensus as a tidal volume of <8 ml/kg of actual body weight and a plateau pressure or peak inspiratory pressure of <30 cmH2O [24]. Because clinical practices regarding MV strategies in patients diagnosed with ARDS have changed over time, the model was also adjusted for the period of the study. In addition, because dead space is strongly associated with mortality [26] and may be a confounding factor for hypercapnia, we calculated the corrected minute ventila-tion (VEcorr) for a normal PaCO2 (calculated as minute ventilation × actual PaCO2/40 mmHg) as a surrogate for dead space [27] and introduced this as a co-variable into the univariate and multivariate model. We created a ver-tical plot showing the adjusted odds ratio (OR) for ICU mortality and PaCO2 as categorized.
Interactions between hypercapnia and acidosis, dead space, and PLS, respectively, were tested by logistic regression. We considered a p value of <0.2 to show sta-tistically significant interaction [Electronic Supplemen-tary Material (ESM) Fig. E2]. The potentially non-linear relationship of the variable was tested by the use of frac-tional polynomials. Standard errors were calculated by 1000 bootstrap resampling as a validation analysis.
As a sensitivity analysis and to explore the effect of severe hypercapnia under the most unfavorable clini-cal conditions, which are present in those patients sub-jected to protective ventilation where the development of hypercapnia may be a severity marker with a contra-dictory effect on ICU mortality and therefore may serve as a confounder variable, we used logistic regression to develop a propensity score model in order to estimate the relationships between severe hypercapnia and ICU mor-tality in patients ventilated with <8 ml/kg. The log odds of the probability that a patient had severe hypercapnia (the logit) were modeled as a function of the confounders by logistic regression that we identified and included in our data set. We then performed a one-to-one matched anal-ysis without replacement on the basis of the estimated propensity score (likelihood of developing severe hyper-capnia) of each patient. A nearest-neighbor-matching
algorithm was used to match patients on the basis of their hypercapnia status (present or absent) and the logit of their propensity score, with matching occurring if the dif-ference in the propensity scores was <0.2-fold the stand-ard deviation of the logit (the caliper width). We selected 0.2 because this value has been shown to eliminate approximately 90% of the bias in observed confound-ers [28]. We estimated standardized differences for all covariates before and after matching, with a standardized difference of ≥10% considered to be indicative of imbal-ance [29]. All subsequent analyses were performed in the matched sample, using methods appropriate for the analysis of matched data to estimate the average treat-ment effect as the difference in outcome (ICU mortality) among the exposed group (severe hypercapnia) and the matched unexposed cohort (without severe hypercap-nia) [30]. We calculated bootstrapped standard errors to generate 95% confidence intervals (CI). After match-ing, variables showing an unbalanced result (defined as a standardized difference of >10%) were introduced into the propensity score as non-linear terms. If these varia-bles kept a standardized difference of >10%, a generalized estimating equation model was fitted adding them.
Statistical analyses were performed using IBM SPSS software (ver. 21.0; IBM Corp., Armonk, NY) and Stata software (ver. 13.1; StataCorp LP, College Station, TX).
ResultsOverall, 1899 patients with ARDS were included in the analysis. Figure 1 shows the study flow chart.
PaCO2 values within the first 48 h of MV and ICU mortalityMortality was significantly higher in patients with a max-imum PaCO2 of ≥50 mmHg during the first 48 h of MV than in patients with a maximum PaCO2 of <50 mmHg (Table 1; ESM Fig. E1). In order to verify this result, we performed logistic regression with data adjusted by age, Simplified Acute Physiology Score (SAPS) II score at ICU admission, PaO2/FiO2 ratio, PEEP, respiratory rate, aci-dosis, the use of a PLS during the first 48 h after start-ing MV, and the period of the study, using a PaCO2 of 40–49 mmHg as the reference category. This analysis confirmed significantly higher ICU mortality with higher maximum PaCO2 values (Fig. 2).
We thus defined “severe hypercapnia” as a PaCO2 of ≥50 mmHg. Overall, ICU mortality for the patients included in the analysis was 53% (999/1899).
Clinical characteristics of patients with severe hypercapniaPatients with severe hypercapnia were more likely to be male. Severe hypercapnia was significantly more frequent in patients with ARDS during the last two time periods (1998 vs. 2004, p < 0.01; 1998 vs. 2010, p < 0.001) and
higher in the last period (2004 vs. 2010, p < 0.01). The PaO2/FiO2 ratio was significantly lower in patients with severe hypercapnia, and peak airway pressure, plateau airway pressure, and PEEP were higher in patients with severe hypercapnia (Table 2).
Clinical events over the course of MV and outcomesPatients with severe hypercapnia had more complications and more organ dysfunctions over the course of MV than those without severe hypercapnia, including baro-trauma, renal dysfunction, and cardiovascular dysfunc-tion (Table 3). The univariate analysis of the association between relevant illness severity variables and clinical outcome (status at ICU discharge) showed that PaCO2
values were statistically significantly higher in non-survi-vors than in survivors (ESM Table E1).
Patients with and without severe hypercapnia had similar durations of MV and similar lengths of ICU stay (Table 3). Crude ICU mortality was significantly higher in patients with severe hypercapnia than in those without severe hypercapnia (62.5 vs. 49.6%).
Relationship between hypercapnia and ICU mortalityIn univariate analysis, severe hypercapnia was associ-ated with an increased risk of ICU mortality (OR 1.68, 95% CI 1.35–2.10; p ≤ 0.001). After adjustment for base-line variables, including age, SAPS II at ICU admission, VEcorr, use of PLS, presence of acidosis, driving pres-sure, PaO2/FiO2 ratio, and study period, the presence of severe hypercapnia remained independently associated with a higher risk for ICU mortality (OR 1.93, 95% CI 1.32–2.81; p = 0.001) (Table 4). The effect was consistent taking the PaCO2 as a continuous variable and adjusting for the same co-variables as above (Fig. 2). Importantly, acidosis or the combination of hypercapnia and acido-sis independently increased the risk of ICU mortality, although no statistically significant interaction between these two factors was identified (p = 0.28; ESM Fig. E2). We found no significant interaction with PLS or VEcorr (p = 0.28 and p = 0.64, respectively). Based on the effect of acidosis on severe hypercapnia and ICU mortality, we finally developed an adjusted binomial logistic model including all previous variables (age, SAPS II at ICU admission, PEEP, VEcorr, LPS ventilatory strategy, driving pressure, respiratory rate, PaO2/FiO2 ratio, hematological
Fig. 1 Study flow chart. ARDS Acute respiratory distress syndrome, MV mechanical ventilation, PaCO2 partial pressure of carbon dioxide in arterial blood
Table 1 Univariate analysis of the relationship between partial pressure of carbon dioxide in arterial blood and mortality in the intensive care unit
Values are presented as the number with the percentage in parenthesis unless indicated otherwise
PaCO2 partial pressure of carbon dioxide in arterial blood, CI confidence interval
PaCO2 (mmHg) N = 1899 patients
Odds ratio (95% CI)
p value
≤30 144 (7.6) 1.77 (1.22–2.56) 0.002
30–39.9 732 (38.5) 1.07 (0.86–1.32) 0.522
40–49.9 635 (12.2) 1.0 –
50–59.9 232 (12.2) 1.69 (1.25–2.30) 0.001
60–69.9 87 (4.6) 1.79 (1.13–2.84) 0.013
>70 69 (3.6) 2.88 (1.66–5.00) <0.001
Fig. 2 Adjusted effects of PaCO2 at 48 h from the beginning of the period of mechanical ventilation on mortality in the intensive care unit (ICU). Each black square represents the odds ratio for each PaCO2 interval adjusted by age, Simplified Acute Physiology Score II score, PaO2/fraction of inspirted oxygen (FiO2) ratio, pressure/volume limita‑tion strategy, respiratory rate, presence of acidosis, dead space, and year of study, solid vertical lines 95% confidence intervals, horizontal dotted line threshold between non‑significant and significant differ‑ences (odds ratio = 1)
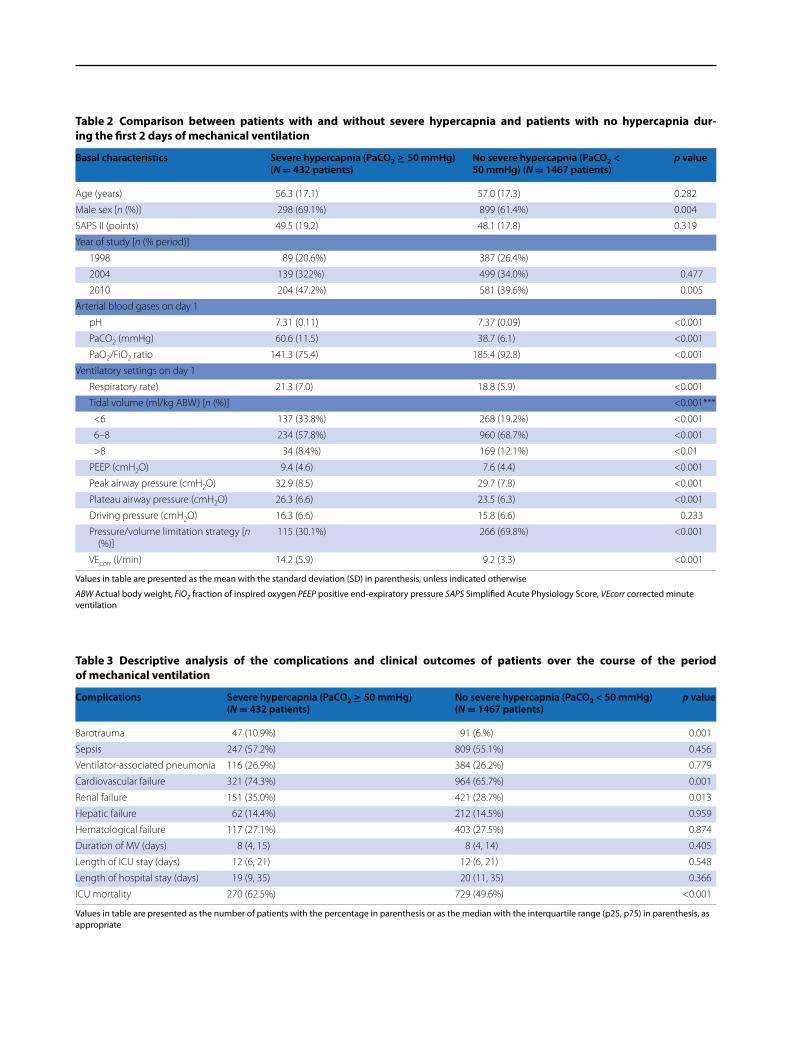
Table 2 Comparison between patients with and without severe hypercapnia and patients with no hypercapnia dur-ing the first 2 days of mechanical ventilation
Values in table are presented as the mean with the standard deviation (SD) in parenthesis, unless indicated otherwise
ABW Actual body weight, FiO2 fraction of inspired oxygen PEEP positive end-expiratory pressure SAPS Simplified Acute Physiology Score, VEcorr corrected minute ventilation
Basal characteristics Severe hypercapnia (PaCO2 ≥ 50 mmHg) (N = 432 patients)
No severe hypercapnia (PaCO2 < 50 mmHg) (N = 1467 patients)
p value
Age (years) 56.3 (17.1) 57.0 (17.3) 0.282
Male sex [n (%)] 298 (69.1%) 899 (61.4%) 0.004
SAPS II (points) 49.5 (19.2) 48.1 (17.8) 0.319
Year of study [n (% period)]
1998 89 (20.6%) 387 (26.4%)
2004 139 (322%) 499 (34.0%) 0.477
2010 204 (47.2%) 581 (39.6%) 0.005
Arterial blood gases on day 1
pH 7.31 (0.11) 7.37 (0.09) <0.001
PaCO2 (mmHg) 60.6 (11.5) 38.7 (6.1) <0.001
PaO2/FiO2 ratio 141.3 (75.4) 185.4 (92.8) <0.001
Ventilatory settings on day 1
Respiratory rate) 21.3 (7.0) 18.8 (5.9) <0.001
Tidal volume (ml/kg ABW) [n (%)] <0.001***
<6 137 (33.8%) 268 (19.2%) <0.001
6–8 234 (57.8%) 960 (68.7%) <0.001
>8 34 (8.4%) 169 (12.1%) <0.01
PEEP (cmH2O) 9.4 (4.6) 7.6 (4.4) <0.001
Peak airway pressure (cmH2O) 32.9 (8.5) 29.7 (7.8) <0.001
Plateau airway pressure (cmH2O) 26.3 (6.6) 23.5 (6.3) <0.001
Driving pressure (cmH2O) 16.3 (6.6) 15.8 (6.6) 0.233
Pressure/volume limitation strategy [n (%)]
115 (30.1%) 266 (69.8%) <0.001
VEcorr (l/min) 14.2 (5.9) 9.2 (3.3) <0.001
Table 3 Descriptive analysis of the complications and clinical outcomes of patients over the course of the period of mechanical ventilation
Values in table are presented as the number of patients with the percentage in parenthesis or as the median with the interquartile range (p25, p75) in parenthesis, as appropriate
Complications Severe hypercapnia (PaCO2 ≥ 50 mmHg) (N = 432 patients)
No severe hypercapnia (PaCO2 < 50 mmHg) (N = 1467 patients)
p value
Barotrauma 47 (10.9%) 91 (6.%) 0.001
Sepsis 247 (57.2%) 809 (55.1%) 0.456
Ventilator‑associated pneumonia 116 (26.9%) 384 (26.2%) 0.779
Cardiovascular failure 321 (74.3%) 964 (65.7%) 0.001
Renal failure 151 (35.0%) 421 (28.7%) 0.013
Hepatic failure 62 (14.4%) 212 (14.5%) 0.959
Hematological failure 117 (27.1%) 403 (27.5%) 0.874
Duration of MV (days) 8 (4, 15) 8 (4, 14) 0.405
Length of ICU stay (days) 12 (6, 21) 12 (6, 21) 0.548
Length of hospital stay (days) 19 (9, 35) 20 (11, 35) 0.366
ICU mortality 270 (62.5%) 729 (49.6%) <0.001
failure, and study period). We omitted acidosis in order to avoid overadjustment because an interaction remained between acidosis and hypercapnia. The model indicated that severe hypercapnia was markedly and independently associated with a higher risk of ICU mortality (OR 2.40, 95% CI 1.67–3.46; p < 0.001) (ESM Tables E2 and E3).
After propensity-score matching (see ESM Table E4 and ESM Fig. E3 for the quality of the matching process), there was a significant difference in the effect of severe hypercapnia on ICU mortality between patients receiving tidal volumes of <8 ml/kg (n = 344) and those receiving tidal volumes of >8 ml/kg (risk-adjusted ICU mortality: OR 1.58, 95% CI 1.04–2.41; p = 0.032).
DiscussionAfter multiple adjustments and propensity analysis, we found that severe hypercapnia was independently associ-ated with ICU mortality, with higher rates of organ dys-function and more complications during MV in patients with moderate or severe ARDS. These findings may have clinical implications. The association between hypercap-nia and complications during MV in unadjusted analyses may be a function of worse lung injury, but after multi-variate adjustment hypercapnia was still associated with ICU mortality in ARDS patients.
The use of permissive hypercapnia is based on obser-vational reports in the 1990s suggesting that lower tidal volumes during MV were associated with better survival. However, no independent studies of the specific effects of hypercapnia on outcome were performed [4, 5]. In a sub-sequent study of 49 preterm infants, there was no differ-ence in mortality between patients with hypercapnia and those with normocapnia [30], leading to the conclusion that permissive hypercapnia was safe but not protective. In a secondary analysis of data from the ARDS Network Study [31], the authors reported that the presence of hypercapnic acidosis (defined as pH of <7.35 and PaCO2 of >45 mmHg) at the time of randomization, based on multivariate logistic regression analysis and controlling for other comorbidities and severity of lung injury, was associated with lower 28-day mortality only in patients
randomized to a tidal volume of 12 ml/kg. The authors found no effect on mortality among patients randomized to 6 ml/kg tidal volume. The study was limited by the small number of patients included in each subgroup and showed no difference in the patients with “protective ventilation”, where hypercapnia was expected to occur.
In our study, patients receiving lung-protective ventila-tion with a tidal volume of ≤6 ml/kg actual body weight had a high incidence of severe hypercapnia (Table 2) due to the lower tidal volume and subsequent reduction in alveolar ventilation. High ventilation/perfusion (V/Q) areas and higher dead space could also increase the level of hypercapnia due to more severe lung injury (Table 2). A correlation between high dead space and mortality has been found in patients with ARDS [26]. Therefore, in our analysis, we used the “corrected minute ventila-tion” (VEcorr) as a surrogate for dead space [27] and found that even after adjusting for VEcorr, severe hypercapnia remains strongly associated with mortality. Moreover, Brown et al. [32] showed that a minute ventilation of >13.9 l/min was an important predictor of hospital mor-tality at 90 days in acute lung injury, similar to our find-ings (>14 l/min).
Initial studies in animal models of ventilator-induced lung injury and sepsis reported beneficial effects of hypercapnia, which supported the notion of “permissive” hypercapnia for patients with lung injury [8, 9]. More recent studies have reported that high levels of PaCO2 activate specific signaling pathways, independently of pH or reactive oxygen species, leading to impaired lung function [19, 33, 34]. Furthermore, in a model of ventila-tor-induced lung injury the probability of wound repair was significantly reduced in hypercapnic conditions [9]. This concept was further explored in a study where hypercapnia caused mitochondrial stress via the activa-tion of microRNA (miR)-183, which by downregulating isocitrate dehydrogenase 2 had a detrimental effect on cell proliferation, which could explain impaired wound repair [18, 19]. It has also been reported that hypercapnia impairs innate immunity in Drosophila melanogaster [16] by decreasing the expression of antimicrobial peptides, and hypercapnia was observed to increase mortality in a mouse model of Pseudomonas aeruginosa pneumonia [20]. In addition, elevated CO2 levels have been found to contribute to increased bacterial and fungal virulence, which may render hypercapnic tissues more susceptible to infection [35–38]. These and other recently reported data suggest that hypercapnia impairs innate immu-nity via evolutionarily conserved mechanisms [17] and explain why patients exposed to hypercapnia have an impaired ability to fight infection. Furthermore, hyper-capnia has hemodynamic consequences, increasing pul-monary hypertension and worsening right ventricular
Table 4 Multivariate analysis to evaluate the adjusted effect of hypercapnia on mortality in the intensive care unit
Severe hypercapnia Mortality in the intensive care unit
p value
N Odds ratio 95% CI
Crude 1899 1.68 1.35–2.10 0.000
Adjusted 1137 2.40 1.67–3.46 0.000
After matching 342 1.58 1.04–2.41 0.032
function [38]; these effects are associated with worse out-comes in patients with acute lung injury [38–41].
The relationship between PaCO2 and ICU mortality describes a U-shaped curve (Fig. 2). Higher mortality at low PaCO2 may suggest relative hyperventilation and prevalence of lung regions with a high V/Q value and potentially ventilator-induced lung injury. Recent data show that hypocapnia is associated with worse outcome in patients with pneumonia [36, 33], although no data from ARDS patients are available.
Our study provides new information showing that hypercapnia appears to be independently associated with worse outcomes in patients with ARDS. This find-ing raises the question of whether the previously pro-posed paradigm that hypercapnia has a protective effect in patients with lung injury is safe, at least above a certain range.
Our study is a multinational survey that reflects MV practice worldwide in a real-life setting. Moreover, the prospective non-interventional design reveals, for the first time, an independent association between severe hypercapnia and ICU mortality of mechanically venti-lated ARDS patients from ICUs in 40 countries. How-ever, the study also has a number of limitations. First, the data derive from an observational study that was not pri-marily designed to test a specific hypothesis. Only 1899 of a possible total of 18,302 patients were analyzed (only recognized ARDS patients), and the numbers of patients in the hypercapnia categories were quite small. Further-more, arterial blood gases and patient–ventilator inter-action parameters were documented once daily, and a single measurement each day may have been insufficient to reflect the full respiratory progression throughout the day. However, data collection was always performed at the same time of day. Many patients had to be excluded from the analysis because arterial blood gas data were missing (11.5%; 2114/18,302 patients recruited). Another limitation is the absence of hemodynamic assessment. Finally, the causal inferences that can be drawn from observational studies are necessarily limited. Despite adjustment for oxygenation and use of a surrogate for dead space, unmeasured confounders could influence the relationship between hypercapnia and ICU mortality. By matching patients that were ventilated with tidal volumes of <8 ml/kg, we performed propensity-score matching as a sensitivity analysis, and the effect of severe hypercap-nia was consistent. We explored interactions between PLS strategy and dead space, and ARDS patients with hypercapnia still showed higher ICU mortality. We have detected a consistent effect of severe hypercapnia after dismissing known confounders, such as the presence of acidosis or a protective ventilation strategy. Also, an inde-pendent deleterious effect of acidosis on ICU mortality
was observed, although the independent effect of severe hypercapnia remained even in those ARDS patients who developed acidosis. Therefore, the adjusted risk of ICU mortality in ARDS patients with severe hypercapnia did not include the presence of acidosis in order to avoid over-adjustment [34].
In summary, the results in these cohorts of mechani-cally ventilated patients with ARDS suggest that severe hypercapnia within the first 48 h of MV is independently associated with higher ICU mortality. Our data also show that these patients have more ventilator-related com-plications. Despite our efforts to adjust for the factors involved in the causal chain between severe hypercapnia and ICU mortality, we cannot rule out the presence of unmeasured confounders, arising from the observational and non-interventional study design that may interfere with the results. Indeed, the findings have to be inter-preted as a possible biological signal that requires con-firmation by clinical trials specifically designed for this purpose. Overall, the data reported here may serve as a first step towards defining possible limits for hypercap-nia. In the absence of strong evidence, our findings may provide some guidance for reasonable limits of PaCO2 for ARDS patients in the ICU and also for potential reassess-ment of the previous assumption that severe hypercapnia is safe.
Electronic supplementary materialThe online version of this article (doi:10.1007/s00134‑016‑4611‑1) contains supplementary material, which is available to authorized users.
Author details1 Hospital de Torrejón, Madrid, Spain. 2 Department of Clinical Biostatis‑tics, Hospital Ramón Y Cajal, IRICYS and CIBERESP, Madrid, Spain. 3 CIBER Enfermedades Respiratorias, Madrid, Spain. 4 Keenan Research Centre, Li Ka Shing Knowledge Institute, St Michael’s Hospital, Toronto, Canada. 5 Interde‑partmental Division of Critical Care Medicine, University of Toronto, Toronto, Canada. 6 Interdepartmental Division of Critical Care Medicine and Depart‑ments of Medicine and Physiology, University of Toronto, Toronto, Canada. 7 Medizinische Hochschule Hannover, Hanover, Germany. 8 Hospital Nacional Alejandro Posadas, Buenos Aires, Argentina. 9 Hospital HIGA Guemes, Haedo, Argentina. 10 University Hospital of Poitiers, Poitiers, France. 11 Clínica Medellín and Universidad Pontificia Bolivariana, Medellín, Colombia. 12 Hospital Regional 1° de Octubre, ISSSTE, Mexico City, Mexico. 13 Hospital Español, Montevideo, Uruguay. 14 Alfred Hospital and Monash University, Melbourne, Australia. 15 Peking Union Medical College Hospital, Beijing, People’s Republic of China. 16 Policlinico Agostino Gemelli, Università Cattolica Del Sacro Cuore, Rome, Italy. 17 Instituto Nacional del Tórax de Santiago, Santiago, Chile. 18 Hospital de Clínicas de Caracas, Caracas, Venezuela. 19 Papageorgiou Hospital, Thessaloniki, Greece. 20 Hospital Fattouma Bourguina, Monastir, Tunisia. 21 UCINC, Hospital de Sao José, Centro Hospitalar de Lisboa Central, E.P.E., Lisbon, Portugal. 22 Hospital Universitario Sao José, Belo Horizonte, Brazil. 23 King Saud Bin Abdulaziz University for Health Sciences, Riyadh, Saudi Arabia. 24 Hospital Obrero No. 1, La Paz, Bolivia. 25 Hospital Eugenio Espejo, Quito, Ecuador. 26 Bombay Hospital Institute of Medical Sciences, Mumbai, India. 27 Asan Medical Center, University of Ulsan, Seoul, Republic of Korea. 28 Medical Center Leeuwarden (MCL), Leeuwarden, The Netherlands. 29 Holbaek Hospital, University of Copenhagen, Copenhagen, Region Zealand, Denmark. 30 Hospital Ibn Sina, Rabat, Morocco. 31 South Texas Veterans Health Care System and University of Texas Health Science Center, San Antonio, TX, USA. 32 Department of Medicine, Feinberg School of Medicine, Northwestern
University, Chicago, IL, USA. 33 Hospital Universitario de Getafe, Carretera de Toledo, Km 12,500, 28905 Madrid, Spain.
AcknowledgementsFunding for this study was provided by CIBER Enfermedades Respiratorias (CIBERES), CIBER en Epidemiología y Salud Pública (CIBERESP), Instituto de Salud Carlos III, Madrid, Spain and the Instituto Ramón y Cajal de Investigación Sanitaria (IRYCIS), Madrid, Spain. Dr. Ferguson was supported by a Canadian Institutes of Health Research New Investigator Award (Ottawa, Canada). Dr. Sznajder is funded by HL‑048129, HL‑071643 and HL‑085534.
Compliance with ethical standardsThe funding organizations had no role in the design and conduct of the study, in the collection, management, analysis, and interpretation of the data, or in the preparation, review, and approval of the manuscript.
Received: 3 July 2016 Accepted: 25 October 2016
References 1. Webb H, Tierney DF (1974) Experimental pulmonary edema due to inter‑
mittent positive pressure ventilation with high tidal inflation pressures. Am Rev Respir Dis 110:556–565
2. Dreyfuss D, Soler P, Basset G, Saumon G (1988) High inflation pressure pulmonary edema. Respective effects of high airway pressure, high tidal volume, and positive end‑expiratory pressure. Am Rev Respir Dis 137:1159–1164
3. Corbridge TC, Wood LD, Crawford GP, Chudoba MJ, Yanos J, Sznajder JI (1990) Adverse effects of large tidal volume and low PEEP in canine acid aspiration. Am Rev Respir Dis 142:311–315
4. Hickling KG, Henderson SJ, Jackson R (1990) Low mortality associated with low volume pressure limited ventilation with permissive hypercapnia in severe adult respiratory distress syndrome. Intensive Care Med 16:372–377
5. Stewart TE, Meade MO, Cook DJ, Stewart TE, Meade MO, Cook DJ, Pres‑sure‑ and Volume‑Limited Ventilation Strategy Group (1998) Evaluation of a ventilation strategy to prevent barotrauma in patients at high risk for acute respiratory distress syndrome. N Engl J Med 338:355–361
6. Amato MB, Barbas CS, Medeiros DM, Magaldi RB, Schettino GP, Lorenzi‑Filho G, Kairalla RA, Deheinzelin D, Munoz C, Oliveira R, Takagaki TY, Carvalho CR (1998) Effect of a protective‑ventilation strategy on mortality in the acute respiratory distress syndrome. N Engl J Med 338:347–354
7. The Acute Respiratory Distress Syndrome Network (2000) Ventilation with lower tidal volumes as compared with traditional tidal volumes for acute lung injury and the acute respiratory distress syndrome. N Engl J Med 342:1301–1308
8. Broccard AF, Hotchkiss JR, Vannay C, Markert M, Sauty A, Feihl F, Schaller MD (2001) Protective effects of hypercapnic acidosis on ventilator‑induced lung injury. Am J Respir Crit Care Med 22:802–806
9. Sinclair SE, Kregenow DA, Lamm WJ, Starr IR, Chi EY, Hlastala MP (2002) Hypercapnic acidosis is protective in an in vivo model of ventilator‑induced lung injury. Am J Respir Crit Care Med 166:403–408
10. Feihl F, Perret C (1994) Permissive hypercapnia: how permissive should we be? Am J Respir Crit Care Med 150:1722–1737
11. Laffey JG, Kavanagh BP (1999) Carbon dioxide and the critically ill—too little of a good thing? Lancet 354:1283–1286
12. Laffey JG, Tanaka M, Engelberts D, Luo X, Yuan S, Tanswell AK, Post M, Lindsay T, Kavanagh BP (2000) Therapeutic hypercapnia reduces pulmo‑nary and systemic injury following in vivo lung reperfusion. Am J Respir Crit Care Med 162:2287–2294
13. Jaitovich A, Angulo M, Lecuona E, Dada LA, Welch LC, Cheng Y, Gusarova G, Ceco E, Liu C, Shigemura M, Barreiro E, Patterson C, Nader GA, Sznajder JI (2015) High CO2 levels cause skeletal muscle atrophy via AMP‑activated kinase (AMPK), FoxO3a protein, and muscle‑specific Ring finger protein 1 (MuRF1). J Biol Chem 290:9183–9194
14. Briva A, Vadász I, Lecuona E, Welch LC, Chen J, Dada LA, Trejo HE, Duma‑sius V, Azzam ZS, Myrianthefs PM, Batlle D, Gruenbaum Y, Sznajder JI (2007) High CO2 levels impair alveolar epithelial function independently of pH. PLoS ONE 211:1238
15. Doerr CH, Gajic O, Berrios JC, Caples S, Abdel M, Lymp JF, Hubmayr RD (2005) Hypercapnic acidosis impairs plasma membrane wound resealing in ventilator‑injured lungs. Am J Respir Crit Care Med 171:1371–1377
16. Helenius IT, Krupinski T, Turnbull DW, Gruenbaum Y, Silverman N, Johnson EA, Sporn PH, Sznajder JI, Beitel GJ (2009) Elevated CO2 suppresses specific drosophila innate immune responses and resistance to bacterial infection. Proc Natl Acad Sci USA 106:18710–18715
17. Sharabi K, Hurwitz A, Simon AJ, Beitel GJ, Morimoto RI, Rechavi G, Sznajder JI, Gruenbaum Y (2009) Elevated CO2 levels affect development, motility, and fertility and extend life span in Caenorhabditis elegans. Proc Natl Acad Sci USA 106:4024–4029
18. Vohwinkel CU, Lecuona E, Sun H, Sommer N, Vadász I, Chandel NS, Sznajder JI (2011) Hypercapnia leads to mitochondrial dysfunction and decreased cell proliferation. J Biol Chem 286:37067–37076
19. Vadász I, Dada LA, Briva A, Helenius IT, Sharabi K, Welch LC, Kelly AM, Grzesik BA, Budinger GR, Liu J, Seeger W, Beitel GJ, Gruenbaum Y, Sznajder JI (2012) Evolutionary conserved role of c‑Jun‑N‑terminal kinase in CO2‑induced epithelial dysfunction. PLoS ONE 7:e46696
20. Gates KL, Howell HA, Nair A (2013) Hypercapnia impairs lung neutrophil function and increases mortality in murine Pseudomonas pneumonia. Am J Respir Cell Mol Biol 49:821–828
21. Dada LA, Trejo Bittar HE, Welch LC, Vagin O, Deiss‑Yehiely N, Kelly AM, Baker MR, Capri J, Cohn W, Whitelegge JP, Vadász I, Gruenbaum Y, Sznajder JI (2015) High CO2 leads to Na, K‑ATPase endocytosis via c‑Jun amino‑termi‑nal kinase‑induced LMO7b phosphorylation. Mol Cell Biol 35:3962–3973
22. Bharat A, Graf N, Mullen A, Kanter J, Andrei AC, Sporn PH, DeCamp MM, Sznajder JI (2016) Pleural hypercarbia after lung surgery is associated with persistent alveolo‑pleural fistulae. Chest 149:220–227
23. Esteban A, Anzueto A, Frutos F, Alía I, Brochard L, Stewart TE, Benito S, Epstein SK, Apezteguía C, Nightingale P, Arroliga AC, Tobin MJ, Mechani‑cal Ventilation International Study Group (2002) Characteristics and outcomes in adult patients receiving mechanical ventilation: a 28‑day international study. JAMA 287:345–355
24. Esteban A, Ferguson ND, Meade MO, Frutos‑Vivar F, Apezteguia C, Brochard L, Raymondos K, Nin N, Hurtado J et al (2008) Evolution of mechanical ventilation in response to clinical research. Am J Respir Crit Care Med 177:170–177
25. Esteban A, Frutos‑Vivar F, Muriel A, Ferguson ND, Peñuelas O, Abraira V, Raymondos K, Rios F, Nin N, Apezteguía C et al (2013) Evolution of mor‑tality over time in patients receiving mechanical ventilation. Am J Respir Crit Care Med 188:220–230
26. Nuckton TJ, Alonso JA, Kallet RH, Daniel BM, Pittet JF, Eisner MD, Matthay MA (2002) Pulmonary dead‑space fraction as a risk factor for death in the acute respiratory distress syndrome. N Engl J Med 346:1281–1286
27. Wexler HR, Lok P (1981) A simple formula for adjusting arterial carbon dioxide tension. Can Anaesth Soc J 28:370–372
28. Rosenbaum P, Rubin D (1983) The central role of the propensity score in observational studies for causal effects. Biometrika 70:41–55
29. Austin PC (2011) Optimal caliper widths for propensity‑score matching when estimating differences in means and differences in proportions in observational studies. Pharm Stat 10:150–161
30. Mariani G, Cifuentes J, Carlo WA (1999) Randomized trial of permissive hypercapnia in preterm infants. Pediatrics 104:1082–1088
31. Kregenow DA, Rubenfeld GD, Hudson LD, Swenson ER (2006) Hypercap‑nic acidosis and mortality in acute lung injury. Crit Care Med 34:1–7
32. Brown LM, Calfee CS, Matthay MA, Brower RG, Thompson BT, Checkley W, National Institutes of Health Acute Respiratory Distress Syndrome Network Investigators (2011) A simple classification model for hospital mortality in patients with acute lung injury managed with lung protec‑tive ventilation. Crit Care Med 39:2645–2651
33. Laserna E, Sibila O, Aguilar PR, Mortensen EM, Anzueto A, Blanquer JM, Sanz F, Rello J, Marcos PJ, Velez MI, Aziz N, Restrepo MI (2012) Hypocap‑nia and hypercapnia are predictors for ICU admission and mortality in hospitalized patients with community‑acquired pneumonia. Chest 142:1193–1199
34. Schisterman EF, Cole SR, Platt RW (2009) Over adjustment bias and unnecessary adjustment in epidemiologic studies. Epidemiology 20:488–495
35. Passalacqua KD, Varadarajan A, Byrd B, Bergman NH (2009) Comparative transcriptional profiling of Bacillus cereus sensu lato strains during growth in CO2‑bicarbonate and aerobic atmospheres. PLoS ONE 4:e4904
36. Sin DD, Man SF, Marrie TJ (2005) Arterial carbon dioxide tension on admission as a marker of in‑hospital mortality in community‑acquired pneumonia. Am J Med 118:145–150
37. Granger DL, Perfect JR, Durack DT (1985) Virulence of Cryptococcus neofor-mans: regulation of capsule synthesis by carbon dioxide. J Clin Invest 76:508–516
38. Mekontso Dessap A, Charron C, Devaquet J, Aboab J, Jardin F, Brochard L, Vieillard‑Baron A (2009) Impact of acute hypercapnia and augmented positive end‑expiratory pressure on right ventricle function in severe acute respiratory distress syndrome. Intensive Care Med 35:1850–1858
39. Bull TM, Clark B, McFann K, Moss M (2010) Pulmonary vascular dysfunc‑tion is associated with poor outcomes in patients with acute lung injury. Am J Respir Crit Care Med 182:1123–1128
40. Boissier F, Katsahian S, Razazi K, Thille AW, Roche‑Campo F, Leon R, Vivier E, Brochard L, Vieillard‑Baron A, Brun‑Buisson C, Mekontso Dessap A (2013) Prevalence and prognosis of cor‑pulmonale during protective ventilation for acute respiratory distress syndrome. Intensive Care Med 39:1725–1733
41. Schmitt JM, Vieillard‑Baron A, Augarde R, Prin S, Page B, Jardin F (2001) Acute cor pulmonale in acute respiratory distress syndrome submitted to protective ventilation: incidence, clinical implications, and prognosis. Crit Care Med 29:1551–1555