The Alice Software System Randy Pausch Carnegie Mellon University [email protected] .
Upload
julie-youngCategory
view
217download
0
Severe Acute Respiratory Syndrome
What can we do to help?
Ed Fredkin
CMU -- [email protected] [email protected] 4 April 2003
SARS
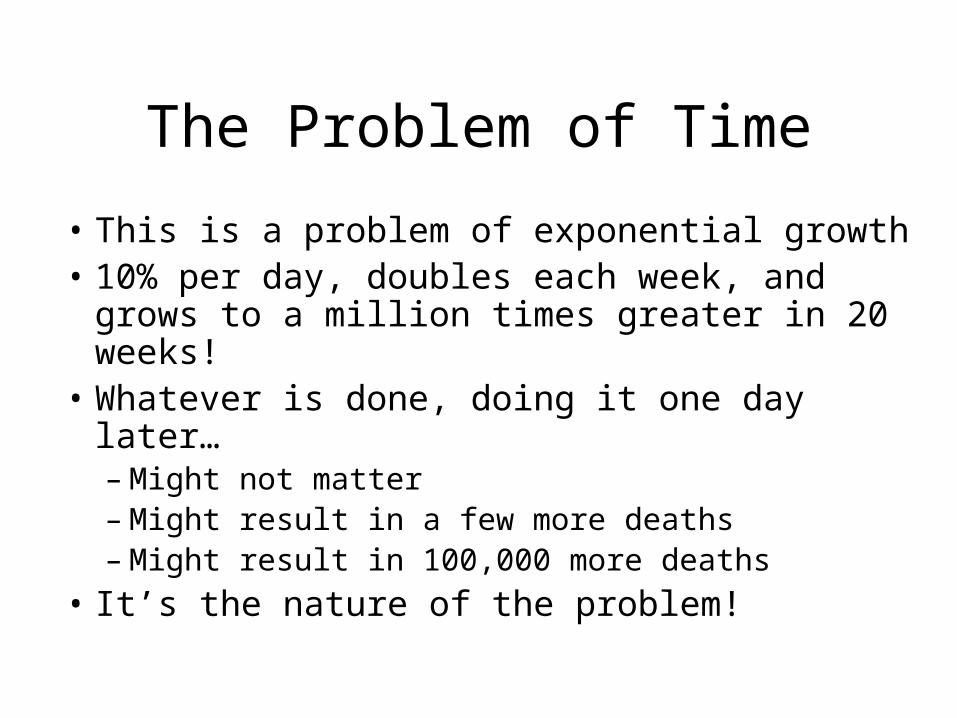
The Problem of Time
• This is a problem of exponential growth• 10% per day, doubles each week, and grows to
a million times greater in 20 weeks!• Whatever is done, doing it one day later…
– Might not matter– Might result in a few more deaths– Might result in 100,000 more deaths
• It’s the nature of the problem!
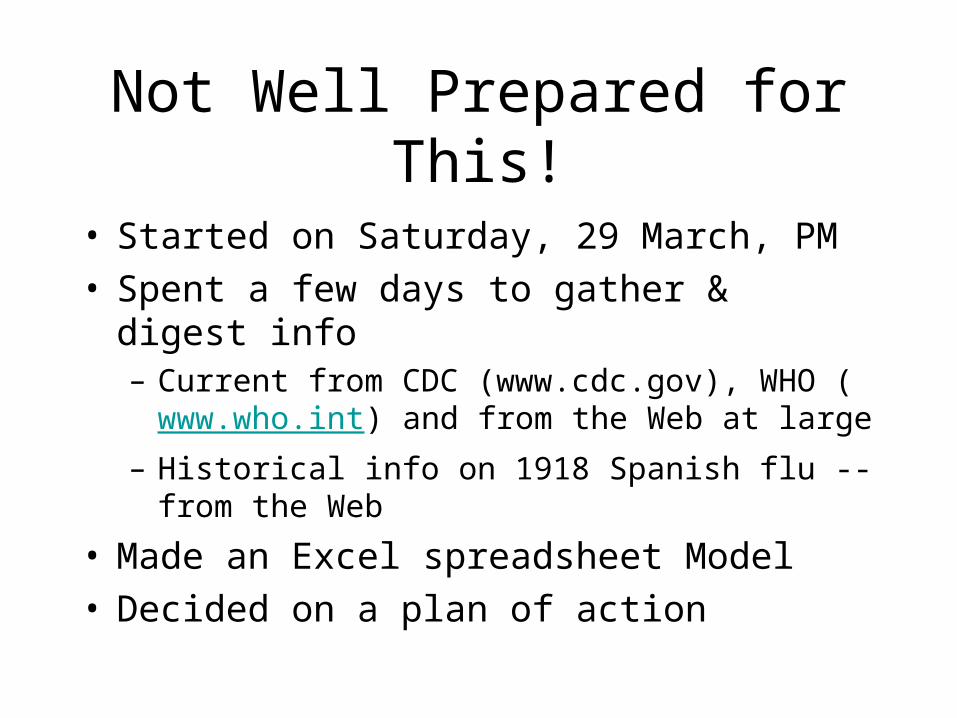
Not Well Prepared for This!
• Started on Saturday, 29 March, PM• Spent a few days to gather & digest info
– Current from CDC (www.cdc.gov), WHO (www.who.int) and from the Web at large
– Historical info on 1918 Spanish flu -- from the Web
• Made an Excel spreadsheet Model• Decided on a plan of action
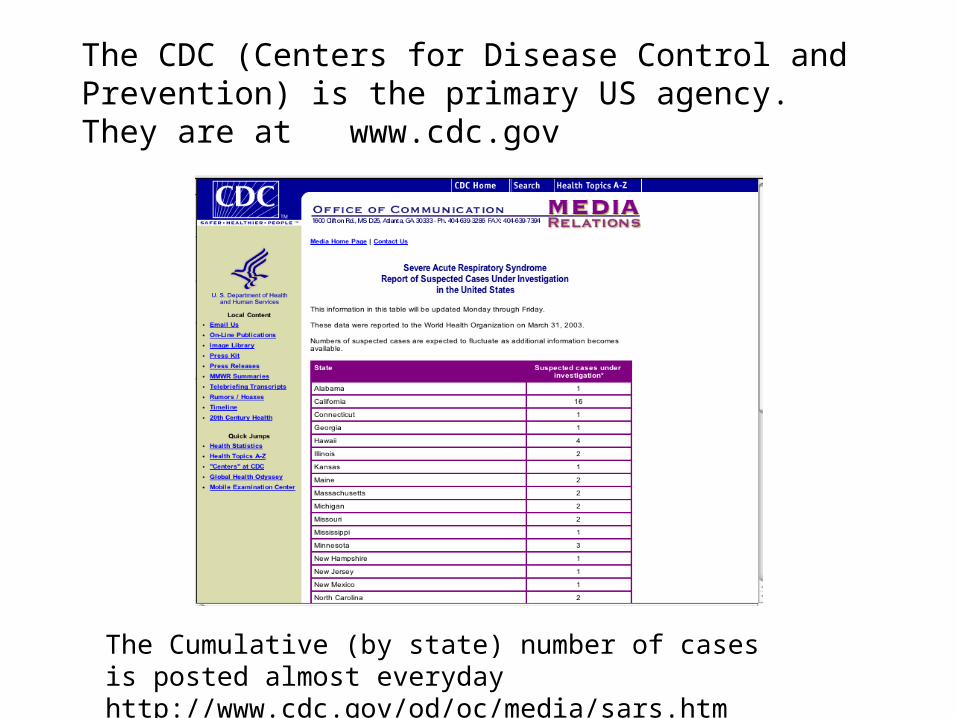
The CDC (Centers for Disease Control and Prevention) is the primary US agency. They are at www.cdc.gov
The Cumulative (by state) number of cases is posted almost everyday http://www.cdc.gov/od/oc/media/sars.htm
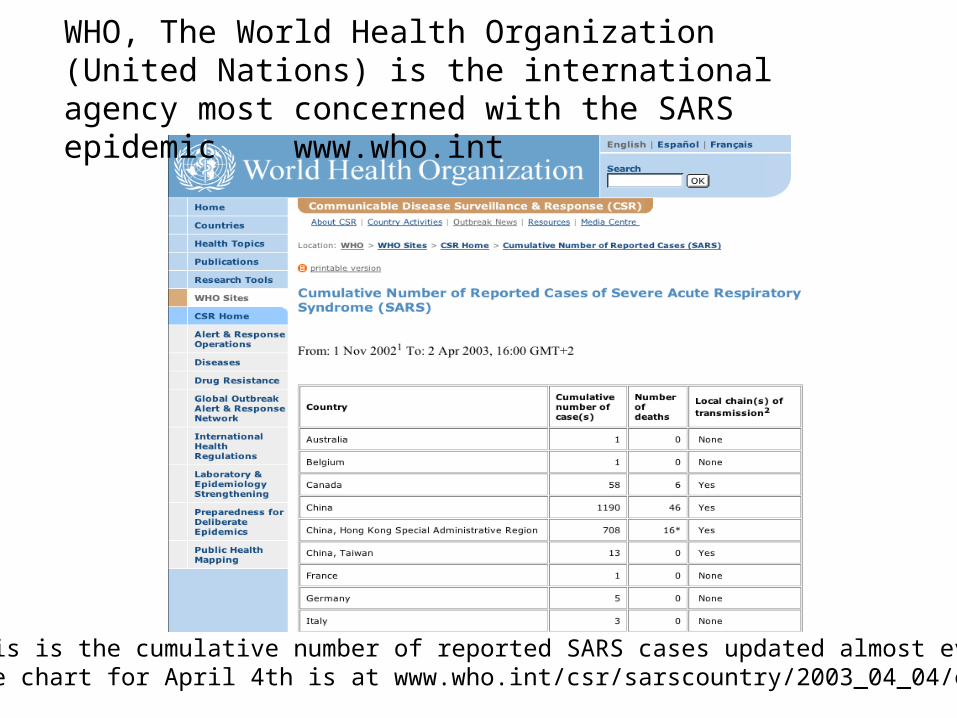
WHO, The World Health Organization (United Nations) is the international agency most concerned with the SARS epidemic www.who.int
This is the cumulative number of reported SARS cases updated almost every dayThe chart for April 4th is at www.who.int/csr/sarscountry/2003_04_04/en/
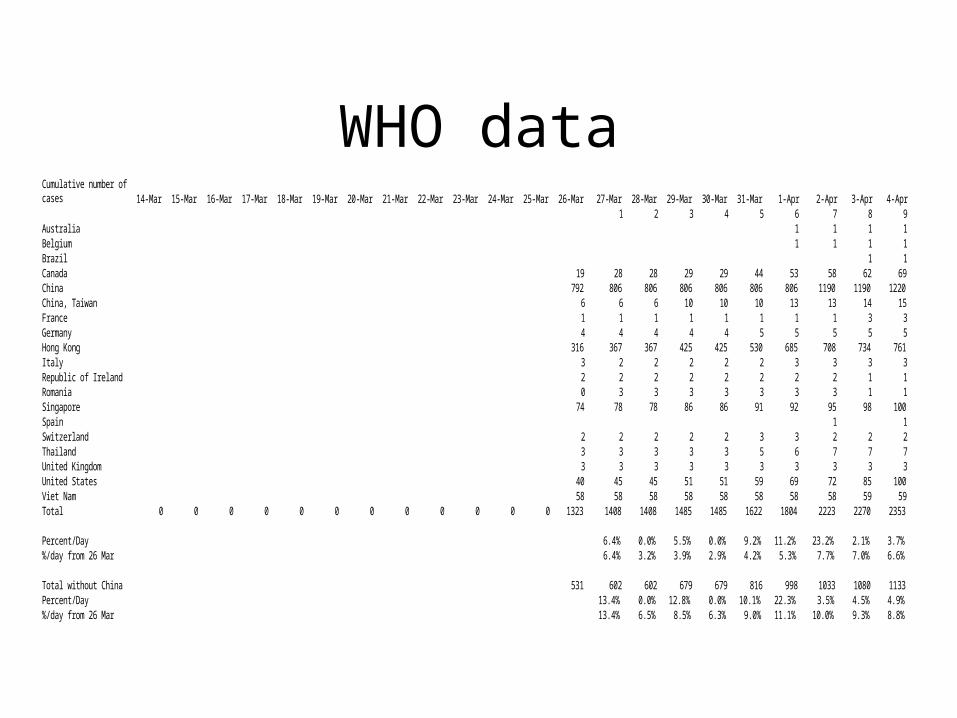
WHO dataCumulative number of cases 14-Mar 15-Mar 16-Mar 17-Mar 18-Mar 19-Mar 20-Mar 21-Mar 22-Mar 23-Mar 24-Mar 25-Mar 26-Mar 27-Mar 28-Mar 29-Mar 30-Mar 31-Mar 1-Apr 2-Apr 3-Apr 4-Apr
1 2 3 4 5 6 7 8 9Australia 1 1 1 1Belgium 1 1 1 1Brazil 1 1Canada 19 28 28 29 29 44 53 58 62 69China 792 806 806 806 806 806 806 1190 1190 1220China, Taiwan 6 6 6 10 10 10 13 13 14 15France 1 1 1 1 1 1 1 1 3 3Germany 4 4 4 4 4 5 5 5 5 5Hong Kong 316 367 367 425 425 530 685 708 734 761Italy 3 2 2 2 2 2 3 3 3 3Republic of Ireland 2 2 2 2 2 2 2 2 1 1Romania 0 3 3 3 3 3 3 3 1 1Singapore 74 78 78 86 86 91 92 95 98 100Spain 1 1Switzerland 2 2 2 2 2 3 3 2 2 2Thailand 3 3 3 3 3 5 6 7 7 7United Kingdom 3 3 3 3 3 3 3 3 3 3United States 40 45 45 51 51 59 69 72 85 100Viet Nam 58 58 58 58 58 58 58 58 59 59Total 0 0 0 0 0 0 0 0 0 0 0 0 1323 1408 1408 1485 1485 1622 1804 2223 2270 2353
Percent/Day 6.4% 0.0% 5.5% 0.0% 9.2% 11.2% 23.2% 2.1% 3.7%%/day from 26 Mar 6.4% 3.2% 3.9% 2.9% 4.2% 5.3% 7.7% 7.0% 6.6%
Total without China 531 602 602 679 679 816 998 1033 1080 1133Percent/Day 13.4% 0.0% 12.8% 0.0% 10.1% 22.3% 3.5% 4.5% 4.9%%/day from 26 Mar 13.4% 6.5% 8.5% 6.3% 9.0% 11.1% 10.0% 9.3% 8.8%

Hong Kong is in the Forefront
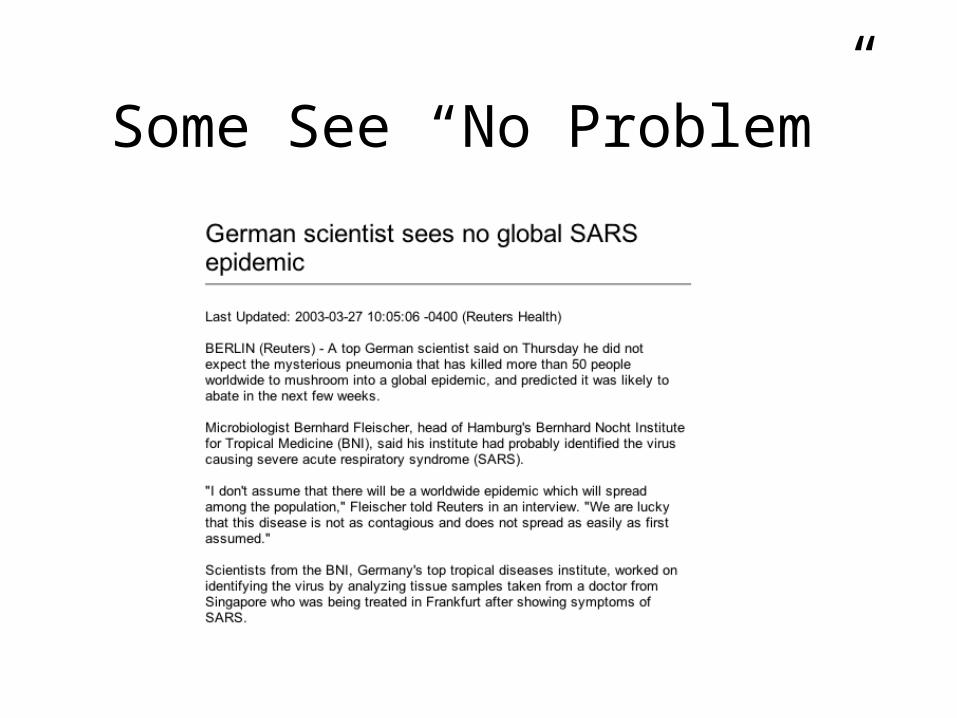
Some See “No Problem”
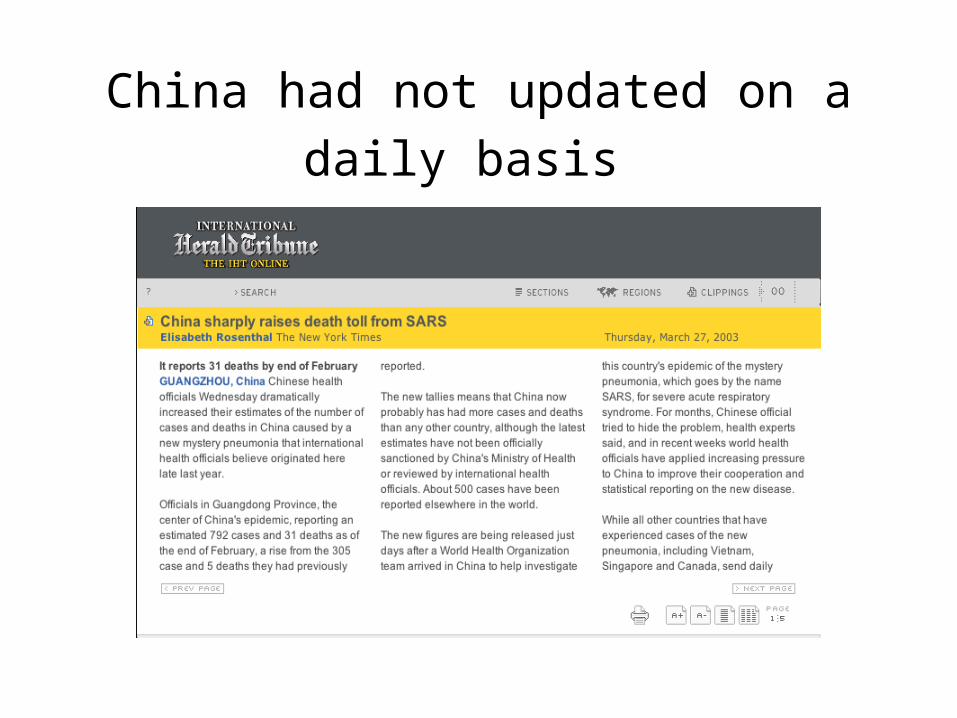
China had not updated on a daily basis

SARS #1 issue after April 2nd!
www.cdc.gov
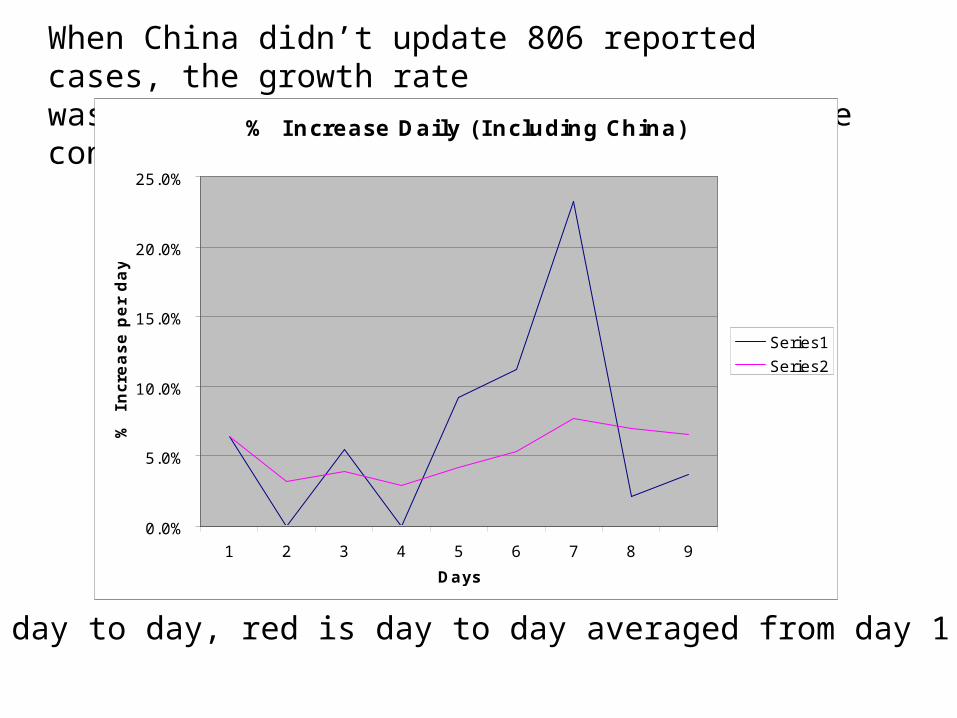
When China didn’t update 806 reported cases, the growth ratewas underestimated at 6.6% (because of the constant 806 cases)
Blue is day to day, red is day to day averaged from day 1
% Increase Daily (I ncluding China)
0.0%
5.0%
10.0%
15.0%
20.0%
25.0%
1 2 3 4 5 6 7 8 9
Days
% I
ncr
ease p
er
day
Series1
Series2
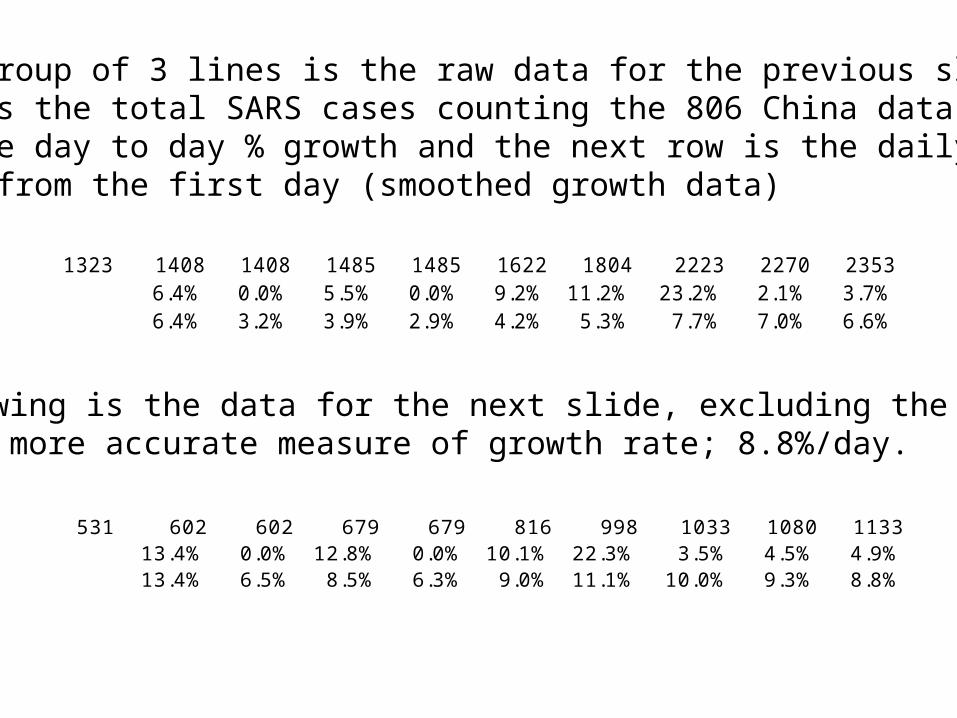
The top group of 3 lines is the raw data for the previous slide. The top row is the total SARS cases counting the 806 China data. Therow is the day to day % growth and the next row is the daily growth computed from the first day (smoothed growth data)
The following is the data for the next slide, excluding the China data to give a more accurate measure of growth rate; 8.8%/day.
1323 1408 1408 1485 1485 1622 1804 2223 2270 23536.4% 0.0% 5.5% 0.0% 9.2% 11.2% 23.2% 2.1% 3.7%6.4% 3.2% 3.9% 2.9% 4.2% 5.3% 7.7% 7.0% 6.6%
531 602 602 679 679 816 998 1033 1080 113313.4% 0.0% 12.8% 0.0% 10.1% 22.3% 3.5% 4.5% 4.9%13.4% 6.5% 8.5% 6.3% 9.0% 11.1% 10.0% 9.3% 8.8%
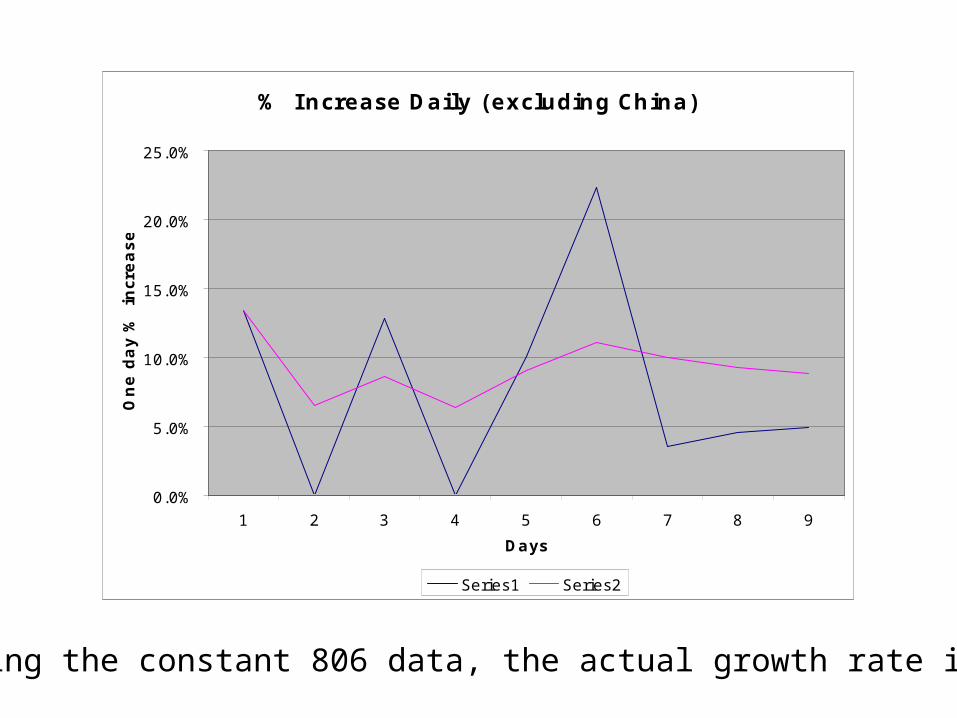
Excluding the constant 806 data, the actual growth rate is 8.8%
% Increase Daily (excluding China)
0.0%
5.0%
10.0%
15.0%
20.0%
25.0%
1 2 3 4 5 6 7 8 9
Days
One d
ay %
incr
ease
Series1 Series2
0
5
10
15
20
25
30
1 3 5 7 9 11 13 15 17 19 21 23 25 27 29 31 33 35 37
Series1
Series2
Series3
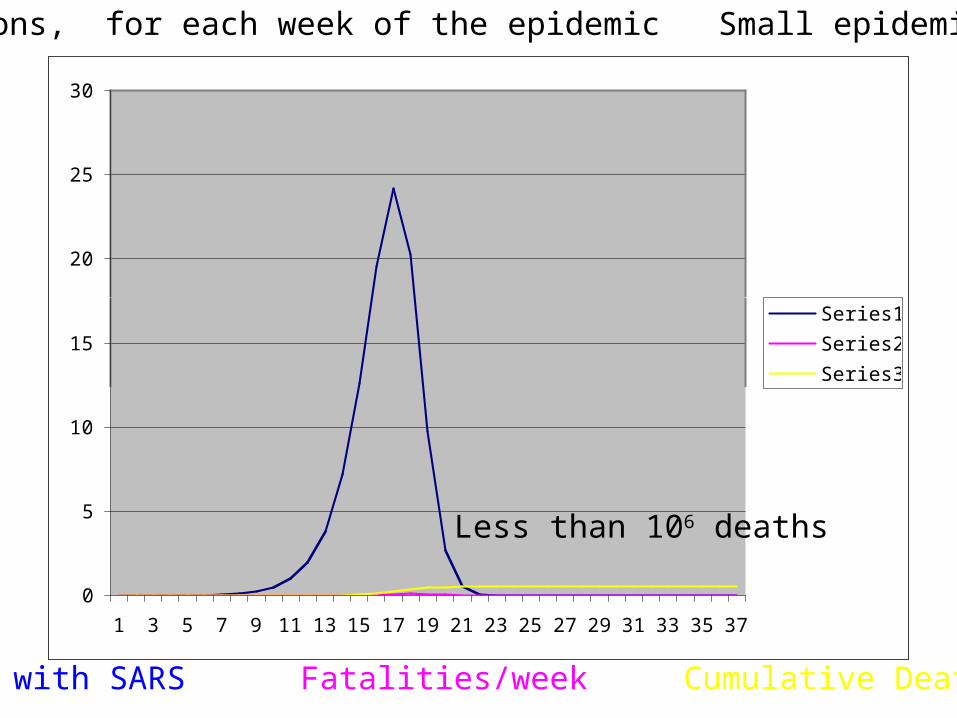
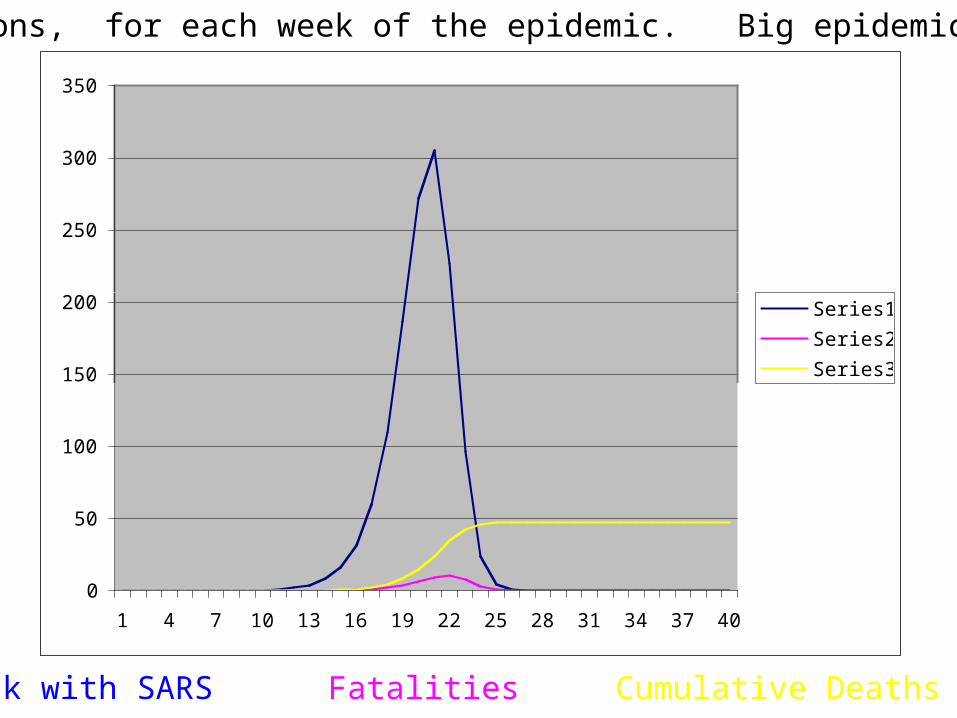
Sick with SARS Fatalities/week Cumulative Deaths
Millions, for each week of the epidemic Small epidemic
Less than 106 deaths
0
50
100
150
200
250
300
350
1 4 7 10 13 16 19 22 25 28 31 34 37 40
Series1
Series2
Series3
Sick with SARS Fatalities Cumulative Deaths
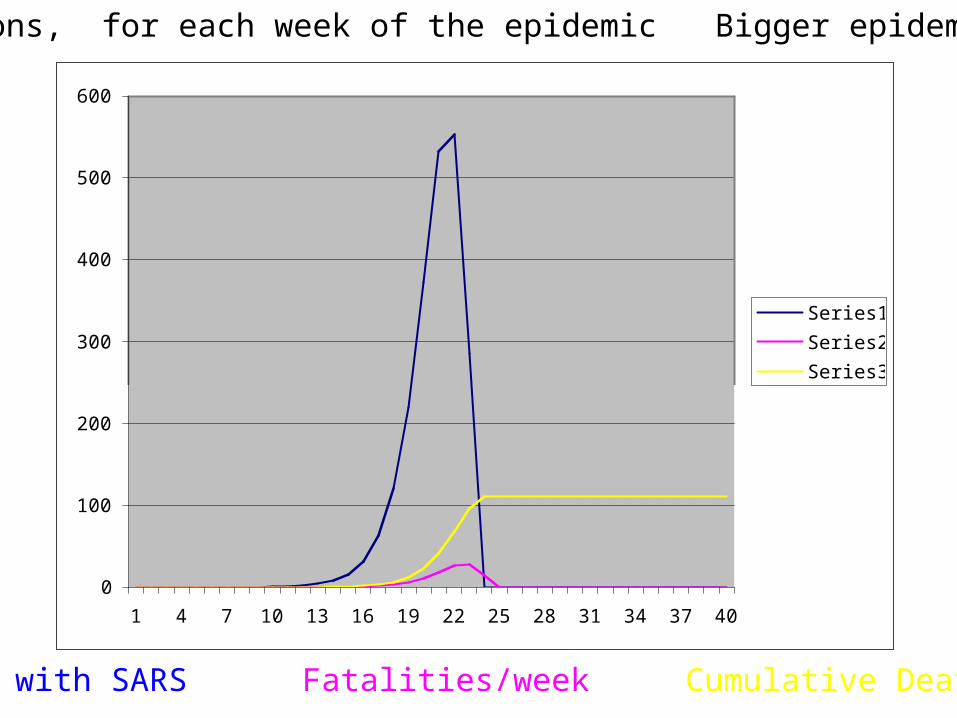
Millions, for each week of the epidemic. Big epidemic
0
100
200
300
400
500
600
1 4 7 10 13 16 19 22 25 28 31 34 37 40
Series1
Series2
Series3
Sick with SARS Fatalities/week Cumulative Deaths
Millions, for each week of the epidemic Bigger epidemic
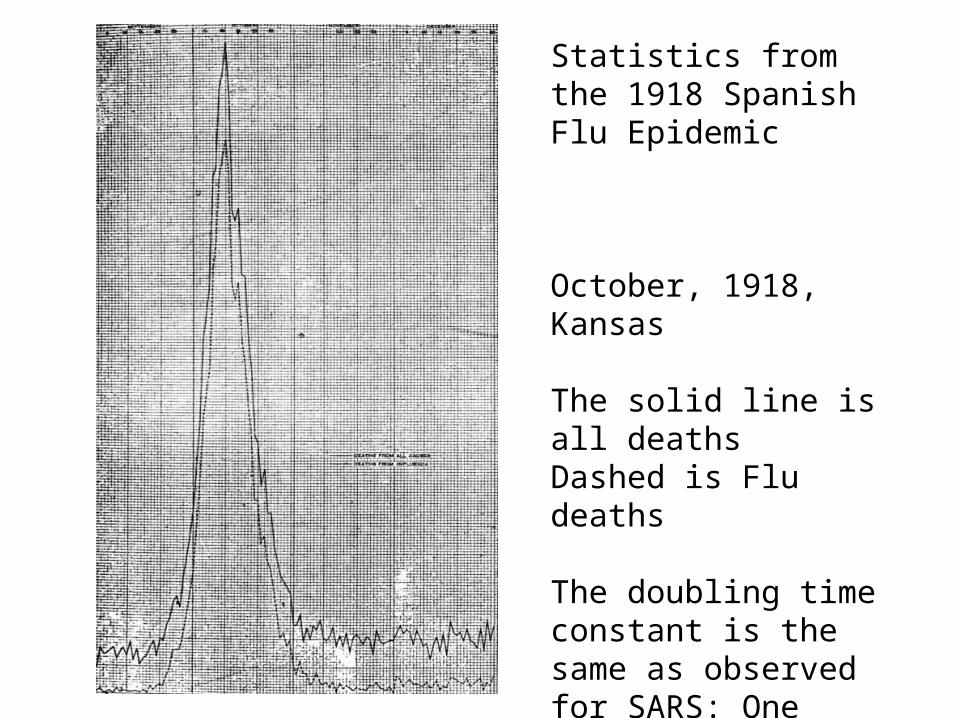
Statistics from the 1918 Spanish Flu Epidemic
October, 1918, Kansas
The solid line is all deathsDashed is Flu deaths
The doubling time constant is the same as observed for SARS: One Week!
Major Issues
• At some early point there may be no further help because the number sick will be too, too many!– No more room in any hospital
– No rooms in any temporary hospitals
– No available Doctors, nurses or medics
– No life saving equipment
– No medication or other profession care
• The death rate may then increase
What to Do?
• Think rationally
• Make good models
• Use them and make them better!– Using Excel– Transparent; easy to understand and use– All independent parameters changeable– Clear and understandable
Maximize Utility
• Compare the Utilities of various options
• Show what can be controlled & what can’t
• Show the benefit of early intervention
• Show the consequences of unnecessary delay
• Show the consequences of indecision
• Show advantages of world-wide cooperation
• Show how lives can be saved or lost

Who can best do this?
• Just people who have nothing better to do? No!• Some top computer programmers & others must
stop doing other important things and work on this!• It might be a waste of time• When it’s obviously important; it may be too late!• Maybe it is too late already, maybe its not too late.• The stakes are bigger than anything ever before.
We are proceeding!
• This project is underway• We will make contacts at the CDC and WHO
– So what we do will be as useful as possible
• We will need general and organizational support from MIT & CMU to proceed swiftly & efficiently
• We need to encourage very serious and capable workers to implement and deploy the best possible tools
• What cannot be tolerated is delay!