SEVENTH FRAMEWORK PROGRAMME - SysSec: … FRAMEWORK PROGRAMME Information & Communication...
96
SEVENTH FRAMEWORK PROGRAMME Information & Communication Technologies Trustworthy ICT NETWORK OF EXCELLENCE A European Network of Excellence in Managing Threats and Vulnerabilities in the Future Internet: Europe for the World † Deliverable D5.5: Final Report on Malware and Fraud Abstract: This deliverable presents the final report on what we have seen and worked on in regards to Malicious Software (Malware) and fraud- ulent activity on the Internet. It also presents the findings and outcome of discussions from four years of working group meetings. Together with the SysSec consortium and selected experts from both academia and the indus- try, it sheds a light on why so many computer systems are considered unsafe today. Contractual Date of Delivery September 2014 Actual Date of Delivery November 2014 Deliverable Dissemination Level Public Editors Christian Platzer, Martina Lindorfer Contributors All SysSec partners Quality Assurance POLIMI, IICT-BAS The SysSec consortium consists of: FORTH-ICS Coordinator Greece Politecnico Di Milano Principal Contractor Italy Vrije Universiteit Amsterdam Principal Contractor The Netherlands Institut Eur´ ecom Principal Contractor France IICT-BAS Principal Contractor Bulgaria Technical University of Vienna Principal Contractor Austria Chalmers University Principal Contractor Sweden TUBITAK-BILGEM Principal Contractor Turkey † The research leading to these results has received funding from the European Union Seventh Framework Programme (FP7/2007-2013) under grant agreement n° 257007.
Transcript of SEVENTH FRAMEWORK PROGRAMME - SysSec: … FRAMEWORK PROGRAMME Information & Communication...
SEVENTH FRAMEWORK PROGRAMMEInformation & Communication Technologies
Trustworthy ICT
NETWORK OF EXCELLENCE
A European Network of Excellence in Managing Threats andVulnerabilities in the Future Internet: Europe for the World †
Deliverable D5.5: Final Report on Malware and FraudAbstract: This deliverable presents the final report on what we have
seen and worked on in regards to Malicious Software (Malware) and fraud-ulent activity on the Internet. It also presents the findings and outcome ofdiscussions from four years of working group meetings. Together with theSysSec consortium and selected experts from both academia and the indus-try, it sheds a light on why so many computer systems are considered unsafetoday.
Contractual Date of Delivery September 2014Actual Date of Delivery November 2014Deliverable Dissemination Level PublicEditors Christian Platzer, Martina LindorferContributors All SysSec partnersQuality Assurance POLIMI, IICT-BAS
The SysSec consortium consists of:
FORTH-ICS Coordinator GreecePolitecnico Di Milano Principal Contractor ItalyVrije Universiteit Amsterdam Principal Contractor The NetherlandsInstitut Eurecom Principal Contractor FranceIICT-BAS Principal Contractor BulgariaTechnical University of Vienna Principal Contractor AustriaChalmers University Principal Contractor SwedenTUBITAK-BILGEM Principal Contractor Turkey
† The research leading to these results has received funding from the European UnionSeventh Framework Programme (FP7/2007-2013) under grant agreement n° 257007.

www.syssec-project.eu 2 November 12, 2014
Document Revisions & Quality Assurance
Internal Reviewers
1. Vladimir Dimitrov (IICT-BAS)2. Michele Carminati (POLIMI)3. Matthias Neugschwandtner (TUV)4. Stefano Zanero (POLIMI)
RevisionsVer. Date By Overview1.0.0 2014-11-12 Editor Final review of deliverable consistency and elements.0.3.1 2014-10-08 #3 Paper list included. Further proofread.0.3.0 2014-09-23 #1 Quality check by IICT-BAS. Changes incorporated0.2.0 2014-09-21 #4 Quality check by POLIMI. Changes incorporated0.1.2 2014-09-20 #2 Remarks on opening and structure.0.1.1 2014-08-20 Editor Chapters harmonized and correlated to each other.0.1.0 2014-08-13 Editor Chapters added. Deliverable in first draft stage.0.0.2 2014-06-06 Editor Completed chapter structure and approximate content.0.0.1 2014-04-04 Editor Created document Stub.
www.syssec-project.eu 3 November 12, 2014

www.syssec-project.eu 4 November 12, 2014
Contents
1 Foreword 111.1 Malware and Fraud Related Works of the SysSec Consortium . 12
2 Malware infection 192.1 The Gene architecture . . . . . . . . . . . . . . . . . . . . . . 212.2 Heuristics . . . . . . . . . . . . . . . . . . . . . . . . . . . . . 22
2.2.1 Resolving kernel32.dll . . . . . . . . . . . . . . . . . . 222.2.2 Process Memory Scanning . . . . . . . . . . . . . . . . 232.2.3 SEH-based GetPC Code . . . . . . . . . . . . . . . . . 24
2.3 Evaluating Gene . . . . . . . . . . . . . . . . . . . . . . . . . 252.3.1 Detection Effectiveness . . . . . . . . . . . . . . . . . . 252.3.2 Runtime Performance . . . . . . . . . . . . . . . . . . 27
2.4 Discussion . . . . . . . . . . . . . . . . . . . . . . . . . . . . . 28
3 Malware Evasion 293.1 Evasion prevalence in malware . . . . . . . . . . . . . . . . . 31
3.1.1 DISARM Architecture . . . . . . . . . . . . . . . . . . . 333.2 Behavior Comparison . . . . . . . . . . . . . . . . . . . . . . . 33
3.2.1 Behavior Normalization . . . . . . . . . . . . . . . . . 343.2.2 Distance Measure and Scoring . . . . . . . . . . . . . . 35
3.3 Evaluation . . . . . . . . . . . . . . . . . . . . . . . . . . . . . 363.3.1 Large Scale Test . . . . . . . . . . . . . . . . . . . . . . 363.3.2 Qualitative Results . . . . . . . . . . . . . . . . . . . . 37
3.4 Discussion . . . . . . . . . . . . . . . . . . . . . . . . . . . . . 39
4 Malware experiments 414.1 Designing experiments . . . . . . . . . . . . . . . . . . . . . . 424.2 Correct Datasets . . . . . . . . . . . . . . . . . . . . . . . . . 43
5
4.2.1 Check if goodware samples should be removed fromdatasets . . . . . . . . . . . . . . . . . . . . . . . . . . 43
4.2.2 Balance datasets over malware families . . . . . . . . 434.2.3 Check whether training and evaluation datasets should
have distinct families . . . . . . . . . . . . . . . . . . . 434.2.4 Perform analysis with higher privileges than the mal-
wares . . . . . . . . . . . . . . . . . . . . . . . . . . . 444.2.5 Discuss and if necessary mitigate analysis artifacts and
biases . . . . . . . . . . . . . . . . . . . . . . . . . . . 444.2.6 Use caution when blending malware activity traces
into benign background activity . . . . . . . . . . . . . 444.3 Transparency . . . . . . . . . . . . . . . . . . . . . . . . . . . 44
4.3.1 State family names of employed malware samples . . 444.3.2 List which malware was analyzed when . . . . . . . . 454.3.3 Explain the malware sample selection . . . . . . . . . 454.3.4 Mention the system used during execution . . . . . . . 454.3.5 Describe the network connectivity of the analysis en-
vironment . . . . . . . . . . . . . . . . . . . . . . . . . 454.3.6 Analyze the reasons for false positives and false nega-
tives . . . . . . . . . . . . . . . . . . . . . . . . . . . . 464.3.7 Analyze the nature/diversity of true positives . . . . . 46
4.4 Realism . . . . . . . . . . . . . . . . . . . . . . . . . . . . . . 464.4.1 Evaluate relevant malware families . . . . . . . . . . . 464.4.2 Perform real-world evaluations . . . . . . . . . . . . . 464.4.3 Exercise caution generalizing from a single OS ver-
sion, such as Windows XP . . . . . . . . . . . . . . . . 464.4.4 Choose appropriate malware stimuli . . . . . . . . . . 464.4.5 Consider allowing Internet access to malware . . . . . 47
4.5 Safety . . . . . . . . . . . . . . . . . . . . . . . . . . . . . . . 474.5.1 Deploy and describe containment policies . . . . . . . 47
4.6 Discussion . . . . . . . . . . . . . . . . . . . . . . . . . . . . . 47
5 URL Shortening Services 495.1 Security Threats and Countermeasures . . . . . . . . . . . . . 495.2 Current Countermeasures . . . . . . . . . . . . . . . . . . . . 50
5.2.1 Deferred Malicious URLs . . . . . . . . . . . . . . . . . 525.3 Measurement Approach . . . . . . . . . . . . . . . . . . . . . 53
5.3.1 Measurement . . . . . . . . . . . . . . . . . . . . . . . 555.4 Results . . . . . . . . . . . . . . . . . . . . . . . . . . . . . . . 57
5.4.1 Malicious Short URLs . . . . . . . . . . . . . . . . . . 575.4.2 The Short URLs Ecosystem . . . . . . . . . . . . . . . . 62
5.5 Discussion . . . . . . . . . . . . . . . . . . . . . . . . . . . . . 68
www.syssec-project.eu 6 November 12, 2014
6 Spam Mitigation 696.1 Spam Bot Identification . . . . . . . . . . . . . . . . . . . . . 69
6.1.1 Data Collection and Pre-processing . . . . . . . . . . . 706.1.2 Structural and Temporal Properties of Email Networks 716.1.3 Anomalies in Email Network Structure . . . . . . . . . 766.1.4 Discussion . . . . . . . . . . . . . . . . . . . . . . . . . 77
6.2 Emails in the Gray Area . . . . . . . . . . . . . . . . . . . . . 786.2.1 Approach . . . . . . . . . . . . . . . . . . . . . . . . . 786.2.2 Attribute Analysis . . . . . . . . . . . . . . . . . . . . . 806.2.3 Email Campaigns . . . . . . . . . . . . . . . . . . . . . 836.2.4 User Behavior . . . . . . . . . . . . . . . . . . . . . . . 866.2.5 Discussion . . . . . . . . . . . . . . . . . . . . . . . . . 88
7 Conclusions 89
www.syssec-project.eu 7 November 12, 2014

www.syssec-project.eu 8 November 12, 2014
List of Figures
2.1 Overview of the shellcode detection architecture. . . . . . . . 212.2 Number of shellcodes detected by Gene and the existing GetPC-
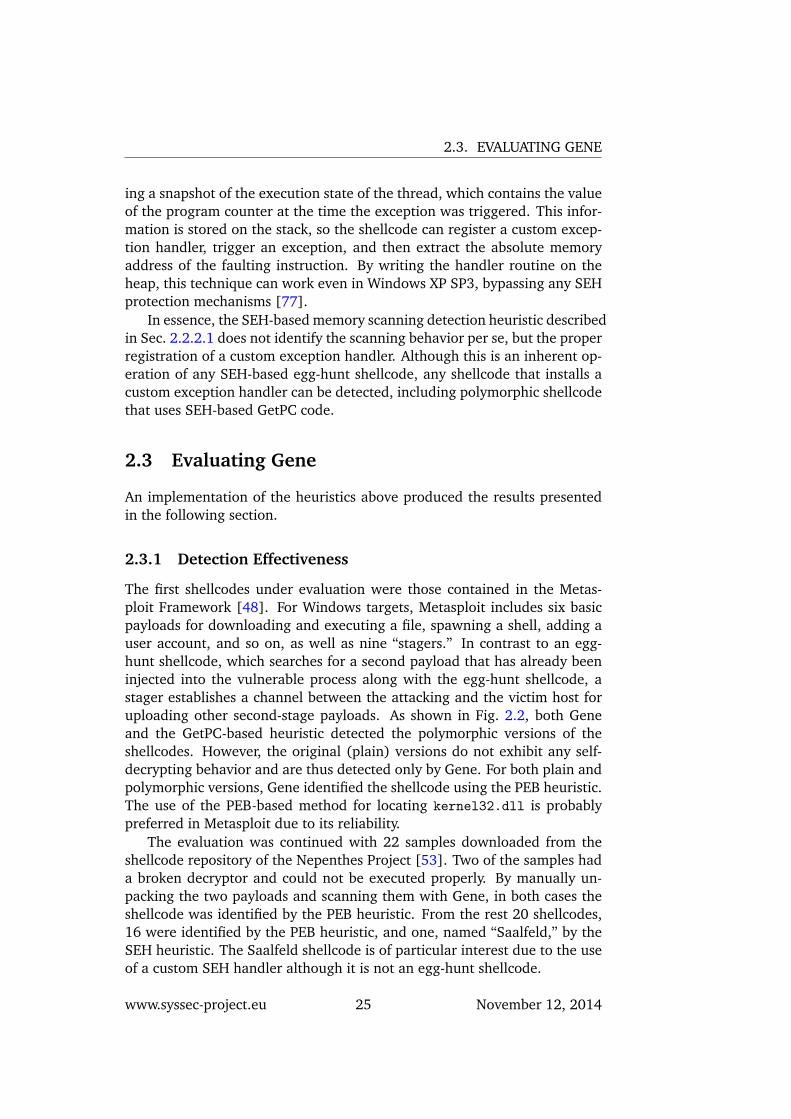
based heuristic [63, 95, 4] for different shellcode sets. Froma total of 83 different shellcode implementations, Gene de-tected 78 samples (94%), compared to 34 (41%) for the GetPCheuristic. . . . . . . . . . . . . . . . . . . . . . . . . . . . . . 26
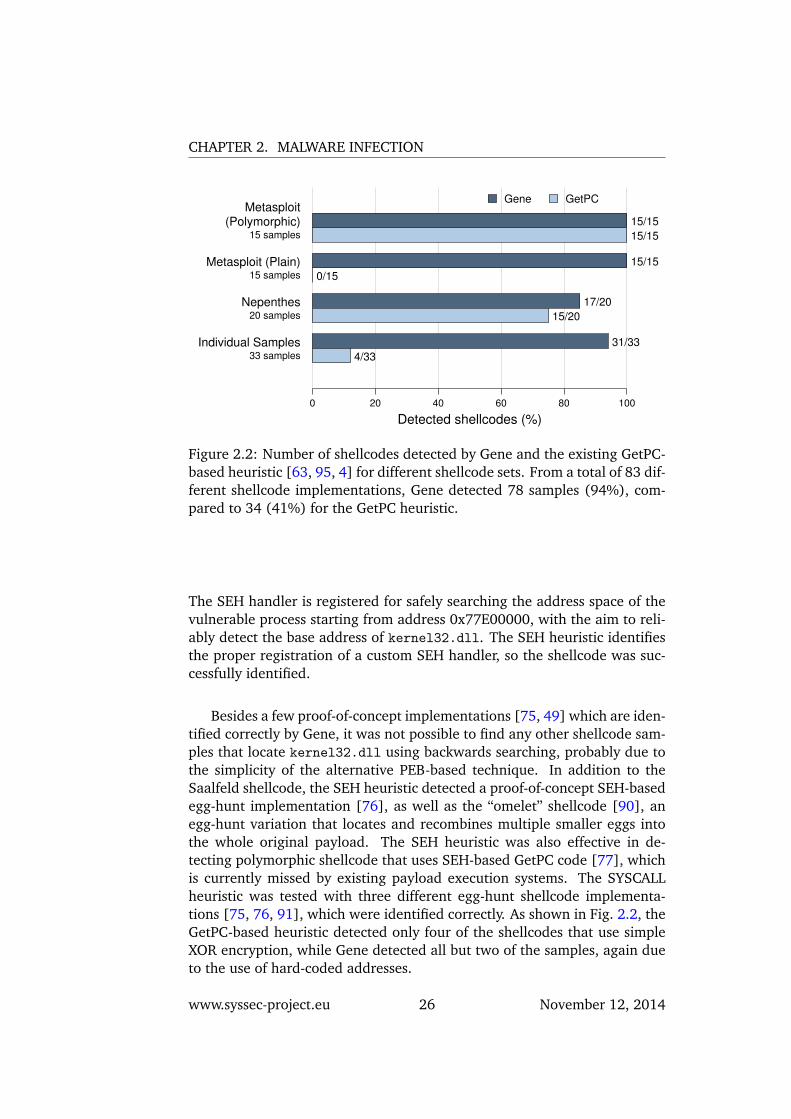
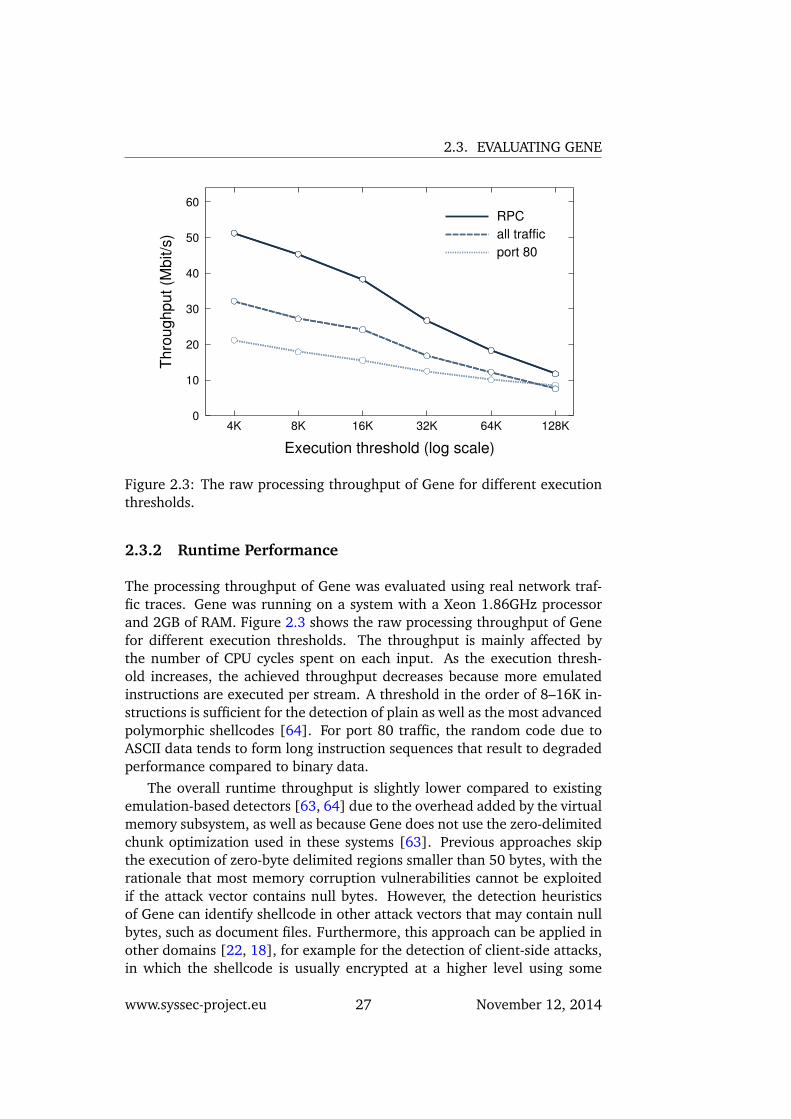
2.3 The raw processing throughput of Gene for different execu-tion thresholds. . . . . . . . . . . . . . . . . . . . . . . . . . . 27
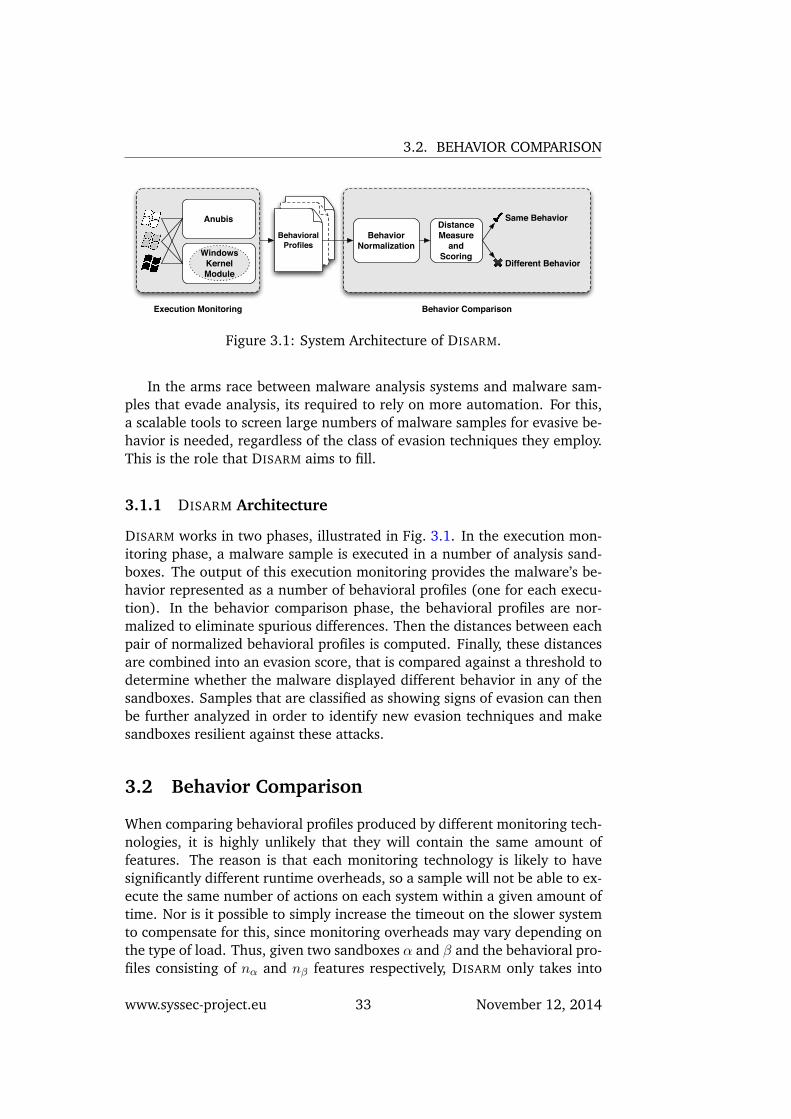
3.1 System Architecture of DISARM. . . . . . . . . . . . . . . . . . 33
5.1 Overview of our collection approach. . . . . . . . . . . . . . . 545.2 Contributors’ geographical location. . . . . . . . . . . . . . . . 545.3 Log entries per day between late March 2010 and April 2012. 555.4 Top 5 services by percentage of log entries of outbound short
URLs of Alexa top 5 domains. . . . . . . . . . . . . . . . . . . 565.5 Comparison of the number of distinct short URLs per unique
landing page (a, c) and distinct container page per uniqueshort URL (b, d) after 1 year (a, b) and after 2 years (c, d). . . 59
5.6 Malicious short URLs: Categories of container page rankedby the amount of short URLs they held. . . . . . . . . . . . . . 59
5.7 Delta time between first and latest occurrence of maliciousversus benign short URLs. . . . . . . . . . . . . . . . . . . . . 61
5.8 Categories of container page ranked by the average numberof short URLs/page they held. . . . . . . . . . . . . . . . . . . 61
5.9 Frequency of change of category (median with 25- and 75-percent quantiles) and number of categories covered (size ofblack dot) of the top 50 services. . . . . . . . . . . . . . . . . 64
9
LIST OF FIGURES
5.10 Digraph showing the connections between container- and landing-page categories. . . . . . . . . . . . . . . . . . . . . . . . . . . 66
6.1 Only the ham network is scale free as the other networks haveoutliers in their degree distribution. . . . . . . . . . . . . . . . 73
6.2 Temporal variation in the degree distribution of email networks. 746.3 Both networks are small-world networks (a,b,e,f), however,
ham has a higher average clustering coefficient. The hamnetworks become more connected over time (c,g), and thenumber of CCs increases faster for the spam networks (d,h). . 75
6.4 The distribution of size of CCs. The GCCs of the networks areorders of magnitude larger than other CCs. . . . . . . . . . . 76
6.5 Attribute distributions in campaigns. . . . . . . . . . . . . . . 826.6 Newsletter subscription header distribution. . . . . . . . . . . 83
www.syssec-project.eu 10 November 12, 2014
1Foreword
The document is the last deliverable for malware and fraud and thereforeconcludes the SysSec project for work package five.In the past four years, malware and malware research did not receive a lotof dedicated attention. In the very first deliverable (D5.1), we gave a briefoverview on what happened in recent years in the malware sector. The fol-lowing documents were more directed towards social networks and fraud,which are undoubtedly an integral part of today’s security landscape. Therewas the practical case study in D5.3, where actual malware contaminationwithin the Turkish network was measured. This case study shed a light onthe engineering effort necessary to even conduct such a study. Naturally,the used technologies for the case study were less sophisticated than recentefforts to find and analyze malware in the research community. The pre-sented implementations usually require a good amount of engineering effortto finally result in a usable system. Still, some of these recent approacheswill certainly reach maturity and finally see deployment in corporate envi-ronments. If that is the case depends on different factors like scalability,usability and general quality of an approach. This document was createdto give an overview on advances and the underlying research in malwareanalysis, countermeasures and internet fraud. It covers the lifetime of theSysSec project and is organized in a semi-chronological manner to give anidea of how the topics generally evolved. As a conclusion of work packagefive, it refocuses on the core topic of malware again. Furthermore, we alsoaddress how malware acts as an enabler for further exploitation, fraud ordata gathering. Undoubtedly, the topic covers a much broader area thancan be discussed in the following pages. Therefore, we took care to selecteach chapter such that it paints a holistic picture of current research andapproaches.
11
CHAPTER 1. FOREWORD
1.1 Malware and Fraud Related Works of the SysSecConsortium
In addition to the content in this deliverable, the SysSec Consortium pub-lished a number of papers in various Journals and Conference Proceedings.The following list iterates the most important research output of the SysSecProject in respect to Work Package 5.
• Farnaz Moradi, Tomas Olovsson, and Philippas Tsigas. A Local SeedSelection Algorithm for Overlapping Community Detection. InProceedings of the 2014 IEEE/ACM International Conference on Ad-vances in Social Networks Analysis and Mining (ASONAM14). August2014, Beijing, China.
• Andrei Costin, Jonas Zaddach, Francillon Francillon, Aurlien, DavideBalzarotti. A Large Scale Analysis of the Security of EmbeddedFirmwares. In Proceedings of the 23rd USENIX Security Symposium(USENIX Security). August 2014, San Diego, CA, USA.
• Stefano Schiavoni, Federico Maggi, Lorenzo Cavallaro, and StefanoZanero. Phoenix: DGA-Based Botnet Tracking and Intelligence. InProceedings of the 11th Conference on Detection of Intrusions andMalware and Vulnerability Assessment (DIMVA). July 2014, Egham,UK.
• Martina Lindorfer, Stamatis Volanis, Alessandro Sisto, Matthias Neugschwandt-ner, Elias Athanasopoulos, Federico Maggi, Christian Platzer, StefanoZanero, Sotiris Ioannidis. AndRadar: Fast Discovery of Android Ap-plications in Alternative Markets. In Proceedings of the 11th Confer-ence on Detection of Intrusions and Malware & Vulnerability Assess-ment (DIMVA). July 2014. Egham, UK.
• Claudio Criscione, Fabio Bosatelli, Stefano Zanero, and Federico Maggi.Zarathustra: Extracting WebInject Signatures from Banking Tro-jans. In Proceedings of the 12th Annual International Conference onPrivacy, Security and Trust (PST). July 2014, Toronto, Canada.
• Rafael A Rodrguez Gmez, Gabriel Maci Fernndez, Pedro Garca Teodoro,Moritz Steiner, and Davide Balzarotti. Resource monitoring for thedetection of parasite P2P botnets. Computer Networks, ElsevierB.V., pages 302311, June 2014.
• Sebastian Neuner, Victor van der Veen, Martina Lindorfer, Markus Hu-ber, Georg Merzdovnik, Martin Mulazzani, and Edgar Weippl. EnterSandbox: Android Sandbox Comparison. In Proceedings of the IEEEMobile Security Technologies Workshop (MoST). May 2014. San Jose,CA, USA.
www.syssec-project.eu 12 November 12, 2014
1.1. MALWARE AND FRAUD RELATED WORKS OF THE SYSSECCONSORTIUM
• Thanasis Petsas, Giannis Voyatzis, Elias Athanasopoulos, Michalis Poly-chronakis, Sotiris Ioannidis. Rage Against the Virtual Machine: Hin-dering Dynamic Analysis of Mobile Malware. In Proceedings of the7th European Workshop on Systems Security (EuroSec). April 2014.Amsterdam, The Nederlands.
• Nick Nikiforakis, Federico Maggi, Gianluca Stringhini, M Zubair Rafique,Wouter Joosen, Christopher Kruegel, Frank Piessens, Giovanni Vigna,Stefano Zanero. Stranger Danger: Exploring the Ecosystem of Ad-based URL Shortening Services. In Proceedings of the 2014 Interna-tional World Wide Web Conference (WWW). April 2014. Seoul, Korea.
• Zlatogor Minchev, Suzan Feimova. Modern Social Networks Emerg-ing Cyber Threats Identification: A Practical Methodological Frame-work with Examples. In Proceedings of the 6th AFCEA Sixth YoungScientists Conference ’Future of ICT’, at NATO C4ISR Industry Confer-ence & TechNet International. March, 2014. Bucharest, Romania.
• Jonas Zaddach, Luca Bruno, Aurelien Francillon, and Davide Balzarotti.Avatar: A Framework to Support Dynamic Security Analysis ofEmbedded Systems’ Firmwares. In Proceedings of the Network andDistributed System Security Symposium (NDSS). February 2014, SanDiego, USA.
• Jonas Zaddach, Anil Kurmus, Davide Balzarotti, Erik Olivier Blass, Au-relien Francillon, Travis Goodspeed, Moitrayee Gupta, Ioannis Kolt-sidas. Implementation and Implications of a Stealth Hard-DriveBackdoor. In Proceedings of the 2013 Annual Computer Security Ap-plications Conference (ACSAC). December 2013, New Orleans, LA,USA.
• Martina Lindorfer, Bernhard Miller, Matthias Neugschwandtner, Chris-tian Platzer. Take a Bite - Finding the Worm in the Apple. In Pro-ceedings of the 9th International Conference on Information, Com-munications and Signal Processing (ICICS). December 2013,Tainan,Taiwan.
• Martina Lindorfer, Matthias Neumayr, Juan Caballero, Christian Platzer.POSTER: Cross-Platform Malware: Write Once, Infect Everywhere.In Proceedings of the20th ACM Conference on Computer and Commu-nications Security (CCS). November 2013, Berlin, Germany.
• Federico Maggi, Andrea Valdi, Stefano Zanero. AndroTotal: A Flex-ible, Scalable Toolbox and Service for Testing Mobile MalwareDetectors. In Proceedings of the 3rd Annual ACM CCS Workshopon Security and Privacy in Smartphones and Mobile Devices (SPSM).November 2013, Berlin, Germany.
www.syssec-project.eu 13 November 12, 2014
CHAPTER 1. FOREWORD
• Dennis Andriesse, Christian Rossow, Brett Stone-Gross, Daniel Plohmann,Herbert Bos. Highly Resilient Peer-to-Peer Botnets Are Here: AnAnalysis of Gameover Zeus. In Proceedings of the 8th IEEE In-ternational Conference on Malicious and Unwanted Software (MAL-WARE’13). October 2013, Fajardo, Puerto Rico, USA.
• Mariano Graziano, Andrea Lanzi, Davide Balzarotti. Hypervisor Mem-ory Forensics. In Proceedings of the 16th International Symposiumon Research in Attacks, Intrusions and Defenses (RAID). October 2013,Saint Lucia.
• Istvan Haller, Asia Slowinska, Matthias Neugschwandtner, Herbert Bos.Dowsing for overflows: A guided fuzzer to find buffer boundaryviolations. In Proceedings of the 22nd USENIX Security Symposium(USENIX-SEC). August 2013, Washington, DC, USA.
• Matthias Neugschwandtner, Martina Lindorfer, Christian Platzer. Aview to a kill: Webview exploitation. In Proceedings of the 6thUSENIX Workshop on Large-Scale Exploits and Emergent Threats (LEET).August 2013, Washington, DC, USA.
• Zlatogor Minchev. Security of Digital Society. Technological Per-spectives & Challenges. In Proceedings of the Jubilee InternationalScientific Conference ”Ten Years Security Education in New BulgarianUniversity: Position and Perspectives for the Education in a Dynamicand Hardly Predicted Environment”. June 2013, Sofia, Bulgaria.
• Luben Boyanov, Zlatogor Minchev and Kiril Boyanov. Some CyberThreats in Digital Society. In International Journal ”Automatics &Informatics”. January 2013.
• Leyla Bilge, Davide Balzarotti, William Robertson, Engin Kirda, Christo-pher Kruegel. DISCLOSURE: Detecting Botnet Command and Con-trol Servers Through Large-Scale NetFlow Analysis. In Proceedingsof the 2012 Annual Computer Security Applications Conference (AC-SAC). December 2012, Orlando, FL, USA.
• Mario Graziano, Corrado Leita, Davide Balzarotti. Towards NetworkContainment in Malware Analysis Systems. In Proceedings of the2012 Annual Computer Security Applications Conference (ACSAC).December 2012, Orlando, FL, USA.
• Martina Lindorfer, Alessandro Di Federico, Federico Maggi, Paolo Mi-lani Comparetti, Stefano Zanero. Lines of Malicious Code: InsightsInto the Malicious Software Industry. In Proceedings of the 2012Annual Computer Security Applications Conference (ACSAC). Decem-ber 2012, Orlando, FL, USA.
www.syssec-project.eu 14 November 12, 2014
1.1. MALWARE AND FRAUD RELATED WORKS OF THE SYSSECCONSORTIUM
• Markus Kammerstetter, Christian Platzer, Gilbert Wondracek. Van-ity, Cracks and Malware: Insights into the Anti-Copy ProtectionEcosystem. In Proceedings of the 19th ACM Conference on Com-puter and Communications Security (CCS). October 2012, Raleigh,NC, USA.
• Zlatogor Minchev. Social Networks Security Aspects: A Technologi-cal and User Based Perspectives. In Proceedings of the 20th NationalJubilee Conference with International Participation (TELECOM2012).October 2012, Sofia, Bulgaria.
• Andrei Bacs, Remco Vermeulen, Asia Slowinska, Herbert Bos. System-level Support for Intrusion Recovery. In proceedings of the 9thConference on Detection of Intrusions and Malware & VulnerabilityAssessment (DIMVA). July 2012, Heraklion, Greece.
• Christian Rossow, Christian Dietrich, Herbert Bos. Large-Scale Anal-ysis of Malware Downloaders. In proceedings of the 9th Conferenceon Detection of Intrusions and Malware & Vulnerability Assessment(DIMVA). July 2012, Heraklion, Greece.
• Davide Canali, Andrea Lanzi, Davide Balzarotti, Mihai Christoderescu,Christopher Kruegel, Engin Kirda. A Quantitative Study of Accuracyin System Call-Based Malware Detection. In proceedings of the In-ternational Symposium on Software Testing and Analysis (ISSTA). July2012, Minneapolis, MN, USA.
• Farnaz Moradi, Tomas Olovsson, Philippas Tsigas. An Evaluation ofCommunity Detection Algorithms on Large-Scale Email Traffic. Inproceedings of the 11th International Symposium on Experimental Al-gorithms (SEA). June 2011, Bordeaux, France.
• Zlatogor Minchev, Plamen Gatev. Psychophysiological Evaluation ofEmotions due to the Communication in Social Networks. In ScriptaScientifica Medica, Volume 44, Issue 1, Supplement 1. April 2012.
• Federico Maggi, Andrea Bellini, Guido Salvaneschi, Stefano Zanero.Finding Non-trivial Malware Naming Inconsistencies. In proceed-ings of the 7th International Conference on Information Systems Se-curity (ICISS). December 2011, Kolkata, India.
• Matthias Neugschwandtner, Paolo Milani Comparetti, and ChristianPlatzer. Detecting Malwares Failover C&C Strategies with SQUEEZE.In Proceedings of the2011 Annual Computer Security ApplicationsConference (ACSAC). December 2011, Orlando, FL, USA.
www.syssec-project.eu 15 November 12, 2014
CHAPTER 1. FOREWORD
• Matthias Neugschwandtner, Paolo Milani Comparetti, Gregoire Jacob,Christopher Kruegel. FORECAST Skimming off the Malware Cream.In Proceedings of the2011 Annual Computer Security ApplicationsConference (ACSAC). December 2011, Orlando, FL, USA.
• Christian J. Dietrich, Christian Rossow, Felix C. Freiling, Herbert Bos,Maarten van Steen, Norbert Pohlmann. On Botnets that use DNS forCommand and Control. In Proceedings of the 7th European Con-ference on Computer Network Defense (EC2ND). September 2011,Gteborg, Sweden.
• Danesh Irani, Marco Balduzzi, Davide Balzarotti, Engin Kirda, CarltonPu. Reverse Social Engineering Attacks in Online Social Networks.In Proceedings of the8th Conference on Detection of Intrusions andMalware and Vulnerability Assessment (DIMVA). July 2011, Amster-dam, The Netherlands.
• Magnus Almgren, Zhang Fu, Erland Jonsson, Pierre Kleberger, An-dreas Larsson, Farnaz Moradi, Tomas Olovsson, Marina Papatriantafilou,Laleh Pirzadeh, Philippas Tsigas. Mapping Systems Security Re-search at Chalmers. In proceedings of the 1st SysSec Workshop onSystems Security. July 2011, Amsterdam, The Netherlands.
• Farnaz Moradi, Magnus Almgren, Wolfgang John, Tomas Olovsson,Philippas Tsigas. On Collection of Large-Scale Multi-Purpose Datasetson Internet Backbone Links. In proceedings of the First Work- shopon Building Analysis Datasets and Gathering Experience Returns forSecurity (BADGERS). April 2011, Salzburg, Austria.
• Leyla Bilge, Andrea Lanzi, Davide Balzarotti. Thwarting Real-TimeDynamic Unpacking. In proceedings of the 2011 European Workshopon System Security(EuroSec). April 2011, Salzburg, Austria.
• Zhang Fu, Marina Papatriantafilou, Philippas Tsigas. CluB: A ClusterBased Proactive Method for Mitigating Distributed Denial of Ser-vice Attacks. In proceedings of the 26th ACM Symposium on AppliedComputing (SAC). March 2011, TaiChung, Taiwan.
• Leyla Bilge, Engin Kirda, Christopher Kruegel, Marco Balduzzi. EXPO-SURE: Finding Malicious Domains Using Passive DNS Analysis. Inproceedings of the 18th Annual Network & Distributed System Secu-rity Symposium (NDSS). February 2011, San Diego, CA, USA.
• Kaan Onarlioglu, Leyla Bilge, Andrea Lanzi, Davide Balzarotti, EnginKirda. G-Free: Defeating Return-Oriented Programming throughGadget-less Binaries. In Proceedings of the 26th Annual Computer
www.syssec-project.eu 16 November 12, 2014
1.1. MALWARE AND FRAUD RELATED WORKS OF THE SYSSECCONSORTIUM
Security Applications Conference (ACSAC). December 2010, Austin,TX, USA.
• Zlatogor Minchev, Maria Petkova. Information Processes and Threatsin Social Networks: A Case Study. In Conjoint Scientific Semi-nar ”Modelling and Control of Information Processes”. Organized byCollege of Telecommunications, Institute of ICT - Bulgarian Academyof Sciences and Institute of Mathematics and Informatics - BulgarianAcademy of Sciences. November 2010, Sofia, Bulgaria.
• Phuong Nguyen, Wil Kling, Giorgos Georgiadis, Marina Papatriantafilou,Anh Tuan Le, Lina Bertling. Distributed Routing Algorithms to Man-age Power Flow in Agent-Based Active Distribution Network. Pro-ceedings of 1st Conference on Innovative Smart Grid Technologies Eu-rope. Gteborg, Sweden, October 2010.
www.syssec-project.eu 17 November 12, 2014

CHAPTER 1. FOREWORD
www.syssec-project.eu 18 November 12, 2014
2Malware infection
Before diving into general details of malware, their different families andtypes, we would like to tackle the very basic problem of how malwarereaches a target system in the first place. There still exist a good number ofclick-based infection strategies, where individuals are tricked into clickinga binary and install the malware themselves. These methods, however, aretrivial from a technological perspective. Injection attacks, in contrast, aremethods where vulnerabilities in a computer system are exploited withoutany user interaction. The research presented in this chapter is described indetail in [62]. This work mainly deals with code injection attacks whichhave become one of the primary methods of malware spreading. In a typi-cal code injection attack, the attacker sends a malicious input that exploits amemory corruption vulnerability in a program running on the victim’s com-puter. The injected code, known as shellcode, carries out the first stage ofthe attack, which usually involves the download and execution of a malwarebinary on the compromised host.
Once sophisticated tricks of the most skilled virus authors, advanced eva-sion techniques like code obfuscation and polymorphism are now the normin most instances of malicious code [45]. The wide availability of ready-to-use shellcode construction and obfuscation toolkits and the discovery rate ofnew vulnerabilities have rendered exploit or vulnerability specific detectiontechniques ineffective [78]. A promising approach for the generic detectionof code injection attacks is to focus on the identification of the shellcodethat is indispensably part of the attack vector, a technique initially known asabstract payload execution [85]. Identifying the presence of the shellcodeitself allows for the detection of previously unknown attacks without car-ing about the particular exploitation method used or the vulnerability beingexploited.
Initial implementations of this approach attempt to identify the pres-ence of shellcode in network inputs using static code analysis [85, 88, 87].
19
CHAPTER 2. MALWARE INFECTION
However, methods based on static analysis cannot effectively handle mali-cious code that employs advanced obfuscation tricks such as indirect jumpsand self-modifications. Dynamic code analysis using emulation is not hin-dered by such obfuscations and can detect even extensively obfuscated shell-code. This kind of “actual” payload execution has proved quite effective inpractice [61] and is being used in network-level and host-level systems forthe zero-day detection of both server-side and client-side code injection at-tacks [63, 95, 18, 4, 22].
A limitation of the above techniques is that they are confined to thedetection of a particular class of polymorphic shellcode that exhibits self-decrypting behavior. Although shellcode “packing” and encryption are com-monly used for evading signature-based detectors, attackers can achieve thesame or even higher level of evasiveness without the use of self-decryptingcode, rendering above systems ineffective. Besides code encryption, poly-morphism can instead be achieved by mutating the actual instructions ofthe shellcode before launching the attack—a technique known as metamor-phism [82]. Metamorphism has been widely used by virus authors and thuscan trivially be applied for shellcode mutation. Surprisingly, even plain shell-code, i.e., shellcode that does not change across different instances, is alsonot detected by existing payload execution methods. Technically, a plainshellcode is no different than any instance of metamorphic shellcode, sinceboth do not carry a decryption routine nor exhibit any self-modifications ordynamic code generation. Consequently, an attack that uses a previously un-known static analysis-resistant plain shellcode will manage to evade existingdetection systems.
In this chapter, we discuss a comprehensive shellcode detection tech-nique based on payload execution. In contrast to previous approaches thatuse a single detection algorithm for a particular class of shellcode, thismethod relies on several runtime heuristics tailored to the identification ofdifferent shellcode types. This strategy also enables the detection of spe-cialized polymorphic shellcode, which usually goes undetected by existingpolymorphic shellcode detectors.
An implementation of the above technique was named Gene, a network-level detector that scans all client-initiated streams for code injection attacksagainst network services [62]. Gene is based on passive network monitor-ing, which offers the benefits of easy large-scale deployment and protectionof multiple hosts using a single sensor, while it allows us to test the effective-ness of this technique in real-world environments. As the core engine cananalyze arbitrary data, it allows the approach to be readily embedded inexisting systems that employ emulation-based detection in other domains,e.g., for the detection of malicious websites [22] or in browser add-ons forthe detection of drive-by download attacks [18].
www.syssec-project.eu 20 November 12, 2014
2.1. THE GENE ARCHITECTURE
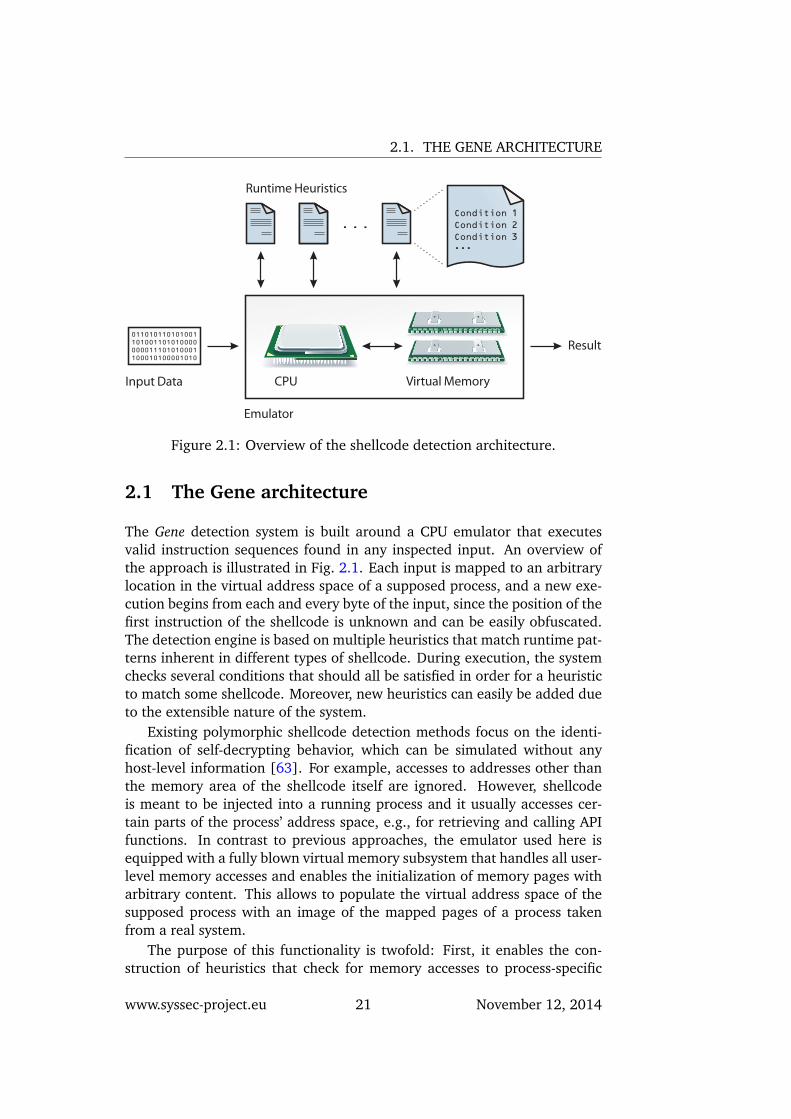
Figure 2.1: Overview of the shellcode detection architecture.
2.1 The Gene architecture
The Gene detection system is built around a CPU emulator that executesvalid instruction sequences found in any inspected input. An overview ofthe approach is illustrated in Fig. 2.1. Each input is mapped to an arbitrarylocation in the virtual address space of a supposed process, and a new exe-cution begins from each and every byte of the input, since the position of thefirst instruction of the shellcode is unknown and can be easily obfuscated.The detection engine is based on multiple heuristics that match runtime pat-terns inherent in different types of shellcode. During execution, the systemchecks several conditions that should all be satisfied in order for a heuristicto match some shellcode. Moreover, new heuristics can easily be added dueto the extensible nature of the system.
Existing polymorphic shellcode detection methods focus on the identi-fication of self-decrypting behavior, which can be simulated without anyhost-level information [63]. For example, accesses to addresses other thanthe memory area of the shellcode itself are ignored. However, shellcodeis meant to be injected into a running process and it usually accesses cer-tain parts of the process’ address space, e.g., for retrieving and calling APIfunctions. In contrast to previous approaches, the emulator used here isequipped with a fully blown virtual memory subsystem that handles all user-level memory accesses and enables the initialization of memory pages witharbitrary content. This allows to populate the virtual address space of thesupposed process with an image of the mapped pages of a process takenfrom a real system.
The purpose of this functionality is twofold: First, it enables the con-struction of heuristics that check for memory accesses to process-specific
www.syssec-project.eu 21 November 12, 2014
CHAPTER 2. MALWARE INFECTION
Abbreviation Matching Shellcode Behavior
PEB kernel32.dll base address resolution
BACKWD kernel32.dll base address resolution
SEH Memory scanning / SEH-based GetPC code
SYSCALL Memory scanning
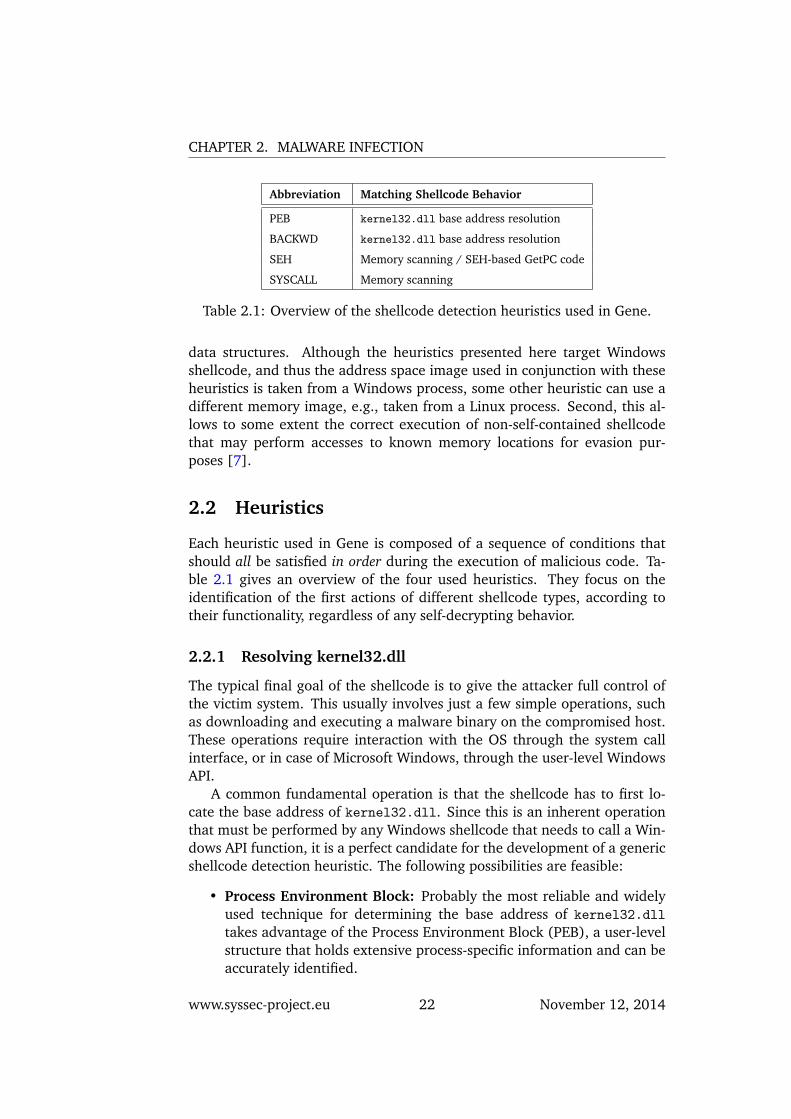
Table 2.1: Overview of the shellcode detection heuristics used in Gene.
data structures. Although the heuristics presented here target Windowsshellcode, and thus the address space image used in conjunction with theseheuristics is taken from a Windows process, some other heuristic can use adifferent memory image, e.g., taken from a Linux process. Second, this al-lows to some extent the correct execution of non-self-contained shellcodethat may perform accesses to known memory locations for evasion pur-poses [7].
2.2 Heuristics
Each heuristic used in Gene is composed of a sequence of conditions thatshould all be satisfied in order during the execution of malicious code. Ta-ble 2.1 gives an overview of the four used heuristics. They focus on theidentification of the first actions of different shellcode types, according totheir functionality, regardless of any self-decrypting behavior.
2.2.1 Resolving kernel32.dll
The typical final goal of the shellcode is to give the attacker full control ofthe victim system. This usually involves just a few simple operations, suchas downloading and executing a malware binary on the compromised host.These operations require interaction with the OS through the system callinterface, or in case of Microsoft Windows, through the user-level WindowsAPI.
A common fundamental operation is that the shellcode has to first lo-cate the base address of kernel32.dll. Since this is an inherent operationthat must be performed by any Windows shellcode that needs to call a Win-dows API function, it is a perfect candidate for the development of a genericshellcode detection heuristic. The following possibilities are feasible:
• Process Environment Block: Probably the most reliable and widelyused technique for determining the base address of kernel32.dll
takes advantage of the Process Environment Block (PEB), a user-levelstructure that holds extensive process-specific information and can beaccurately identified.
www.syssec-project.eu 22 November 12, 2014
2.2. HEURISTICS
• Backwards Searching: An alternative technique for locatingkernel32.dll is to find a pointer that points somewhere into thememory area where the kernel32.dll has been loaded, and thensearch backwards until the beginning of the DLL is located [75]. A reli-able way to obtain a pointer into the address space of kernel32.dll isto take advantage of the Structured Exception Handling (SEH) mech-anism of Windows [59], which provides a unified way of handlinghardware and software exceptions.
2.2.2 Process Memory Scanning
Some memory corruption vulnerabilities allow only a limited space for theinjected code—usually not enough for a fully functional shellcode. In theseexploits though, the attacker can inject a second, much larger payload whichwill land at a random, non-deterministic location, e.g., in a buffer allocatedin the heap. The first-stage shellcode can then sweep the address spaceof the process and search for the second-stage shellcode (also known asthe “egg”), which can be identified by a long-enough characteristic bytesequence. This type of first-stage payload is known as “egg-hunt” shell-code [76]. The following two scanning techniques and the correspondingdetection heuristics can identify the execution of egg-hunt shellcode.
2.2.2.1 SEH
The first memory scanning technique takes advantage of the structured ex-ception handling mechanism and relies on installing a custom exceptionhandler that is invoked in case of a memory access violation.
Condition S1. The list of SEH frames is stored on the stack, and the currentSEH frame is always accessible through FS:[0]. The first-stage shellcodecan register a custom exception handler that has priority over all previoushandlers in two ways: create a new SEH frame and adjust the current SEHframe pointer of the TIB to point to it [76], or directly modify the Handler
pointer of the current SEH frame to point to the attacker’s handler routine.In the first case, the shellcode must update the SEH list head pointer atFS:[0], while in the second case, it has to access the current SEH framein order to modify its Handler field, which is only possible by reading thepointer at FS:[0]. Thus, the first condition of the SEH-based memory scan-ning detection heuristic (SEH) is (S1): (i) the linear address of FS:[0] isread or written, and (ii) the current or any previous instruction involved theFS register.
Condition S2. Another mandatory operation that will be encountered dur-ing execution is that the Handler field of the custom SEH frame (irrespec-tively if its a new frame or an existing one) should be modified to point to
www.syssec-project.eu 23 November 12, 2014
CHAPTER 2. MALWARE INFECTION
the custom exception handler routine. This operation is reflected by the sec-ond condition (S2): the linear address of the Handler field in the custom SEHframe is or has been written. Note that in case of a newly created SEH frame,the Handler pointer can be written before or after FS:[0] is modified.
Condition S3. Although the above conditions are quite constraining, a thirdcondition can be applied by exploiting the fact that upon the registration ofthe custom SEH handler, the linked list of SEH frames should be valid. Withthe risk of stack corruption, the exception dispatcher routine performs thor-ough checks on the integrity of the SEH chain, e.g., ensuring that each SEHframe is dword-aligned within the stack and is located higher than the pre-vious SEH frame [59]. Thus, the third condition requires that (S3): startingfrom FS:[0], all SEH frames should reside on the stack, and the Handler fieldof the last frame should be set to 0xFFFFFFFF. In essence, the above conditionvalidates that the custom handler registration has been performed correctly.
2.2.2.2 System Call
The extensive abuse of the SEH mechanism in various memory corruptionvulnerabilities led to the introduction of SafeSEH, a linker option that pro-duces a table with all the legitimate exception handlers of the image. Incase the exploitation of some SafeSEH-protected vulnerable application re-quires the use of egg-hunt shellcode, an alternative but less reliable methodfor safely scanning the process address space is to check whether a pageis mapped—before actually accessing it—using a system call [76, 75]. Asalready discussed, although the use of system calls in Windows shellcodeis not common, since they are prone to changes between OS versions anddo not provide crucial functionality such as network access, they can proveuseful for determining if a memory address is accessible.
2.2.3 SEH-based GetPC Code
Before decrypting itself, polymorphic shellcode needs to first find the ab-solute address at which it resides in the address space of the vulnerableprocess. The most widely used types of GetPC code for this purpose rely onsome instruction from the call or fstenv instruction groups [63]. These in-structions push on the stack the address of the following instruction, whichcan then be used to calculate the absolute address of the encrypted code.However, this type of GetPC code cannot be used in purely alphanumericshellcode [45], because the opcodes of the required instructions fall outsidethe range of allowed ASCII bytes. In such cases, the attacker can followa different approach and take advantage of the SEH mechanism to get ahandle to the absolute memory address of the injected shellcode [77].
When an exception occurs, the system generates an exception recordthat contains the necessary information for handling the exception, includ-
www.syssec-project.eu 24 November 12, 2014
2.3. EVALUATING GENE
ing a snapshot of the execution state of the thread, which contains the valueof the program counter at the time the exception was triggered. This infor-mation is stored on the stack, so the shellcode can register a custom excep-tion handler, trigger an exception, and then extract the absolute memoryaddress of the faulting instruction. By writing the handler routine on theheap, this technique can work even in Windows XP SP3, bypassing any SEHprotection mechanisms [77].
In essence, the SEH-based memory scanning detection heuristic describedin Sec. 2.2.2.1 does not identify the scanning behavior per se, but the properregistration of a custom exception handler. Although this is an inherent op-eration of any SEH-based egg-hunt shellcode, any shellcode that installs acustom exception handler can be detected, including polymorphic shellcodethat uses SEH-based GetPC code.
2.3 Evaluating Gene
An implementation of the heuristics above produced the results presentedin the following section.
2.3.1 Detection Effectiveness
The first shellcodes under evaluation were those contained in the Metas-ploit Framework [48]. For Windows targets, Metasploit includes six basicpayloads for downloading and executing a file, spawning a shell, adding auser account, and so on, as well as nine “stagers.” In contrast to an egg-hunt shellcode, which searches for a second payload that has already beeninjected into the vulnerable process along with the egg-hunt shellcode, astager establishes a channel between the attacking and the victim host foruploading other second-stage payloads. As shown in Fig. 2.2, both Geneand the GetPC-based heuristic detected the polymorphic versions of theshellcodes. However, the original (plain) versions do not exhibit any self-decrypting behavior and are thus detected only by Gene. For both plain andpolymorphic versions, Gene identified the shellcode using the PEB heuristic.The use of the PEB-based method for locating kernel32.dll is probablypreferred in Metasploit due to its reliability.
The evaluation was continued with 22 samples downloaded from theshellcode repository of the Nepenthes Project [53]. Two of the samples hada broken decryptor and could not be executed properly. By manually un-packing the two payloads and scanning them with Gene, in both cases theshellcode was identified by the PEB heuristic. From the rest 20 shellcodes,16 were identified by the PEB heuristic, and one, named “Saalfeld,” by theSEH heuristic. The Saalfeld shellcode is of particular interest due to the useof a custom SEH handler although it is not an egg-hunt shellcode.
www.syssec-project.eu 25 November 12, 2014
CHAPTER 2. MALWARE INFECTION
Metasploit(Polymorphic)
Metasploit (Plain)
Nepenthes
Individual Samples
15 samples
15 samples
20 samples
33 samples
Detected shellcodes (%)
0 20 40 60 80 100
15/15
15/15
17/20
31/33
15/15
0/15
15/20
4/33
Gene GetPC
Figure 2.2: Number of shellcodes detected by Gene and the existing GetPC-based heuristic [63, 95, 4] for different shellcode sets. From a total of 83 dif-ferent shellcode implementations, Gene detected 78 samples (94%), com-pared to 34 (41%) for the GetPC heuristic.
The SEH handler is registered for safely searching the address space of thevulnerable process starting from address 0x77E00000, with the aim to reli-ably detect the base address of kernel32.dll. The SEH heuristic identifiesthe proper registration of a custom SEH handler, so the shellcode was suc-cessfully identified.
Besides a few proof-of-concept implementations [75, 49] which are iden-tified correctly by Gene, it was not possible to find any other shellcode sam-ples that locate kernel32.dll using backwards searching, probably due tothe simplicity of the alternative PEB-based technique. In addition to theSaalfeld shellcode, the SEH heuristic detected a proof-of-concept SEH-basedegg-hunt implementation [76], as well as the “omelet” shellcode [90], anegg-hunt variation that locates and recombines multiple smaller eggs intothe whole original payload. The SEH heuristic was also effective in de-tecting polymorphic shellcode that uses SEH-based GetPC code [77], whichis currently missed by existing payload execution systems. The SYSCALLheuristic was tested with three different egg-hunt shellcode implementa-tions [75, 76, 91], which were identified correctly. As shown in Fig. 2.2, theGetPC-based heuristic detected only four of the shellcodes that use simpleXOR encryption, while Gene detected all but two of the samples, again dueto the use of hard-coded addresses.
www.syssec-project.eu 26 November 12, 2014
2.3. EVALUATING GENE
Execution threshold (log scale)
4K 8K 16K 32K 64K 128K
Th
rou
gh
pu
t (M
bit/s
)
0
10
20
30
40
50
60
RPC
all traffic
port 80
Figure 2.3: The raw processing throughput of Gene for different executionthresholds.
2.3.2 Runtime Performance
The processing throughput of Gene was evaluated using real network traf-fic traces. Gene was running on a system with a Xeon 1.86GHz processorand 2GB of RAM. Figure 2.3 shows the raw processing throughput of Genefor different execution thresholds. The throughput is mainly affected bythe number of CPU cycles spent on each input. As the execution thresh-old increases, the achieved throughput decreases because more emulatedinstructions are executed per stream. A threshold in the order of 8–16K in-structions is sufficient for the detection of plain as well as the most advancedpolymorphic shellcodes [64]. For port 80 traffic, the random code due toASCII data tends to form long instruction sequences that result to degradedperformance compared to binary data.
The overall runtime throughput is slightly lower compared to existingemulation-based detectors [63, 64] due to the overhead added by the virtualmemory subsystem, as well as because Gene does not use the zero-delimitedchunk optimization used in these systems [63]. Previous approaches skipthe execution of zero-byte delimited regions smaller than 50 bytes, with therationale that most memory corruption vulnerabilities cannot be exploitedif the attack vector contains null bytes. However, the detection heuristicsof Gene can identify shellcode in other attack vectors that may contain nullbytes, such as document files. Furthermore, this approach can be applied inother domains [22, 18], for example for the detection of client-side attacks,in which the shellcode is usually encrypted at a higher level using some
www.syssec-project.eu 27 November 12, 2014
CHAPTER 2. MALWARE INFECTION
script language, and thus can be fully functional even if it contains nullbytes.
In practice, Gene can monitor high speed links when scanning for server-side attacks because client-initiated traffic (requests) is usually a fraction ofthe server-initiated traffic (responses). In a preliminary deployments in pro-duction networks, Gene can scan traffic of up to 100 Mbit/s without drop-ping packets. Furthermore, Gene currently scans the whole input blindly,without any knowledge about the actual network protocol used. Augment-ing the inspection engine with protocol parsing would significantly improvethe scanning throughput by inspecting each protocol field separately.
2.4 Discussion
The increasing professionalism of cyber criminals and the vast number ofmalware variants and malicious websites make the need for effective codeinjection attack detection a critical challenge. To this end, shellcode detec-tion using payload execution offers important advantages, including genericdetection without exploit or vulnerability-specific signatures, practically zerofalse positives, while it is effective against targeted attacks.
Gene represents a comprehensive shellcode detection method based oncode emulation. The approach expands the range of malicious code typesthat can be detected by enabling the parallel evaluation of multiple runtimeheuristics that match inherent low-level operations during the execution ofdifferent shellcode types.
An experimental evaluation shows that the proposed approach can ef-fectively detect a broad range of diverse shellcode types and implementa-tions, increasing significantly the detection coverage compared to existingemulation-based detectors, while extensive testing with a large set of benigndata did not produce any false positives. Gene detected 116,513 attacksagainst production systems in a period of almost five months without falsepositives.
Although Gene currently operates at the network level, the proposeddetection heuristics can be readily implemented in emulation-based systemsin other domains, including host-level or application-specific detectors.
www.syssec-project.eu 28 November 12, 2014
3Malware Evasion
The last chapter discussed how malware infections are achieved using shell-code exploits and how it is possible to counter these attacks. However, thereis one case when a malware infection is actually wanted. Honeypots try togather as many samples as possible to further analyze them in a protectedenvironment.
Dynamic analysis of malicious code has increasingly become an essentialcomponent of defense against Internet threats. By executing malware sam-ples in a controlled environment, security practitioners and researchers areable to observe its malicious behavior, obtain its unpacked code [32, 44],detect botnet command and control (C&C) servers [81] and generate signa-tures for C&C traffic [58] as well as remediation procedures for malware in-fections [54]. Large-scale dynamic malware analysis systems (DMAS) basedon tools such as Anubis [9] and CWSandbox [92] are operated by securityresearchers1 and companies23. These services are freely available to thepublic and are widely used by security practitioners around the world. Inaddition to these public-facing services, private malware analysis sandboxesare operated by a variety of security companies such as Anti-Virus vendors.Like most successful security technologies, malware analysis sandboxes havetherefore attracted some attention from miscreants.
One way for malware to defeat dynamic analysis is to detect that it isrunning in an analysis sandbox rather than on a real user’s system and refuseto perform its malicious function. For instance, code packers that include de-tection of virtual machines, such as Themida, will produce executables thatexit immediately when run inside a virtual machine such as VMWare [38].There are many characteristics of a sandbox environment that may be usedto fingerprint it. In addition to using “red pills” that aim to detect widely de-
1Anubis: Analyzing Unknown Binaries (http://anubis.iseclab.org/)2SunbeltLabs (http://www.sunbeltsecurity.com/sandbox/)3ThreatExpert (http://www.threatexpert.com/)
29
CHAPTER 3. MALWARE EVASION
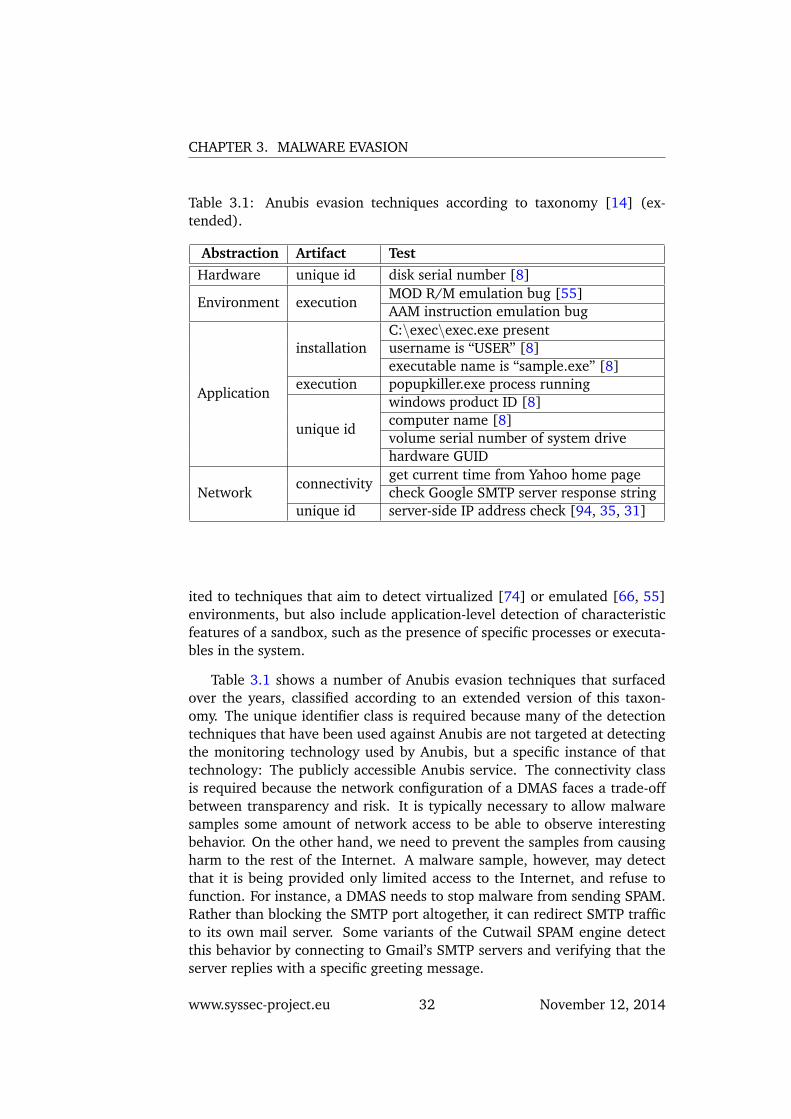
ployed emulation or virtualization technology [74, 66, 55, 20, 21], malwareauthors can detect specific sandboxes by taking advantage of identifiers suchas volume serial numbers or IP addresses. As we will discuss later, sandboxdetection is not a theoretical problem; Table 3.1 holds a number of con-crete examples of how malware samples have evaded analysis in the Anubissandbox in the past.
One approach to defeating sandbox evasion is to try to build a transpar-ent sandbox. That is, to construct an analysis environment that is indistin-guishable from a real, commonly used production environment. This is thegoal of systems such as Ether [16]. However, Garfinkel et al. [23] arguethat it is fundamentally unfeasible to build a fully transparent virtual ma-chine monitor, particularly if code running in the sandbox has access to theInternet and can therefore query a remote time source. In fact, Ether doesnot defend against timing attacks that use a remote time source, while Peket al. [57] have introduced a tool called nEther that is able to detect Etherusing local attacks. Even if transparent sandbox technology were available,a specific sandbox installation could be detectable based on the particularconfiguration of software that happens to be installed on the system, orbased on identifiers such as the product IDs of installed software [8] or theuniversal identifiers of disk partitions.
Another approach relies on running a sample in multiple analysis sand-boxes to detect deviations in behavior that may indicate evasion [14, 33, 6,30]. This is the approach which is also used in [41]. For this, a malwaresample is started in several sandboxes, obtaining a number of behavioralprofiles that describe its behavior in each environment.
The implementation of this approach is a system called DISARM: Detect-Ing Sandbox-AwaRe Malware.
DISARM detects differences in behavior regardless of their cause, and istherefore completely agnostic to the way that malware may perform sand-box detection. Furthermore, it is also largely agnostic to the monitoringtechnologies used in the analysis sandboxes, since it does not require heavy-weight, instruction-level instrumentation. Any monitoring technology thatcan detect persistent changes to system state at the operating system levelcan take advantage of these techniques.
Previous work on detecting and remediating analysis evasion has re-quired fine-grained, instruction-level instrumentation [33, 30]. However, ina DMAS that processes tens of thousands of samples each day, large-scaledeployment of instruction-level instrumentation is problematic. This is be-cause it leads to an extremely slow emulated environment, to the point thatsome malware fail to perform network communication because of server-side timeouts. Furthermore, the produced log files are unmanageably large(up to half a Gigabyte for a single execution according to Kang et al. [33]).DISARM does not suffer from this limitation. This allows to apply the tech-
www.syssec-project.eu 30 November 12, 2014
3.1. EVASION PREVALENCE IN MALWARE
niques to a significant number of malware samples, revealing a variety ofanti-analysis techniques.
Chen et al. [14] also performed a large-scale study of analysis-resistantmalware. However, their work assumes that an executable is evading anal-ysis whenever its executions differ by even a single persistent change. Thisassumption does not seem to hold on a dataset of modern malware: aboutone in four malware samples produces different persistent changes betweenmultiple executions in the same sandbox. DISARM executes malware samplesmultiple times in each sandbox to establish a baseline for a sample’s vari-ation in behavior. Furthermore, it introduces behavior normalization andcomparison techniques that allow to eliminate spurious differences that donot correspond to semantically different behavior.
DISARM does not, however, automatically identify the root cause of adivergence in behavior. Detect samples could therefore be further processedusing previously proposed approaches to automatically determine how theyevade analysis. For instance, the techniques proposed by Balzarotti et al. [6]can be used to automatically diagnose evasion techniques that are based onCPU emulation bugs. Differential slicing [30] is a more general techniquethat can likewise identify the root cause of a divergence, but it requires ahuman analyst to select a specific difference in behavior to be used as astarting point for analysis.
3.1 Evasion prevalence in malware
Dynamic malware analysis system (DMAS) like Anubis are mostly based onan instrumented Qemu [11] emulator. The main output of the analysis isa human-readable report that describes the operating system level behaviorof the analyzed executable. Anubis has has been offering malware analysisas a free service since February 2007. This service has over 2,000 registeredusers, has received submissions from 200,000 distinct IP addresses, and hasalready analyzed over 50,000,000 malware samples.
Public-facing analysis sandboxes such as Anubis are particularly vulner-able to detection, because attackers can probe the sandbox by submittingmalware samples specifically designed to perform reconnaissance. Suchsamples can read out characteristics of the analysis sandbox and then usethe analysis report produced by the sandbox to leak the results to the at-tacker. These characteristics can later be tested by malware that wishes toevade analysis. However, because of sharing of malware samples betweensandbox operators, private sandboxes may also be vulnerable to reconnais-sance [94], so long as they allow executed samples to contact the Internetand leak out the detected characteristics.
Chen et al. [14] have proposed a taxonomy of approaches that can beused by malware for the detection of analysis sandboxes. These are not lim-
www.syssec-project.eu 31 November 12, 2014
CHAPTER 3. MALWARE EVASION
Table 3.1: Anubis evasion techniques according to taxonomy [14] (ex-tended).
Abstraction Artifact TestHardware unique id disk serial number [8]
Environment executionMOD R/M emulation bug [55]AAM instruction emulation bug
Application
installationC:\exec\exec.exe presentusername is “USER” [8]executable name is “sample.exe” [8]
execution popupkiller.exe process running
unique id
windows product ID [8]computer name [8]volume serial number of system drivehardware GUID
Networkconnectivity
get current time from Yahoo home pagecheck Google SMTP server response string
unique id server-side IP address check [94, 35, 31]
ited to techniques that aim to detect virtualized [74] or emulated [66, 55]environments, but also include application-level detection of characteristicfeatures of a sandbox, such as the presence of specific processes or executa-bles in the system.
Table 3.1 shows a number of Anubis evasion techniques that surfacedover the years, classified according to an extended version of this taxon-omy. The unique identifier class is required because many of the detectiontechniques that have been used against Anubis are not targeted at detectingthe monitoring technology used by Anubis, but a specific instance of thattechnology: The publicly accessible Anubis service. The connectivity classis required because the network configuration of a DMAS faces a trade-offbetween transparency and risk. It is typically necessary to allow malwaresamples some amount of network access to be able to observe interestingbehavior. On the other hand, we need to prevent the samples from causingharm to the rest of the Internet. A malware sample, however, may detectthat it is being provided only limited access to the Internet, and refuse tofunction. For instance, a DMAS needs to stop malware from sending SPAM.Rather than blocking the SMTP port altogether, it can redirect SMTP trafficto its own mail server. Some variants of the Cutwail SPAM engine detectthis behavior by connecting to Gmail’s SMTP servers and verifying that theserver replies with a specific greeting message.
www.syssec-project.eu 32 November 12, 2014
3.2. BEHAVIOR COMPARISON
Execution Monitoring Behavior Comparison
Behavior Normalization
Windows Kernel Module
Anubis Distance Measure
and Scoring
Same Behavior
Different Behavior
Behavioral Profiles
Figure 3.1: System Architecture of DISARM.
In the arms race between malware analysis systems and malware sam-ples that evade analysis, its required to rely on more automation. For this,a scalable tools to screen large numbers of malware samples for evasive be-havior is needed, regardless of the class of evasion techniques they employ.This is the role that DISARM aims to fill.
3.1.1 DISARM Architecture
DISARM works in two phases, illustrated in Fig. 3.1. In the execution mon-itoring phase, a malware sample is executed in a number of analysis sand-boxes. The output of this execution monitoring provides the malware’s be-havior represented as a number of behavioral profiles (one for each execu-tion). In the behavior comparison phase, the behavioral profiles are nor-malized to eliminate spurious differences. Then the distances between eachpair of normalized behavioral profiles is computed. Finally, these distancesare combined into an evasion score, that is compared against a threshold todetermine whether the malware displayed different behavior in any of thesandboxes. Samples that are classified as showing signs of evasion can thenbe further analyzed in order to identify new evasion techniques and makesandboxes resilient against these attacks.
3.2 Behavior Comparison
When comparing behavioral profiles produced by different monitoring tech-nologies, it is highly unlikely that they will contain the same amount offeatures. The reason is that each monitoring technology is likely to havesignificantly different runtime overheads, so a sample will not be able to ex-ecute the same number of actions on each system within a given amount oftime. Nor is it possible to simply increase the timeout on the slower systemto compensate for this, since monitoring overheads may vary depending onthe type of load. Thus, given two sandboxes α and β and the behavioral pro-files consisting of nα and nβ features respectively, DISARM only takes into
www.syssec-project.eu 33 November 12, 2014
CHAPTER 3. MALWARE EVASION
account the first min(nα, nβ) features from each profile, ordered by times-tamp. In a few cases, however, this approach is not suitable. If the sampleterminated on both sandboxes, or it terminated in sandbox α and nα < nβ,we have to compare all features. This is necessary to identify samples thatdetect the analysis sandbox and immediately exit. Samples that detect asandbox may instead choose to wait for the analysis timeout without per-forming any actions. Therefore, all features are compared in cases wherethe sample exhibited “not much activity” in one of the sandboxes. For this, athreshold of 150 features is used, that covers the typical amount of activityperformed during program startup. This is the threshold used by Bayer etal. [8], who in contrast observed 1,465 features in the average profile.
Not all features are of equal value for characterizing a malware’s behav-ior. DISARM only takes into account features that correspond to persistentchanges to the system state as well as features representing network activ-ity. This includes writing to the file system, registry or network as well asstarting and stopping processes and services. This is similar to the approachused in previous work [5, 14] and it leads to a more accurate detection ofsemantically different behavior.
3.2.1 Behavior Normalization
In order to meaningfully compare behavioral profiles from different exe-cutions of a malware sample, a number of normalization steps need to beperformed, mainly for the following two reasons: The first reason is thatsignificant differences in behavior occur even when running an executablemultiple times within the same sandbox. Many analysis runs exhibit non-determinism not only in malware behavior but also in behavior occurringinside Windows API functions, executables or services. The second reasonis that behavioral profiles obtained from different Windows installations arecompared. This is necessary to be able to identify samples that evade anal-ysis by detecting a specific installation. Differences in the file system andregistry, however, can result in numerous differences in the profiles. Thesespurious differences make it harder to detect semantically different behav-ior. Therefore, the following normalizations are performed on each profile.
• Noise reduction. Features generated by benign Windows programs(notepad.exe, calc.exe, winmine.exe, mspaint.exe) are consider as”noise”. These features are filtered out of all behavioral profiles.
• User Generalization. Programs can write to the user’s home directoryin C:\Documents and Settings\<username> or the Registry withoutneeding special privileges. Accesses to values at these locations aregeneralized.
www.syssec-project.eu 34 November 12, 2014
3.2. BEHAVIOR COMPARISON
• Environment Generalization. Other system specific values includehardware identifiers and cache paths which are also generalized.
• Randomization Detection. Malware samples often use random nameswhen creating new files or registry keys. The generalized profiles arecreated by replacing the random names with a special token.
• Repetition Detection. Some types of malware perform the same ac-tions on different resources over and over again. If any actions (suchas a file write) are found that are performed on three or more suchresources, a generalized resource is created in the queried directoryand these actions are assigned to it.
• File System and Registry Generalization. For each sandbox, a snap-shot of the Windows image’s state at analysis start is created. Thissnapshot includes a list of all files, a dump of the registry, and infor-mation about the environment which is used to generalize the userand the environment.
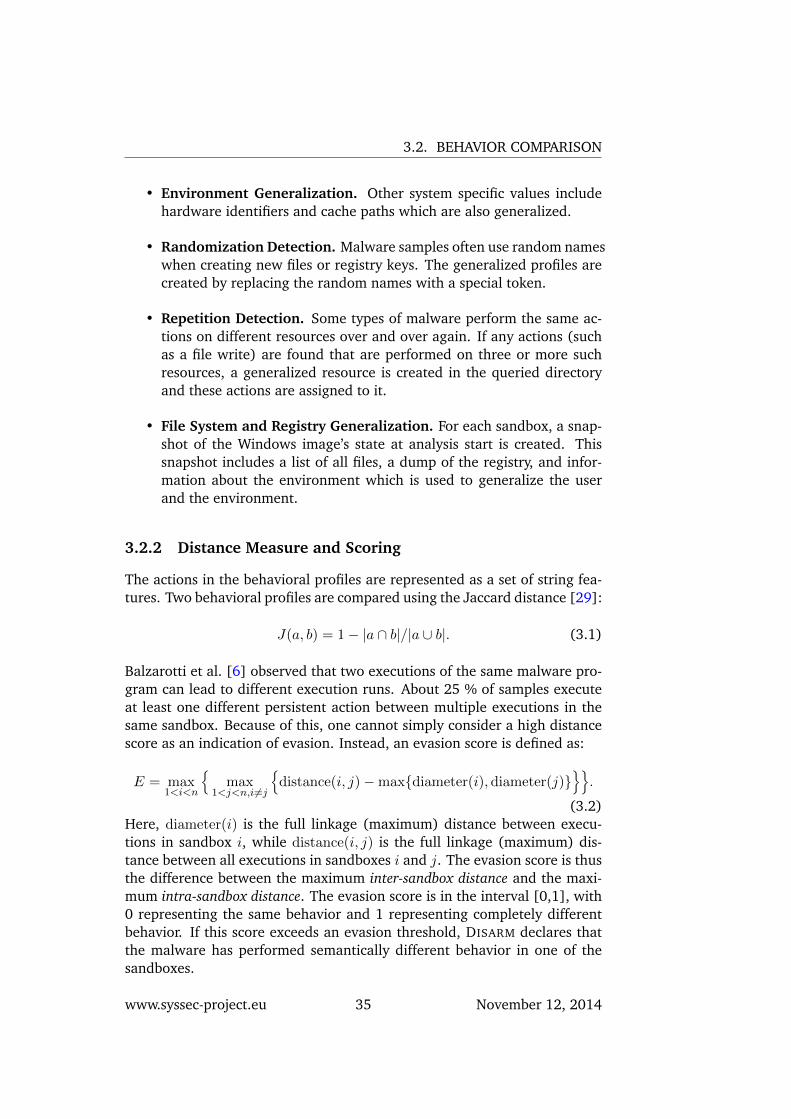
3.2.2 Distance Measure and Scoring
The actions in the behavioral profiles are represented as a set of string fea-tures. Two behavioral profiles are compared using the Jaccard distance [29]:
J(a, b) = 1− |a ∩ b|/|a ∪ b|. (3.1)
Balzarotti et al. [6] observed that two executions of the same malware pro-gram can lead to different execution runs. About 25 % of samples executeat least one different persistent action between multiple executions in thesame sandbox. Because of this, one cannot simply consider a high distancescore as an indication of evasion. Instead, an evasion score is defined as:
E = max1<i<n
{max
1<j<n,i6=j
{distance(i, j)−max{diameter(i), diameter(j)}
}}.
(3.2)Here, diameter(i) is the full linkage (maximum) distance between execu-tions in sandbox i, while distance(i, j) is the full linkage (maximum) dis-tance between all executions in sandboxes i and j. The evasion score is thusthe difference between the maximum inter-sandbox distance and the maxi-mum intra-sandbox distance. The evasion score is in the interval [0,1], with0 representing the same behavior and 1 representing completely differentbehavior. If this score exceeds an evasion threshold, DISARM declares thatthe malware has performed semantically different behavior in one of thesandboxes.
www.syssec-project.eu 35 November 12, 2014
CHAPTER 3. MALWARE EVASION
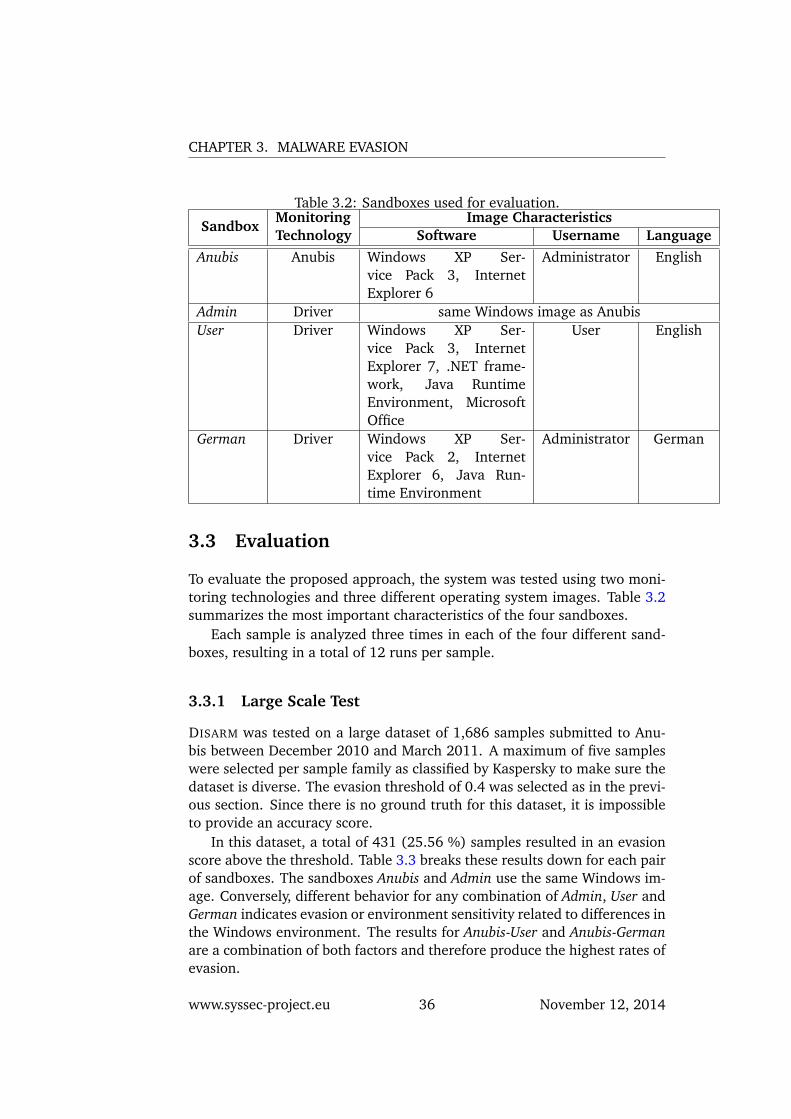
Table 3.2: Sandboxes used for evaluation.
SandboxMonitoringTechnology
Image CharacteristicsSoftware Username Language
Anubis Anubis Windows XP Ser-vice Pack 3, InternetExplorer 6
Administrator English
Admin Driver same Windows image as AnubisUser Driver Windows XP Ser-
vice Pack 3, InternetExplorer 7, .NET frame-work, Java RuntimeEnvironment, MicrosoftOffice
User English
German Driver Windows XP Ser-vice Pack 2, InternetExplorer 6, Java Run-time Environment
Administrator German
3.3 Evaluation
To evaluate the proposed approach, the system was tested using two moni-toring technologies and three different operating system images. Table 3.2summarizes the most important characteristics of the four sandboxes.
Each sample is analyzed three times in each of the four different sand-boxes, resulting in a total of 12 runs per sample.
3.3.1 Large Scale Test
DISARM was tested on a large dataset of 1,686 samples submitted to Anu-bis between December 2010 and March 2011. A maximum of five sampleswere selected per sample family as classified by Kaspersky to make sure thedataset is diverse. The evasion threshold of 0.4 was selected as in the previ-ous section. Since there is no ground truth for this dataset, it is impossibleto provide an accuracy score.
In this dataset, a total of 431 (25.56 %) samples resulted in an evasionscore above the threshold. Table 3.3 breaks these results down for each pairof sandboxes. The sandboxes Anubis and Admin use the same Windows im-age. Conversely, different behavior for any combination of Admin, User andGerman indicates evasion or environment sensitivity related to differences inthe Windows environment. The results for Anubis-User and Anubis-Germanare a combination of both factors and therefore produce the highest rates ofevasion.
www.syssec-project.eu 36 November 12, 2014
3.3. EVALUATION
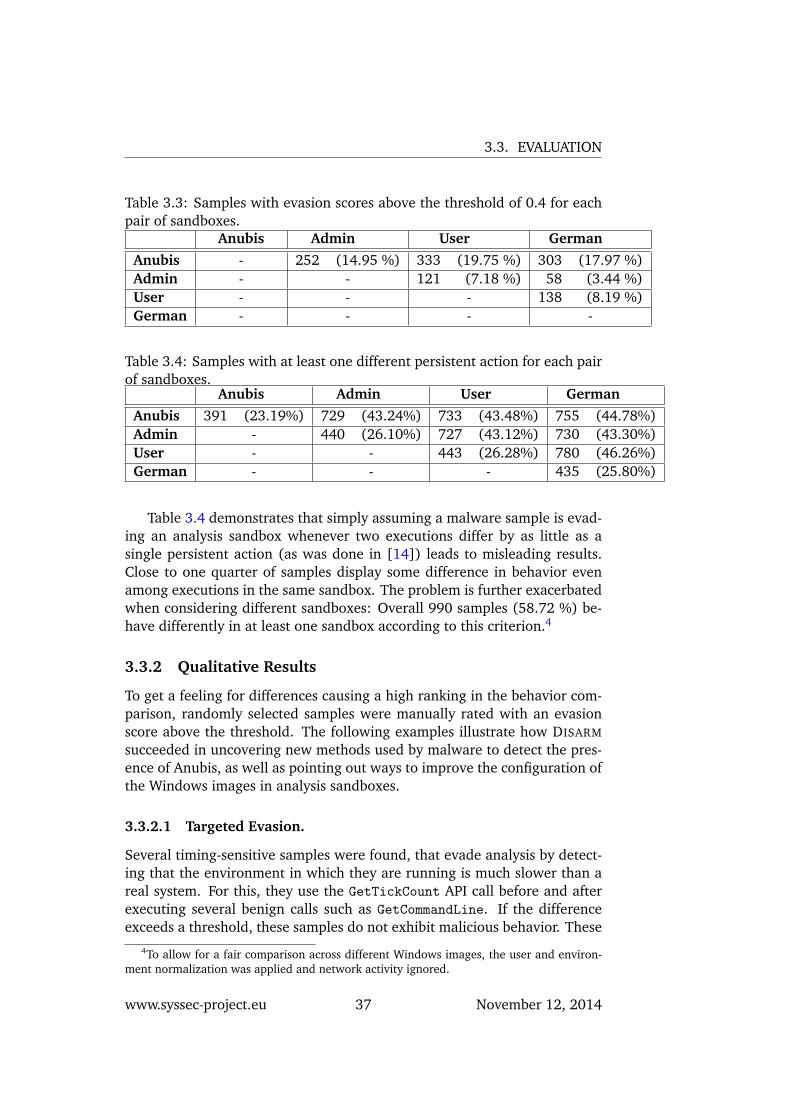
Table 3.3: Samples with evasion scores above the threshold of 0.4 for eachpair of sandboxes.
Anubis Admin User GermanAnubis - 252 (14.95 %) 333 (19.75 %) 303 (17.97 %)Admin - - 121 (7.18 %) 58 (3.44 %)User - - - 138 (8.19 %)German - - - -
Table 3.4: Samples with at least one different persistent action for each pairof sandboxes.
Anubis Admin User GermanAnubis 391 (23.19%) 729 (43.24%) 733 (43.48%) 755 (44.78%)Admin - 440 (26.10%) 727 (43.12%) 730 (43.30%)User - - 443 (26.28%) 780 (46.26%)German - - - 435 (25.80%)
Table 3.4 demonstrates that simply assuming a malware sample is evad-ing an analysis sandbox whenever two executions differ by as little as asingle persistent action (as was done in [14]) leads to misleading results.Close to one quarter of samples display some difference in behavior evenamong executions in the same sandbox. The problem is further exacerbatedwhen considering different sandboxes: Overall 990 samples (58.72 %) be-have differently in at least one sandbox according to this criterion.4
3.3.2 Qualitative Results
To get a feeling for differences causing a high ranking in the behavior com-parison, randomly selected samples were manually rated with an evasionscore above the threshold. The following examples illustrate how DISARM
succeeded in uncovering new methods used by malware to detect the pres-ence of Anubis, as well as pointing out ways to improve the configuration ofthe Windows images in analysis sandboxes.
3.3.2.1 Targeted Evasion.
Several timing-sensitive samples were found, that evade analysis by detect-ing that the environment in which they are running is much slower than areal system. For this, they use the GetTickCount API call before and afterexecuting several benign calls such as GetCommandLine. If the differenceexceeds a threshold, these samples do not exhibit malicious behavior. These
4To allow for a fair comparison across different Windows images, the user and environ-ment normalization was applied and network activity ignored.
www.syssec-project.eu 37 November 12, 2014
CHAPTER 3. MALWARE EVASION
samples can be detected because the in-the-box monitoring technology, de-spite running inside Qemu, is much faster than Anubis and does not exceedthe specified thresholds. This further highlights the importance of evasiondetection techniques that are compatible with lightweight instrumentation.Among these samples were representatives of several well known malwarefamilies such as Zeus, Virut, Agent and Rbot.
Win32.Packed.Krap.ag.5 and Win32.TrojanSpy.Banker.9 evade Anubis bychecking if the parent process is explorer.exe. In Anubis samples are startedby an analysis daemon, which terminates right away. Thus, this condition isnot met and these samples exit without performing any malicious activity.
To render known evasion techniques ineffective, Anubis already ran-domizes a number of identifiers at each execution, such as those listed inTable 3.1. This is implemented by intercepting the calls to known sourcesfor this information and forging the results. Inspecting samples detectedby DISARM, however, reveals that this feature needs to be improved. Sev-eral samples query a machine GUID stored in HKLM\SOFTWARE\MICROSOFT\CRYPTOGRAPHY\MACHINEGUID, that is not yet covered by Anubis randomiza-tion.5 In other cases, the randomization was insufficient to prevent eva-sion. Trojan-Clicker.Win32.Wistler.d detected Anubis by querying the com-puter name. The computer names have the format “pc” followed by a ran-dom number. Clearly, a stronger randomization of this identifier is needed.Finally, malware can also detect Anubis by checking the hard drive manufac-turer information. The randomization feature of Anubis already interceptsthe device control code IOCTL STORAGE QUERY PROPERTY and the system callNtQueryVolumeInformationFile and forges the return information. Somesamples, however, were able to bypass this randomization by instead usingthe device control code DFP RECEIVE DRIVE DATA to retrieve the hard driveserial number and manufacturer.
3.3.2.2 Environment Sensitivity.
The results of the evaluation also exposed various configuration flaws inthe image currently used in Anubis. In this image, third party extensionsfor Internet Explorer are disabled. AdWare.Win32.InstantBuzz queries thissetting and terminates with a popup asking the user to enable browser ex-tensions. Four samples, e.g. Trojan.Win32.Powp.gen, infect the system byreplacing the Java Update Scheduler. Clearly, they can only show this be-havior in the sandboxes in which the Java Runtime Environment is installed.Microsoft Office is only installed in one of the sandboxes and is targeted byWorm.Win32.Mixor. P2P-Worm.Win32.Tibick.c queries the registry for thepresence of a file-sharing application and fails on images where the Kazaa
5Note that this is a different identifier than the hardware GUID listed in Table 3.1, whichAnubis already randomizes.
www.syssec-project.eu 38 November 12, 2014
3.4. DISCUSSION
file-sharing program is not installed. Using this insight it was possible tomodify the image used in Anubis in order to observe a wider variety of mal-ware behavior.
3.3.2.3 Driver Evasion.
Samples are prevented from loading drivers in order to maintain the in-tegrity of the kernel module. Nonetheless, samples were found that notonly detect the logging mechanism, but also actively tamper with SSDThooks. At least 20 samples employ mechanisms to restore the hooks totheir original addresses and therefore disable the logging in the driver. Thiscan be done from user space by directly accessing \device\physicalmemoryand restoring the values in the SSDT with the original values read from thentoskrnl.exe disk image [83]. Another ten samples achieve the same effectby using the undocumented function NtSystemDebugControl to directly ac-cess kernel memory. These techniques are employed by several popular mal-ware families such as Palevo/Butterfly, Bredolab, GameThief and Bifrose,probably as a countermeasure against Anti-Virus solutions. By disabling ac-cess to kernel memory and instrumenting additional system calls, it is pos-sible to harden a driver against such techniques, so long as the kernel is notvulnerable to privilege-escalation vulnerabilities.
3.3.2.4 False Positives.
False positives were caused by samples from the Sality family. This viruscreates registry keys and sets registry values whose name depends on thecurrently logged in user: HKCU\SOFTWARE\AASPPAPMMXKVS\A1 0 for “Admin-istrator” and HKCU\SOFTWARE\APCR\U1 0 for “User”. This behavior is notrandom and not directly related to the user name and therefore undetectedby the normalization.
3.4 Discussion
Dynamic malware analysis systems are vulnerable to evasion from maliciousprograms that detect the analysis sandbox. In fact, the Anubis DMAS hasbeen the target of a variety of evasion techniques over the years.
In this chapter, we introduced DISARM, a system for detecting environ-ment sensitive malware. By comparing the behavior of malware across mul-tiple analysis sandboxes, DISARM can detect malware that evades analysisby detecting a monitoring technology (e.g. emulation), as well as malwarethat relies on detecting characteristics of a specific Windows environmentthat is used for analysis. Furthermore, DISARM is compatible with essen-tially any in-the-box or out-of-the-box monitoring technology.
www.syssec-project.eu 39 November 12, 2014
CHAPTER 3. MALWARE EVASION
DISARM was evaluated against over 1,500 malware samples in four dif-ferent analysis sandboxes using two different monitoring technologies. Asa result, several new evasion techniques currently in use by malware wereuncovered. These results, however, are not the end of the line. As alreadymentioned before, there is a never ending arms race between detection andevasion. How such new evasion techniques may look like is yet to be seen.
www.syssec-project.eu 40 November 12, 2014
4Malware experiments
In the previous chapter, we already mentioned how important it is to cre-ate a safe containment for analysis environments. Observing the host- ornetwork-level behavior of malware as it executes constitutes an essentialtechnique for researchers seeking to understand malicious code. Dynamicmalware analysis systems like Anubis [10], CWSandbox [92] and othershave proven invaluable in generating ground truth characterizations of mal-ware behavior. The anti-malware community regularly applies these groundtruths in scientific experiments, for example to evaluate malware detectiontechnologies, to disseminate the results of large-scale malware experiments,to identify new groups of malware, or as training datasets for machine learn-ing approaches. However, while analysis of malware execution clearly holdsimportance for the community, the data collection and subsequent analysisprocesses face numerous potential pitfalls.
In this chapter we explore issues relating to prudent experimental evalu-ation for projects that use malware-execution datasets. As with the previouschapters, detailed information is available in the original publication [73].Our interest in the topic arose while analyzing malware and researchingdetection approaches, during which we discovered that well-working labexperiments could perform much worse in real-world evaluations. Investi-gating these difficulties led to identify and explore the pitfalls that causedthem. For example, we observed that even a slight artifact in a malwaredataset can inadvertently lead to unforeseen performance degradation inpractice. Thus, we highlight that performing prudent experiments involv-ing such malware analysis is harder than it seems. Related to this, we havefound that the research community’s efforts (including that of the SysSecconsortium) frequently fall short of fully addressing existing pitfalls. Someof the shortcomings have to do with presentation of scientific work, i.e.,authors remaining silent about information that they could likely add with
41
CHAPTER 4. MALWARE EXPERIMENTS
ease. Other problems, however, go more deeply, and bring into question thebasic representativeness of experimental results.
As in any science, it is desirable for the community to ensure to under-take prudent experimental evaluations. We define experiments reported asprudent if they are are correct, realistic, transparent, and do not harm oth-ers. Such prudence provides a foundation for the reader to objectively judgean experiments results, and only well-framed experiments enable compari-son with related work. However, experiments in our communitys publica-tions could oftentimes be improved in terms of transparency, e.g., by addingand explaining simple but important aspects of the experiment setup. Theseadditions render the papers more understandable, and enable others to re-produce results. Otherwise, the community finds itself at risk of failing toenable sound confirmation of previous results. In addition, we find that pub-lished work frequently lacks sufficient consideration of experimental designand empirical assessment to enable translation from proposed methodolo-gies to viable, practical solutions. In the worst case, papers can validatetechniques with experimental results that suggest the authors have solved agiven problem, but the solution will prove inadequate in real use. In con-trast, well-designed experiments significantly raise the quality of science.Consequently, it is important to have guidelines regarding both experimen-tal design and presentation of research results. This chapter aims to frame aset of guidelines for describing and designing experiments that incorporatesuch prudence, hoping to provide touchstones not only for authors, but alsofor reviewers and readers of papers based on analysis of malware execution.To do so, we define goals that we regard as vital for prudent malware experi-mentation: transparency, realism, correctness, and safety. We then translatethese goals to guidelines that researchers in our field can use. Most pub-lished papers could significantly benefited from considering these guide-lines. This assessment is also backed up by a set of conceptually simpleexperiments performed using publicly available datasets. Following the pro-posed guidelines can be difficult in certain cases. Still, the proposed guide-lines canwhen applicablehelp with working towards scientifically rigorousexperiments when using malware datasets.
4.1 Designing experiments
In this section we discuss characteristics important for prudent experimen-tation with malware datasets. The inspiration to draw these criteria comesfrom extensive experience with malware analysis and malware detection, aswell as from lessons learned when trying to assess papers in the field andinsome casesreproducing their results. We emphasize that the goal is not tocriticize malware execution studies in general. Instead, we highlight pitfallswhen using malware datasets, and suggest guidelines how to devise prudent
www.syssec-project.eu 42 November 12, 2014
4.2. CORRECT DATASETS
experiments with such datasets. We group the pitfalls that arise when rely-ing on data gathered from malware execution into four categories. Need-less to say, compiling correct datasets forms a crucial part of any experiment.We further experienced how difficult it proves to ensure realism in malwareexecution experiments. In addition, transparency must be provided whendetailing the experiments to render them both repeatable and comprehensi-ble. Moreover, legal and ethical considerations mandate discussion of howto conduct such experiments safely, mitigating harm to others. For each ofthese four cornerstones of prudent experimentation, more specific aspectscan be outlined and guidelines to ensure prudence can be described.
4.2 Correct Datasets
4.2.1 Check if goodware samples should be removed from datasets
Whereas goodware (legitimate software) has to be present for example inexperiments to measure false alarms, it is typically not desirable to havegoodware samples in datasets to estimate false negative rates. However,malware execution systems open to public sample submission lack controlover whether specimens submitted to the system in fact consist of malware;the behavior of such samples remains initially unknown rather than ma-licious per se.It would be favorable to use sources of malware specimensgathered via means that avoid the possible presence of goodware; explic-itly remove goodware samples from their datasets; or compile sample sub-sets based on malware family labels.
4.2.2 Balance datasets over malware families
In unbalanced datasets, aggressively polymorphic malware families will of-ten unduly dominate datasets filtered by sample-uniqueness (e.g., MD5 hashes).Authors should discuss if such imbalances biased their experiments, and, ifso, balance the datasets to the degree possible.
4.2.3 Check whether training and evaluation datasets shouldhave distinct families
When splitting datasets based on sample-uniqueness, two distinct malwaresamples of one family can potentially appear in both the training and vali-dation dataset. Appearing in both may prove desirable for experiments thatderive generic detection models for malware families by training on samplesubsets. In contrast, authors designing experiments to evaluate on previ-ously unseen malware types should separate the sets based on families.
www.syssec-project.eu 43 November 12, 2014
CHAPTER 4. MALWARE EXPERIMENTS
4.2.4 Perform analysis with higher privileges than the malwares
Malware with rootkit functionality can interfere with the OS data structuresthat kernel-based sensors modify. Such malware can readily influence mon-itoring components, thus authors ought to report on the extent to whichmalware samples and monitoring mechanisms collide. For example, kernel-based sensors could monitor whenever a malware gains equal privileges byobserving if it is loading a kernel driver. Ideally, sensors are placed at alevel where they cannot be modified, such as monitoring system calls witha system emulator or in a VMM.
4.2.5 Discuss and if necessary mitigate analysis artifacts andbiases
Execution environment artifacts, such as the presence of specific strings(e.g., user names or OS serial keys) or the software configuration of ananalysis environment, can manifest in the specifics of the behavior recordedfor a given execution. Particularly when deriving models to detect malware,papers should explain the particular facets of the execution traces that agiven model leverages. Similarly, biases arise if the malware behavior in ananalysis environment differs from that manifest in an infected real system,for example due to containment policies.
4.2.6 Use caution when blending malware activity traces intobenign background activity
The behavior exhibited by malware samples executing in dynamic analysisenvironments differs in a number of ways from that which would mani-fest in victim machines in the wild. Consequently, environment-specific per-formance aspects may poorly match those of the background activity withwhich experimenters combine them. The resulting idiosyncrasies may leadto seemingly excellent evaluation results, even though the system will per-form worse in real-world settings. Authors should consider these issues, anddiscuss them explicitly if they decide to blend malicious traces with benignbackground activity.
4.3 Transparency
4.3.1 State family names of employed malware samples
Consistent malware naming remain a thorny issue, but labeling the em-ployed malware families in some form helps the reader identify for whichmalware a methodology works. A large number of unique malware samples
www.syssec-project.eu 44 November 12, 2014
4.3. TRANSPARENCY
does not imply family diversity, due to the potential presence of binary-level polymorphism. If page-size limitations do not allow for such verboseinformation, authors can outsource this information to websites and addreferences to their paper accordingly.
4.3.2 List which malware was analyzed when
To understand and repeat experiments the reader requires a summary, per-haps provided externally to the paper, that fully describes the malware sam-ples in the datasets. Given the ephemeral nature of some malware, it helpsto capture the dates on which a given sample executed to put the observedbehavior in context, say of a botnets lifespan that went through a numberof versions or ended via a take-down effort.
4.3.3 Explain the malware sample selection
Researchers oftentimes study only a subset of all malware specimens at theirdisposal. For instance, for statistically valid experiments, evaluating only arandom selection of malware samples may prove necessary. Focusing onmore recent analysis results and ignoring year-old data may increase rele-vance. In either case, authors should describe how they selected the mal-ware subsets, and if not obvious, discuss any potential bias this induces.Note that random sample selections still may have imbalances that poten-tially need to be further addressed.
4.3.4 Mention the system used during execution
Malware may execute differently (if at all) across various systems, softwareconfigurations and versions. Explicit description of the particular system(s)used (e.g., Windows XP SP3 32bit without additional software installations)renders experiments more transparent, especially as presumptions about thestandard OS change with time. When relevant, authors should also includeversion information of installed software.
4.3.5 Describe the network connectivity of the analysis environ-ment
Malware families assign different roles of activity depending on a systemsconnectivity, which can significantly influence the recorded behavior. Forexample, in the Waledac botnet [79], PCs connected via NAT primarily sentspam, while systems with public IP addresses acted as fast-flux repeaters.
www.syssec-project.eu 45 November 12, 2014
CHAPTER 4. MALWARE EXPERIMENTS
4.3.6 Analyze the reasons for false positives and false negatives
False classification rates alone provide little clarification regarding a systemsperformance. To reveal fully the limitations and potential of a given ap-proach in other environments, we advocate thoughtful exploration of whatled to the observed errors. Sommer and Paxson explored this particularissue in the context of anomaly detection systems [72].
4.3.7 Analyze the nature/diversity of true positives
Similarly, true positive rates alone often do not adequately reflect the po-tential of a methodology [72]. For example, a malware detector flagginghundreds of infected hosts may sound promising, but not if it detects only asingle malware family or leverages an environmental artifact. Papers shouldevaluate the diversity manifest in correct detections to understand to whatdegree a system has general discriminative power.
4.4 Realism
4.4.1 Evaluate relevant malware families
Using significant numbers of popular malware families bolsters the impactof experiments. Given the ongoing evolution of malware, exclusively usingolder or sinkholed specimens can undermine relevance.
4.4.2 Perform real-world evaluations
A realworld experiment can be defined as an evaluation scenario that in-corporates the behavior of a significant number of hosts in active use bypeople other than the authors. Realworld experiments play a vital role inevaluating the gap between a method and its application in practice.
4.4.3 Exercise caution generalizing from a single OS version,such as Windows XP
For example, by limiting analysis to a single OS version, experiments mayfail with malware families that solely run or exhibit different behavior ondisregarded OS versions. For studies that strive to develop results that gen-eralize across OS versions, papers should consider to what degree we cangeneralize results based on one specific OS version.
4.4.4 Choose appropriate malware stimuli
Malware classes such as keyloggers require triggering by specific stimulisuch as keypresses or user interaction in general. In addition, malware of-
www.syssec-project.eu 46 November 12, 2014
4.5. SAFETY
ten expose additional behavior when allowed to execute for more than ashort period [72]. Authors should therefore describe why the analysis dura-tion they chose suffices for their experiments. Experiments focusing on theinitialization behavior of malware presumably require shorter runtimes thanexperiments that aim to detect damage functionality such as DoS attacks.
4.4.5 Consider allowing Internet access to malware
Deferring legal and ethical considerations for a moment, we argue that ex-periments become significantly more realistic if the malware has Internet ac-cess. Malware often requires connectivity to communicate with command-and-control (C&C) servers and thus to expose its malicious behavior. In ex-ceptional cases where experiments in simulated Internet environments areappropriate, authors need to describe the resulting limitations.
4.5 Safety
4.5.1 Deploy and describe containment policies
Well designed containment policies facilitate realistic experiments while mit-igating the potential harm malware causes to others over time. Experimentsshould at a minimum employ basic containment policies such as redirectingspam and infection attempts, and identifying and suppressing DoS attacks.Authors should discuss the containment policies and their implications onthe fidelity of the experiments. Ideally, authors also monitor and discusssecurity breaches in their containment.
4.6 Discussion
These guidelines are designed to aid with designing prudent malware-basedexperiments. In [72], the authors assessed these guidelines by surveying 36original papers. The survey identified shortcomings in most papers fromboth top-tier and less prominent venues. By applying these guidelines,the prudence of most of the experiments could have significantly been im-proved. But what may be the reasons for such discouraging results? Theshortcomings in experimental evaluation likely arise from several causes.Researchers may not have developed a methodical approach for presentingtheir experiments, or may not see the importance of detailing various as-pects of the setup. Deadline pressures may lead to a focus on presentingnovel technical content as opposed to the broader evaluation context. Simi-larly, detailed analyses of experimental results are often not given sufficientemphasis. In addition, page-length limits might hamper the introduction
www.syssec-project.eu 47 November 12, 2014
CHAPTER 4. MALWARE EXPERIMENTS
of important aspects in final copies. Finally, researchers may simply over-look some of the presented hidden pitfalls of using malware datasets. Manyof these issues can be addressed through devoting more effort to presenta-tion. Improving the correctness and realism of experiments is harder thanit seems, though. For instance, while real-world scenarios are vital for real-istic experiments, conducting such experiments can prove time-consumingand may raise significant privacy concerns for system or network admin-istrators. Furthermore, it is not always obvious that certain practices canlead to incorrect datasets or lead to unrealistic scenarios. For example, itrequires great caution to carefully think of artifacts introduced by malwareexecution environments, and it is hard to understand that, for example, ex-periments on overlay datasets may be biased. The significance of imprudentexperiments becomes even more important in those instances where currentpractices inspire others to perform similar experiments - a phenomenon weobserved in our survey.
We hope that the guidelines framed in this deliverable improve this sit-uation by helping to establish a common set of criteria that can ensure pru-dent future experimentation with malware datasets. While many of theseguidelines are not new, this approach holds promise both for authors, byproviding a methodical means to contemplate the prudence and transpar-ent description of their malware experiments, and for readers/reviewers, byproviding more information by which to understand and assess such exper-iments.
www.syssec-project.eu 48 November 12, 2014
5URL Shortening Services
In the previous chapters we focused on how malware infects a system andpresented some approaches to detect and mitigate malware infections. Whatwe did not yet cover is, how malware exploits a target system once it man-aged to infect it. One key enabler for these mostly fraudulent activitiesare URL shortening services. They provide an additional obstacle for anti-malware solutions since they introduce an additional layer of obfuscation.The target domain cannot easily be parsed anymore. Consequently, the in-formation contained in the contacted domain is lost.
In a study characterizing the usage of short URLs [3] it clearly showsthat these shortening services are on the rise. The growing popularity ofsuch services is the result of their extensive usage in Online Social Networks(OSNs). Services, like Twitter, impose an upper limit on the length of postedmessages, and thus URL shortening is typical for the propagation of content.Consequently, URL shortening services have become part of the web’s criti-cal infrastructure, posing challenging questions regarding its performance,scalability, and reliability.
5.1 Security Threats and Countermeasures
Users have grown accustomed to following a URL that looks like http://bit.
ly/lhBa6k, even when the mapped URL may be http://evil.com/attack?
id=31337. If it is usually difficult for a user to determine whether a URL islegitimate or not just by looking at it, this is even harder in case of shortURLs. As a result, shortening services have been abused by miscreants formasquerading malicious target pages [68, 47, 25]. Large services such asTwitter, Facebook or YouTube have started running their own shorteningservice, upon which their social networks rely (e.g., t.co, fb.me, youtu.be).Unfortunately, when the hyperlinks of an entire social network rely upon
49
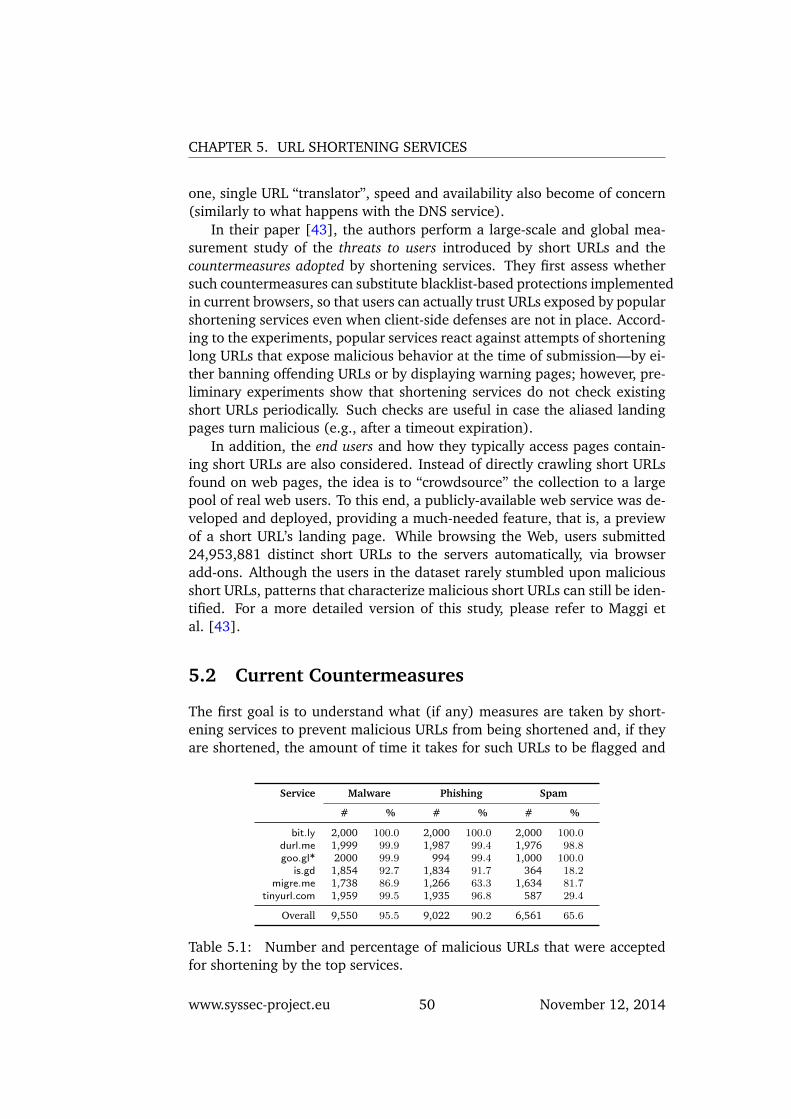
CHAPTER 5. URL SHORTENING SERVICES
one, single URL “translator”, speed and availability also become of concern(similarly to what happens with the DNS service).
In their paper [43], the authors perform a large-scale and global mea-surement study of the threats to users introduced by short URLs and thecountermeasures adopted by shortening services. They first assess whethersuch countermeasures can substitute blacklist-based protections implementedin current browsers, so that users can actually trust URLs exposed by popularshortening services even when client-side defenses are not in place. Accord-ing to the experiments, popular services react against attempts of shorteninglong URLs that expose malicious behavior at the time of submission—by ei-ther banning offending URLs or by displaying warning pages; however, pre-liminary experiments show that shortening services do not check existingshort URLs periodically. Such checks are useful in case the aliased landingpages turn malicious (e.g., after a timeout expiration).
In addition, the end users and how they typically access pages contain-ing short URLs are also considered. Instead of directly crawling short URLsfound on web pages, the idea is to “crowdsource” the collection to a largepool of real web users. To this end, a publicly-available web service was de-veloped and deployed, providing a much-needed feature, that is, a previewof a short URL’s landing page. While browsing the Web, users submitted24,953,881 distinct short URLs to the servers automatically, via browseradd-ons. Although the users in the dataset rarely stumbled upon maliciousshort URLs, patterns that characterize malicious short URLs can still be iden-tified. For a more detailed version of this study, please refer to Maggi etal. [43].
5.2 Current Countermeasures
The first goal is to understand what (if any) measures are taken by short-ening services to prevent malicious URLs from being shortened and, if theyare shortened, the amount of time it takes for such URLs to be flagged and
Service Malware Phishing Spam
# % # % # %
bit.ly 2,000 100.0 2,000 100.0 2,000 100.0durl.me 1,999 99.9 1,987 99.4 1,976 98.8goo.gl* 2000 99.9 994 99.4 1,000 100.0
is.gd 1,854 92.7 1,834 91.7 364 18.2migre.me 1,738 86.9 1,266 63.3 1,634 81.7
tinyurl.com 1,959 99.5 1,935 96.8 587 29.4
Overall 9,550 95.5 9,022 90.2 6,561 65.6
Table 5.1: Number and percentage of malicious URLs that were acceptedfor shortening by the top services.
www.syssec-project.eu 50 November 12, 2014
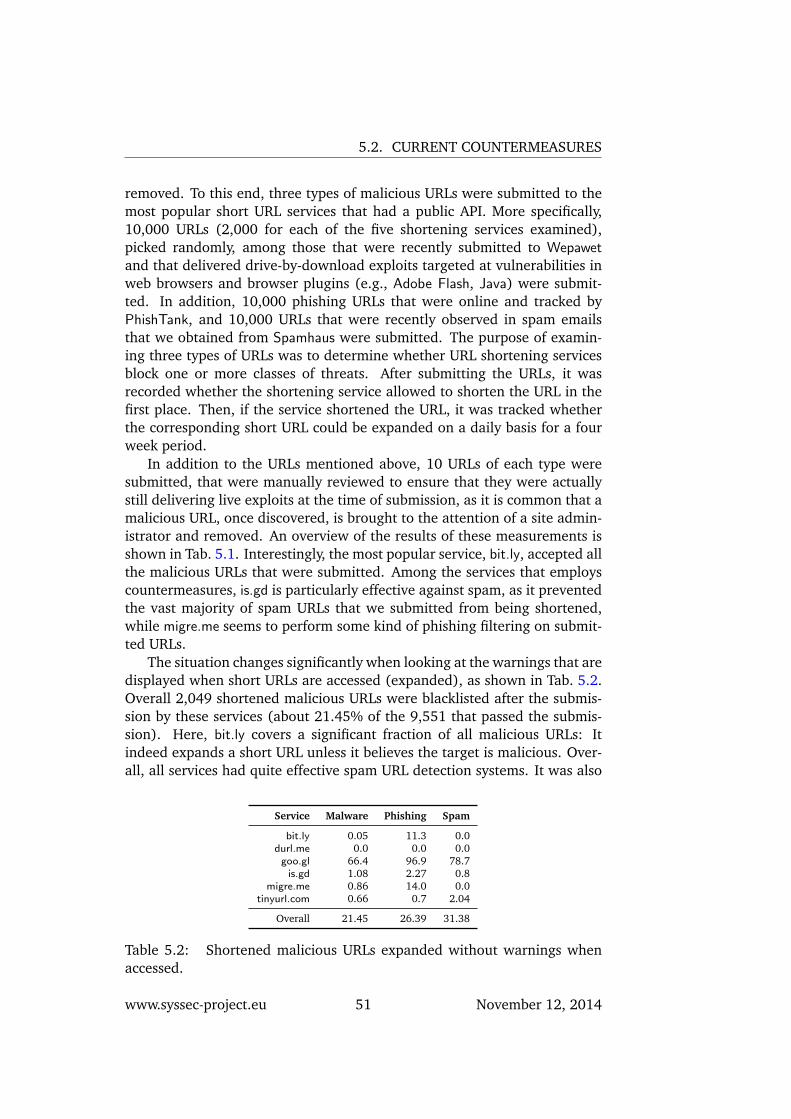
5.2. CURRENT COUNTERMEASURES
removed. To this end, three types of malicious URLs were submitted to themost popular short URL services that had a public API. More specifically,10,000 URLs (2,000 for each of the five shortening services examined),picked randomly, among those that were recently submitted to Wepawetand that delivered drive-by-download exploits targeted at vulnerabilities inweb browsers and browser plugins (e.g., Adobe Flash, Java) were submit-ted. In addition, 10,000 phishing URLs that were online and tracked byPhishTank, and 10,000 URLs that were recently observed in spam emailsthat we obtained from Spamhaus were submitted. The purpose of examin-ing three types of URLs was to determine whether URL shortening servicesblock one or more classes of threats. After submitting the URLs, it wasrecorded whether the shortening service allowed to shorten the URL in thefirst place. Then, if the service shortened the URL, it was tracked whetherthe corresponding short URL could be expanded on a daily basis for a fourweek period.
In addition to the URLs mentioned above, 10 URLs of each type weresubmitted, that were manually reviewed to ensure that they were actuallystill delivering live exploits at the time of submission, as it is common that amalicious URL, once discovered, is brought to the attention of a site admin-istrator and removed. An overview of the results of these measurements isshown in Tab. 5.1. Interestingly, the most popular service, bit.ly, accepted allthe malicious URLs that were submitted. Among the services that employscountermeasures, is.gd is particularly effective against spam, as it preventedthe vast majority of spam URLs that we submitted from being shortened,while migre.me seems to perform some kind of phishing filtering on submit-ted URLs.
The situation changes significantly when looking at the warnings that aredisplayed when short URLs are accessed (expanded), as shown in Tab. 5.2.Overall 2,049 shortened malicious URLs were blacklisted after the submis-sion by these services (about 21.45% of the 9,551 that passed the submis-sion). Here, bit.ly covers a significant fraction of all malicious URLs: Itindeed expands a short URL unless it believes the target is malicious. Over-all, all services had quite effective spam URL detection systems. It was also
Service Malware Phishing Spam
bit.ly 0.05 11.3 0.0durl.me 0.0 0.0 0.0goo.gl 66.4 96.9 78.7is.gd 1.08 2.27 0.8
migre.me 0.86 14.0 0.0tinyurl.com 0.66 0.7 2.04
Overall 21.45 26.39 31.38
Table 5.2: Shortened malicious URLs expanded without warnings whenaccessed.
www.syssec-project.eu 51 November 12, 2014
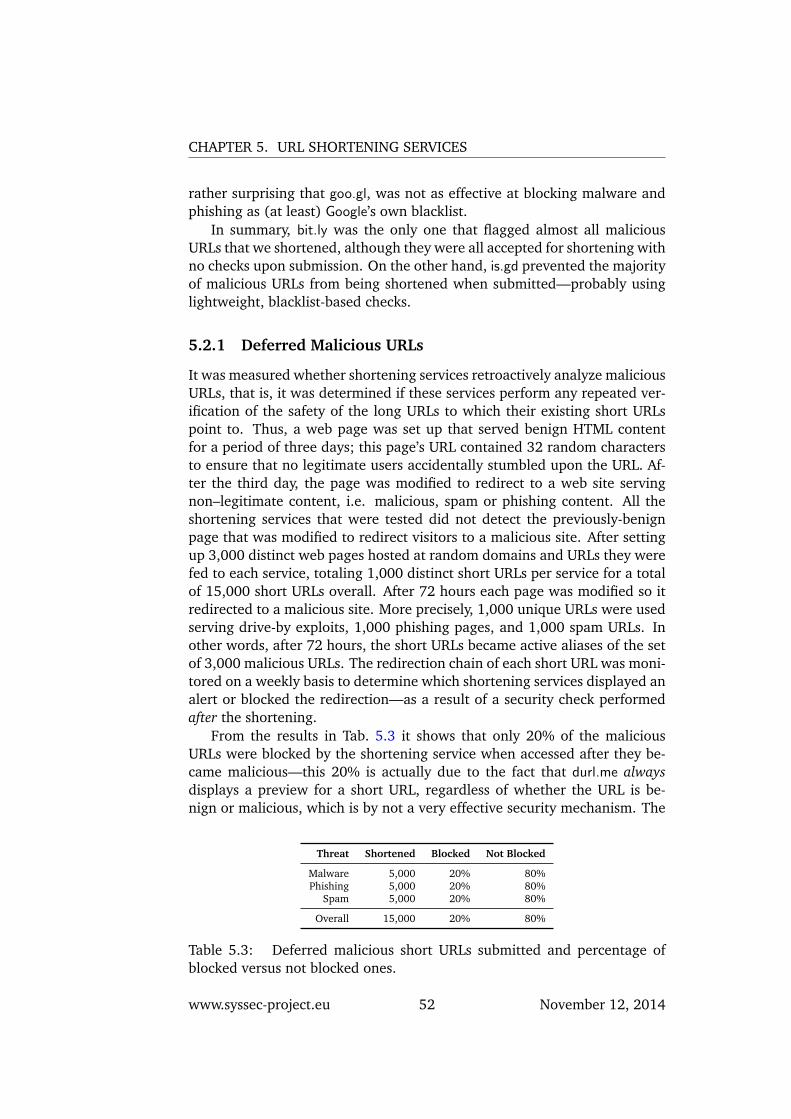
CHAPTER 5. URL SHORTENING SERVICES
rather surprising that goo.gl, was not as effective at blocking malware andphishing as (at least) Google’s own blacklist.
In summary, bit.ly was the only one that flagged almost all maliciousURLs that we shortened, although they were all accepted for shortening withno checks upon submission. On the other hand, is.gd prevented the majorityof malicious URLs from being shortened when submitted—probably usinglightweight, blacklist-based checks.
5.2.1 Deferred Malicious URLs
It was measured whether shortening services retroactively analyze maliciousURLs, that is, it was determined if these services perform any repeated ver-ification of the safety of the long URLs to which their existing short URLspoint to. Thus, a web page was set up that served benign HTML contentfor a period of three days; this page’s URL contained 32 random charactersto ensure that no legitimate users accidentally stumbled upon the URL. Af-ter the third day, the page was modified to redirect to a web site servingnon–legitimate content, i.e. malicious, spam or phishing content. All theshortening services that were tested did not detect the previously-benignpage that was modified to redirect visitors to a malicious site. After settingup 3,000 distinct web pages hosted at random domains and URLs they werefed to each service, totaling 1,000 distinct short URLs per service for a totalof 15,000 short URLs overall. After 72 hours each page was modified so itredirected to a malicious site. More precisely, 1,000 unique URLs were usedserving drive-by exploits, 1,000 phishing pages, and 1,000 spam URLs. Inother words, after 72 hours, the short URLs became active aliases of the setof 3,000 malicious URLs. The redirection chain of each short URL was moni-tored on a weekly basis to determine which shortening services displayed analert or blocked the redirection—as a result of a security check performedafter the shortening.
From the results in Tab. 5.3 it shows that only 20% of the maliciousURLs were blocked by the shortening service when accessed after they be-came malicious—this 20% is actually due to the fact that durl.me alwaysdisplays a preview for a short URL, regardless of whether the URL is be-nign or malicious, which is by not a very effective security mechanism. The
Threat Shortened Blocked Not Blocked
Malware 5,000 20% 80%Phishing 5,000 20% 80%
Spam 5,000 20% 80%
Overall 15,000 20% 80%
Table 5.3: Deferred malicious short URLs submitted and percentage ofblocked versus not blocked ones.
www.syssec-project.eu 52 November 12, 2014
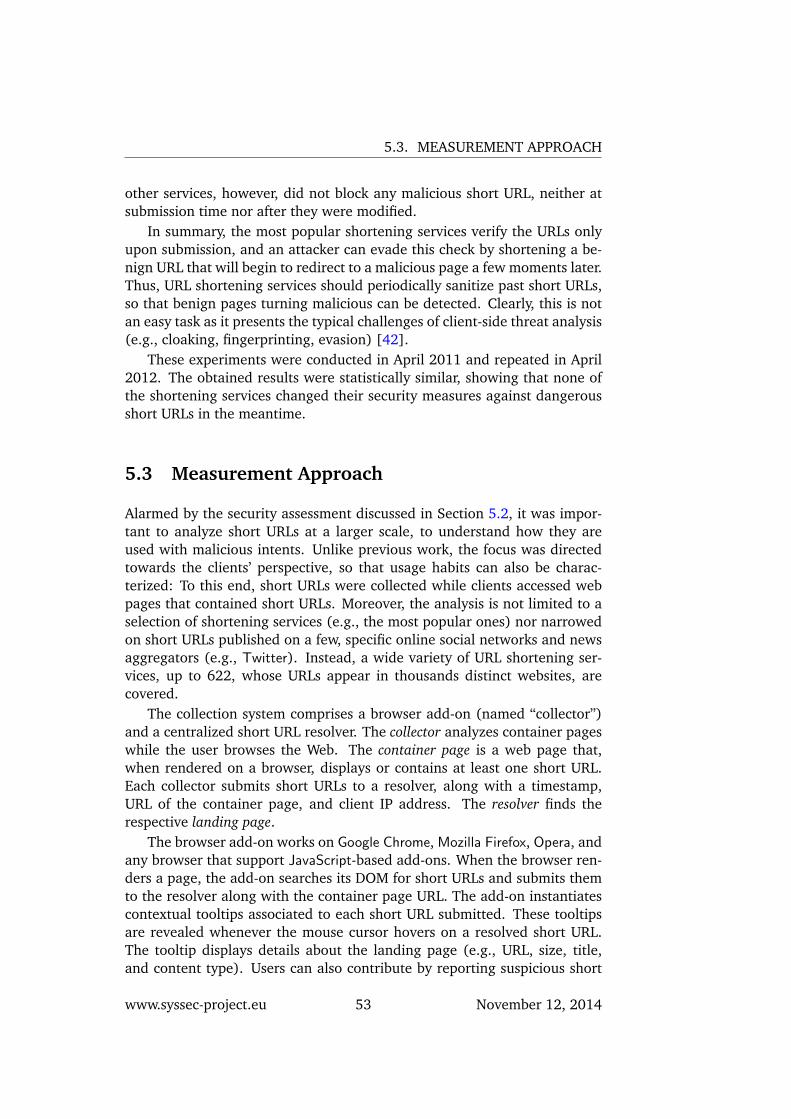
5.3. MEASUREMENT APPROACH
other services, however, did not block any malicious short URL, neither atsubmission time nor after they were modified.
In summary, the most popular shortening services verify the URLs onlyupon submission, and an attacker can evade this check by shortening a be-nign URL that will begin to redirect to a malicious page a few moments later.Thus, URL shortening services should periodically sanitize past short URLs,so that benign pages turning malicious can be detected. Clearly, this is notan easy task as it presents the typical challenges of client-side threat analysis(e.g., cloaking, fingerprinting, evasion) [42].
These experiments were conducted in April 2011 and repeated in April2012. The obtained results were statistically similar, showing that none ofthe shortening services changed their security measures against dangerousshort URLs in the meantime.
5.3 Measurement Approach
Alarmed by the security assessment discussed in Section 5.2, it was impor-tant to analyze short URLs at a larger scale, to understand how they areused with malicious intents. Unlike previous work, the focus was directedtowards the clients’ perspective, so that usage habits can also be charac-terized: To this end, short URLs were collected while clients accessed webpages that contained short URLs. Moreover, the analysis is not limited to aselection of shortening services (e.g., the most popular ones) nor narrowedon short URLs published on a few, specific online social networks and newsaggregators (e.g., Twitter). Instead, a wide variety of URL shortening ser-vices, up to 622, whose URLs appear in thousands distinct websites, arecovered.
The collection system comprises a browser add-on (named “collector”)and a centralized short URL resolver. The collector analyzes container pageswhile the user browses the Web. The container page is a web page that,when rendered on a browser, displays or contains at least one short URL.Each collector submits short URLs to a resolver, along with a timestamp,URL of the container page, and client IP address. The resolver finds therespective landing page.
The browser add-on works on Google Chrome, Mozilla Firefox, Opera, andany browser that support JavaScript-based add-ons. When the browser ren-ders a page, the add-on searches its DOM for short URLs and submits themto the resolver along with the container page URL. The add-on instantiatescontextual tooltips associated to each short URL submitted. These tooltipsare revealed whenever the mouse cursor hovers on a resolved short URL.The tooltip displays details about the landing page (e.g., URL, size, title,and content type). Users can also contribute by reporting suspicious short
www.syssec-project.eu 53 November 12, 2014
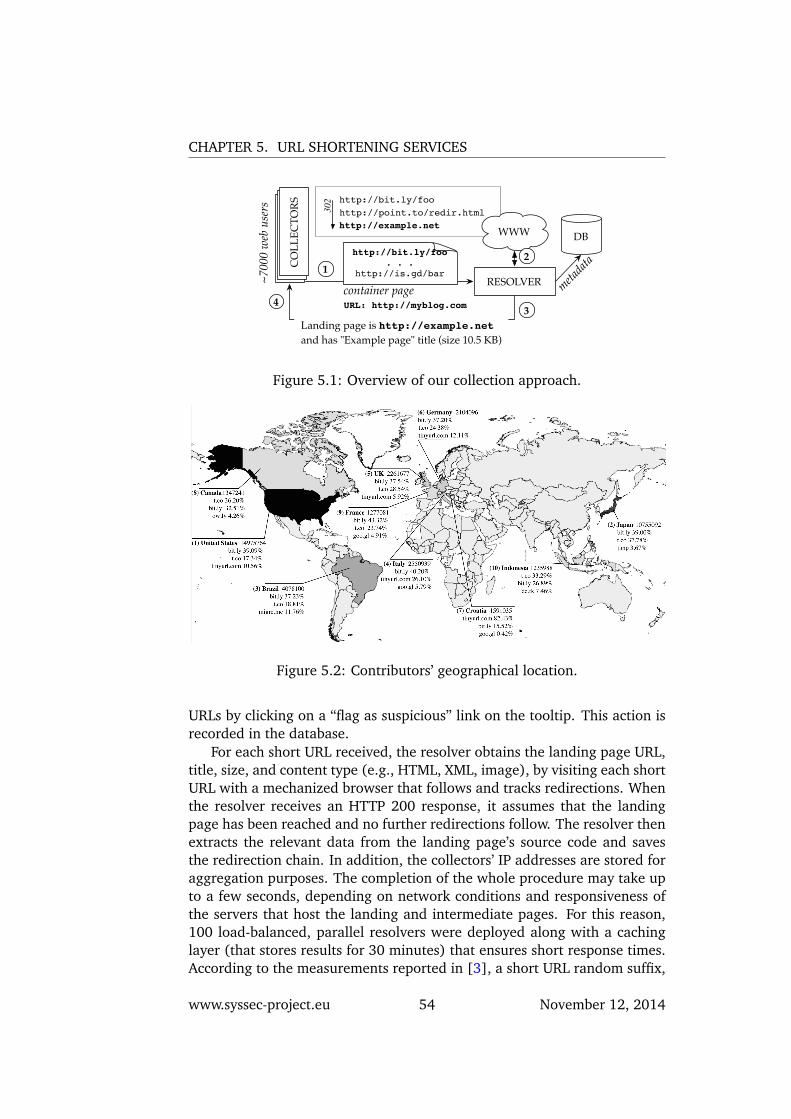
CHAPTER 5. URL SHORTENING SERVICES
Landing page is http://example.netand has "Example page" title (size 10.5 KB)
container pageRESOLVER
DBWWW
metadat
a
CO
LLEC
TORS
CO
LLEC
TORS
CO
LLEC
TORS
URL: http://myblog.com
~700
0 w
eb u
sers
http://bit.ly/foo. . .
http://is.gd/bar12
34
http://point.to/redir.htmlhttp://example.net
http://bit.ly/foo
302
Figure 5.1: Overview of our collection approach.
Figure 5.2: Contributors’ geographical location.
URLs by clicking on a “flag as suspicious” link on the tooltip. This action isrecorded in the database.
For each short URL received, the resolver obtains the landing page URL,title, size, and content type (e.g., HTML, XML, image), by visiting each shortURL with a mechanized browser that follows and tracks redirections. Whenthe resolver receives an HTTP 200 response, it assumes that the landingpage has been reached and no further redirections follow. The resolver thenextracts the relevant data from the landing page’s source code and savesthe redirection chain. In addition, the collectors’ IP addresses are stored foraggregation purposes. The completion of the whole procedure may take upto a few seconds, depending on network conditions and responsiveness ofthe servers that host the landing and intermediate pages. For this reason,100 load-balanced, parallel resolvers were deployed along with a cachinglayer (that stores results for 30 minutes) that ensures short response times.According to the measurements reported in [3], a short URL random suffix,
www.syssec-project.eu 54 November 12, 2014
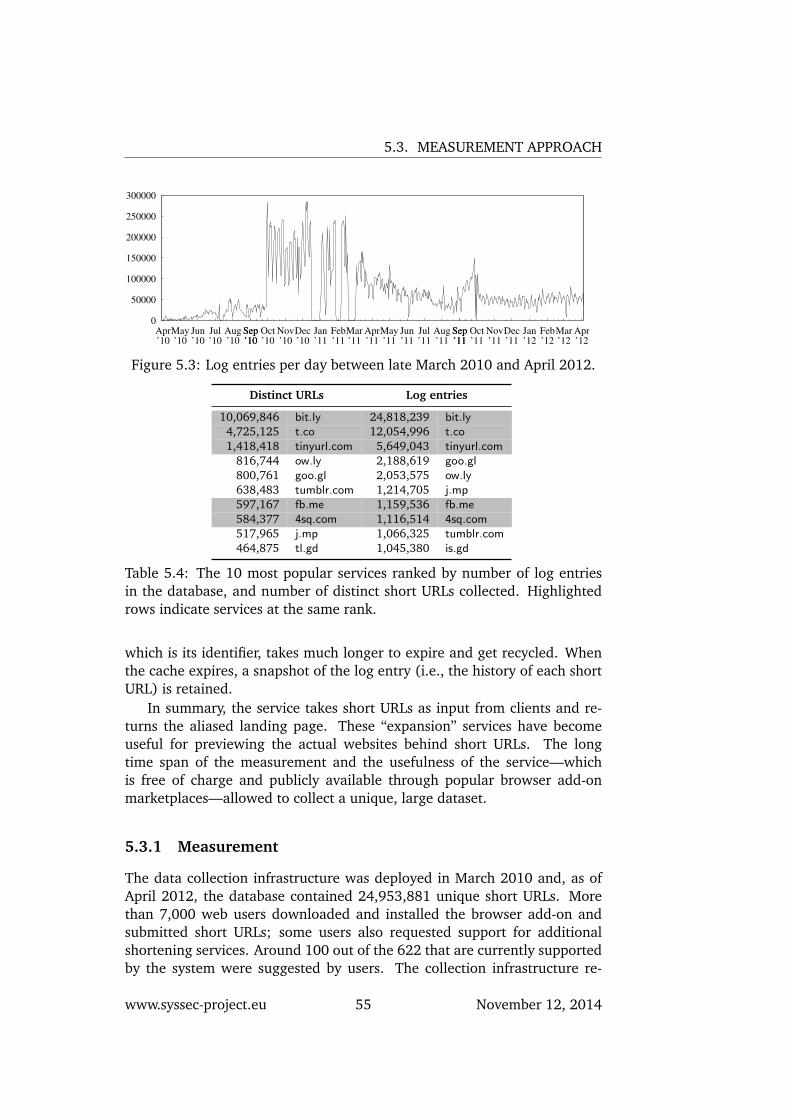
5.3. MEASUREMENT APPROACH
0
50000
100000
150000
200000
250000
300000
Apr’10
May’10
Jun’10
Jul’10
Aug’10
Sep’10Sep’10
Oct’10
Nov’10
Dec’10
Jan’11
Feb’11
Mar’11
Apr’11
May’11
Jun’11
Jul’11
Aug’11
Sep’11Sep’11
Oct’11
Nov’11
Dec’11
Jan’12
Feb’12
Mar’12
Apr’12
Figure 5.3: Log entries per day between late March 2010 and April 2012.
Distinct URLs Log entries
10,069,846 bit.ly 24,818,239 bit.ly4,725,125 t.co 12,054,996 t.co1,418,418 tinyurl.com 5,649,043 tinyurl.com
816,744 ow.ly 2,188,619 goo.gl800,761 goo.gl 2,053,575 ow.ly638,483 tumblr.com 1,214,705 j.mp597,167 fb.me 1,159,536 fb.me584,377 4sq.com 1,116,514 4sq.com517,965 j.mp 1,066,325 tumblr.com464,875 tl.gd 1,045,380 is.gd
Table 5.4: The 10 most popular services ranked by number of log entriesin the database, and number of distinct short URLs collected. Highlightedrows indicate services at the same rank.
which is its identifier, takes much longer to expire and get recycled. Whenthe cache expires, a snapshot of the log entry (i.e., the history of each shortURL) is retained.
In summary, the service takes short URLs as input from clients and re-turns the aliased landing page. These “expansion” services have becomeuseful for previewing the actual websites behind short URLs. The longtime span of the measurement and the usefulness of the service—whichis free of charge and publicly available through popular browser add-onmarketplaces—allowed to collect a unique, large dataset.
5.3.1 Measurement
The data collection infrastructure was deployed in March 2010 and, as ofApril 2012, the database contained 24,953,881 unique short URLs. Morethan 7,000 web users downloaded and installed the browser add-on andsubmitted short URLs; some users also requested support for additionalshortening services. Around 100 out of the 622 that are currently supportedby the system were suggested by users. The collection infrastructure re-
www.syssec-project.eu 55 November 12, 2014
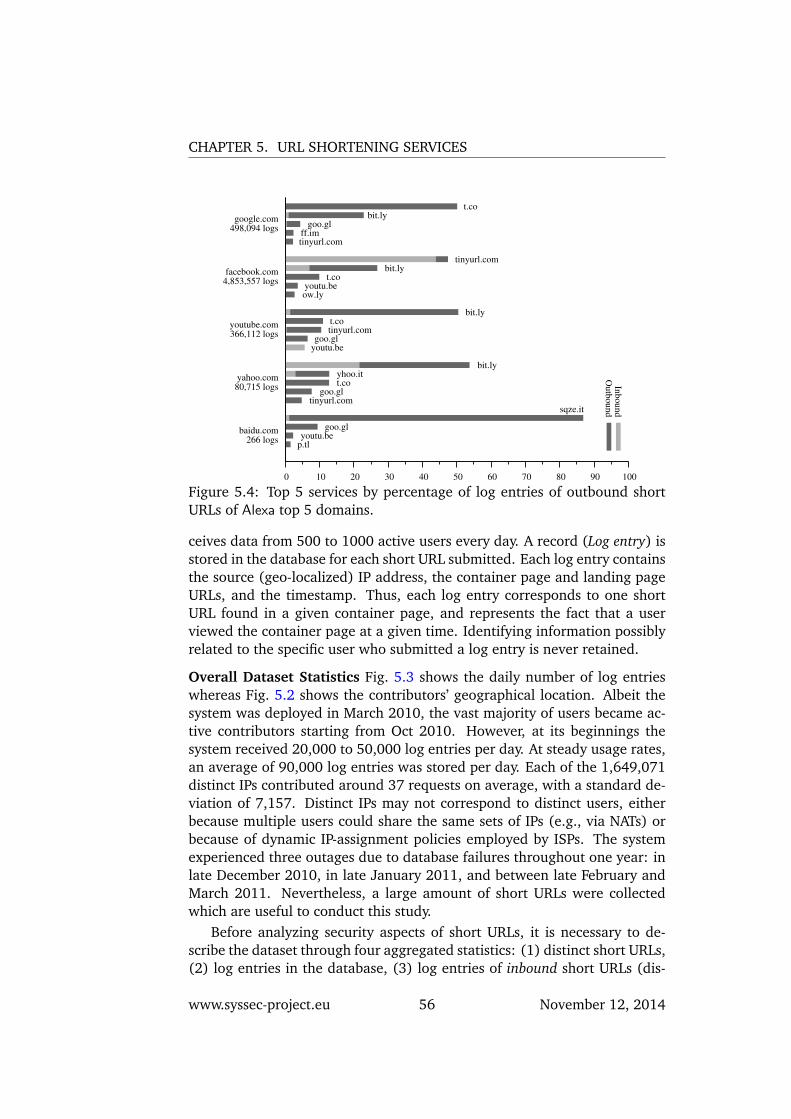
CHAPTER 5. URL SHORTENING SERVICES
0 10 20 30 40 50 60 70 80 90 100
Inbound
Outb
ound
google.com498,094 logs
facebook.com4,853,557 logs
youtube.com366,112 logs
yahoo.com80,715 logs
baidu.com266 logs
t.cobit.ly
goo.glff.imtinyurl.com
tinyurl.combit.ly
t.coyoutu.beow.ly
bit.lyt.cotinyurl.com
goo.glyoutu.be
bit.lyyhoo.itt.co
goo.gltinyurl.com
sqze.it
goo.glyoutu.be
p.tl
Figure 5.4: Top 5 services by percentage of log entries of outbound shortURLs of Alexa top 5 domains.
ceives data from 500 to 1000 active users every day. A record (Log entry) isstored in the database for each short URL submitted. Each log entry containsthe source (geo-localized) IP address, the container page and landing pageURLs, and the timestamp. Thus, each log entry corresponds to one shortURL found in a given container page, and represents the fact that a userviewed the container page at a given time. Identifying information possiblyrelated to the specific user who submitted a log entry is never retained.
Overall Dataset Statistics Fig. 5.3 shows the daily number of log entrieswhereas Fig. 5.2 shows the contributors’ geographical location. Albeit thesystem was deployed in March 2010, the vast majority of users became ac-tive contributors starting from Oct 2010. However, at its beginnings thesystem received 20,000 to 50,000 log entries per day. At steady usage rates,an average of 90,000 log entries was stored per day. Each of the 1,649,071distinct IPs contributed around 37 requests on average, with a standard de-viation of 7,157. Distinct IPs may not correspond to distinct users, eitherbecause multiple users could share the same sets of IPs (e.g., via NATs) orbecause of dynamic IP-assignment policies employed by ISPs. The systemexperienced three outages due to database failures throughout one year: inlate December 2010, in late January 2011, and between late February andMarch 2011. Nevertheless, a large amount of short URLs were collectedwhich are useful to conduct this study.
Before analyzing security aspects of short URLs, it is necessary to de-scribe the dataset through four aggregated statistics: (1) distinct short URLs,(2) log entries in the database, (3) log entries of inbound short URLs (dis-
www.syssec-project.eu 56 November 12, 2014
5.4. RESULTS
tinct short URLs pointing to the sites’ pages), and (4) outbound short URLs(short URLs that are found in their container pages and that point to bothexternal and internal pages). Shortening services with many distinct shortURLs are more popular (i.e., they have become the “shortener of choice” forseveral users), whereas those characterized by many log entries have theirshort URLs posted on many popular container pages. As shown in Tab. 5.3the top most popular services in the dataset are bit.ly, t.co and tinyurl.com,respectively. As expected, popular shortening services hold a steadily largenumber of short URLs, whereas site-specific shortening services exhibit abehavior that is typical of content shared through social networks. Fig. 5.4shows the ranking of the top websites with respect to inbound and outboundshort URLs.
5.4 Results
The objective is to assess if malicious short URLs have distinctive features(§5.4.1) and typical usage patterns (§5.4.2) that criminals may leverage totarget their campaigns.
5.4.1 Malicious Short URLs
First, it is necessary to understand how frequently the users in the databaseencounter malicious short URLs in a page. For this, four datasets are lever-aged: the Spamhaus DBL, a list of DNS domains that are known to hostspam pages, Wepawet, a service able to detect drive-by-download exploitpages, Google Safe Browsing, a list of domains known for hosting malwareor phishing sites, and PhishTank, a blacklist of URLs that are involved inphishing operations. For Spamhaus, the domain was checked against thedatabase. For the other three blacklists, the full URL was checked. Land-ing URLs are categorized into three classes: spam, phishing, and malware,according to the dataset they were flagged in: URLs detected by Wepawetare flagged as malware, domains found in Spamhaus are marked as spam,and URLs from PhishTank as phishing. Google Safe Browsing classifies bothphishing and malware sites. Tab. 5.4.1 summarizes the breakdown of mali-cious short URLs.
In total, 44,932 unique short URLs were observed, pointing to 19,216malicious landing pages. By looking at the referrer, these URLs were hostedon 1,213 different domains. A more detailed analysis on the container pagesof malicious URLs is provided in the next section. In total, the maliciousURLs in the dataset have been rendered by 1,747 users in their containerpages via the browser add-ons: 378 users (about 21.6%) were located inSouth Korea, 282 (about 16.1%) in the United States, and 98 (about 5.6%)in Germany.
www.syssec-project.eu 57 November 12, 2014
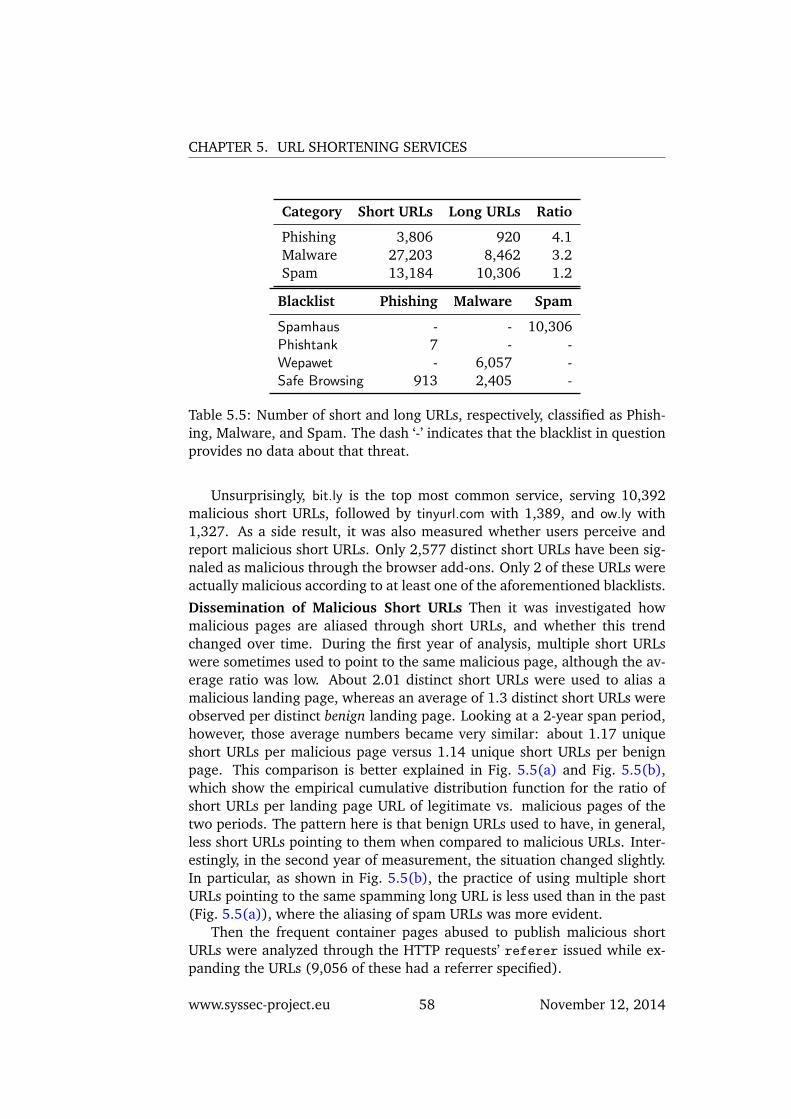
CHAPTER 5. URL SHORTENING SERVICES
Category Short URLs Long URLs Ratio
Phishing 3,806 920 4.1Malware 27,203 8,462 3.2Spam 13,184 10,306 1.2
Blacklist Phishing Malware Spam
Spamhaus - - 10,306Phishtank 7 - -Wepawet - 6,057 -Safe Browsing 913 2,405 -
Table 5.5: Number of short and long URLs, respectively, classified as Phish-ing, Malware, and Spam. The dash ‘-’ indicates that the blacklist in questionprovides no data about that threat.
Unsurprisingly, bit.ly is the top most common service, serving 10,392malicious short URLs, followed by tinyurl.com with 1,389, and ow.ly with1,327. As a side result, it was also measured whether users perceive andreport malicious short URLs. Only 2,577 distinct short URLs have been sig-naled as malicious through the browser add-ons. Only 2 of these URLs wereactually malicious according to at least one of the aforementioned blacklists.
Dissemination of Malicious Short URLs Then it was investigated howmalicious pages are aliased through short URLs, and whether this trendchanged over time. During the first year of analysis, multiple short URLswere sometimes used to point to the same malicious page, although the av-erage ratio was low. About 2.01 distinct short URLs were used to alias amalicious landing page, whereas an average of 1.3 distinct short URLs wereobserved per distinct benign landing page. Looking at a 2-year span period,however, those average numbers became very similar: about 1.17 uniqueshort URLs per malicious page versus 1.14 unique short URLs per benignpage. This comparison is better explained in Fig. 5.5(a) and Fig. 5.5(b),which show the empirical cumulative distribution function for the ratio ofshort URLs per landing page URL of legitimate vs. malicious pages of thetwo periods. The pattern here is that benign URLs used to have, in general,less short URLs pointing to them when compared to malicious URLs. Inter-estingly, in the second year of measurement, the situation changed slightly.In particular, as shown in Fig. 5.5(b), the practice of using multiple shortURLs pointing to the same spamming long URL is less used than in the past(Fig. 5.5(a)), where the aliasing of spam URLs was more evident.
Then the frequent container pages abused to publish malicious shortURLs were analyzed through the HTTP requests’ referer issued while ex-panding the URLs (9,056 of these had a referrer specified).
www.syssec-project.eu 58 November 12, 2014
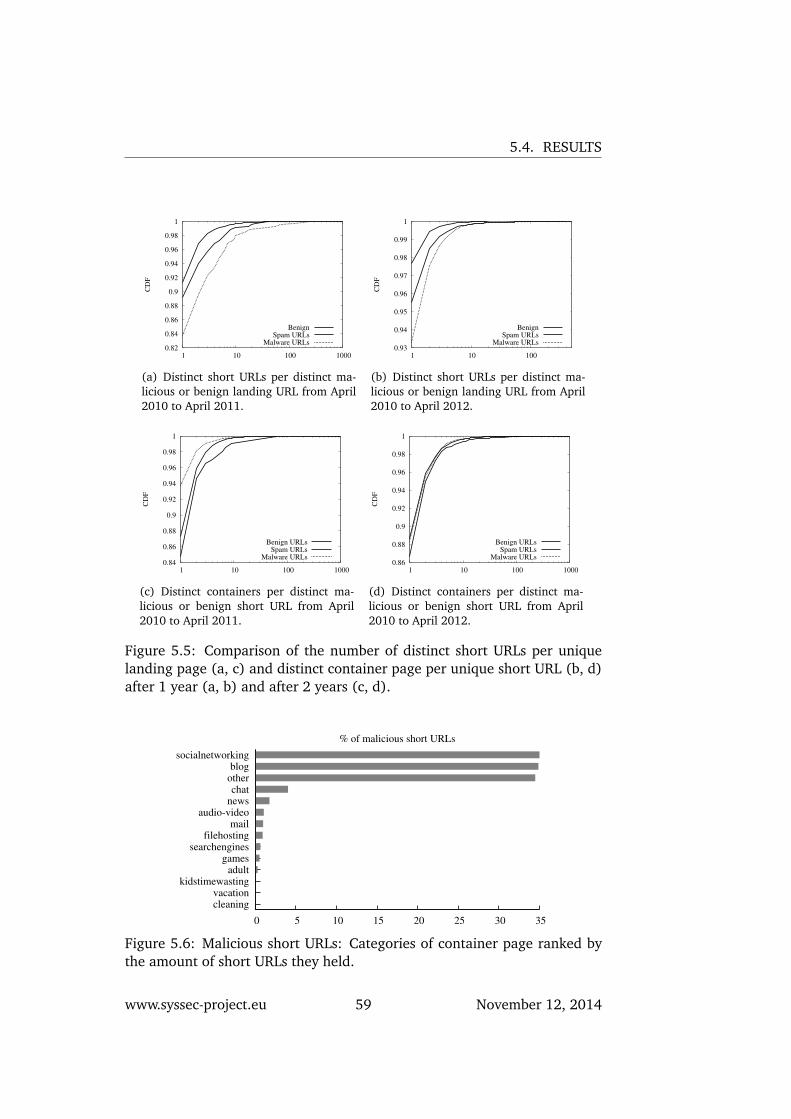
5.4. RESULTS
0.82
0.84
0.86
0.88
0.9
0.92
0.94
0.96
0.98
1
1 10 100 1000
CD
F
BenignSpam URLs
Malware URLs
(a) Distinct short URLs per distinct ma-licious or benign landing URL from April2010 to April 2011.
0.93
0.94
0.95
0.96
0.97
0.98
0.99
1
1 10 100
CD
F
BenignSpam URLs
Malware URLs
(b) Distinct short URLs per distinct ma-licious or benign landing URL from April2010 to April 2012.
0.84
0.86
0.88
0.9
0.92
0.94
0.96
0.98
1
1 10 100 1000
CD
F
Benign URLsSpam URLs
Malware URLs
(c) Distinct containers per distinct ma-licious or benign short URL from April2010 to April 2011.
0.86
0.88
0.9
0.92
0.94
0.96
0.98
1
1 10 100 1000
CD
F
Benign URLsSpam URLs
Malware URLs
(d) Distinct containers per distinct ma-licious or benign short URL from April2010 to April 2012.
Figure 5.5: Comparison of the number of distinct short URLs per uniquelanding page (a, c) and distinct container page per unique short URL (b, d)after 1 year (a, b) and after 2 years (c, d).
socialnetworkingblog
otherchat
newsaudio-video
mailfilehosting
searchenginesgames
adultkidstimewasting
vacationcleaning
0 5 10 15 20 25 30 35
% of malicious short URLs
Figure 5.6: Malicious short URLs: Categories of container page ranked bythe amount of short URLs they held.
www.syssec-project.eu 59 November 12, 2014
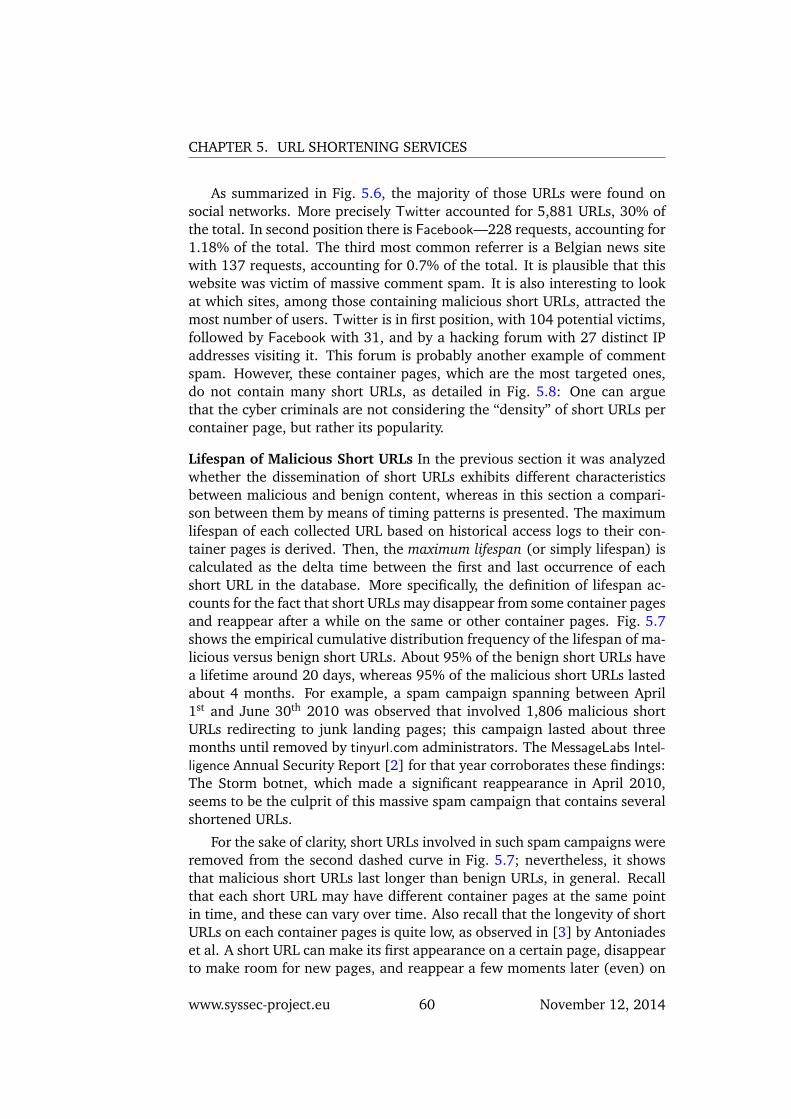
CHAPTER 5. URL SHORTENING SERVICES
As summarized in Fig. 5.6, the majority of those URLs were found onsocial networks. More precisely Twitter accounted for 5,881 URLs, 30% ofthe total. In second position there is Facebook—228 requests, accounting for1.18% of the total. The third most common referrer is a Belgian news sitewith 137 requests, accounting for 0.7% of the total. It is plausible that thiswebsite was victim of massive comment spam. It is also interesting to lookat which sites, among those containing malicious short URLs, attracted themost number of users. Twitter is in first position, with 104 potential victims,followed by Facebook with 31, and by a hacking forum with 27 distinct IPaddresses visiting it. This forum is probably another example of commentspam. However, these container pages, which are the most targeted ones,do not contain many short URLs, as detailed in Fig. 5.8: One can arguethat the cyber criminals are not considering the “density” of short URLs percontainer page, but rather its popularity.
Lifespan of Malicious Short URLs In the previous section it was analyzedwhether the dissemination of short URLs exhibits different characteristicsbetween malicious and benign content, whereas in this section a compari-son between them by means of timing patterns is presented. The maximumlifespan of each collected URL based on historical access logs to their con-tainer pages is derived. Then, the maximum lifespan (or simply lifespan) iscalculated as the delta time between the first and last occurrence of eachshort URL in the database. More specifically, the definition of lifespan ac-counts for the fact that short URLs may disappear from some container pagesand reappear after a while on the same or other container pages. Fig. 5.7shows the empirical cumulative distribution frequency of the lifespan of ma-licious versus benign short URLs. About 95% of the benign short URLs havea lifetime around 20 days, whereas 95% of the malicious short URLs lastedabout 4 months. For example, a spam campaign spanning between April1st and June 30th 2010 was observed that involved 1,806 malicious shortURLs redirecting to junk landing pages; this campaign lasted about threemonths until removed by tinyurl.com administrators. The MessageLabs Intel-ligence Annual Security Report [2] for that year corroborates these findings:The Storm botnet, which made a significant reappearance in April 2010,seems to be the culprit of this massive spam campaign that contains severalshortened URLs.
For the sake of clarity, short URLs involved in such spam campaigns wereremoved from the second dashed curve in Fig. 5.7; nevertheless, it showsthat malicious short URLs last longer than benign URLs, in general. Recallthat each short URL may have different container pages at the same pointin time, and these can vary over time. Also recall that the longevity of shortURLs on each container pages is quite low, as observed in [3] by Antoniadeset al. A short URL can make its first appearance on a certain page, disappearto make room for new pages, and reappear a few moments later (even) on
www.syssec-project.eu 60 November 12, 2014
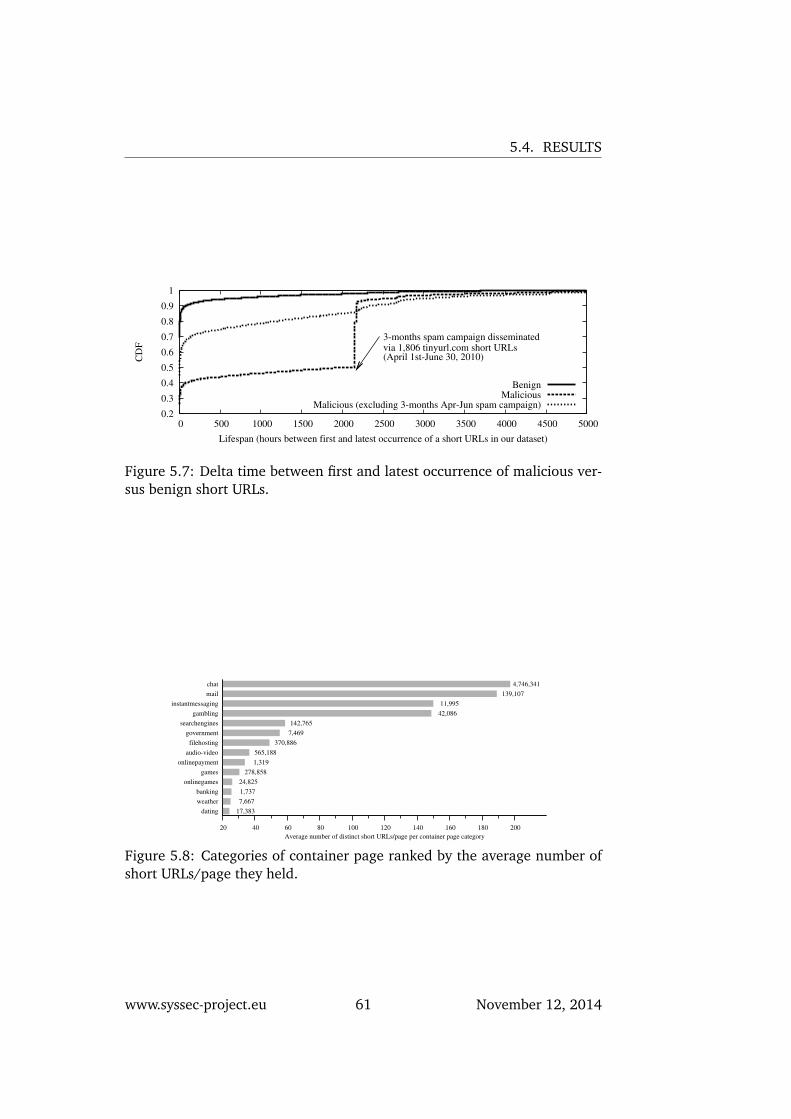
5.4. RESULTS
0.2
0.3
0.4
0.5
0.6
0.7
0.8
0.9
1
0 500 1000 1500 2000 2500 3000 3500 4000 4500 5000
CD
F
Lifespan (hours between first and latest occurrence of a short URLs in our dataset)
3-months spam campaign disseminatedvia 1,806 tinyurl.com short URLs(April 1st-June 30, 2010)
BenignMalicious
Malicious (excluding 3-months Apr-Jun spam campaign)
Figure 5.7: Delta time between first and latest occurrence of malicious ver-sus benign short URLs.
chat
instantmessaging
gambling
searchengines
government
filehosting
audio-video
onlinepayment
games
onlinegames
banking
weather
dating
20 40 60 80 100 120 140 160 180 200
Average number of distinct short URLs/page per container page category
4,746,341
139,107
11,995
42,086
142,765
7,469
370,886
565,188
1,319
278,858
24,825
1,737
7,667
17,383
Figure 5.8: Categories of container page ranked by the average number ofshort URLs/page they held.
www.syssec-project.eu 61 November 12, 2014
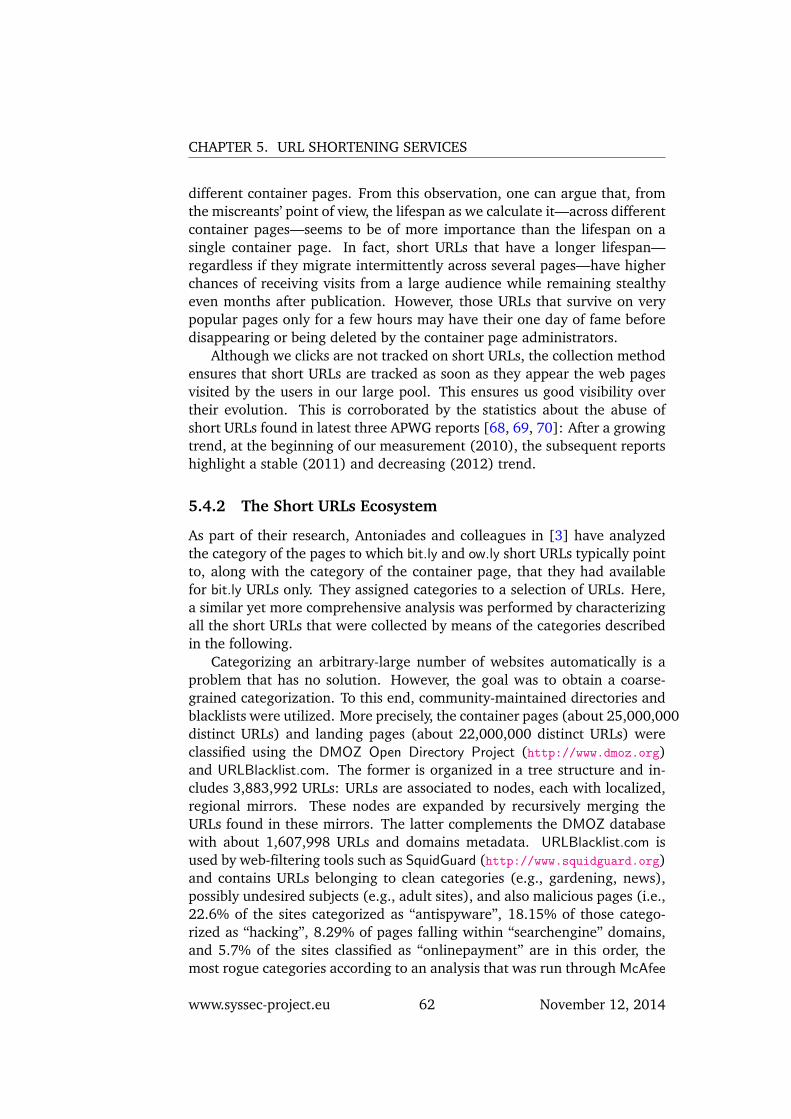
CHAPTER 5. URL SHORTENING SERVICES
different container pages. From this observation, one can argue that, fromthe miscreants’ point of view, the lifespan as we calculate it—across differentcontainer pages—seems to be of more importance than the lifespan on asingle container page. In fact, short URLs that have a longer lifespan—regardless if they migrate intermittently across several pages—have higherchances of receiving visits from a large audience while remaining stealthyeven months after publication. However, those URLs that survive on verypopular pages only for a few hours may have their one day of fame beforedisappearing or being deleted by the container page administrators.
Although we clicks are not tracked on short URLs, the collection methodensures that short URLs are tracked as soon as they appear the web pagesvisited by the users in our large pool. This ensures us good visibility overtheir evolution. This is corroborated by the statistics about the abuse ofshort URLs found in latest three APWG reports [68, 69, 70]: After a growingtrend, at the beginning of our measurement (2010), the subsequent reportshighlight a stable (2011) and decreasing (2012) trend.
5.4.2 The Short URLs Ecosystem
As part of their research, Antoniades and colleagues in [3] have analyzedthe category of the pages to which bit.ly and ow.ly short URLs typically pointto, along with the category of the container page, that they had availablefor bit.ly URLs only. They assigned categories to a selection of URLs. Here,a similar yet more comprehensive analysis was performed by characterizingall the short URLs that were collected by means of the categories describedin the following.
Categorizing an arbitrary-large number of websites automatically is aproblem that has no solution. However, the goal was to obtain a coarse-grained categorization. To this end, community-maintained directories andblacklists were utilized. More precisely, the container pages (about 25,000,000distinct URLs) and landing pages (about 22,000,000 distinct URLs) wereclassified using the DMOZ Open Directory Project (http://www.dmoz.org)and URLBlacklist.com. The former is organized in a tree structure and in-cludes 3,883,992 URLs: URLs are associated to nodes, each with localized,regional mirrors. These nodes are expanded by recursively merging theURLs found in these mirrors. The latter complements the DMOZ databasewith about 1,607,998 URLs and domains metadata. URLBlacklist.com isused by web-filtering tools such as SquidGuard (http://www.squidguard.org)and contains URLs belonging to clean categories (e.g., gardening, news),possibly undesired subjects (e.g., adult sites), and also malicious pages (i.e.,22.6% of the sites categorized as “antispyware”, 18.15% of those catego-rized as “hacking”, 8.29% of pages falling within “searchengine” domains,and 5.7% of the sites classified as “onlinepayment” are in this order, themost rogue categories according to an analysis that was run through McAfee
www.syssec-project.eu 62 November 12, 2014
5.4. RESULTS
SiteAdvisor 1). Overall, it resulted in 74 categories. For clearer visualization,the 48 most frequent categories were selected. These include, for example,“socialnetworking,” “adult,” “abortion,” “contraception,” “chat,” etc. Theword “other” was reserved for URLs belonging to the less meaningful cate-gories that we removed, or for URLs that remained unclassified. Note thateach URL can belong to multiple categories.
Frequent and Infrequent Categories Tab. 5.4.2 details the most and leastfrequent categories of the landing pages pointed to by short URLs of thetop services.It shows that the five most popular services are used to referto various categories including news, audio-video content, blog, and onlinesocial networks. However, the majority of short URLs collected come fromuser-authored content (e.g., online social networks, blog posts), mainly be-cause these sites are very popular (e.g., Facebook). A different viewpoint isprovided by plotting the number of short URLs per page (Fig. 5.8).
Short URLs are seldom used as aliases of reference, science, and health-related pages. A possible explanation could be that users may have some-how perceived that, as short URLs shall expire sooner or later, they arenot reliable for spreading really important content (e.g., health). Secondly,and more importantly, users post short URLs in email and chat messages,weather sites, search-engine pages (including all *.google.com pages), do-it-yourself sites, and news pages. In summary, the majority of short URLspoint to content that expires quickly. Therefore, from a security viewpoint,real-time countermeasures against malicious short URLs such as WARN-INGBIRD [39] are of paramount importance and much more effective thanblacklists. As detailed in Fig. 5.6, however, the categories that were mosttargeted by malicious short URLs in 2010–2012 are social networks andblogs.
Content-category Change To understand how web pages are interconnectedthrough short URLs, it was analyzed whether clicking on a short URL bringsthe user to a landing page of a category that differs from the category of thecontainer page (e.g., from a news website to a file-hosting website).
In Fig. 5.9, the top 50 shortening services are ranked by the median fre-quency of category change (plotted as a dot). More precisely, for each ser-vice and for each category, the fraction of short URLs that result in a “changeof content category” were calculated—such fraction is then normalized bythe total number of unique short URLs. Then, the 25- and 75-percent quan-tiles were derived to define a confidence interval around the median; thisis useful to visually highlight how frequencies are distributed. Values closeto 100% are not plotted for the sake of clarity. Services with 0–30% changefrequency typically deal with a small set of categories and have short URLsoften posted on websites of similar subjects. For example, flic.kr is usedexclusively within the Flickr ecosystem; therefore, it covers very few cat-
1http://siteadvisor.com/sites/
www.syssec-project.eu 63 November 12, 2014
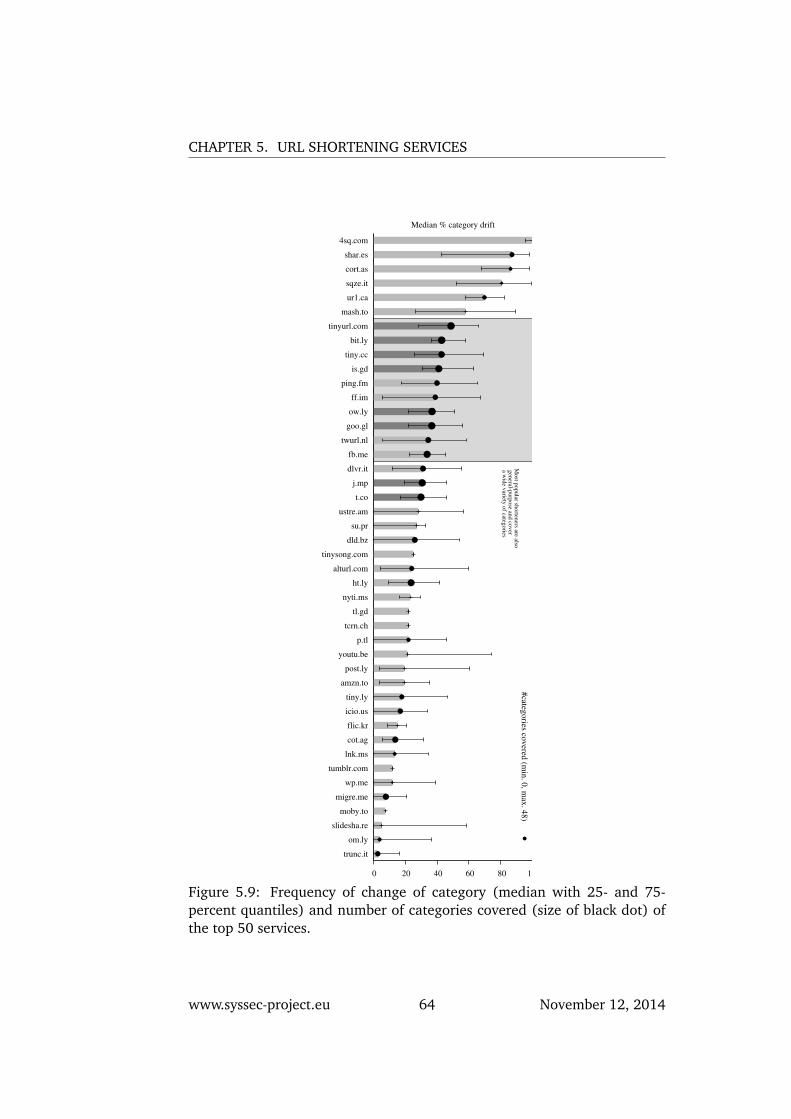
CHAPTER 5. URL SHORTENING SERVICES
trunc.it
om.ly
slidesha.re
moby.to
migre.me
wp.me
tumblr.com
lnk.ms
cot.ag
flic.kr
icio.us
tiny.ly
amzn.to
post.ly
youtu.be
p.tl
tcrn.ch
tl.gd
nyti.ms
ht.ly
alturl.com
tinysong.com
dld.bz
su.pr
ustre.am
t.co
j.mp
dlvr.it
fb.me
twurl.nl
goo.gl
ow.ly
ff.im
ping.fm
is.gd
tiny.cc
bit.ly
tinyurl.com
mash.to
ur1.ca
sqze.it
cort.as
shar.es
4sq.com
0 20 40 60 80 100
Median % category drift
Most p
opular sh
orten
ers are also g
eneral-p
urp
ose an
d co
ver
a wid
e variety
of categ
ories
#categ
ories co
vered
(min
. 0, m
ax. 4
8)
Figure 5.9: Frequency of change of category (median with 25- and 75-percent quantiles) and number of categories covered (size of black dot) ofthe top 50 services.
www.syssec-project.eu 64 November 12, 2014
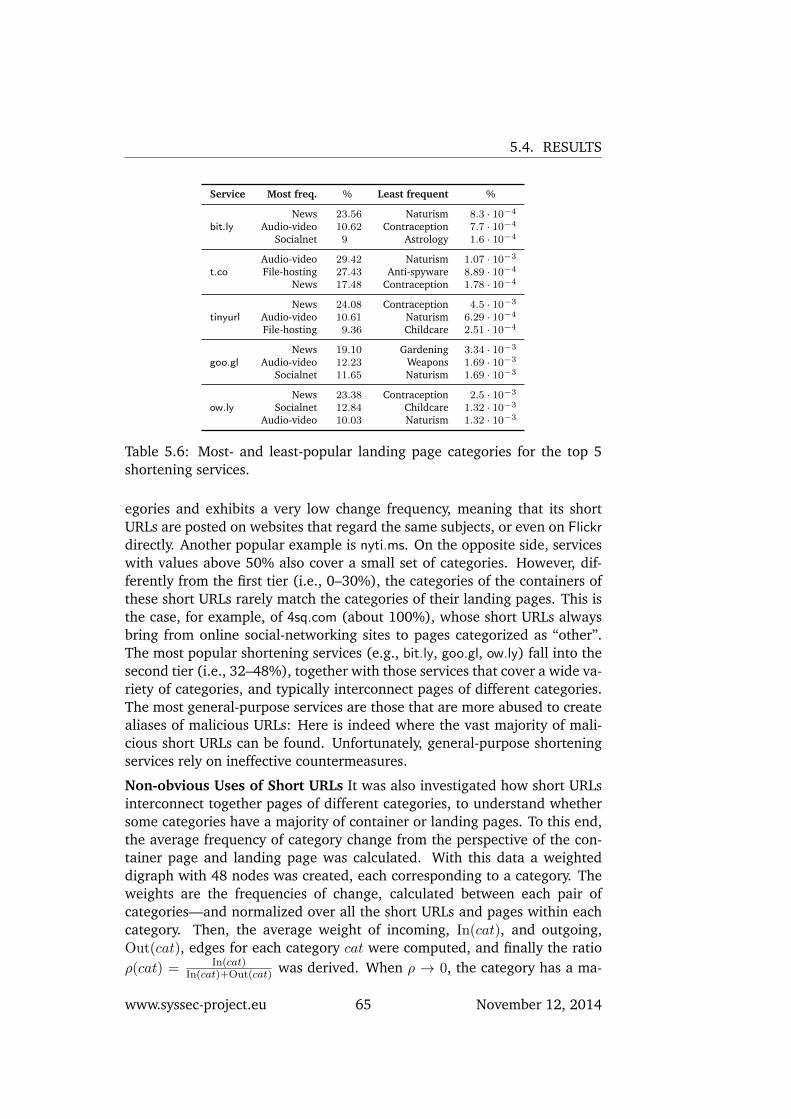
5.4. RESULTS
Service Most freq. % Least frequent %
bit.lyNews 23.56 Naturism 8.3 · 10−4
Audio-video 10.62 Contraception 7.7 · 10−4
Socialnet 9 Astrology 1.6 · 10−4
t.coAudio-video 29.42 Naturism 1.07 · 10−3
File-hosting 27.43 Anti-spyware 8.89 · 10−4
News 17.48 Contraception 1.78 · 10−4
tinyurlNews 24.08 Contraception 4.5 · 10−3
Audio-video 10.61 Naturism 6.29 · 10−4
File-hosting 9.36 Childcare 2.51 · 10−4
goo.glNews 19.10 Gardening 3.34 · 10−3
Audio-video 12.23 Weapons 1.69 · 10−3
Socialnet 11.65 Naturism 1.69 · 10−3
ow.lyNews 23.38 Contraception 2.5 · 10−3
Socialnet 12.84 Childcare 1.32 · 10−3
Audio-video 10.03 Naturism 1.32 · 10−3
Table 5.6: Most- and least-popular landing page categories for the top 5shortening services.
egories and exhibits a very low change frequency, meaning that its shortURLs are posted on websites that regard the same subjects, or even on Flickrdirectly. Another popular example is nyti.ms. On the opposite side, serviceswith values above 50% also cover a small set of categories. However, dif-ferently from the first tier (i.e., 0–30%), the categories of the containers ofthese short URLs rarely match the categories of their landing pages. This isthe case, for example, of 4sq.com (about 100%), whose short URLs alwaysbring from online social-networking sites to pages categorized as “other”.The most popular shortening services (e.g., bit.ly, goo.gl, ow.ly) fall into thesecond tier (i.e., 32–48%), together with those services that cover a wide va-riety of categories, and typically interconnect pages of different categories.The most general-purpose services are those that are more abused to createaliases of malicious URLs: Here is indeed where the vast majority of mali-cious short URLs can be found. Unfortunately, general-purpose shorteningservices rely on ineffective countermeasures.
Non-obvious Uses of Short URLs It was also investigated how short URLsinterconnect together pages of different categories, to understand whethersome categories have a majority of container or landing pages. To this end,the average frequency of category change from the perspective of the con-tainer page and landing page was calculated. With this data a weighteddigraph with 48 nodes was created, each corresponding to a category. Theweights are the frequencies of change, calculated between each pair ofcategories—and normalized over all the short URLs and pages within eachcategory. Then, the average weight of incoming, In(cat), and outgoing,Out(cat), edges for each category cat were computed, and finally the ratioρ(cat) = In(cat)
In(cat)+Out(cat) was derived. When ρ → 0, the category has a ma-
www.syssec-project.eu 65 November 12, 2014
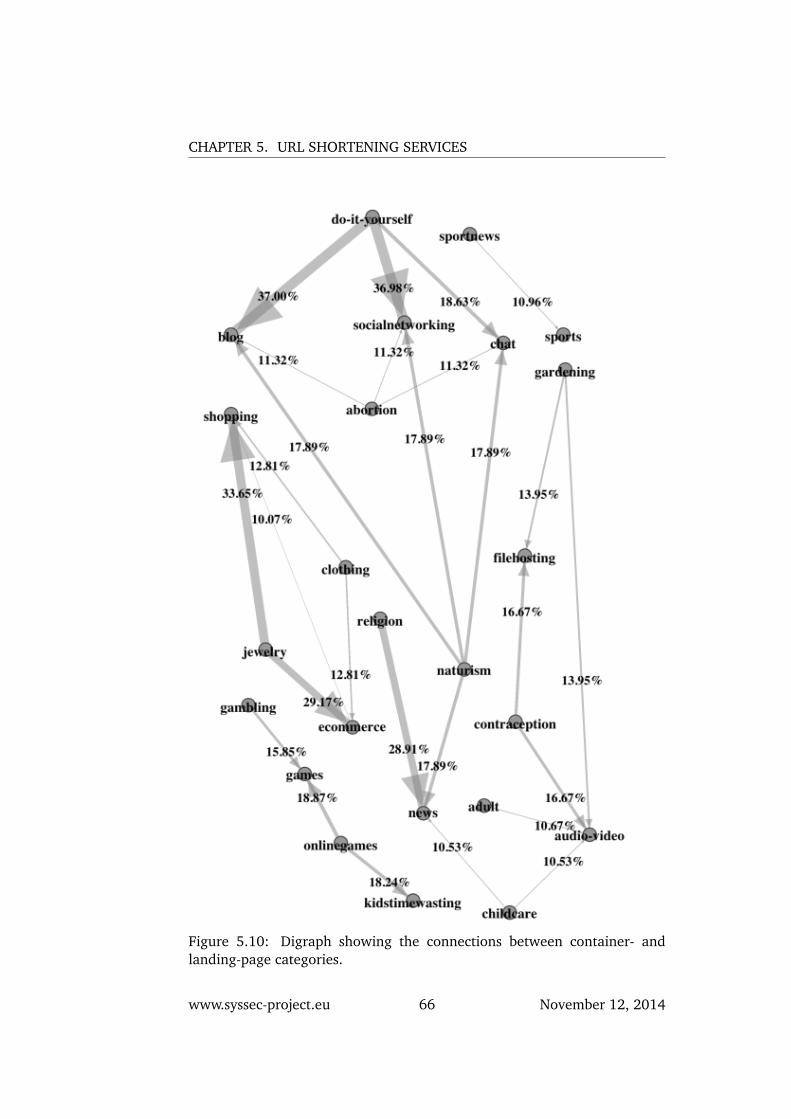
CHAPTER 5. URL SHORTENING SERVICES
Figure 5.10: Digraph showing the connections between container- andlanding-page categories.
www.syssec-project.eu 66 November 12, 2014
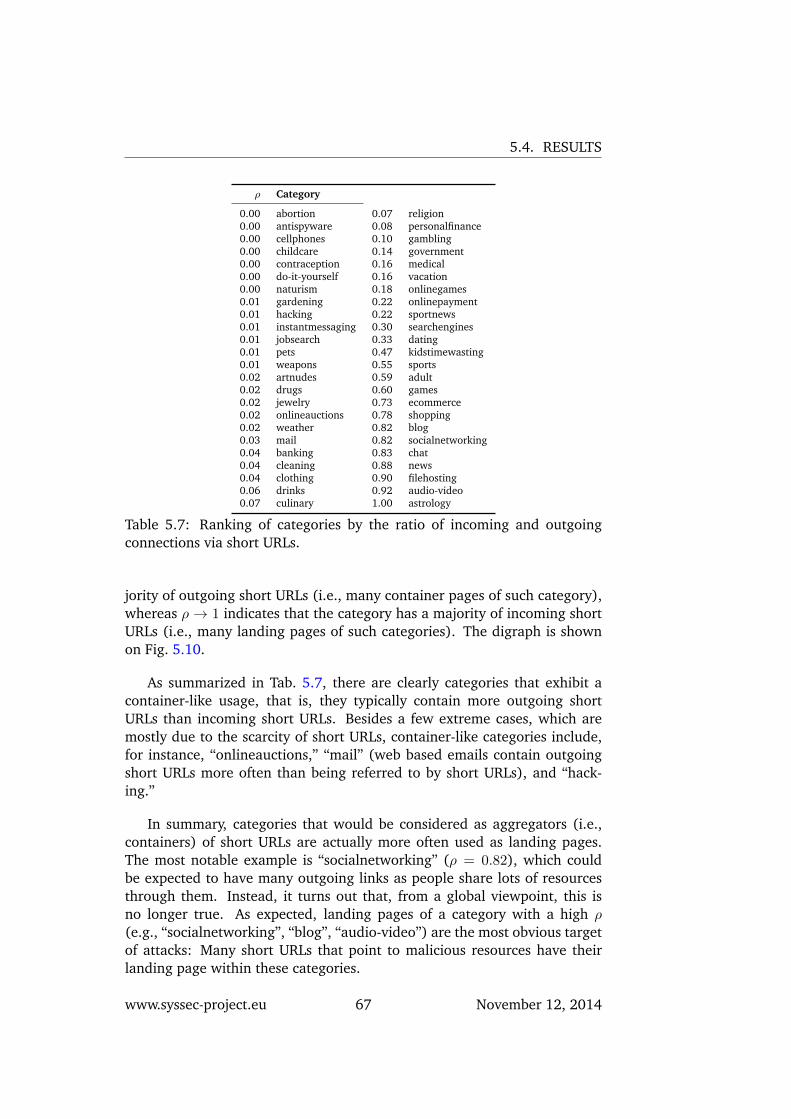
5.4. RESULTS
ρ Category
0.00 abortion 0.07 religion0.00 antispyware 0.08 personalfinance0.00 cellphones 0.10 gambling0.00 childcare 0.14 government0.00 contraception 0.16 medical0.00 do-it-yourself 0.16 vacation0.00 naturism 0.18 onlinegames0.01 gardening 0.22 onlinepayment0.01 hacking 0.22 sportnews0.01 instantmessaging 0.30 searchengines0.01 jobsearch 0.33 dating0.01 pets 0.47 kidstimewasting0.01 weapons 0.55 sports0.02 artnudes 0.59 adult0.02 drugs 0.60 games0.02 jewelry 0.73 ecommerce0.02 onlineauctions 0.78 shopping0.02 weather 0.82 blog0.03 mail 0.82 socialnetworking0.04 banking 0.83 chat0.04 cleaning 0.88 news0.04 clothing 0.90 filehosting0.06 drinks 0.92 audio-video0.07 culinary 1.00 astrology
Table 5.7: Ranking of categories by the ratio of incoming and outgoingconnections via short URLs.
jority of outgoing short URLs (i.e., many container pages of such category),whereas ρ→ 1 indicates that the category has a majority of incoming shortURLs (i.e., many landing pages of such categories). The digraph is shownon Fig. 5.10.
As summarized in Tab. 5.7, there are clearly categories that exhibit acontainer-like usage, that is, they typically contain more outgoing shortURLs than incoming short URLs. Besides a few extreme cases, which aremostly due to the scarcity of short URLs, container-like categories include,for instance, “onlineauctions,” “mail” (web based emails contain outgoingshort URLs more often than being referred to by short URLs), and “hack-ing.”
In summary, categories that would be considered as aggregators (i.e.,containers) of short URLs are actually more often used as landing pages.The most notable example is “socialnetworking” (ρ = 0.82), which couldbe expected to have many outgoing links as people share lots of resourcesthrough them. Instead, it turns out that, from a global viewpoint, this isno longer true. As expected, landing pages of a category with a high ρ(e.g., “socialnetworking”, “blog”, “audio-video”) are the most obvious targetof attacks: Many short URLs that point to malicious resources have theirlanding page within these categories.
www.syssec-project.eu 67 November 12, 2014
CHAPTER 5. URL SHORTENING SERVICES
5.5 Discussion
On a global scale, users are seldom exposed, while browsing, to threatsspread via short URLs, or at least no more than they are exposed to thesame threats spread via long URLs. Although a relatively small number ofmalicious short URLs can be seen in the wild, it is possible to evade thesecurity measures currently adopted by the top shortening services to filterdangerous URLs, with a simple time-of-check to time-of-use attack. How-ever, shortening services are not—and should not be—a definitive protec-tion layer between users and malicious resources. In-the-browser defensetools such as blacklists can alert users before visiting malicious URLs, re-gardless of whether they are short or long URLs. Since it is very inefficientfor shortening providers to monitor all their aliases periodically, we believethat this is not necessary when modern browsers are already prepared forcounteracting known malicious URLs.
On the other hand, the previous chapter explains, why URL shorteningservices are not necessarily the method of choice to veil malicious URL inclick fraud attacks or spam links. While it is true that the exact location ofthe contained domain can be covered, the underlying security mechanismcould very well influence the success rate of a phishing attack. This leadsdirectly to the next chapter, a topic which is even deemed dead by somesecurity researches: Spam.
www.syssec-project.eu 68 November 12, 2014
6Spam Mitigation
The last chapters dealt with technological background of malware, how itcan be analyzed and how to conduct the necessary elements in the firstplace. For a comprehensive picture of the malware landscape, we want toshow what malicious software is used for and how it can be monetized.Malware is the underlying platform for online crime: From spam to identitytheft, denial of service attacks or the emergence of fake-antivirus scams inrecent years [80], malware covertly installed on a victim’s computer playsan essential role in criminals’ online operations. Thus, investigating thefraudulent schemes performed by criminals in order to monetize malwareinstallations is also an important part of malware research.
In this chapter we look at one monetization vector of modern malwarein particular: The sending of unsolicited bulk emails, or spam. First, welook at the detection of bots engaged in sending spam. We show that bymodeling legitimate (“ham”) and unsolicited (“spam”) email traffic usingsocial network properties (see Section 6.1) we can identify abusive bots inthe network.
Furthermore, as we discuss in Section 6.2, there is also an often over-looked gray area between legitimate (ham) and unsolicited (spam) emails.Messages in this area are often hard to classify with existing antispam so-lutions, resulting in serious consequences for the end user: As our exper-iments show, users often find it difficult to distinguish between spam andham messages, putting them at risk of falling victim to botnet-generatedspam campaigns.
6.1 Spam Bot Identification
Eliminating the excessive amount of unsolicited spam which is consumingnetwork and mail server resources is quite challenging. These email commu-nications mostly originate from botnets of compromised machines [67, 34]
69
CHAPTER 6. SPAM MITIGATION
that are also likely the source of other malicious activities on the Internet.Although current antispam tools are efficient in hiding spam from users’mailboxes, there is a clear need for moving the defense against spam asclose to its source as possible. Therefore, it is necessary to understand thenetwork-level behavior of spam and how it differs from legitimate trafficin order to design antispam mechanisms that can identify spamming botson the network. We study the network-level behavior of email by exam-ining real email traffic captured on an Internet backbone link. From thecollected traffic, we have generated email networks in which the nodes rep-resent email addresses and the edges represent email communications. Tothe best of our knowledge, this is the largest email traffic dataset used tostudy the structure of email networks which contain both legitimate (ham)and unsolicited email traffic.
We show that the legitimate email traffic exhibits the same structuralproperties that other social and interaction networks (e.g., online social net-works, the Internet topology, the Web, and phone call graphs) typically ex-hibit, therefore, it can be modeled as a scale-free, small-world network. Wealso show that the email traffic containing spam cannot be modeled simi-larly, and because the unsocial behavior of spam is not hidden behind thesocial behavior of legitimate traffic, the structure of email networks con-taining both ham and spam differ from other social networks. Moreover, weshow that the temporal variations in the social network properties of emailtraffic can reveal more distinct properties of the behavior of spam.
In this study our goal is to identify the differences in the social networkproperties of spam and ham traffic, and leverage these differences to spotthe abusive nodes in the network.
For a more detailed version of this study, please refer to Moradi et al. [51].
6.1.1 Data Collection and Pre-processing
We have used two distinct email datasets to generate email networks. Thedatasets were created from passively captured SMTP packets on a 10 Gbpslink of the core-backbone of the SUNET1. Each dataset was collected during14 consecutive days with a year time span between the collections. In thefollowing we refer to the larger dataset as dataset A, and the smaller datasetas dataset B.
We pruned the unusable email flows, including those with no payloador missing packets and encrypted communications from the datasets. Weclassified the remaining emails as being either accepted (delivered by the re-ceiving mail server) or rejected (unfinished SMTP command exchange phaseand consequently not containing any email headers and body). Rejection isgenerally the result of spam pre-filtering strategies deployed by mail servers
1Swedish University Network (http://www.sunet.se/)
www.syssec-project.eu 70 November 12, 2014
6.1. SPAM BOT IDENTIFICATION
(e.g., blacklisting, greylisting, DNS lookups). Then, we classified all ac-cepted email communications to be either spam or ham to establish a groundtruth for our study. Similar to related work [24, 86], we used a well-trainedfiltering tool2 for this classification. Finally, we anonymized all email ad-dresses and discarded the email contents in order to preserve privacy.
After data collection and pre-processing, we generated a number ofemail networks from the datasets. In an email network the email addresses,which are extracted from the SMTP commands (“MAIL FROM” and “RCPTTO”), represent the nodes, and the exchanged emails represent the edges.In order to study and compare the characteristics of different categories ofemail, from each dataset we have generated a ham network, a spam network,and a rejected network, in addition to the complete email network.
6.1.2 Structural and Temporal Properties of Email Networks
In this section we briefly introduce the most significant structural and tem-poral properties of social networks.
Degree Distribution. The degree distribution of a network is the proba-bility that a randomly selected node has k edges. In a power law distribution,the fraction of nodes with degree k is n(k) ∝ k−γ , where γ is a constantexponent. Networks characterized by such degree distribution are calledscale-free networks. Many real networks such as the Internet topology [19],the Web [13], phone call graphs [52], and online social networks [50] arescale free.
Average Path Length. In small-world networks any two nodes in the net-work are likely to be connected through a short sequence of intermediatenodes, and the network diameter shrinks as the network grows [40].
Clustering Coefficient. In addition to a short average path length, small-world networks have high clustering coefficient values [89]. The clusteringcoefficient of a node v is defined as Cv = 2Ev/(kv(kv − 1)), where, kv de-notes the number of neighbors of v, kv(kv − 1)/2 the maximum numberof edges that can exist between the neighbors, and Ev the number of theedges that actually exist. The average Cv of a social network shows to whatextent friends of a person are also friends with each other and its value isindependent of the network size [71].
Connected Components. A connected component (CC) is a subset of nodesof the network where a path exists between any pair of them. As social net-works grow a giant CC (GCC), which contains the vast majority of the nodesin the network, emerges in the graph and its size increases over time [71].Moreover, the distribution of CC size for some social networks follows apower law pattern [13, 52].
2SpamAssassin (http://spamassassin.apache.org)
www.syssec-project.eu 71 November 12, 2014
CHAPTER 6. SPAM MITIGATION
6.1.2.1 Measurement Results
In the following we present the observed structural and temporal propertiesof our email networks. These properties can be used in order to model thebehavior of legitimate traffic and to find the distinguishing properties of theunsocial behavior of spam. Although the duration of our data collections isnot long enough to study the evolution of email networks, it is still possibleto track the changes in the structure of email networks in order to betterunderstand the distinct characteristics of ham and spam traffic.
Degree Distribution. Figures 6.1(a) and 6.1(e) show that none of the emailnetworks generated from datasets A and B exhibit a power law degree dis-tribution in all points. However, the ham networks generated from eachof the datasets are scale free as their degree distribution closely follow thedistribution n(k) ∝ k−γ with γA = 2.7 and γA = 2.3, respectively 3. The in-degree (out-degree) distribution for ham networks, which are shown in Fig-ures 6.1(b) and 6.1(f), also follows a power-low distribution with γAin = 3.2(γAout = 2.3) and γBin = 3.2 (γBout = 2.1 ), respectively. Moreover, in con-trast to previous studies [24, 12], neither the spam, nor the rejected net-works are completely scale free (Figures 6.1(c), 6.1(g), 6.1(d), and 6.1(h)).
Figure 6.2(a) and 6.2(e) show that the shape of the degree distributionsof the complete email networks may change over time as the networks grow.The shape of the degree distribution of spam and rejected networks can alsochange over time (Figures 6.2(c), 6.2(g), 6.2(d), and 6.2(h)). However,the ham networks always follow a power law distribution with an almostconstant exponent (Figures 6.2(b) and 6.2(f)).
Clustering Coefficient. The observed average clustering coefficients forour ham (spam) networks generated from both dataset are quite similar:CAham
= 9.92 × 10⁻³ (CAspam = 1.59 × 10⁻³) and CBham= 9.80 × 10⁻³
(CBspam = 1.54× 10⁻³). These values, similar to small-world networks, aresignificantly greater than that of random networks with the same numberof nodes and average number of edges per node, and as Figures 6.3(b) and6.3(f) show they remain relatively constant as the networks grow.
Average Path Length. The ham and spam networks generated from bothdatasets have short average path lengths, 〈l〉, as expected in small-worldnetworks: 〈lhamA
〉 = 7.0, 〈lspamA〉 = 8.5, 〈lhamB〉 = 6.7, and 〈lspamB 〉 = 7.8.
Figures 6.3(a) and 6.3(e) show that 〈l〉 decreases for all networks as theygrow, confirming the shrinking diameter phenomenon observed in [40] forother social networks.
Connected Components. Figure 6.1.2.2 shows the distribution of the sizeof the CCs for ham and spam networks. It can be seen that the GCCs of thenetworks are orders of magnitude larger than other CCs. The distribution
3The power law fits were calculated using the Maximum Likelihood estimator for powerlaw and Kolmogorov-Smirnov (KS) goodness-of-fit as presented in [15].
www.syssec-project.eu 72 November 12, 2014
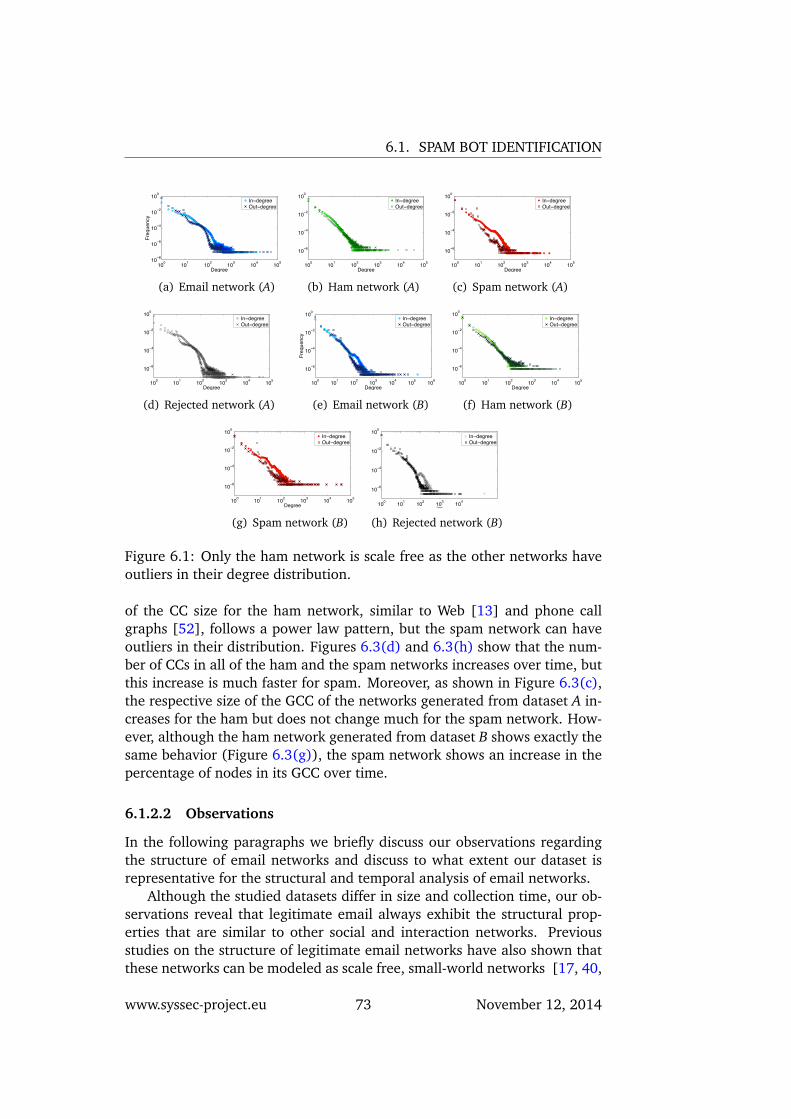
6.1. SPAM BOT IDENTIFICATION
100 102 104101 103 105
100
10−2
10−4
10−6
10−8
Degree
Freq
uenc
y
In−degreeOut−degree
(a) Email network (A)
100 105101 102 103 104
10−6
10−4
10−2
100
Degree
In−degreeOut−degree
(b) Ham network (A)
100 102 104101 103 105
100
10−2
10−4
10−6
Degree
In−degreeOut−degree
(c) Spam network (A)
100 105101 102 103 104
10−6
10−4
10−2
100
Degree
In−degreeOut−degree
(d) Rejected network (A)
100 102 104 106101 103 105
100
10−2
10−4
10−6
Degree
Freq
uenc
y
In−degreeOut−degree
(e) Email network (B)
100 105101 102 103 104
100
10−2
10−4
10−6
Degree
In−degreeOut−degree
(f) Ham network (B)
100 105101 102 103 104
100
10−2
10−4
10−6
Degree
In−degreeOut−degree
(g) Spam network (B)
100 102 104101 103
100
10−2
10−4
10−6
Degree
In−degreeOut−degree
(h) Rejected network (B)
Figure 6.1: Only the ham network is scale free as the other networks haveoutliers in their degree distribution.
of the CC size for the ham network, similar to Web [13] and phone callgraphs [52], follows a power law pattern, but the spam network can haveoutliers in their distribution. Figures 6.3(d) and 6.3(h) show that the num-ber of CCs in all of the ham and the spam networks increases over time, butthis increase is much faster for spam. Moreover, as shown in Figure 6.3(c),the respective size of the GCC of the networks generated from dataset A in-creases for the ham but does not change much for the spam network. How-ever, although the ham network generated from dataset B shows exactly thesame behavior (Figure 6.3(g)), the spam network shows an increase in thepercentage of nodes in its GCC over time.
6.1.2.2 Observations
In the following paragraphs we briefly discuss our observations regardingthe structure of email networks and discuss to what extent our dataset isrepresentative for the structural and temporal analysis of email networks.
Although the studied datasets differ in size and collection time, our ob-servations reveal that legitimate email always exhibit the structural prop-erties that are similar to other social and interaction networks. Previousstudies on the structure of legitimate email networks have also shown thatthese networks can be modeled as scale free, small-world networks [17, 40,
www.syssec-project.eu 73 November 12, 2014
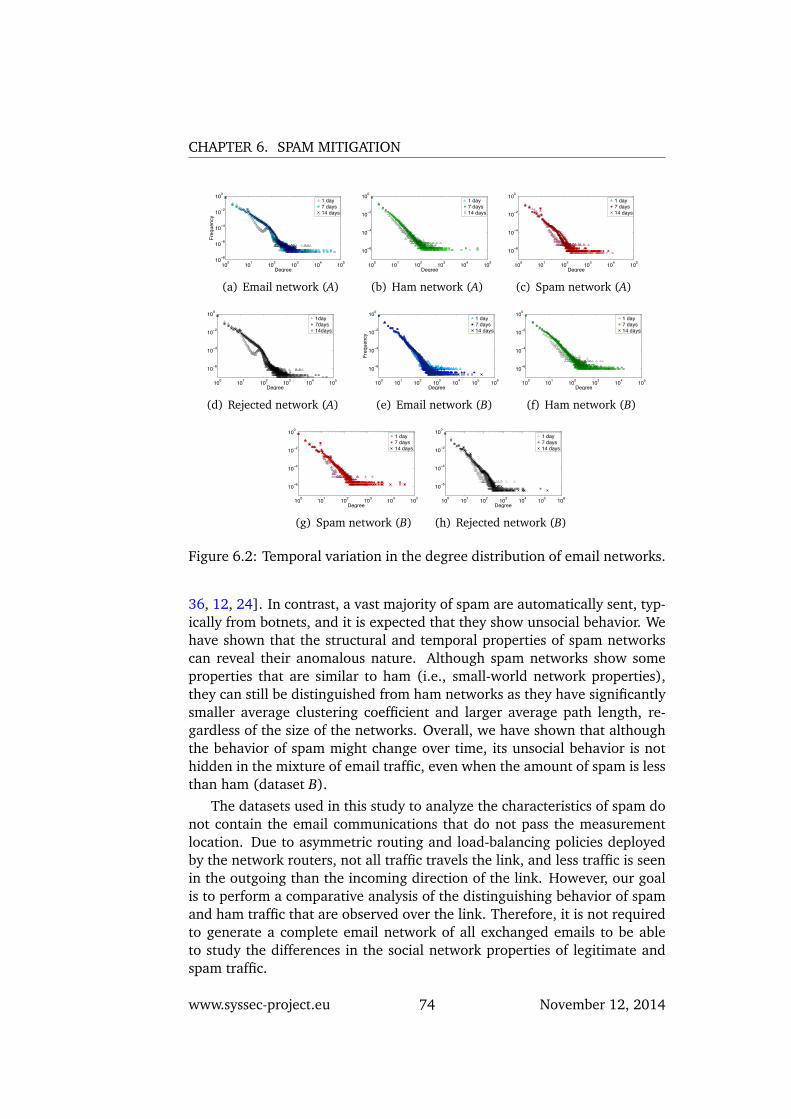
CHAPTER 6. SPAM MITIGATION
100 102 104101 103 105
100
10−4
10−2
10−8
10−6
Degree
Freq
uenc
y
1 day7 days14 days
(a) Email network (A)
100 105101 102 103 104
100
10−2
10−4
10−6
Degree
1 day7 days14 days
(b) Ham network (A)
100 105101 102 103 104
10−6
100
10−4
10−2
Degree
1 day7 days14 days
(c) Spam network (A)
100 102 104101 103 105
100
10−2
10−4
10−6
Degree
1day7days14days
(d) Rejected network (A)
100 102 104 106101 103 105
100
10−2
10−4
10−6
Degree
Freq
uenc
y
1 day7 days14 days
(e) Email network (B)
100 105101 102 103 104
100
10−2
10−4
10−6
Degree
1 day7 days14 days
(f) Ham network (B)
100 105101 102 103 104
100
10−2
10−4
10−6
Degree
1 day7 days14 days
(g) Spam network (B)
100 102 104 106101 103 105
100
10−2
10−4
10−6
Degree
1 day7 days14 days
(h) Rejected network (B)
Figure 6.2: Temporal variation in the degree distribution of email networks.
36, 12, 24]. In contrast, a vast majority of spam are automatically sent, typ-ically from botnets, and it is expected that they show unsocial behavior. Wehave shown that the structural and temporal properties of spam networkscan reveal their anomalous nature. Although spam networks show someproperties that are similar to ham (i.e., small-world network properties),they can still be distinguished from ham networks as they have significantlysmaller average clustering coefficient and larger average path length, re-gardless of the size of the networks. Overall, we have shown that althoughthe behavior of spam might change over time, its unsocial behavior is nothidden in the mixture of email traffic, even when the amount of spam is lessthan ham (dataset B).
The datasets used in this study to analyze the characteristics of spam donot contain the email communications that do not pass the measurementlocation. Due to asymmetric routing and load-balancing policies deployedby the network routers, not all traffic travels the link, and less traffic is seenin the outgoing than the incoming direction of the link. However, our goalis to perform a comparative analysis of the distinguishing behavior of spamand ham traffic that are observed over the link. Therefore, it is not requiredto generate a complete email network of all exchanged emails to be ableto study the differences in the social network properties of legitimate andspam traffic.
www.syssec-project.eu 74 November 12, 2014
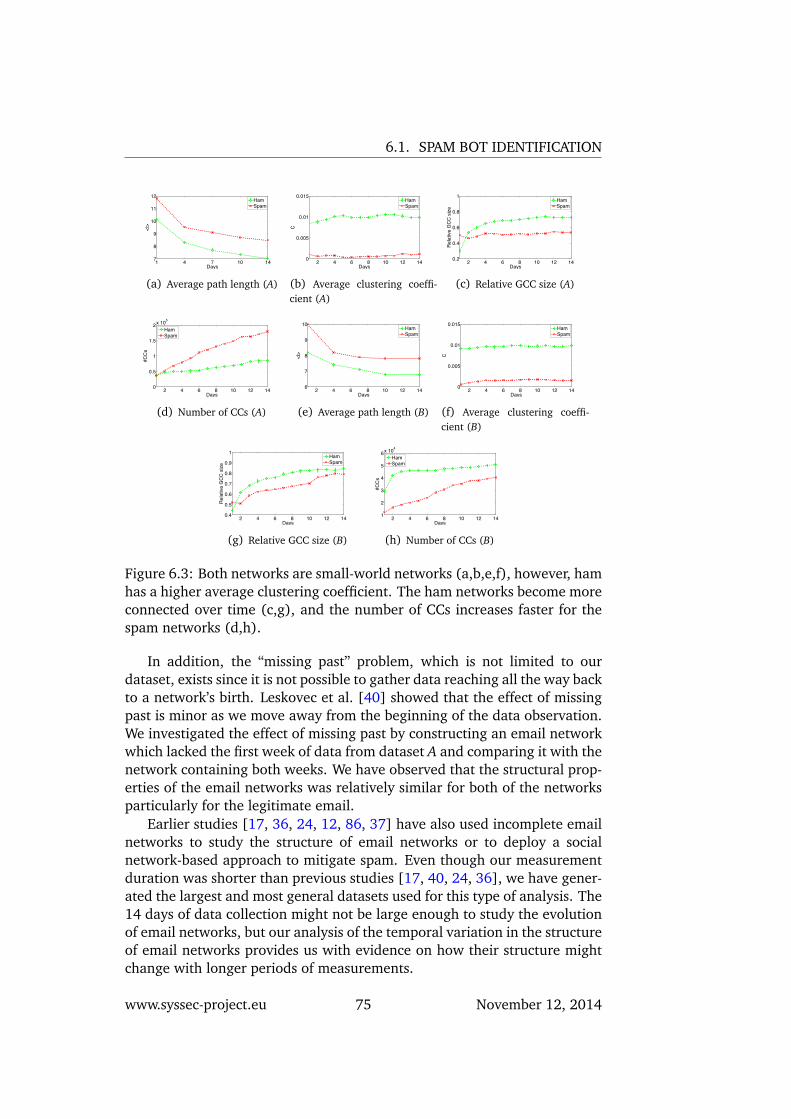
6.1. SPAM BOT IDENTIFICATION
1 4 7 10 147
8
9
10
11
12
Days
<l>
HamSpam
(a) Average path length (A)
2 4 6 8 10 12 140
0.005
0.01
0.015
Days
C
HamSpam
(b) Average clustering coeffi-cient (A)
2 4 6 8 10 12 140.2
0.4
0.6
0.8
1
Days
Rel
ativ
e G
CC
siz
e
HamSpam
(c) Relative GCC size (A)
2 4 6 8 10 12 140
0.5
1
1.5
2x 10⁵
Days
#CC
s
HamSpam
(d) Number of CCs (A)
2 4 6 8 10 12 146
7
8
9
10
Days
<l>
HamSpam
(e) Average path length (B)
2 4 6 8 10 12 140
0.005
0.01
0.015
Days
C
HamSpam
(f) Average clustering coeffi-cient (B)
2 4 6 8 10 12 140.4
0.5
0.6
0.7
0.8
0.9
1
Days
Rel
ativ
e G
CC
siz
e
HamSpam
(g) Relative GCC size (B)
2 4 6 8 10 12 141
2
3
4
5
6x 10⁴
Days
#CC
s
HamSpam
(h) Number of CCs (B)
Figure 6.3: Both networks are small-world networks (a,b,e,f), however, hamhas a higher average clustering coefficient. The ham networks become moreconnected over time (c,g), and the number of CCs increases faster for thespam networks (d,h).
In addition, the “missing past” problem, which is not limited to ourdataset, exists since it is not possible to gather data reaching all the way backto a network’s birth. Leskovec et al. [40] showed that the effect of missingpast is minor as we move away from the beginning of the data observation.We investigated the effect of missing past by constructing an email networkwhich lacked the first week of data from dataset A and comparing it with thenetwork containing both weeks. We have observed that the structural prop-erties of the email networks was relatively similar for both of the networksparticularly for the legitimate email.
Earlier studies [17, 36, 24, 12, 86, 37] have also used incomplete emailnetworks to study the structure of email networks or to deploy a socialnetwork-based approach to mitigate spam. Even though our measurementduration was shorter than previous studies [17, 40, 24, 36], we have gener-ated the largest and most general datasets used for this type of analysis. The14 days of data collection might not be large enough to study the evolutionof email networks, but our analysis of the temporal variation in the structureof email networks provides us with evidence on how their structure mightchange with longer periods of measurements.
www.syssec-project.eu 75 November 12, 2014
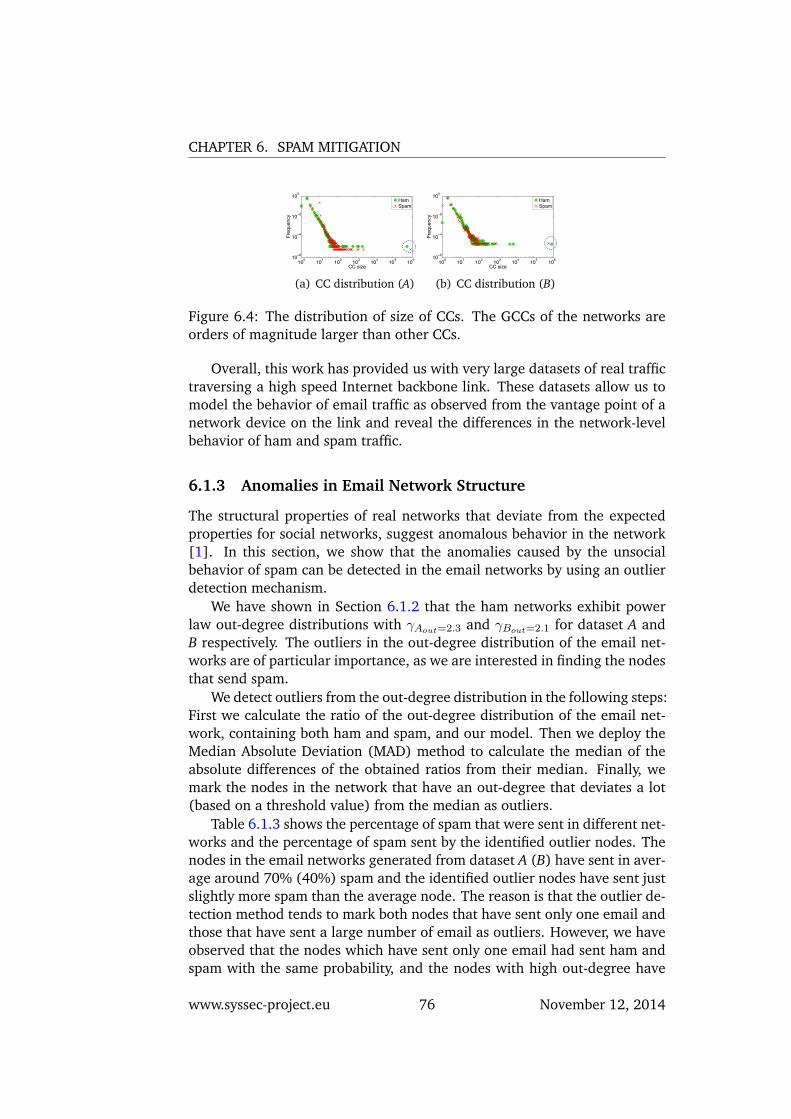
CHAPTER 6. SPAM MITIGATION
100 102 104 106101 103 10510−6
10−4
10−2
100
CC size
Freq
uenc
y
HamSpam
(a) CC distribution (A)
100 102 104 106101 103 105
100
10−2
10−4
10−6
CC size
Freq
uenc
y
HamSpam
(b) CC distribution (B)
Figure 6.4: The distribution of size of CCs. The GCCs of the networks areorders of magnitude larger than other CCs.
Overall, this work has provided us with very large datasets of real traffictraversing a high speed Internet backbone link. These datasets allow us tomodel the behavior of email traffic as observed from the vantage point of anetwork device on the link and reveal the differences in the network-levelbehavior of ham and spam traffic.
6.1.3 Anomalies in Email Network Structure
The structural properties of real networks that deviate from the expectedproperties for social networks, suggest anomalous behavior in the network[1]. In this section, we show that the anomalies caused by the unsocialbehavior of spam can be detected in the email networks by using an outlierdetection mechanism.
We have shown in Section 6.1.2 that the ham networks exhibit powerlaw out-degree distributions with γAout=2.3 and γBout=2.1 for dataset A andB respectively. The outliers in the out-degree distribution of the email net-works are of particular importance, as we are interested in finding the nodesthat send spam.
We detect outliers from the out-degree distribution in the following steps:First we calculate the ratio of the out-degree distribution of the email net-work, containing both ham and spam, and our model. Then we deploy theMedian Absolute Deviation (MAD) method to calculate the median of theabsolute differences of the obtained ratios from their median. Finally, wemark the nodes in the network that have an out-degree that deviates a lot(based on a threshold value) from the median as outliers.
Table 6.1.3 shows the percentage of spam that were sent in different net-works and the percentage of spam sent by the identified outlier nodes. Thenodes in the email networks generated from dataset A (B) have sent in aver-age around 70% (40%) spam and the identified outlier nodes have sent justslightly more spam than the average node. The reason is that the outlier de-tection method tends to mark both nodes that have sent only one email andthose that have sent a large number of email as outliers. However, we haveobserved that the nodes which have sent only one email had sent ham andspam with the same probability, and the nodes with high out-degree have
www.syssec-project.eu 76 November 12, 2014
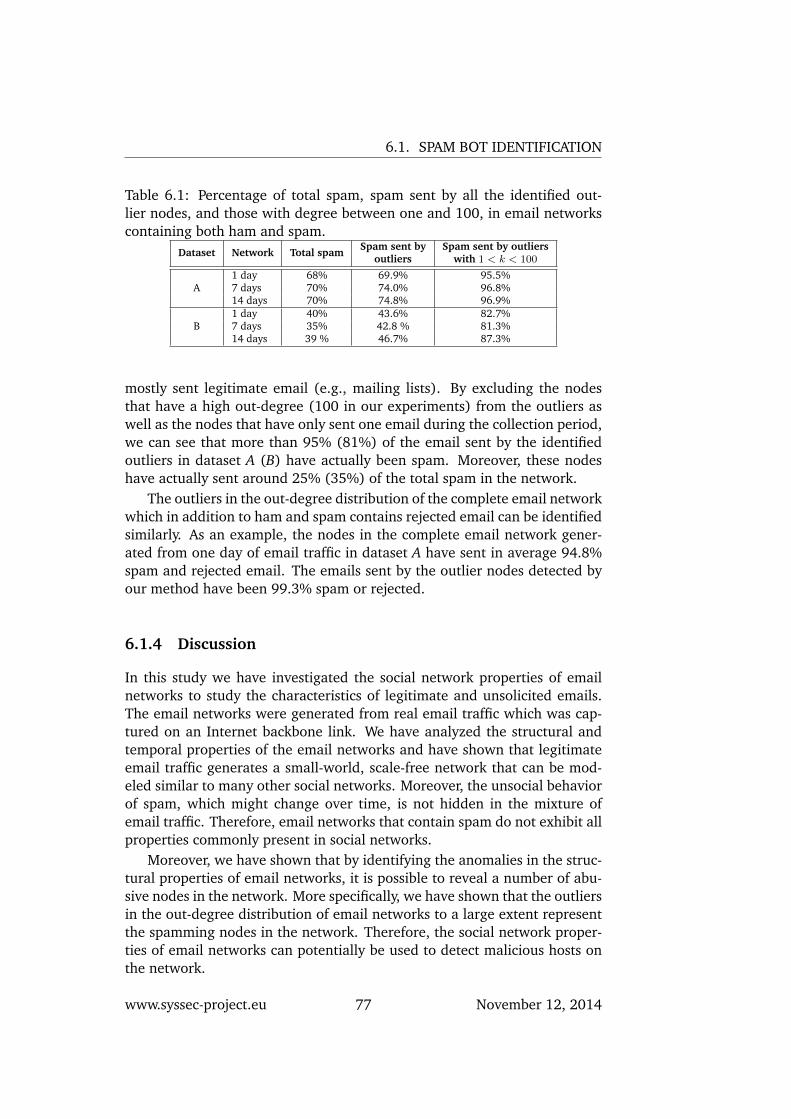
6.1. SPAM BOT IDENTIFICATION
Table 6.1: Percentage of total spam, spam sent by all the identified out-lier nodes, and those with degree between one and 100, in email networkscontaining both ham and spam.
Dataset Network Total spam Spam sent by Spam sent by outliersoutliers with 1 < k < 100
A1 day 68% 69.9% 95.5%7 days 70% 74.0% 96.8%14 days 70% 74.8% 96.9%
B1 day 40% 43.6% 82.7%7 days 35% 42.8 % 81.3%14 days 39 % 46.7% 87.3%
mostly sent legitimate email (e.g., mailing lists). By excluding the nodesthat have a high out-degree (100 in our experiments) from the outliers aswell as the nodes that have only sent one email during the collection period,we can see that more than 95% (81%) of the email sent by the identifiedoutliers in dataset A (B) have actually been spam. Moreover, these nodeshave actually sent around 25% (35%) of the total spam in the network.
The outliers in the out-degree distribution of the complete email networkwhich in addition to ham and spam contains rejected email can be identifiedsimilarly. As an example, the nodes in the complete email network gener-ated from one day of email traffic in dataset A have sent in average 94.8%spam and rejected email. The emails sent by the outlier nodes detected byour method have been 99.3% spam or rejected.
6.1.4 Discussion
In this study we have investigated the social network properties of emailnetworks to study the characteristics of legitimate and unsolicited emails.The email networks were generated from real email traffic which was cap-tured on an Internet backbone link. We have analyzed the structural andtemporal properties of the email networks and have shown that legitimateemail traffic generates a small-world, scale-free network that can be mod-eled similar to many other social networks. Moreover, the unsocial behaviorof spam, which might change over time, is not hidden in the mixture ofemail traffic. Therefore, email networks that contain spam do not exhibit allproperties commonly present in social networks.
Moreover, we have shown that by identifying the anomalies in the struc-tural properties of email networks, it is possible to reveal a number of abu-sive nodes in the network. More specifically, we have shown that the outliersin the out-degree distribution of email networks to a large extent representthe spamming nodes in the network. Therefore, the social network proper-ties of email networks can potentially be used to detect malicious hosts onthe network.
www.syssec-project.eu 77 November 12, 2014
CHAPTER 6. SPAM MITIGATION
6.2 Emails in the Gray Area
Nowadays, many antispam filters provide a good level of protection againstlarge-scale unsolicited email campaigns. However, as spammers have im-proved their techniques to increase the chances of reaching their targets,also antispam solutions have become more aggressive in flagging suspiciousemails. On one side, this arms race has lead to a steady increase in thedetection rate. On the other, it also contributed to the increase of the falsepositives, with serious consequences for the users whenever an importantmessage is erroneously flagged as spam. It is a well known fact that mostof the users regularly check their spam folder to verify that no importantmessages have been misclassified by the antispam filter.
Unfortunately, this process is very time-consuming and error-prone. An-tispam solutions are not very helpful in this direction, and do not usuallyprovide any additional information to help users in quickly identifying mar-keting emails, newsletters, or “borderline” cases that may be interesting forthe users. While most of the existing research deals with the problem ofefficiently and accurately distinguishing spam from ham, we focus on thethin line that separates the two categories. In particular, we limit our studyto the often overlooked area of gray emails [93], i.e., those ambiguous mes-sages that cannot be clearly categorized one way or the other by automatedspam filters.
For a more detailed version of this study, please refer to Isacenkova etal. [27].
6.2.1 Approach
We start our study by analyzing a real deployment of a challenge-responseantispam solution to measure the extent of this gray area. We use system’squarantined emails that already exclude the majority of the ham and spammessages as an approximation of the gray emails category. We analyzethe messages further in order to improve our understanding about themand the reasons that make them difficult to categorize. In particular, weadopt a three-phase approach based on message clustering, classification,and graph-based refinement. Extracted email features are applied in a con-text of email campaigns instead of individual emails. In particular, we startby clustering emails based on the email headers. We then extract a set offeatures based on a number of campaign attributes and we use them totrain a classifier in order to predict the campaign class. Finally, we employa graph-based refinement technique to further increase the coverage andprecision of our classification.
Data Collection. The amount and diversity of the available data is cru-cial in order to successfully identify email campaigns. Messages should be
www.syssec-project.eu 78 November 12, 2014
6.2. EMAILS IN THE GRAY AREA
collected from multiple feeds, cover numerous recipients, several organiza-tions, and for a long period of time [56, 60]. Our email dataset fulfills theserequirements as it was collected from a commercial Challenge-Response(CR) spam system deployed in tens of different organizations. A CR fil-ter is a software that automatically replies with a challenge (in our case aCAPTCHA) to any previously-unknown sender of incoming emails. If thesender solves the challenge, the message is delivered to the recipient andthe sender is added to a whitelist; if not, it remains in a quarantined folder,where its recipient can manually view and whitelist/blacklist it.
The monitoring period covered 6 months, from August 2011 to January2012. During this period around 11 million messages were delivered to themonitored mail servers. 29.4% of them belonged to the class of gray mes-sages. To protect the privacy of both the users and the companies involvedin the study, the data we used in our experiments did not include the emailbodies, and the headers were sanitized and analyzed in an aggregated form.
We also instrumented the CR-system to collect additional information:opened emails by the users, and whitelisted messages (thus showing thatthe user manually classified them as legitimate). This provides insights onthe users ability to distinguish harmless from harmful messages. Finally, oursensor collected the delivery status information, e.g. sent, bounced, anddelivered, for each challenge email sent back by the CR system.
Email Clustering. Previous results were very successful in identifying emailcampaigns, but, unfortunately, often relied on the content of the email body.Our dataset is limited to the email headers, thus forcing us to use a differentapproach based only on the email subjects. The main limitation of thistechnique is that the email subjects have to be long enough to minimize thechances of matching different messages by coincidence.
We decided to use a simple approach for grouping similar subjects basedon “almost exact” text matching, extended to include subjects with a vari-able part. The latter could be a varying phrase in the subject, includingrandom words, identifiers, or user names.
Feature-based Classification. To be able to differentiate and classify theidentified clusters, we extract a set of eleven features grouped in three cat-egories (see Table 6.2).
Before performing our classification, we build a training set by randomlyselecting 2,000 campaigns and performing a manual labeling of them. Welabeled 1,581 (79%) as legitimate and 419 (21%) as spam campaigns. Wetake a conservative approach, and flag as spam only campaigns with poten-tially illegal content that may involve malicious, fraudulent or illegal onlineactivities. This includes different “business models”: illegal product sell-ers, malware spreading emails, personal data and credential thieves, or ad-vanced fee fraud specialists. Finally, we consider any email belonging to acommercial marketing campaign as legitimate (in the sense that general an-
www.syssec-project.eu 79 November 12, 2014
CHAPTER 6. SPAM MITIGATION
Table 6.2: Cluster features.
Group ASender IPs Distribution of network prefixes (/24)Sender names Distribution of email sender namesSender add.domain Distribution of email domain namesSender add.prefix Distribution of email prefixes
Group BRejections Percentage of rejected emails at MTAWhite emails Percentage of whitelisted emailsChallenges bounced Percentage of bounced challengesCAPTCHAs solved Percentage of solved challengesUnsubscribe header Percentage of Unsubscribe headers
Group CNumber of recipients per email Normalized number of unique recipients per emailRecipient’s header Location of recipient’s email: To/Cc/Bcc/MixedCountries Distribution of countries based on originating IPs
Table 6.3: Campaign classification results.
Campaign Type Manual Sampling % Unlabeled %
Legitimate 1,581 79% 8,398 81.9%Spam 419 21% 1,852 18.1%
Total 2,000 10,250
tispam filters should not block them, unless they are specifically instructedto do so by the user).
Using the eleven listed presented above, we trained a binary classifier.Finally, we applied the model extracted from our training set to predict theclassification of the remaining unlabeled campaigns. Results are presentedin Table 6.3.
Graph-based Refinement. Although we achieved a relatively high accuracyusing our classifier, we still found that for some campaigns our algorithmgave uncertain results.
With the use of several graph-based techniques, detailed in Isacenkova etal. [27], we were able to reduce the false positives from 0.9% to 0.2% andsplit the entire dataset into three groups: legitimate (80%), spam (17%)and gray (2.9%) messages.
6.2.2 Attribute Analysis
In this section we analyze the characteristics of spam and legitimate cam-paigns. Our classifier provides some information about the relevance of eachfeature. Interestingly, the least important attributes are the ones in Group B,
www.syssec-project.eu 80 November 12, 2014

6.2. EMAILS IN THE GRAY AREA
and in particular the percentage of already whitelisted emails in the cluster.The most important ones are the distributions of countries and IP addresses,followed by the average number of recipients, and the sender email addresssimilarity. The latter proved to be useful because spammers often changesender emails, while legitimate campaigns use a single or several repetitivepatterns. In particular, we found the number of originating countries to bethe most indicative parameter.
The Role of IPs and Geolocation. IP address variation is often regarded asa strong indicator of botnet activity and often used as a reliable metric todetect spam. However, it is unclear what should be adopted as a thresholdfor this metric, how many different IPs should alert us of a distributed mali-cious activity, or how accurately we can classify email campaigns simply bylooking at their IP address distribution.
In a previous study of spam campaigns, Qian et al. [65] used a thresholdof 10 IPs per campaign to separate spam campaigns from legitimate ones.To evaluate this threshold, we applied it on our gray dataset as shown inFigure 6.5 (a). The graph plots the distribution of unique IP prefixes for bothspam and legitimate campaigns. Around 90% of the legitimate campaignsare indeed below the 10 IP threshold, while 90% of the spam is above -resulting in a global error rate of 9.2%. In comparison, this error is 5 timeshigher than the one of our classifier.
By looking at Figure 6.5 (a), we notice that above 50 IP prefixes there arefew legitimate campaigns left and 99.8% of legitimate campaigns are belowthis threshold. However, half of the spam campaigns are located above thethreshold and another half in between the two thresholds (10-50). Thissuggests that there is not a single value that separates the two classes withan acceptable error rate.
When we look at IP country distribution, the results improve consid-erably as some legitimate campaigns have many IP prefixes, but originatefrom few countries. This could be explained by one commercial campaignbeing distributed by several marketing companies in different locations. Incontrast, the vast majority of spam campaigns originate from multiple IPprefixes and multiple countries. In fact, by using a six-countries threshold(the one chosen by our classifier) we misclassify only 0.4% of legitimate and12% of spam campaigns - resulting in a total error rate of 2.8%. Figure 6.5(b) shows the classification error.
Finally, we investigate closer this group of spam campaigns with feworigins. Interestingly, the classifier for most of them gave a weak score. At acloser manual inspection, these cases mainly corresponded to phishing andNigerian scams. Several of these campaigns are sent in low volume and forshort periods of time using webmail accounts, thus hiding under benign IPaddresses.
www.syssec-project.eu 81 November 12, 2014
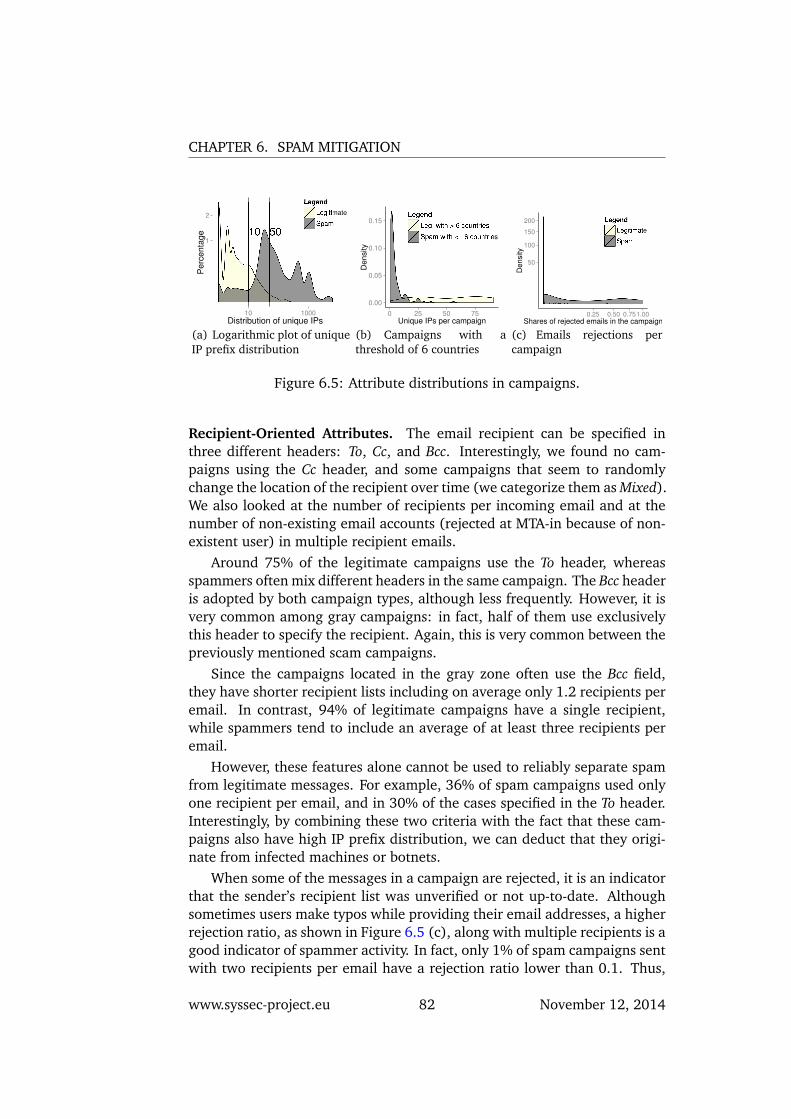
CHAPTER 6. SPAM MITIGATION
(a) Logarithmic plot of uniqueIP prefix distribution
(b) Campaigns with athreshold of 6 countries
(c) Emails rejections percampaign
Figure 6.5: Attribute distributions in campaigns.
Recipient-Oriented Attributes. The email recipient can be specified inthree different headers: To, Cc, and Bcc. Interestingly, we found no cam-paigns using the Cc header, and some campaigns that seem to randomlychange the location of the recipient over time (we categorize them as Mixed).We also looked at the number of recipients per incoming email and at thenumber of non-existing email accounts (rejected at MTA-in because of non-existent user) in multiple recipient emails.
Around 75% of the legitimate campaigns use the To header, whereasspammers often mix different headers in the same campaign. The Bcc headeris adopted by both campaign types, although less frequently. However, it isvery common among gray campaigns: in fact, half of them use exclusivelythis header to specify the recipient. Again, this is very common between thepreviously mentioned scam campaigns.
Since the campaigns located in the gray zone often use the Bcc field,they have shorter recipient lists including on average only 1.2 recipients peremail. In contrast, 94% of legitimate campaigns have a single recipient,while spammers tend to include an average of at least three recipients peremail.
However, these features alone cannot be used to reliably separate spamfrom legitimate messages. For example, 36% of spam campaigns used onlyone recipient per email, and in 30% of the cases specified in the To header.Interestingly, by combining these two criteria with the fact that these cam-paigns also have high IP prefix distribution, we can deduct that they origi-nate from infected machines or botnets.
When some of the messages in a campaign are rejected, it is an indicatorthat the sender’s recipient list was unverified or not up-to-date. Althoughsometimes users make typos while providing their email addresses, a higherrejection ratio, as shown in Figure 6.5 (c), along with multiple recipients is agood indicator of spammer activity. In fact, only 1% of spam campaigns sentwith two recipients per email have a rejection ratio lower than 0.1. Thus,
www.syssec-project.eu 82 November 12, 2014
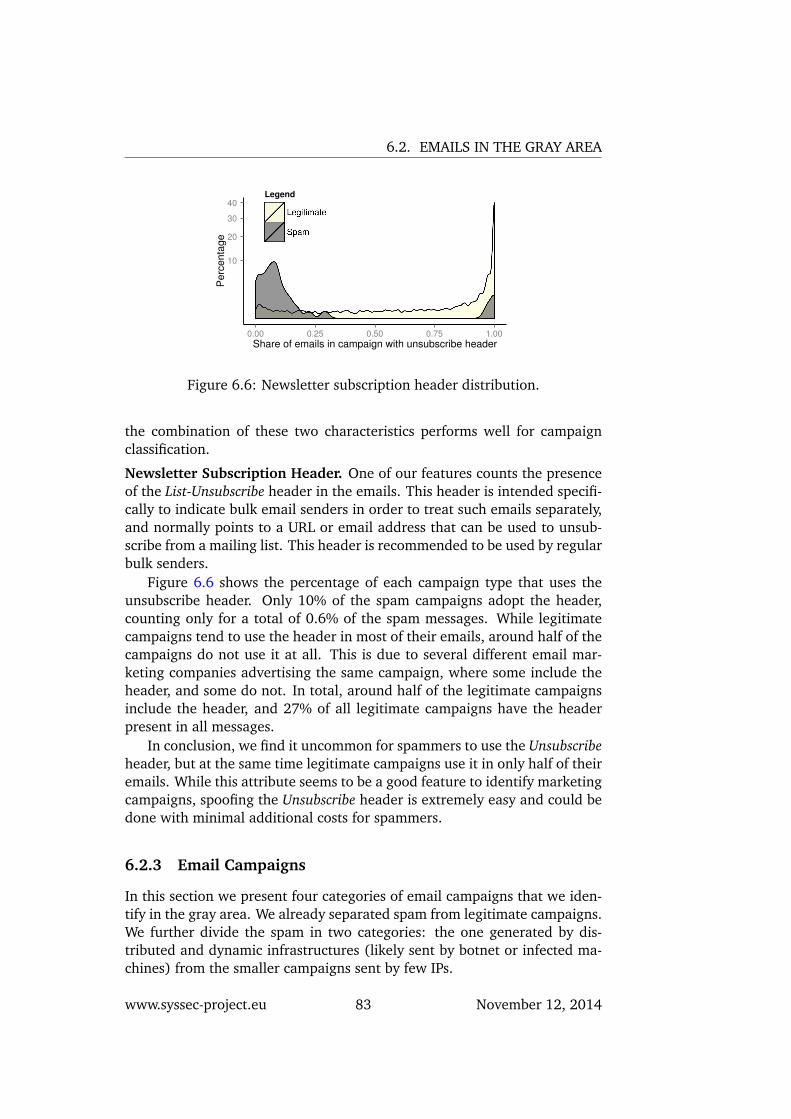
6.2. EMAILS IN THE GRAY AREA
Figure 6.6: Newsletter subscription header distribution.
the combination of these two characteristics performs well for campaignclassification.
Newsletter Subscription Header. One of our features counts the presenceof the List-Unsubscribe header in the emails. This header is intended specifi-cally to indicate bulk email senders in order to treat such emails separately,and normally points to a URL or email address that can be used to unsub-scribe from a mailing list. This header is recommended to be used by regularbulk senders.
Figure 6.6 shows the percentage of each campaign type that uses theunsubscribe header. Only 10% of the spam campaigns adopt the header,counting only for a total of 0.6% of the spam messages. While legitimatecampaigns tend to use the header in most of their emails, around half of thecampaigns do not use it at all. This is due to several different email mar-keting companies advertising the same campaign, where some include theheader, and some do not. In total, around half of the legitimate campaignsinclude the header, and 27% of all legitimate campaigns have the headerpresent in all messages.
In conclusion, we find it uncommon for spammers to use the Unsubscribeheader, but at the same time legitimate campaigns use it in only half of theiremails. While this attribute seems to be a good feature to identify marketingcampaigns, spoofing the Unsubscribe header is extremely easy and could bedone with minimal additional costs for spammers.
6.2.3 Email Campaigns
In this section we present four categories of email campaigns that we iden-tify in the gray area. We already separated spam from legitimate campaigns.We further divide the spam in two categories: the one generated by dis-tributed and dynamic infrastructures (likely sent by botnet or infected ma-chines) from the smaller campaigns sent by few IPs.
www.syssec-project.eu 83 November 12, 2014
CHAPTER 6. SPAM MITIGATION
We also split the legitimate campaigns into two groups. The first sentby private marketing companies as a service to distributes legitimate bulkadvertisements, i.e., commercial campaigns. The second including newslet-ters that are sent to the users subscribed to a web services or mailing lists,and the automatically generated notifications (e.g. for online registrations).Again, the first ones are delivered by large infrastructures, while the secondones are often sent from a limited and constant set of IP addresses.
Commercial Campaigns. This is the largest category in our dataset cover-ing 42% of the identified campaigns, with an average of 148 emails each.By looking manually at these clusters, we confirm that these messages aremainly generated by professional email marketers sending. We were able toidentify some of the main players (both national and international), and of-ten confirmed that they actually run a legal business. On their websites, theyrepeatedly underline the fact that “they are not spammers”, and that theyjust provide to other companies a way to send marketing emails within theboundaries of the current legislation. In fact, they also offer an online pro-cedure for users to opt-out and be removed from future communications.These companies also use wide IP address ranges to run the campaigns,probably to avoid being blacklisted. Moreover, we find quite interesting thatsome of these companies also provide a pre-compiled list of emails (alreadycategorized by user interests) that can be used to acquire new clients.
On average, this class of campaigns lasts for 26 days, but some alsocontinue for several months. Different email marketing companies are ofteninvolved in sending a single campaign, where each company is only activeduring a certain time frame. Also, each marketing service provider has itsown dedicated range of IP addresses, which explains sometimes high IPaddress variance and high geographical distribution of campaigns in thisgroup.
To conclude, commercial campaigns can be highly distributed, but, at thesame time, they often adopt consistent email patterns with similar sendernames and email addresses.
Newsletter Campaigns. The newsletter senders rely mostly on static andsmall mailing infrastructure. The sender is often the actual company dis-tributing the emails, with typically a small and fixed IP address range. Thiscategory contains half of the emails of the previous one (probably becausemost of the legitimate mailing lists do not get into the quarantined area asthey are already whitelisted by their customers) and covers around 30% ofthe total campaigns with an average size of 90 emails each.
A manual inspection seems to confirm that these campaigns consist mainlyof notifications and newsletters sent by online services to which users havesubscribed in the past. The senders are geographically localized (we en-countered only one exception of a distributed newsletter campaign) andhave extremely consistent sending patterns. Since we cluster campaigns
www.syssec-project.eu 84 November 12, 2014
6.2. EMAILS IN THE GRAY AREA
based on their subjects, newsletters tend to last for very short periods oftime. In addition, they normally use valid email recipient lists, and ex-hibit the lowest IP address, country, and sender email address variations.The consistent patterns in the email headers of this category indicate thatthe senders are making an effort to build a reputation and successfully de-liver their correspondence. Not surprisingly, this is also the category that iswhitelisted most often by the users.
Botnet-Generated Campaigns. Unsurprisingly, botnet-generated campaignshave highly dynamic attribute values, making them the easiest category toidentify automatically. This category contains clusters that accounts for only17% of all campaigns (also because most of the spam emails were alreadyexcluded from the gray emails by other antispam filters). Botnet campaignshave the highest geographical distribution as they are sent by infected com-puters from all over the world: 172 unique /24 networks per campaign,spread on average over 28 countries. Another prevalent characteristic is theuse of multiple recipient emails sent using unverified email lists. Conse-quently, this leads to the highest email rejection rates (24%), and highestbounced CAPTCHA requests. The Unsubscribe header is rarely used, andsender email addresses have low similarities.
On average, botnet campaigns are the ones lasting the longest, with onedrug-related campaign sent slowly over the entire six-months period of ourexperiments.
Despite the easily recognizable characteristics of these campaigns, usersshow a surprisingly high interest in these emails. This category has thehighest number of email views per campaign, suggesting that users are oftencurious about products promoted and sold on the black market [46].
Scam and Phishing Campaigns. These campaigns contain phishing andNigerian scam emails. Fraudsters trick their victims using threatening mes-sages or by trying to seduce them with huge monetary gains. The character-istics of this category largely resemble those of commercial campaigns, thusmaking it difficult to automatically separate these campaigns without ana-lyzing the email body. In fact, most of these campaigns belong to the grayarea of our classifier. This is the reason why we needed to verify this setmanually. These kind of threats are more likely to be identified by content-based detection techniques, e.g., by looking at email addresses and phonenumbers [28], or URL [56, 84] included in the body.
We found only 12,601 of such emails, with an average campaign sizeof 84 emails. Phishing campaigns often spoofed the email addresses us-ing well known company names (e.g. banks, eBay, Paypal), whereas Nige-rian scammers relied mostly on webmail accounts [28]. In this case, manysenders solved the CAPTCHA challenge – confirming that there is usually areal person behind these kinds of scams. The IP addresses from where theCAPTCHAs were solved are mostly located in West-African countries, like
www.syssec-project.eu 85 November 12, 2014
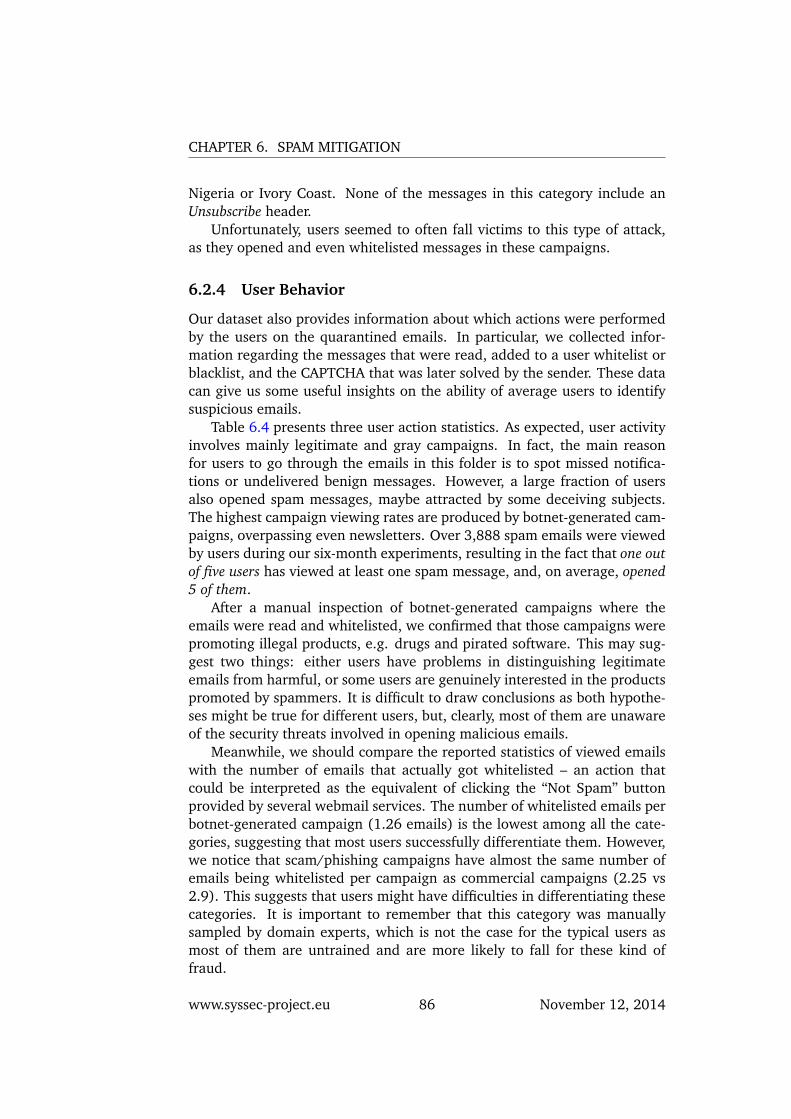
CHAPTER 6. SPAM MITIGATION
Nigeria or Ivory Coast. None of the messages in this category include anUnsubscribe header.
Unfortunately, users seemed to often fall victims to this type of attack,as they opened and even whitelisted messages in these campaigns.
6.2.4 User Behavior
Our dataset also provides information about which actions were performedby the users on the quarantined emails. In particular, we collected infor-mation regarding the messages that were read, added to a user whitelist orblacklist, and the CAPTCHA that was later solved by the sender. These datacan give us some useful insights on the ability of average users to identifysuspicious emails.
Table 6.4 presents three user action statistics. As expected, user activityinvolves mainly legitimate and gray campaigns. In fact, the main reasonfor users to go through the emails in this folder is to spot missed notifica-tions or undelivered benign messages. However, a large fraction of usersalso opened spam messages, maybe attracted by some deceiving subjects.The highest campaign viewing rates are produced by botnet-generated cam-paigns, overpassing even newsletters. Over 3,888 spam emails were viewedby users during our six-month experiments, resulting in the fact that one outof five users has viewed at least one spam message, and, on average, opened5 of them.
After a manual inspection of botnet-generated campaigns where theemails were read and whitelisted, we confirmed that those campaigns werepromoting illegal products, e.g. drugs and pirated software. This may sug-gest two things: either users have problems in distinguishing legitimateemails from harmful, or some users are genuinely interested in the productspromoted by spammers. It is difficult to draw conclusions as both hypothe-ses might be true for different users, but, clearly, most of them are unawareof the security threats involved in opening malicious emails.
Meanwhile, we should compare the reported statistics of viewed emailswith the number of emails that actually got whitelisted – an action thatcould be interpreted as the equivalent of clicking the “Not Spam” buttonprovided by several webmail services. The number of whitelisted emails perbotnet-generated campaign (1.26 emails) is the lowest among all the cate-gories, suggesting that most users successfully differentiate them. However,we notice that scam/phishing campaigns have almost the same number ofemails being whitelisted per campaign as commercial campaigns (2.25 vs2.9). This suggests that users might have difficulties in differentiating thesecategories. It is important to remember that this category was manuallysampled by domain experts, which is not the case for the typical users asmost of them are untrained and are more likely to fall for these kind offraud.
www.syssec-project.eu 86 November 12, 2014
6.2. EMAILS IN THE GRAY AREA
Table 6.4: User actions performed on campaigns.
Viewed Whitelisted CAPTCHA solved
Legitimate 42% 12% 3.5%Spam 25% 6% 0.2%Gray 40% 17% 10%
To further measure how significant this phenomenon is, we computethat there is a 0.36% probability that a certain user whitelists a legitimateemail and 0.0005% that she whitelists a spam message. These numbers mayseem low, but they rapidly increase when multiplied by the number of usersand the number of messages received. In total, an average of 3.9 emailsget whitelisted per legitimate campaign compared to 1.1 emails per spamcampaign.
To conclude, user-generated actions on gray emails are erroneous andthus are inaccurate to use for prediction. They often open even potentiallydangerous emails, ignoring security risks.
www.syssec-project.eu 87 November 12, 2014
CHAPTER 6. SPAM MITIGATION
6.2.5 Discussion
We presented a system to identify and classify campaigns of gray emails.As an approximation of this set, we chose to use the quarantined folder ofa challenge-response antispam filter, since it is already clean from obviousspam and ham messages.
Our analysis unveiled the most and the least predictive email campaignclass attributes. We also demonstrated that previous techniques used foremail campaign classification [65] did not provide acceptable results in oursettings, confirming that the gray area contains the hardest messages toclassify. Additionally, we confirmed and extended some of the findings ofprevious studies regarding botnet campaigns [56].
Our system could be used in different ways. First of all, it can helpunderstanding how large commercial campaigns work, how they originate,and how they differ from other unsolicited emails. It could also serve asan input to automatically place marketing campaigns and newsletters in aseparate folder, so that users can clearly differentiate these messages fromother forms of spam. In fact, the users in our study often opened botnet-generated emails and were especially prone to errors when dealing withscam and phishing messages; we believe that a separate folder dedicatedto legitimate bulk emails would create an extra layer between the usersand the malicious messages, thus allowing users to focus on the bulk folderwhen looking for missing and misclassified emails. Interestingly, after wecompleted our study, a similar solution was deployed by GMail [26], to placeuser newsletters, notifications, and other commercial email into distinctivecategories.
www.syssec-project.eu 88 November 12, 2014

7Conclusions
With this final deliverable we provided an overview of the most interestingresearch on malware and fraud topics. Both areas are quite hard to separatesince one often depends on the other. Fraudulent activity, for instance, al-most always relies on some kind of malware which needs to be installed atthe victim’s host. Still, the areas we covered are far from complete. Thereare a lot of interesting other topics ranging from advanced malware analysisover detailed botnet takedowns to online banking fraud. Covering them ina single deliverable, however, is not feasible. Furthermore, we covered onlytechnological aspects of the two worlds. There are just as many sociologicaland human aspects connected to fraud alone. In order not to drop themcompletely, they are discussed in the final roadmap, which is deliverableD4.4.
Here we also cover another important aspect of work package 5: Theexpert meetings. All the input that led to this deliverable originally stemsfrom various publications created by members or collaborations of the con-sortium. The working group meetings were held with the goal to get inputbeyond the consortium. And it worked surprisingly well. These discussionsresulted in ideas about future research directions but also brought existingwork to attention. In the case of working group 5 (working group on mal-ware and fraud), for example, we were provided with insight about bankingfraud but from the moment when an account is already compromised. Theseinsights inspired new ideas on where to disrupt the scamming scheme andnot necessarily on the technological side. Again, a more detailed discussionis provided in the final roadmap.
These insights were exactly what we were targeting with the SysSecproject. Building a network of qualified and knowledgeable people fromvarious fields, to give ideas and discuss experiences in their respective topic.
89

CHAPTER 7. CONCLUSIONS
www.syssec-project.eu 90 November 12, 2014
Bibliography
[1] L. Akoglu, M. McGlohon, and C. Faloutsos. OddBall: Spotting Anomalies in WeightedGraphs. In PAKDD, 2010.
[2] P. W. e. al. MessageLabs Intelligence: 2010 Annual Security Report. Technical report,Symantec, 2010.
[3] D. Antoniades, E. Athanasopoulos, I. Polakis, S. Ioannidis, T. Karagiannis, G. Kontaxis,and E. P. Markatos. we.b: The web of short URLs. In WWW ’11, 2011.
[4] P. Baecher and M. Koetter. libemu, 2009. http://libemu.carnivore.it/.
[5] M. Bailey, J. Oberheide, J. Andersen, Z. M. Mao, F. Jahanian, and J. Nazario. Au-tomated Classification and Analysis of Internet Malware. In Proceedings of the 10thInternational Symposium on Recent Advances in Intrusion Detection (RAID), 2007.
[6] D. Balzarotti, M. Cova, C. Karlberger, C. Kruegel, E. Kirda, and G. Vigna. EfficientDetection of Split Personalities in Malware. In Proceedings of the 17th Annual Networkand Distributed System Security Symposium (NDSS), 2010.
[7] P. Bania. Evading network-level emulation, 2009. http://piotrbania.com/all/articles/pbania-evading- nemu2009.pdf.
[8] U. Bayer, I. Habibi, D. Balzarotti, E. Kirda, and C. Kruegel. A View on Current Mal-ware Behaviors. In 2nd USENIX Workshop on Large-Scale Exploits and Emergent Threats(LEET), 2009.
[9] U. Bayer, C. Kruegel, and E. Kirda. TTAnalyze: A Tool for Analyzing Malware. In Pro-ceedings of the 15th European Institute for Computer Antivirus Research (EICAR) AnnualConference, 2006.
[10] U. Bayer and F. Nentwich. Anubis: Analyzing Unknown Binaries, 2009. http://anubis.iseclab.org/.
[11] F. Bellard. QEMU, a Fast and Portable Dynamic Translator. In USENIX Annual TechnicalConference, 2005.
[12] P. O. Boykin and V. P. Roychowdhury. Leveraging social networks to fight spam. Com-puter, 38(4), 2005.
[13] A. Broder, R. Kumar, F. Maghoul, P. Raghavan, S. Rajagopalan, R. Stata, A. Tomkins,and J. Wiener. Graph structure in the web. Computer Networks, 33(1-6), 2000.
91
BIBLIOGRAPHY
[14] X. Chen, J. Andersen, Z. M. Mao, M. Bailey, and J. Nazario. Towards an Understandingof Anti-Virtualization and Anti-Debugging Behavior in Modern Malware. In Proceedingsof the 38th Annual IEEE International Conference on Dependable Systems and Networks(DSN), 2008.
[15] A. Clauset, C. R. Shalizi, and M. E. J. Newman. Power-law distributions in empiricaldata. SIAM Reviews, June 2007.
[16] A. Dinaburg, P. Royal, M. Sharif, and W. Lee. Ether: Malware Analysis via HardwareVirtualization Extensions. In Proceedings of the ACM Conference on Computer and Com-munications Security (CCS), 2008.
[17] H. Ebel, L. Mielsch, and S. Bornholdt. Scale-free topology of e-mail networks. PhysicalReview E, 66, 2002.
[18] M. Egele, P. Wurzinger, C. Kruegel, and E. Kirda. Defending browsers against drive-by downloads: Mitigating heap-spraying code injection attacks. In Proceedings of the6th international conference on Detection of Intrusions and Malware, & VulnerabilityAssessment (DIMVA), 2009.
[19] M. Faloutsos, P. Faloutsos, and C. Faloutsos. On power-law relationships of the internettopology. SIGCOMM Comput. Commun. Rev., 29, 1999.
[20] P. Ferrie. Attacks on Virtual Machine Emulators. Technical report, Symantec ResearchWhite Paper, 2006.
[21] P. Ferrie. Attacks on More Virtual Machines, 2007.
[22] S. Ford, M. Cova, C. Kruegel, and G. Vigna. Wepawet, 2009. http://wepawet.cs.ucsb.edu/.
[23] T. Garfinkel, K. Adams, A. Warfield, and J. Franklin. Compatibility is Not Transparency:VMM Detection Myths and Realities. In Proceedings of the 11th Workshop on Hot Topicsin Operating Systems (HotOS-XI), 2007.
[24] L. H. Gomes, R. B. Almeida, L. M. A. Bettencourt, V. Almeida, and J. M. Almeida.Comparative graph theoretical characterization of networks of spam and legitimateemail. In Proc. of the Conference on Email and Anti-Spam, 2005.
[25] C. Grier, K. Thomas, V. Paxson, and M. Zhang. @spam: the underground on 140characters or less. In CCS ’10, pages 27–37, New York, NY, USA, 2010. ACM.
[26] G. inc. Inbox tabs and category labels. http://gmailblog.blogspot.fr/2013/05/a-new-inbox-that-puts-you-back-in.html.
[27] J. Isacenkova and D. Balzarotti. Shades of gray: A closer look at emails in the grayarea. In Proceedings of the 9th ACM Symposium on Information, Computer and Commu-nications Security (ASIACCS), 2014.
[28] J. Isacenkova, O. Thonnard, A. Costin, D. Balzarotti, and A. Francillion. Inside thescam jungle: A closer look at 419 scam email operations. IWCC, 2013.
[29] P. Jaccard. The Distribution of Flora in the Alpine Zone. The New Phytologist, 11(2),1912.
[30] N. M. Johnson, J. Caballero, K. Z. Chen, S. McCamant, P. Poosankam, D. Reynaud, andD. Song. Differential Slicing: Identifying Causal Execution Differences for SecurityApplications. In IEEE Symposium on Security and Privacy (2011), 2011.
[31] V. Kamluk. A black hat loses control. http://www.securelist.com/en/weblog?weblogid=208187881, 2009.
[32] M. G. Kang, P. Poosankam, and H. Yin. Renovo: A Hidden Code Extractor for PackedExecutables. In ACM Workshop on Recurring Malcode (WORM), 2007.
www.syssec-project.eu 92 November 12, 2014
BIBLIOGRAPHY
[33] M. G. Kang, H. Yin, S. Hanna, S. McCamant, and D. Song. Emulating Emulation-Resistant Malware. In Proceedings of the 2nd Workshop on Virtual Machine Security(VMSec), 2009.
[34] C. Kanich, C. Kreibich, K. Levchenko, B. Enright, G. M. Voelker, V. Paxson, and S. Sav-age. Spamalytics: an empirical analysis of spam marketing conversion. Proc. of theACM conf. on computer and communications security, 52(9), 2009.
[35] P. Kleissner. Antivirus Tracker. http://avtracker.info/, 2009.
[36] G. Kossinets and D. J. Watts. Empirical analysis of an evolving social network. Science,311(5757), 2006.
[37] H. Lam and D. Yeung. A learning approach to spam detection based on social networks.In Proceedings of the Conference on Email and Anti-Spam, 2007.
[38] B. Lau and V. Svajcer. Measuring virtual machine detection in malware using DSDtracer. Journal in Computer Virology, 6(3), 2010.
[39] S. Lee and J. Kim. WarningBird: Detecting Suspicious URLs in Twitter Stream. InNDSS ’12, 2012.
[40] J. Leskovec, J. Kleinberg, and C. Faloutsos. Graph evolution: Densification and shrink-ing diameters. ACM Transactions on Knowledge Discovery Data, 1(1), 2007.
[41] M. Lindorfer, C. Kolbitsch, and P. M. Comparetti. Detecting environment-sensitivemalware. In Recent Advances in Intrusion Detection, pages 338–357. Springer, 2011.
[42] B. Livshits. Finding malware on a web scale. Computer Network Security, 2012.
[43] F. Maggi, A. Frossi, S. Zanero, G. Stringhini, B. Stone-Gross, C. Kruegel, and G. Vigna.Two years of short URLs internet measurement: Security threats and countermeasures.In Proceedings of the 22nd International Conference on World Wide Web (WWW), 2013.
[44] L. Martignoni, M. Christodorescu, and S. Jha. OmniUnpack: Fast, Generic, and SafeUnpacking of Malware. In Proceedings of the Annual Computer Security ApplicationsConference (ACSAC), 2007.
[45] J. Mason, S. Small, F. Monrose, and G. MacManus. English shellcode. In Proceedingsof the 16th ACM conference on Computer and communications security (CCS), 2009.
[46] D. McCoy, A. Pitsillidis, G. Jordan, N. Weaver, C. Kreibich, B. Krebs, G. M. Voelker,S. Savage, and K. Levchenko. Pharmaleaks: Understanding the business of onlinepharmaceutical affiliate programs. USENIX, 2012.
[47] D. K. McGrath and M. Gupta. Behind phishing: an examination of phisher modioperandi. In LEET ’08, pages 4:1–4:8, Berkeley, CA, USA, 2008. USENIX Association.
[48] Metaspploit. The metasploit project. http://www.metasploit.com/.
[49] Microsoft. Win32 assembly components, Dec. 2002. http://lsd-pl.net.
[50] A. Mislove, M. Marcon, K. P. Gummadi, P. Druschel, and B. Bhattacharjee. Measure-ment and analysis of online social networks. In IMC, 2007.
[51] F. Moradi, T. Olovsson, and P. Tsigas. Towards modeling legitimate and unsolicitedemail traffic using social network properties. In Proceedings of the Fifth Workshop onSocial Network Systems (SNS), 2012.
[52] A. A. Nanavati, R. Singh, D. Chakraborty, K. Dasgupta, S. Mukherjea, G. Das, S. Guru-murthy, and A. Joshi. Analyzing the structure and evolution of massive telecom graphs.IEEE Trans. on Knowledge & Data Engineering, 20(5), 2008.
[53] Nepenthes. Common shellcode naming initiative, 2009. http://nepenthes.carnivore.it/csni.
[54] R. Paleari, L. Martignoni, E. Passerini, D. Davidson, M. Fredrikson, J. Giffin, and S. Jha.Automatic Generation of Remediation Procedures for Malware Infections. In Proceed-ings of the 19th USENIX Conference on Security, 2010.
www.syssec-project.eu 93 November 12, 2014
BIBLIOGRAPHY
[55] R. Paleari, L. Martignoni, G. F. Roglia, and D. Bruschi. A fistful of red-pills: How toautomatically generate procedures to detect CPU emulators. In Proceedings of the 3rdUSENIX Workshop on Offensive Technologies (WOOT), 2009.
[56] A. Pathak, F. Qian, Y. C. Hu, Z. M. Mao, and S. Ranjan. Botnet spam campaigns can belong lasting: Evidence, implications, and analysis. SIGMETRICS, 2009.
[57] B. B. Pek, G. and and B. L. nEther: In-guest Detection of Out-of-the-guest MalwareAnalyzers. In ACM European Workshop on System Security (EUROSEC), 2011.
[58] R. Perdisci, W. Lee, and N. Feamster. Behavioral Clustering of HTTP-Based Malwareand Signature Generation Using Malicious Network Traces. In USENIX Conference onNetworked Systems Design and Implementation (NSDI), 2010.
[59] M. Pietrek. A crash course on the depths of Win32™structured exception handling,1997. http://www.microsoft.com/msj/0197/exception/exception.aspx.
[60] A. Pitsillidis, C. Kanich, G. M. Voelker, K. Levchenko, and S. Savage. Taster’s choice: acomparative analysis of spam feeds. IMC, 2012.
[61] M. Polychronakis, K. G. Anagnostakis, and E. P. Markatos. An empirical study of real-world polymorphic code injection attacks. In Proceedings of the 2nd USENIX Workshopon Large-scale Exploits and Emergent Threats (LEET), April 2009.
[62] M. Polychronakis, K. G. Anagnostakis, and E. P. Markatos. Comprehensive shellcodedetection using runtime heuristics. In Proceedings of the 26th Annual Computer SecurityApplications Conference, pages 287–296. ACM, 2010.
[63] M. Polychronakis, E. P. Markatos, and K. G. Anagnostakis. Network-level polymorphicshellcode detection using emulation. In Proceedings of the Third Conference on Detectionof Intrusions and Malware & Vulnerability Assessment (DIMVA), July 2006.
[64] M. Polychronakis, E. P. Markatos, and K. G. Anagnostakis. Emulation-based detectionof non-self-contained polymorphic shellcode. In Proceedings of the 10th InternationalSymposium on Recent Advances in Intrusion Detection (RAID), September 2007.
[65] F. Qian, A. Pathak, Y. C. Hu, Z. M. Mao, and Y. Xie. A case for unsupervised-learning-based spam filtering. SIGMETRICS, 2010.
[66] T. Raffetseder, C. Kruegel, and E. Kirda. Detecting System Emulators. In InformationSecurity Conference (ISC), 2007.
[67] A. Ramachandran and N. Feamster. Understanding the network-level behavior ofspammers. SIGCOMM Comput. Commun. Rev., 36, 2006.
[68] R. Rasmussen and G. Aaron. Global Phishing Survey: Trends and Domain Name Usein 1H2010. Technical report, APWG, Oct. 2010.
[69] R. Rasmussen and G. Aaron. Global Phishing Survey: Trends and Domain Name Usein 1H2011. Technical report, APWG, Nov. 2011.
[70] R. Rasmussen and G. Aaron. Global Phishing Survey: Trends and Domain Name Usein 1H2012. Technical report, APWG, Oct. 2012.
[71] A. Reka and Barabasi. Statistical mechanics of complex networks. Rev. Mod. Phys.,74:47–97, June 2002.
[72] C. Rossow, C. J. Dietrich, H. Bos, L. Cavallaro, M. Van Steen, F. C. Freiling, andN. Pohlmann. Sandnet: Network traffic analysis of malicious software. In Proceedingsof the First Workshop on Building Analysis Datasets and Gathering Experience Returns forSecurity, pages 78–88. ACM, 2011.
[73] C. Rossow, C. J. Dietrich, C. Grier, C. Kreibich, V. Paxson, N. Pohlmann, H. Bos, andM. Van Steen. Prudent practices for designing malware experiments: Status quo andoutlook. In Security and Privacy (SP), 2012 IEEE Symposium on, pages 65–79. IEEE,2012.
www.syssec-project.eu 94 November 12, 2014
BIBLIOGRAPHY
[74] J. Rutkowska. Red Pill... or how to detect VMM using (almost) one CPU instruction.http://invisiblethings.org/papers/redpill.html, 2004.
[75] Skape. Understanding windows shellcode, 2003. http://www.hick.org/code/skape/papers/win32-shellcode.pdf.
[76] Skape. Safely searching process virtual address space, 2004. http://www.hick.org/code/skape/papers/egghunt-shellcode.pdf.
[77] SkyLined. SEH GetPC (XP SP3), July 2009. http://skypher.com/wiki/index.php/Hacking/Shellcode/Alphanumeric/ALPHA3/x86/ASCII/Mixedcase/SEH_GetPC_(XP_sp3).
[78] Y. Song, M. E. Locasto, A. Stavrou, A. D. Keromytis, and S. J. Stolfo. On the infeasibilityof modeling polymorphic shellcode. In Proceedings of the 14th ACM conference onComputer and communications security (CCS), 2007.
[79] B. Stock, J. Gobel, M. Engelberth, F. C. Freiling, and T. Holz. Walowdac-analysis of apeer-to-peer botnet. In Computer Network Defense (EC2ND), 2009 European Conferenceon, pages 13–20. IEEE, 2009.
[80] B. Stone-Gross, R. Abman, R. Kemmerer, C. Kruegel, D. Steigerwald, and G. Vigna. TheUnderground Economy of Fake Antivirus Software. In Proceedings of the Workshop onEconomics of Information Security (WEIS), 2011.
[81] B. Stone-Gross, A. Moser, C. Kruegel, K. Almaroth, and E. Kirda. FIRE: FInding RoguenEtworks. In Proceedings of the Annual Computer Security Applications Conference (AC-SAC), 2009.
[82] P. Szor. The Art of Computer Virus Research and Defense. Addison-Wesley Professional,February 2005.
[83] C. K. Tan. Defeating Kernel Native API Hookers by Direct Service Dispatch TableRestoration. Technical report, SIG2 G-TEC Lab, 2004.
[84] K. Thomas, C. Grier, J. Ma, V. Paxson, and D. Song. Design and evaluation of a real-time url spam filtering service. IEEE Symposium on Security and Privacy, 2011.
[85] T. Toth and C. Kruegel. Accurate buffer overflow detection via abstract payload exe-cution. In Proceedings of the 5th Symposium on Recent Advances in Intrusion Detection(RAID), Oct. 2002.
[86] C. Tseng and M. Chen. Incremental SVM model for spam detection on dynamic emailsocial networks. In Conf. on Computational Science and Engineering, 2009.
[87] X. Wang, Y.-C. Jhi, S. Zhu, and P. Liu. Still: Exploit code detection via static taintand initialization analyses. In Proceedings of the Annual Computer Security ApplicationsConference (ACSAC), 2008.
[88] X. Wang, C.-C. Pan, P. Liu, and S. Zhu. Sigfree: A signature-free buffer overflow attackblocker. In Proceedings of the USENIX Security Symposium, Aug. 2006.
[89] D. J. Watts and S. H. Strogatz. Collective dynamics of ’small-world’ networks. Nature,393(6684), 1998.
[90] B.-J. Wever. SEH Omelet Shellcode, 2009. http://code.google.com/p/w32-seh-omelet-shellcode/.
[91] G. Wicherski. Win32 egg search shellcode, 33 bytes, Feb. 2009. http://blog.oxff.net/2009/02/win32-egg-search- shellcode-33-bytes.html.
[92] C. Willems, T. Holz, and F. Freiling. Toward automated dynamic malware analysisusing CWSandbox. IEEE Security and Privacy, 5(2):32–39, 2007.
[93] W.-t. Yih, R. McCann, and A. Kolcz. Improving spam filtering by detecting gray mail.CEAS, 2007.
www.syssec-project.eu 95 November 12, 2014
BIBLIOGRAPHY
[94] K. Yoshioka, Y. Hosobuchi, T. Orii, and T. Matsumoto. Your Sandbox is Blinded: Im-pact of Decoy Injection to Public Malware Analysis Systems. Journal of InformationProcessing, 19, 2011.
[95] Q. Zhang, D. S. Reeves, P. Ning, and S. P. Lyer. Analyzing network traffic to detectself-decrypting exploit code. In Proceedings of the 2nd ACM Symposium on Information,Computer and Communications Security (ASIACCS), 2007.
www.syssec-project.eu 96 November 12, 2014