Settlement Suitability Analysis Using Geographical ...
12
J. Int. Environmental Application & Science, Vol. 11(3): 229-240 (2016) 229 Settlement Suitability Analysis Using Geographical Information System (GIS): A Case Study in Aksaray, Turkey Murat Kavurmaci Geological Engineering Department, Aksaray University, Aksaray, TURKEY Received Agust 12, 2016; Accepted September 19, 2016 Abstract: Selection of settlement sites and the protection of these areas from natural disasters is a difficult and complex process. The destruction caused by earthquakes shows that the existing settlement plans do not attach sufficient importance to soil durability. In this study, settlement suitability map produced on soil durability was developed to determine the spatial distribution of safe locations for settlement using the techniques of the Geographical Information Systems (GIS) on geotechnical and hydrogeological data. To investigate the characteristics of the soil in Aksaray, Turkey, 67 samples were collected through geotechnical borehole. Based on settlement suitability map, four suitability classes were defined as highly suitable, moderately suitable, poorly suitable and unsuitable. The spatial distribution map of soil durability was constructed using the kriging method. For each map, seven different semivariogram models were tested and the model that best fit the data was selected based on the root mean square standardized error. According to the model, approximately 33.2 % of the study area is either suitable or highly suitable to build new settlements and the remaining area (66.8%) can be considered poorly suitable or unsuitable. Areas that are poorly suitable or unsuitable for settlement are concentrated in the northwestern and southeastern parts of the city. This study helped identify the hazardous zones that may affect the construction and design of the superstructure. This study also provides general information on how to determine safe settlement sites. Furthermore, the use of the produced map will reduce human and economic losses due to natural disasters. Keywords: Settlement suitability; Soil durability; Geographical Information System Introduction In the last century, the demand for new residential areas and the effects of urbanization in developing countries continues to grow due to the rapidly increasing population and migration. Suitable site selection has become more important due to the development of urban areas. In the past, the selection of the location of settlement results from many separate decisions taken by individuals. Alonso (1964) was one of the leading pioneers in the field of site selection analysis. In his book, Alonso (1964) compiled crucial criteria for the selection of industrial sites. Putman’s (1979) dissertation is also considered to be one of the early in-depth studies in this area. Several other authors such as Herbert and Benjamin (1960), Wilson (1970), Harris (1985) and Amano et al. (1987) focused on trade and economy in the site selection process. However, none of these publications takes into account human safety and the impact of natural hazards. Throughout history, the erroneous selection of a settlement location has led to large-scale disasters. In particular, earthquakes such the 1976 Tangshan earthquake, 1999 Marmara earthquake and 2010 Haiti earthquake have caused the loss of countless lives and resulted in property damage that cost billions of dollars. The size of the hazard depends on the presence of seismic activity, the properties of the local soil and the state of the engineering structures (Karaoglu, 2013). Turkey is located in a seismically active region. Soil problems such as subsidence in loose granular soils and the liquefaction of saturated sand deposits in seismically active regions can cause worsen the damage (Robertson & Wride, 1998; Swan, 2015). In Turkey, the Marmara Earthquake that occurred on August 17, 1999 and the more recent Van Earthquake on October 23, 2011 have, once again, demonstrated that the damage tends to be greater in weak soil with low density or uncompacted soil than in solid soil. During the Marmara Earthquake, many buildings situated on loose saturated sand deposits settled more than 1 m and others tipped over on their sides. Corresponding: E-Mail: [email protected] ; Tel: 00355693053954
Transcript of Settlement Suitability Analysis Using Geographical ...
J. Int. Environmental Application & Science, Vol. 11(3): 229-240 (2016)
229
Settlement Suitability Analysis Using Geographical Information System (GIS): A Case Study in Aksaray, Turkey
Murat Kavurmaci
Geological Engineering Department, Aksaray University, Aksaray, TURKEY
Received Agust 12, 2016; Accepted September 19, 2016
Abstract: Selection of settlement sites and the protection of these areas from natural disasters is a difficult and complex process. The destruction caused by earthquakes shows that the existing settlement plans do not attach sufficient importance to soil durability. In this study, settlement suitability map produced on soil durability was developed to determine the spatial distribution of safe locations for settlement using the techniques of the Geographical Information Systems (GIS) on geotechnical and hydrogeological data. To investigate the characteristics of the soil in Aksaray, Turkey, 67 samples were collected through geotechnical borehole. Based on settlement suitability map, four suitability classes were defined as highly suitable, moderately suitable, poorly suitable and unsuitable. The spatial distribution map of soil durability was constructed using the kriging method. For each map, seven different semivariogram models were tested and the model that best fit the data was selected based on the root mean square standardized error. According to the model, approximately 33.2 % of the study area is either suitable or highly suitable to build new settlements and the remaining area (66.8%) can be considered poorly suitable or unsuitable. Areas that are poorly suitable or unsuitable for settlement are concentrated in the northwestern and southeastern parts of the city. This study helped identify the hazardous zones that may affect the construction and design of the superstructure. This study also provides general information on how to determine safe settlement sites. Furthermore, the use of the produced map will reduce human and economic losses due to natural disasters. Keywords: Settlement suitability; Soil durability; Geographical Information System
Introduction In the last century, the demand for new residential areas and the effects of urbanization in
developing countries continues to grow due to the rapidly increasing population and migration. Suitable site selection has become more important due to the development of urban areas. In the past, the selection of the location of settlement results from many separate decisions taken by individuals. Alonso (1964) was one of the leading pioneers in the field of site selection analysis. In his book, Alonso (1964) compiled crucial criteria for the selection of industrial sites. Putman’s (1979) dissertation is also considered to be one of the early in-depth studies in this area. Several other authors such as Herbert and Benjamin (1960), Wilson (1970), Harris (1985) and Amano et al. (1987) focused on trade and economy in the site selection process. However, none of these publications takes into account human safety and the impact of natural hazards.
Throughout history, the erroneous selection of a settlement location has led to large-scale disasters. In particular, earthquakes such the 1976 Tangshan earthquake, 1999 Marmara earthquake and 2010 Haiti earthquake have caused the loss of countless lives and resulted in property damage that cost billions of dollars. The size of the hazard depends on the presence of seismic activity, the properties of the local soil and the state of the engineering structures (Karaoglu, 2013). Turkey is located in a seismically active region. Soil problems such as subsidence in loose granular soils and the liquefaction of saturated sand deposits in seismically active regions can cause worsen the damage (Robertson & Wride, 1998; Swan, 2015). In Turkey, the Marmara Earthquake that occurred on August 17, 1999 and the more recent Van Earthquake on October 23, 2011 have, once again, demonstrated that the damage tends to be greater in weak soil with low density or uncompacted soil than in solid soil. During the Marmara Earthquake, many buildings situated on loose saturated sand deposits settled more than 1 m and others tipped over on their sides.
Corresponding: E-Mail: [email protected]; Tel: 00355693053954

J. Int. Environmental Application & Science, Vol. 11(3): 229-240 (2016)
230
In the literature, many cities throughout the world have been reported to be established on weak soil (Montoya & Masser, 2005; Degerliyurt, 2014). To design a foundation that supports an adequate structure load, it is essential to determine the nature and properties of soil that will support the foundation (Arnous, 2013). Nowadays, for most people, determining the safest residential area in terms of soil properties and geological conditions is the most important factor in choosing a place to live (Aydoner & Maktav, 2013). To this end, municipalities now follow a formal process for the identification of ideal locations to be designated as safe residential areas. In this process, the most essential issue is to determine the soil properties (Arnous, 2013; Kurnaz & Ramazanoglu, 2014). When stressed due to loading, soil tends to deform (Santamarina et al., 2001; Mitchell & Soga, 2005). The resistance to the deformation of soil depends on factors such the water content, bulk density, the angle of internal friction and the manner in which the load is applied to the soil (Bowles, 1984). Since soil behaves in a complex manner when loaded, it is also important to know the bearing capacity, which is the maximum average contact pressure between the foundation and the soil (Terzaghi & Peck, 1967). The position of groundwater has a significant effect on the bearing capacity of soil. The presence of water table at a depth less than the width of the foundation from the foundation bottom will reduce the bearing capacity of the soil. The greatest damage in an earthquake occurs in soil with a low bearing capacity. In this respect, accurate planning of site selection and analysis are very important in terms of minimizing the potential losses during and after disasters (Collins et al., 2001; Malczewski, 2004; Halik et al., 2013).
Due to the complexity of the site selection process, there is a need to consider multiple alternative solutions and evaluation criteria. In recent years, Geographical Information System (GIS) have been used to evaluate sites for this purpose and determine regional risk for residential areas (Siddiqui et al., 1996; Store & Kangas, 2001; Dai et al., 2001; Aly et al., 2005; Kasani, 2005; Tudes & Yigiter, 2010; Sener et al., 2011; Youssef et al., 2011; Romano et al., 2015). Similarly, Guiqin et al. (2009) used Geographical Information System (GIS) to select landfill sites selection.
The current study investigated the settlement suitability of the Aksaray City in the Central Anatolian region of Turkey using soil data, hydrogeological data and statistical methods. The city of Aksaray, located on the Lake Tuz Fault, is founded on the paleolake deposits and alluvial soil (Teke, 2002; Altas et al., 2011). In this city, the buildings are generally not suitable for residential use due to underestimated seismic activity and poor soil conditions in the area (Teke, 2002; Er, 2002). The main purpose of this research was to develop a model to determine the degree of the risk created by poor soil conditions and to predict optimum locations based on high soil durability. For the assessment of safe residential areas, soil samples were collected from 67 locations in the study area through geotechnical borehole. In addition, a soil durability map was developed using a combination of parameters that affected soil durability. The final soil durability map of the region was created using the kriging method. The findings of this study can be used to ensure the life and property safety in the study area.
Materials and Methods The study area and sampling
The study area comprises the city of Aksaray in the Central Anatolian region of Turkey, with the location of 33o 59’ and 34o 02’ E longitude and 38o 23’ and 38o 21’ N latitude (Figure 1). According to the 2011 census, the population of the district is 278,171 of whom 195,990 live in the city of Aksaray. The average altitude of the study area is 980 m and the coverage is 30 km2. The mean temperature is 12.06 oC and the mean annual rainfall is 339.8 kg/m2. For the period between 1970 and 2015, the annual average number of days with snow-covered ground is 25, the annual average wind speed is 2 m/s, and the annual average rate of moisture is 65%. Furthermore, the study area is topographically flat. In terms of geomorphology, it is surrounded with high hills extending to the east and northeast. The study area does not contain a significant river network, apart from episodic streams.
The surficial geology of the study area is primarily Quaternary sediments ranging from clay, silt, sand and gravel in alluvial deposits and paleolake sediments. The thickness of Quaternary deposits is between 10 m and 30 m. Their size is changes from course to fine sand, silt and mud. Due to the effect of the tectonics and their heterogonous structures, quaternary deposits have gained different hydrogeological properties. The permeability of Quaternary deposits has been measured as 5.37 x 10⁻⁵ m/s (Elhatip et al., 2004; Altas et al., 2011). In the study area, there is a considerable zone of high

J. Int. Environmental Application & Science, Vol. 11(3): 229-240 (2016)
231
porosity alluvium containing groundwater. The area is surrounded by fault lines with a potential to generate earthquakes, the most important of which is the Lake Tuz Fault. Due to the poor soil conditions, loose soil and the proximity to active fault zones, the area is vulnerable to potential hazards such as soil collapse and liquefaction.
Figure 1. Location of the sampling stations and general view of the study area on Landsat-5 TM
(natural color) image data
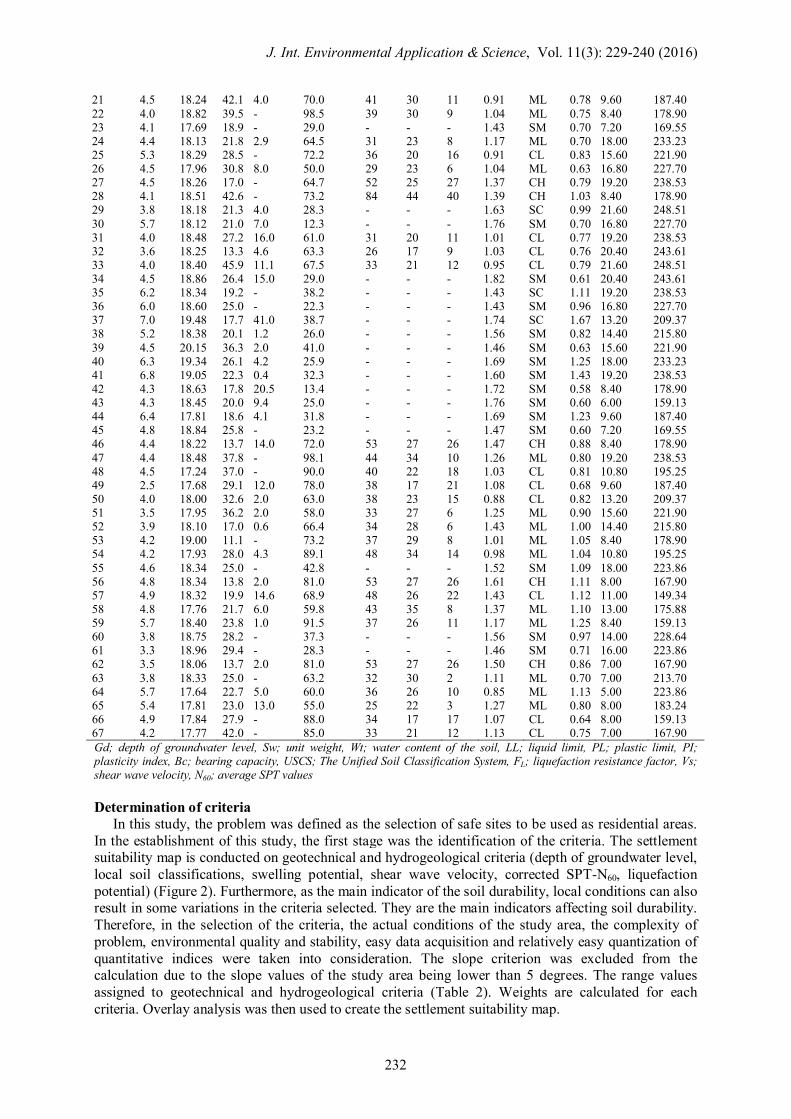
Soil samples were collected from 67 different geotechnical borehole sites (Table 1) in 2014. Relatively undisturbed soil samples were extracted from the ground using Shelby tubes. The samples were then analyzed in terms of their density, permeability, compressibility and strength at the Soil Mechanics Laboratory in the Geological Engineering Department of Aksaray University. According to ASTM D1586-11, the standard penetration test (SPT) was performed for each 1.5 m interval of depths to determine the bearing capacity of the soil. For the evaluation of the liquefaction potential of the study area, the liquefaction method proposed by Youd et. al (2001) was used. In addition, images obtained from the IKONOS earth observation satellite and related software were utilized to determine the sampling points. After compiling the data in a suitable format, the soil durability map of the region was created with the kriging interpolation method as a statistical technique. Table 1. Engineering properties of soil in the study province Sample Gd Sw Wt Sieve analysis Atterberg limits Bc
USCS FL
SPT-N60 Vs
Id meter kN/m3 % % > # 4 % < # 200 % LL % PL % PI kg/cm2 6.0 m/sn 1 4.0 17.96 29.4 4.5 67.8 22 19 3 0.82 ML 0.90 6.00 159.13 2 4.0 18.27 13.7 3.0 72.2 25 15 10 0.69 ML 1.02 7.20 169.55 3 3.5 17.67 28.4 5.0 26.5 - - - 1.82 SC 0.54 8.40 178.90 4 3.5 17.34 32.2 2.0 74.0 39 23 16 0.83 CL 0.75 14.40 215.80 5 3.0 17.84 32.6 - 90.0 42 28 14 0.68 ML 0.77 10.80 195.25 6 4.0 18.25 9.3 67.0 15.0 - - - 1.56 GC 0.93 9.60 187.40 7 3.6 18.12 11.3 - 61.0 26 22 4 0.73 ML 0.84 8.40 178.90 8 3.8 17.97 24.0 24.0 0.2 57 42 25 1.04 CL 0.88 9.60 187.40 9 3.6 17.59 29.0 - 90.6 41 30 11 1.17 ML 0.81 8.40 178.90 10 3.5 17.45 28.0 4.7 74.2 39 37 2 1.04 ML 0.77 14.40 215.80 11 4.9 17.76 13.3 51.0 8.0 - - - 1.95 GW 1.10 18.00 233.23 12 3.9 18.30 16.7 0.2 80.9 30 20 10 1.04 CL 0.75 15.60 221.90 13 7.0 17.60 41.0 6.0 32.0 - - - 1.82 SM 0.85 16.80 227.70 14 4.3 20.26 28.4 1.8 29.1 - - - 1.43 SC 0.73 19.20 238.53 15 4.3 19.59 29.5 2.9 40.0 - - - 1.69 SC 0.74 10.80 195.25 16 4.0 17.92 14.2 3.4 35.1 - - - 1.56 SM 0.78 20.40 243.61 17 4.0 18.94 13.1 44.0 13.0 - - - 1.56 SM 0.63 9.60 187.40 18 4.4 17.97 41.4 15.7 58.1 28 25 3 1.17 ML 0.95 7.20 169.55 19 4.3 18.28 23.7 - 78.8 25 23 2 1.43 ML 0.74 10.80 195.25 20 3.0 18.56 35.3 3.0 68.7 36 24 12 1.04 ML 1.31 10.80 195.25
J. Int. Environmental Application & Science, Vol. 11(3): 229-240 (2016)
232
21 4.5 18.24 42.1 4.0 70.0 41 30 11 0.91 ML 0.78 9.60 187.40 22 4.0 18.82 39.5 - 98.5 39 30 9 1.04 ML 0.75 8.40 178.90 23 4.1 17.69 18.9 - 29.0 - - - 1.43 SM 0.70 7.20 169.55 24 4.4 18.13 21.8 2.9 64.5 31 23 8 1.17 ML 0.70 18.00 233.23 25 5.3 18.29 28.5 - 72.2 36 20 16 0.91 CL 0.83 15.60 221.90 26 4.5 17.96 30.8 8.0 50.0 29 23 6 1.04 ML 0.63 16.80 227.70 27 4.5 18.26 17.0 - 64.7 52 25 27 1.37 CH 0.79 19.20 238.53 28 4.1 18.51 42.6 - 73.2 84 44 40 1.39 CH 1.03 8.40 178.90 29 3.8 18.18 21.3 4.0 28.3 - - - 1.63 SC 0.99 21.60 248.51 30 5.7 18.12 21.0 7.0 12.3 - - - 1.76 SM 0.70 16.80 227.70 31 4.0 18.48 27.2 16.0 61.0 31 20 11 1.01 CL 0.77 19.20 238.53 32 3.6 18.25 13.3 4.6 63.3 26 17 9 1.03 CL 0.76 20.40 243.61 33 4.0 18.40 45.9 11.1 67.5 33 21 12 0.95 CL 0.79 21.60 248.51 34 4.5 18.86 26.4 15.0 29.0 - - - 1.82 SM 0.61 20.40 243.61 35 6.2 18.34 19.2 - 38.2 - - - 1.43 SC 1.11 19.20 238.53 36 6.0 18.60 25.0 - 22.3 - - - 1.43 SM 0.96 16.80 227.70 37 7.0 19.48 17.7 41.0 38.7 - - - 1.74 SC 1.67 13.20 209.37 38 5.2 18.38 20.1 1.2 26.0 - - - 1.56 SM 0.82 14.40 215.80 39 4.5 20.15 36.3 2.0 41.0 - - - 1.46 SM 0.63 15.60 221.90 40 6.3 19.34 26.1 4.2 25.9 - - - 1.69 SM 1.25 18.00 233.23 41 6.8 19.05 22.3 0.4 32.3 - - - 1.60 SM 1.43 19.20 238.53 42 4.3 18.63 17.8 20.5 13.4 - - - 1.72 SM 0.58 8.40 178.90 43 4.3 18.45 20.0 9.4 25.0 - - - 1.76 SM 0.60 6.00 159.13 44 6.4 17.81 18.6 4.1 31.8 - - - 1.69 SM 1.23 9.60 187.40 45 4.8 18.84 25.8 - 23.2 - - - 1.47 SM 0.60 7.20 169.55 46 4.4 18.22 13.7 14.0 72.0 53 27 26 1.47 CH 0.88 8.40 178.90 47 4.4 18.48 37.8 - 98.1 44 34 10 1.26 ML 0.80 19.20 238.53 48 4.5 17.24 37.0 - 90.0 40 22 18 1.03 CL 0.81 10.80 195.25 49 2.5 17.68 29.1 12.0 78.0 38 17 21 1.08 CL 0.68 9.60 187.40 50 4.0 18.00 32.6 2.0 63.0 38 23 15 0.88 CL 0.82 13.20 209.37 51 3.5 17.95 36.2 2.0 58.0 33 27 6 1.25 ML 0.90 15.60 221.90 52 3.9 18.10 17.0 0.6 66.4 34 28 6 1.43 ML 1.00 14.40 215.80 53 4.2 19.00 11.1 - 73.2 37 29 8 1.01 ML 1.05 8.40 178.90 54 4.2 17.93 28.0 4.3 89.1 48 34 14 0.98 ML 1.04 10.80 195.25 55 4.6 18.34 25.0 - 42.8 - - - 1.52 SM 1.09 18.00 223.86 56 4.8 18.34 13.8 2.0 81.0 53 27 26 1.61 CH 1.11 8.00 167.90 57 4.9 18.32 19.9 14.6 68.9 48 26 22 1.43 CL 1.12 11.00 149.34 58 4.8 17.76 21.7 6.0 59.8 43 35 8 1.37 ML 1.10 13.00 175.88 59 5.7 18.40 23.8 1.0 91.5 37 26 11 1.17 ML 1.25 8.40 159.13 60 3.8 18.75 28.2 - 37.3 - - - 1.56 SM 0.97 14.00 228.64 61 3.3 18.96 29.4 - 28.3 - - - 1.46 SM 0.71 16.00 223.86 62 3.5 18.06 13.7 2.0 81.0 53 27 26 1.50 CH 0.86 7.00 167.90 63 3.8 18.33 25.0 - 63.2 32 30 2 1.11 ML 0.70 7.00 213.70 64 5.7 17.64 22.7 5.0 60.0 36 26 10 0.85 ML 1.13 5.00 223.86 65 5.4 17.81 23.0 13.0 55.0 25 22 3 1.27 ML 0.80 8.00 183.24 66 4.9 17.84 27.9 - 88.0 34 17 17 1.07 CL 0.64 8.00 159.13 67 4.2 17.77 42.0 - 85.0 33 21 12 1.13 CL 0.75 7.00 167.90 Gd; depth of groundwater level, Sw; unit weight, Wt; water content of the soil, LL; liquid limit, PL; plastic limit, PI; plasticity index, Bc; bearing capacity, USCS; The Unified Soil Classification System, FL; liquefaction resistance factor, Vs; shear wave velocity, N60; average SPT values Determination of criteria
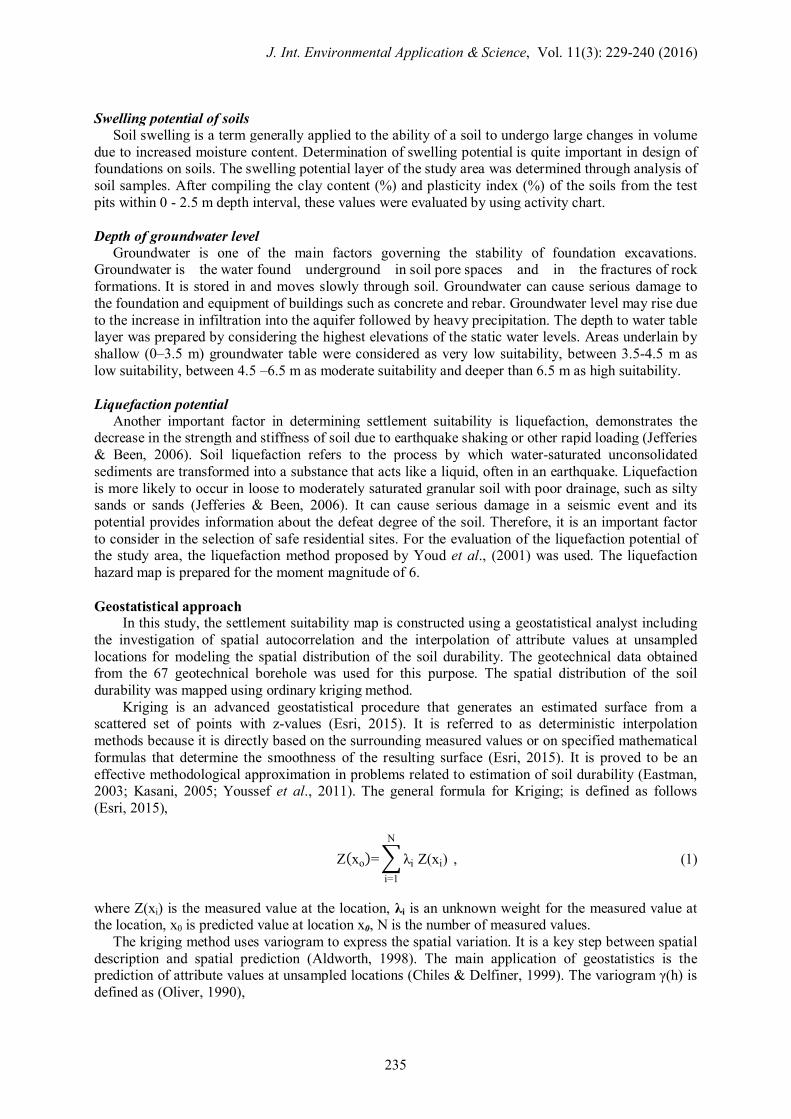
In this study, the problem was defined as the selection of safe sites to be used as residential areas. In the establishment of this study, the first stage was the identification of the criteria. The settlement suitability map is conducted on geotechnical and hydrogeological criteria (depth of groundwater level, local soil classifications, swelling potential, shear wave velocity, corrected SPT-N60, liquefaction potential) (Figure 2). Furthermore, as the main indicator of the soil durability, local conditions can also result in some variations in the criteria selected. They are the main indicators affecting soil durability. Therefore, in the selection of the criteria, the actual conditions of the study area, the complexity of problem, environmental quality and stability, easy data acquisition and relatively easy quantization of quantitative indices were taken into consideration. The slope criterion was excluded from the calculation due to the slope values of the study area being lower than 5 degrees. The range values assigned to geotechnical and hydrogeological criteria (Table 2). Weights are calculated for each criteria. Overlay analysis was then used to create the settlement suitability map.
J. Int. Environmental Application & Science, Vol. 11(3): 229-240 (2016)
233
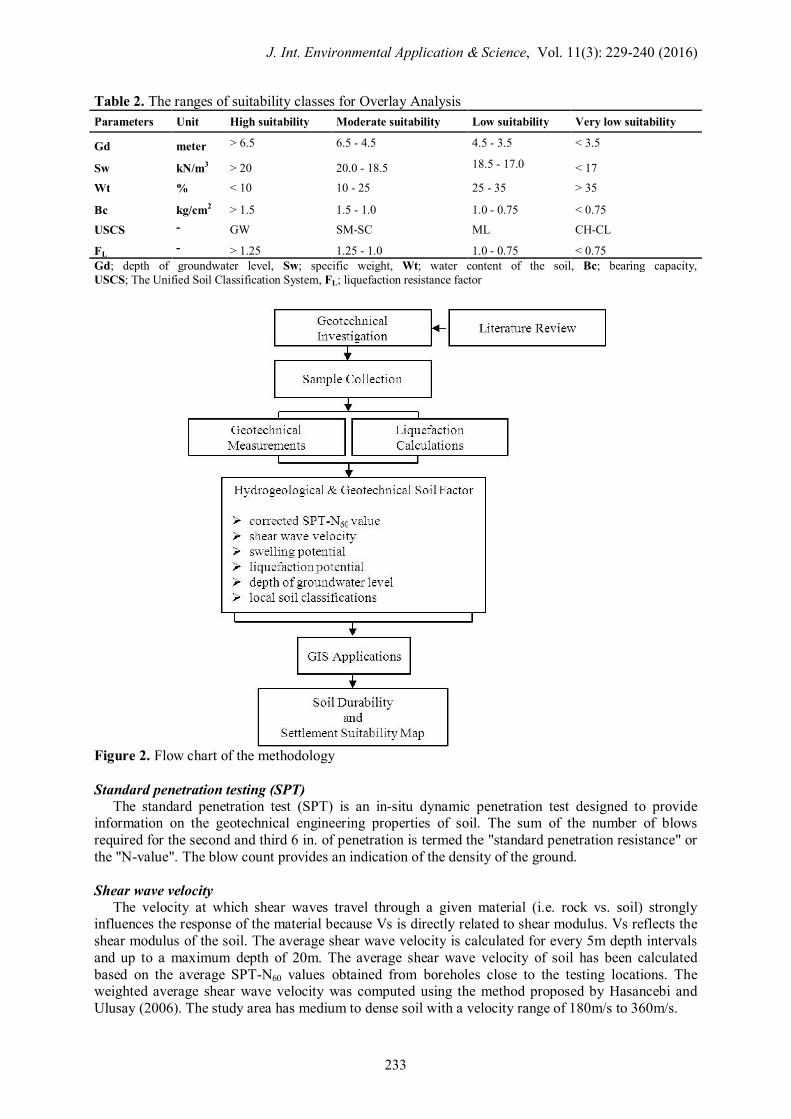
Table 2. The ranges of suitability classes for Overlay Analysis
Parameters Unit High suitability Moderate suitability Low suitability Very low suitability
Gd meter > 6.5 6.5 - 4.5 4.5 - 3.5 < 3.5
Sw kN/m3 > 20 20.0 - 18.5 18.5 - 17.0 < 17
Wt % < 10 10 - 25 25 - 35 > 35
Bc kg/cm2 > 1.5 1.5 - 1.0 1.0 - 0.75 < 0.75
USCS - GW SM-SC ML CH-CL
FL - > 1.25 1.25 - 1.0 1.0 - 0.75 < 0.75 Gd; depth of groundwater level, Sw; specific weight, Wt; water content of the soil, Bc; bearing capacity, USCS; The Unified Soil Classification System, FL; liquefaction resistance factor
Figure 2. Flow chart of the methodology Standard penetration testing (SPT)
The standard penetration test (SPT) is an in-situ dynamic penetration test designed to provide information on the geotechnical engineering properties of soil. The sum of the number of blows required for the second and third 6 in. of penetration is termed the "standard penetration resistance" or the "N-value". The blow count provides an indication of the density of the ground. Shear wave velocity
The velocity at which shear waves travel through a given material (i.e. rock vs. soil) strongly influences the response of the material because Vs is directly related to shear modulus. Vs reflects the shear modulus of the soil. The average shear wave velocity is calculated for every 5m depth intervals and up to a maximum depth of 20m. The average shear wave velocity of soil has been calculated based on the average SPT-N60 values obtained from boreholes close to the testing locations. The weighted average shear wave velocity was computed using the method proposed by Hasancebi and Ulusay (2006). The study area has medium to dense soil with a velocity range of 180m/s to 360m/s.

J. Int. Environmental Application & Science, Vol. 11(3): 229-240 (2016)
234
Local soil classification
Soil is derived from the breakdown of rock material by weathering or erosion and it may have suffered some amount of transportation prior to deposition (Bell, 1992). The definition and classification of soil differs according to the field and purposes. For example, engineers classify soil according to its engineering properties since they focus on its use as a foundation support or building material. This sort of classification provides information about the durability of the soil (Sara, 2003), and the classified types are generally named after the primary constituent particle size or a combination of the most abundant particle sizes (Rowell, 1994). Similarly, the soil in the study area of the current study was grouped into the following six units: high-plasticity clay (CH), low-plasticity clay (CL), low-plasticity silt (ML), clayey sand (SC), silty sand (SM) and well-graded gravel (GW) (Figure 3). If particles are transported, then this affects their character, particularly their grain-size distribution, sorting and shape (Bell, 1992). The bearing capacity increases with the grain size (Sara, 2003).
Fıgure 3. Criteria maps for soil durability and settlement suitability analysis; (a) liquefaction potential, (b) depth of groundwater level, (c) local soil classifications, (d) SPT-N60 value, (e) shear wave velocity and (f) swelling potential
J. Int. Environmental Application & Science, Vol. 11(3): 229-240 (2016)
235
Swelling potential of soils
Soil swelling is a term generally applied to the ability of a soil to undergo large changes in volume due to increased moisture content. Determination of swelling potential is quite important in design of foundations on soils. The swelling potential layer of the study area was determined through analysis of soil samples. After compiling the clay content (%) and plasticity index (%) of the soils from the test pits within 0 - 2.5 m depth interval, these values were evaluated by using activity chart. Depth of groundwater level
Groundwater is one of the main factors governing the stability of foundation excavations. Groundwater is the water found underground in soil pore spaces and in the fractures of rock formations. It is stored in and moves slowly through soil. Groundwater can cause serious damage to the foundation and equipment of buildings such as concrete and rebar. Groundwater level may rise due to the increase in infiltration into the aquifer followed by heavy precipitation. The depth to water table layer was prepared by considering the highest elevations of the static water levels. Areas underlain by shallow (0–3.5 m) groundwater table were considered as very low suitability, between 3.5-4.5 m as low suitability, between 4.5 –6.5 m as moderate suitability and deeper than 6.5 m as high suitability. Liquefaction potential
Another important factor in determining settlement suitability is liquefaction, demonstrates the decrease in the strength and stiffness of soil due to earthquake shaking or other rapid loading (Jefferies & Been, 2006). Soil liquefaction refers to the process by which water-saturated unconsolidated sediments are transformed into a substance that acts like a liquid, often in an earthquake. Liquefaction is more likely to occur in loose to moderately saturated granular soil with poor drainage, such as silty sands or sands (Jefferies & Been, 2006). It can cause serious damage in a seismic event and its potential provides information about the defeat degree of the soil. Therefore, it is an important factor to consider in the selection of safe residential sites. For the evaluation of the liquefaction potential of the study area, the liquefaction method proposed by Youd et al., (2001) was used. The liquefaction hazard map is prepared for the moment magnitude of 6. Geostatistical approach
In this study, the settlement suitability map is constructed using a geostatistical analyst including the investigation of spatial autocorrelation and the interpolation of attribute values at unsampled locations for modeling the spatial distribution of the soil durability. The geotechnical data obtained from the 67 geotechnical borehole was used for this purpose. The spatial distribution of the soil durability was mapped using ordinary kriging method.
Kriging is an advanced geostatistical procedure that generates an estimated surface from a scattered set of points with z-values (Esri, 2015). It is referred to as deterministic interpolation methods because it is directly based on the surrounding measured values or on specified mathematical formulas that determine the smoothness of the resulting surface (Esri, 2015). It is proved to be an effective methodological approximation in problems related to estimation of soil durability (Eastman, 2003; Kasani, 2005; Youssef et al., 2011). The general formula for Kriging; is defined as follows (Esri, 2015),
Z(xo)= � λi Z(xi)
N
i=1
, (1)
where Z(xi) is the measured value at the location, λi is an unknown weight for the measured value at the location, x0 is predicted value at location x0, N is the number of measured values.
The kriging method uses variogram to express the spatial variation. It is a key step between spatial description and spatial prediction (Aldworth, 1998). The main application of geostatistics is the prediction of attribute values at unsampled locations (Chiles & Delfiner, 1999). The variogram γ(h) is defined as (Oliver, 1990),
J. Int. Environmental Application & Science, Vol. 11(3): 229-240 (2016)
236
γ(h) =1
2n � [Z(xi) - Z(xi+h)]2
n
i=1
, (2)
where γ(h) = estimated value of the semivariance for lag h; n(h) is the number of experimental pairs separated by vector h; z(xi ) and z(xi +h) is the sample value at two points separated by the distance interval h.
In this study, the semivariograms were fitted with various theoretical models like spherical, exponential, gaussian and linear in order to obtain the most accurate estimations. I used variable lag sizes, which allow the spatial autocorrelation in soil durability maps to be captured quite well, especially at short distances. I have achieved a model to describe the spatial autocorrelation. The Exponential model that gave minimum standard error was selected as the best-fit model.
Differences between estimated and observed values are summarised using the crossvalidation statistics. The root mean square standardized error value (R2) is used as the error indicator to inspect the prediction quality in cross-validation. The root mean square standardized error should be close to 1 (Esri, 2015). Root mean square standardized error (R2) is the square root of the average squared distance of a data point from the fitted line calculated with the following equation,
R2=�1
n� (y�
i-y
i)2
n
i=1
, (3)
where ��� and �� are the measured and estimated arsenic levels, respectively, of the i data point and n is the total number of data points. Results and Discussion Assessment of spatial distribution of soil durability
In this study was evaluated the spatial distribution of soil durability using the data obtained from the overlay analysis. Overlay analysis is a common method for creating a suitability model which involves using GIS techniques and software (Esri, 2015) The root mean square standardized error of the settlement suitability map was found to be 0.96. The results of cross-validation show that the chosen model and parameters were adequate in satisfying the selected criteria. Figure 4 presents the spatial distribution of settlement suitability in the study area. Soil durability in different zones of the study area was classified as highly suitable, moderately suitable, poorly suitable and unsuitable as shown in Table 3. In this classification, (i) highly suitable means that there are no threats to the durability of the soil, (ii) moderately suitable indicates that there is very little threat to the durability of the soil, (iii) poorly suitable refers to protected but occasionally threatened or impaired soil and (vi) unsuitable refers to soil durability that is almost always threatened or impaired. In the northwestern and southeastern of the study area, soil durability was found to be unsuitable whereas in the middle parts, it was highly suitable. Table 3 Soil durability and settlement suitability ranking criteria
Category- Rank Interpretation
Highly suitable The most suitable for settlement
Moderately suitable Generally suitable for settlement, slightly influenced by poor soil conditions Poorly suitable Inconvenient for settlement, influenced by poor soil conditions to some extent Unsuitable Extremely hazardous for settlement, largely influenced by poor soil conditions
The areas that were unsuitable or poorly suitable were concentrated in the northwestern and
southeastern portions of the city, which represent approximately 66.8 percent of the total area. Soil in this region is generally differentiated and wet. Mainly developed from Quaternary alluvium deposits, it has a good texture and high organic matter content. According to the data obtained from geotechnical borehole, the soil in region had very low durability and comprised a sequence of silty

J. Int. Environmental Application & Science, Vol. 11(3): 229-240 (2016)
237
sand, loosely clay, silt, plastic clay and gravel layers, up to 20 m. deep. This sequence indicates the presence of a depositional environment created by floodwater with turbulent flow characteristics. Soil properties often vary in the horizontal and vertical direction. This is directly related to the stream's energy and ability to transport sediments. In the study area, groundwater was close to the surface (0-5 m) and the liquefaction potential was observed to increase with the distance from northeast.
Figure 4. Soil durability and settlement suitability map of the study area
Approximately 29.8 percent of the study area was identified as moderately suitable for settlement. These areas are discontinuously distributed in the central part of the study area and are concentrated in the northeastern and southwestern portions of the city. This area is largely occupied by sand having good strength and durability properties. Highly suitable areas represent approximately 3.4% of the study area and are mostly located in the central part of the city. According to the field observations and the results of the research, we suggest that the central, northeastern and southwestern parts of the region be given the first priority for urban development in Aksaray. Conclusions
In this article, a map based on soil durability was developed to determine safe residential sites using the GIS method. The settlement selection criteria were determined according to the international literature. The settlement suitability map is conducted on geotechnical and hydrogeological criteria (depth of groundwater level, local soil classifications, swelling potential, shear wave velocity, corrected SPT-N60, liquefaction potential). For the analysis of settlement suitability, overlay analysis was used. This is mostly an indirect approach based on the linear combination of each criterion. In this way, a score showing the suitability rate of soil durability was obtained for the selection of safe residential sites. Based on this score, four classes were defined as highly suitable, moderately suitable, poorly suitable and unsuitable.
The selection of safe settlement areas is crucial for Turkey being one of the most seismically active areas in the world. The city of Aksaray was selected as the study area because it is located on the Lake Tuz Fault and has poor soil durability. Furthermore, using the overlay analysis and the kriging method, the settlement suitability map of Aksaray was created. This map provides optimal settlement selection to minimize natural hazards. The results indicate that 3.4% of the study area is

J. Int. Environmental Application & Science, Vol. 11(3): 229-240 (2016)
238
highly suitable, 29.8% is moderately suitable, 44.3% is poorly suitable and 22.5% is unsuitable for settlement. The map showed that the northeastern and southwestern parts of the study area had highly durable soil. Poor soil durability was observed in 20 km2 of the study area while 10 km2 was suitable for settlement purposes. According to the results of the research, the northeastern and southwestern parts of the study area had more reliable geotechnical conditions compared to the northwestern and southeastern parts.
Geotechnical data indicate that the soil formed in alluvium has a wide range of surface textures from clay loam to loamy sand, and the infiltration rates vary from slow to rapid. The shear wave velocity values in the study area ranged from 149.3 to 248.5 m/sn. The soil durability map was in agreement with the geotechnical observations and prior knowledge. Earthquakes that may occur in the study area can create high accelerations in the soil. The study area also has a high liquefaction risk in northwestern and southeastern parts where the water table is very close to the surface. The results of the study indicate that the proposed map is useful and reliable in determining the optimal areas for urban development. In addition, the results of the study can be used by urban and regional planners as a guide in the selection of residential areas. References Aldworth J, (1998) Spatial Prediction, Spatial Sampling, and Measurement Error. Ph.D. Thesis, Iowa
State University, 186 p. Alonso W, (1964) Location and Land use. Harvard University Press, Cambridge, MA. Altas L, Isik M, Kavurmaci M, (2011) Determination of arsenic levels in the water resources of
Aksaray Province, Turkey. Journal of Environmental Management 92: 2182–2192. Aly MH, Giardino JR, Klein AG, (2005) Suitability assessment for New Minia City, Egypt: A GIS
approach to engineering geology. Environmental & Engineering Geoscience, 9(3), 259–269. Amano K, Tsunekazu T, Hirofumi A, (1987) Development and Application of a Hierarchical Land-
Use Model. Memoirs of the Faculty of Engineering, Kyoto University XLIX, 4: 326-57. Arnous MO, (2013) Geotechnical site investigations for possible urban extensions at Suez City, Egypt
using GIS. Arabian Journal of Geosciences, 6, (5): 1349-1369. ASTM D 1586-11, (2011) Standard Test Method for Standard Penetration Test (SPT) and Split-Barrel
Sampling of Soils. American Society for Testing and Materials, Philadelphia, PA. Aydoner C, Maktav D, (2013) Settlement suitability analysis in terms of earthquake (in Turkish),
Journal of Aeronautics and Space Technologies, 6: 53-62 (in Turkish with English abstract). Bell FG, (1992) Engineering Properties of Soils and Rocks, 3rd.ed., Butterworth-Heinemann, Boston,
345 p. Bowles JE, (1984) Physical and geotechnical properties of soils, 2nd edn. McGraw-Hill, New York,
NY. Chiles JP, Delfiner P, (1999) Geostatistics: Modeling Spatial Uncertainty. New York: John Wiley &
Sons, 449–471. Collins MG, Steiner FR, Rushman MJ, (2001) Land-use suitability analysis in the United States:
historical development and promising technological achievements. Environ Manage 28,611–621. Dai FC, Lee CF, Zhang XH, (2001) GIS-based geo-environmental evaluation for urban land use
planning: a case study, Engineering Geology, 61/4, 257–271. Degerliyurt M, (2014) Settlement suitability analysis of local ground characteristics in Iskenderun: A
case study. Procedia - Social and Behavioral Sciences 120: 637–644 Eastman JR, (2003) IDRISI Kilimanjaro: Guide to GIS and Image Processing. Clark Laboratories,
Clark University, Worcester, p. 328. Elhatip H, Afsin M, Kuscu I, Dirik, K, Kurmac Y, Kavurmaci M, (2004) Estimation of environmental
impacts on the water quality of İncesu-Dokuzpınar springs in Kayseri, Turkey. Bulletin of Engineering Geology and the Environment, 63(3): 255-260.
Er B, (2002) Preparation of a sample of geotechnical data base for the central area of Aksaray city by evaluating soil and engineering geology properties. Master Thesis, Nigde University, Nigde, Turkey, 57 p. (in Turkish with English abstract).
Esri, (2015) ArcMap 10.1 Help File. Online, http://resources.arcgis.com/en/help/main/10.1/ Accessed October 25, 2015.

J. Int. Environmental Application & Science, Vol. 11(3): 229-240 (2016)
239
Guiqin W, Li Q, Guoxue L, Lijun C, (2009) Landfill site selection using spatial information technologies and AHP: A case study in Beijing, China, Journal of Environmental Management 90: 2414–2421.
Halik W, Mamat A, Dang JH, Deng BSH, Tiyip T, (2013) Suitability analysis of human settlement environment within the Tarim Basin in Northwestern China. Quaternary International, 311, 175-180.
Harris B, (1985) Urban Simulation Models in Regional Science. Journal of Regional Science 25, 545-67.
Hasancebi N, Ulusay R (2006) “Empirical correlations between shear wave velocity and penetration resistance for ground shaking assessments,” Bull Eng Geol Environ, 66, 203-213.
Herbert JS, Benjamin HS, (1960) “A Model of the Distribution of Residential Activity in Urban Areas”, Journal of Regional Science, 2, 21-36.
Jefferies M, Been K, (2006) Soil Liquefaction: A Critical State Approach, Second Edition, Taylor & Francis Group, CRC pres, p. 690.
Karaoglu GT, (2013) Engineering geology and investigation of suitability for settlement area of Istanbul Kucukcekmece. Master Thesis, Istanbul Technical University, Istanbul, Turkey, 107 p. (in Turkish with English abstract).
Kasani RB, (2005) A new method for site suitability analysis: the analytic hierarchy process. Environmental Management, 13, 685–693.
Kolat C, Doyuran V, Ayday C, Süzen ML, (2006) Preparation of a geotechnical microzonation model using geographical information systems based on multicriteria decision analysis. Engineering geology, 87, 241-255.
Kurnaz TF, Ramazanoglu S, (2014) The interrogation of settlement suitability by using GIS, a case study in Esenler (Istanbul), Sakarya Un. J. Sci., 18, 171-182. (in Turkish with English abstract).
Malczewski J, (2004) GIS-based land-use suitability analysis: a critical overview. Progr Plann 62 (1):3–65.
Mitchell JK, Soga K, (2005) Fundamentals of soil behavior. Third edition, John Wiley and Sons, Inc., ISBN 978-0-471-46302-3.
Mohammadi Z, Limaei SM. (2014) Selection of appropriate criteria in urban forestry (Case study: Isfahan city, Iran). Journal of Forest Science, 60, 487–794.
Montoya L, Masser I, (2005) Management of natural hazard risk in Cartago, Costa Rica. Habitat International, 29: 493-509.
Oliver MA, (1990) Kriging: A method of interpolation for geographical information systems. International Journal of Geographic Information Systems 4, 313–332.
Putman SH, (1979) Urban Residential Location Models. Martinus Nijhoff Publishing, 169 p. Robertson PK, Wride CE, (1998) Evaluating cyclic liquefaction potential using the cone penetration
test. Canadian Geotechnical J., 35 (3): 442–59. Romano G, Sasso PD, Liuzzi GT, Gentile F, (2015) Multi-criteria decision analysis for land suitability
mapping in a rural area of Southern Italy. Land Use Policy, 48: 131–143. Rowell D (1994) Soil Science; Methods and Application, Longman Scientific & Technical, 350 p. Santamarina JC, Klein KA, Fam MA, (2001) Soils and Waves: Particulate Materials Behavior,
Characterization and Process Monitoring. Wiley. ISBN 978-0-471-49058-6. Sara MN, (2003) Site Assessment and Remediation Handbook, Second Edition, CRC Press, p. 1160. Sener S, Sener E, Nas B, Karaguzel R, (2010) Combining AHP with GIS for landfill site selection:
Acase study in the Lake Beysehir catchment area (Konya, Turkey). Waste Management 30: 2037–2046.
Siddiqui M, Everett JM, Vieux BE, (1996) Landfill siting using geographical information systems: a demonstration. J. Environ. Eng. 122, 515–523.
Store R, Kangas K, (2001) Integrating spatial multi-criteria evaluation and expert knowledge for GIS-based habitat suitability modelling”, Landscape and Urban Planning, 55/2, 79–93.
Swan CC, (2015) Supplemental notes; foundations on weak and compressible soils. 53: 139 Foundations of Structures, The University of Iowa, Online Available: http://user.engineering.uiowa.edu/~swan/courses/53139/notes/weak_compressible_soils.pdf [Accessed December 15, 2015].

J. Int. Environmental Application & Science, Vol. 11(3): 229-240 (2016)
240
Teke M, (2002) Investigation of the geotechnical properties of the soils in the area of Bahçeli town in Aksaray city. Master Thesis, Nigde University, Nigde, Turkey, 112 p. (in Turkish with English abstract).
Terzaghi K, Peck RB, (1967) Soil mechanics in engineering practice. 2nd edition, John Wiley & Sons, New York, 729 p.
Tudes S, Yigiter ND, (2010) Preparation of land use planning model using GIS based on AHP: case study Adana-Turkey. Bulletin of engineering geology and the environment, 69, 235-245.
Youd TL, Idriss I, Andrus R, Arango I, Castro G, Christian J, Dobry R, Finn WDL, Harder L, Jr, Hynes M, Ishihara K, Koester J, Liao S, Marcuson W, III, Martin G, Mitchell J, Moriwaki Y, Power M, Robertson P, Seed R, Stokoe KH, (2001) "Liquefaction Resistance of Soils: Summary Report from the 1996 NCEER and 1998 NCEER/NSF Workshops on Evaluation of Liquefaction Resistance of Soils." Journal of geotechnical and geoenvironmental engineering, 127, 817-833.
Youssef MA, Pradhan B, Tarabees E, (2011) Integrated evaluation of urban development suitability based on remote sensing and GIS techniques: contribution from the analytic hierarchy process. Arab J Geosci, 4, 463-473.
Zopounidis C, Doumpos M, (2002) Multicriteria classification and sorting methods: A literature review. Eu. J. Oper. Re., 138, 229–246.
Wilson AG, (1970) Entropy in Urban and Regional Modelling. London: Pion.