Settlement Hierarchy Methodology - Calderdale
23
Settlement Hierarchy Methodology Evidence Base Published November 2009
Transcript of Settlement Hierarchy Methodology - Calderdale
Settlement HierarchyMethodology
Evidence BasePublished November 2009


21 Introduction
42 Policy Context
4National Policy
4Regional Policy
5Local Policy
63 Methodology - research data
84 Methodology - modelling
205 Amendments to the methodology
List of Figures
8Figure 4.1 Example grid of model sample area11Figure 4.2 Example service/facility point with buffer applied12Figure 4.3 Example of RouteFinder catchment area17Figure 4.4 Example of grid squares extracted for settlement identification18Figure 4.5 Town centre identification exercise19Figure 4.6 Other settlements identification exercise
List of Tables
6Table 3.1 Data Collection Sources9Table 4.1 Data criteria11Table 4.2 Average road speeds for public and private transport13Table 4.3 Assessment criteria14Table 4.4 Scoring bands for each of the scoring methods16Table 4.5 Categorisation and weighting of assessment criteria20Table 5.1 Major changes to the settlement hierarchy model methodology
Contents
Set
tlem
ent
Hie
rarc
hy M
eth
od
olo
gy
Pu
blis
hed
Nov
emb
er 0
9
1 Introduction
1.1 This document outlines the methodology and model employed to undertake the Settlement HierarchyStudy for Calderdale. Outputs from the model, and the resulting recommended settlement hierarchy arecontained in a separate document 'Settlement Hierarchy Results'.This has been done so that the resultscan be updated regularly without having to re-publish the methodology and model for each update. Inaddition, readers who are interested only in the results and outputs are not faced with the technical detailsand background contained within this report.
Sustainable development
1.2 Government has given local planning authorities the responsibility for ensuring that future new developmentshould embody, as far as possible, the principles of sustainable development. The Calderdale LocalDevelopment Framework (LDF), which will gradually replace the existing development plan (ReplacementCalderdale Unitary Development Plan), will be a significant contributor to ensuring that sustainabledevelopment is achieved in the future.
1.3 The benchmark for assessing sustainability and sustainable development in the UK is “Securing OurFuture” (March 2005). It builds upon “A Better Quality of Life, A Strategy for Sustainable Developmentfor the UK” published by the Government in 1991. Planning Policy Statement 1 (PPS1) “DeliveringSustainable Development”, published in January 2005, emphasises the need for the planning processto deliver sustainable development. The strategy recognises that in achieving sustainable development,four inter-related and equally important objectives need to be fulfilled. These are:
social progress which recognises the needs of everyone;effective protection of the environment;prudent use of natural resources; andmaintenance of high and stable levels of economic growth and employment;
1.4 Future patterns of development in Calderdale will need to embrace these four central sustainabilityobjectives, within the context of specific local sustainability criteria. Achieving sustainable developmentis now at the heart of the development plan process and the emerging LDF will need to embracesustainability in future development options.
1.5 Establishing a Settlement Hierarchy is one of the most important ways that the Calderdale LDF can helpcontribute to the principals of sustainable development. This Settlement Hierarchy Study is thereforeone of the key pieces of evidence for the Calderdale LDF.
What is a settlement hierarchy
1.6 Settlements work by providing services for a wider area. The bigger the settlement the more services ittends to have. Over time a settlement hierarchy has developed in the district with Halifax being placedat the top of the hierarchy providing the majority of the services. The smaller settlements have beenlimited to providing local services. As car ownership has increased this has led to a decline in servicesin many smaller settlements.
1.7 This study implements a settlement hierarchy model that provides a snapshot in time of the facilitiesavailable within the different settlements of Calderdale, and crucially the accessibility to those services.The Council’s methodology for this study has evolved from the concept of settlement hierarchies as setout within the Regional Spatial Strategy (2008) (RSS).
1.8 The identification of service level provision, and their accessibility are factors that provide a basis forindicating the sustainability of different settlements and their ability to accommodate future growth. Thesettlement hierarchy model will also indicate where there are deficiencies within a settlement that couldbe addressed through development or other means.
1.9 The information gained from the results of this model will be used to inform the spatial options for theCore Strategy and Land Allocations and Designations Development Plan Documents for the CalderdaleLDF.
Introduction2
1
Pu
blish
ed N
ovemb
er 09 Settlem
ent H
ierarchy Meth
od
olo
gy

Consultation upon the model
1.10 The methodology detailed in this report represents the final version of the settlement hierarchymethodology. However it is anticipated that the results document will periodically be updated as newdata becomes available.
1.11 The Calderdale settlement hierarchy model has modified regional work (undertaken for the RSS) toprovide a greater level of detail for each of the settlements within the district. To assess the level whichdifferent settlements are located and classified within the hierarchy, a number of criteria have beendeveloped. The criteria and the overall methodology have been subject to two periods of consultation.
1.12 Firstly between May 2008 and June 2008 an initial methodology was proposed and consulted on alongsidea questionnaire to indicate the importance respondents gave to each of the criteria developed. Followingthis consultation a number of amendments were made to the methodology and the criteria were weightedto provide emphasis upon those services and facilities considered most important.
1.13 A second stage of consultation was undertaken between 17th November 2008 and 30th January 2009.This consultation was aimed at refining the methodology to provide a robust framework against whichto identify a Calderdale settlement hierarchy and the relative sustainability of different settlements andareas of the district. Amendments to the methodology have been made for this final version in light ofcomments received. These are discussed in more detail in section 5.
3Introduction
1
Set
tlem
ent
Hie
rarc
hy M
eth
od
olo
gy
Pu
blis
hed
Nov
emb
er 0
9
2 Policy Context
National Policy
2.1 The main relevant sources of national policy in relation to establishing a settlement hierarchy are PPS1(Delivering Sustainable Development); PPS3 (Housing); PPS6 (Planning for Town Centres); PPS7(Sustainable Development in Rural Areas), PPG13 (Transport) and the draft PPS 4 (Planning forProsperous Economies). They state that:
Most new development should be directed to existing towns and cities, to help maximise accessibilityto employment and services by walking, cycling and public transport.In rural areas, development should be focused on settlements that can act as service centres forsurrounding areas.In open countryside small ribbons of housing development with no services are not usuallyappropriate for further housing.Location of new development should take into account the accessibility to existing communityfacilities, infrastructure and services, including public transport.The location of new housing shouldfacilitate the creation of communities of sufficient size and mix to justify the development of, andsustain, community facilities, infrastructure and services.
Regional Policy
2.2 The Yorkshire and Humber RSS takes these national principles further and provides a settlement strategycontext for the region. This strategy identifies roles for the main towns and cities across the Yorkshireand Humber region.The regional policy context was based upon a Regional Settlement Study, undertakenin 2004. This study considered a total of 233 settlements across the Yorkshire and Humber Region (themain cities of Leeds, Bradford, Hull and Sheffield were not studied).
2.3 Each of the 233 settlements were scored against a range of criteria, primarily concerning the availabilityof services such as financial, education, leisure and health. Each settlement was then provided with anaggregate score and ranked accordingly. The ranks (hierarchy) used were
Sub-regional centre;Principal Centre;Local Service Centre; andBasic Service Centre.
2.4 Within Calderdale Halifax and Brighouse were named as Sub-regional and Principal Centres respectively.Policies YH5 and YH6 of the emerging RSS indicate that these settlements should be the main foci forhousing, employment, shopping, leisure, education, health and cultural activities and facilities within thedistrict.
2.5 In addition to Halifax and Brighouse the following settlements were identified as Local Service Centres;
EllandHebden BridgeHipperholme/ LightcliffeLuddenden/ Luddenden FootMytholmroydRastrickRippondenSouthowramSowerby BridgeStainland/ Holywell GreenTodmordenWest Vale/ Greetland
2.6 Other than Halifax and Brighouse, none of the above settlements were formally translated into RSS andspecifically referenced within RSS policy. It is therefore necessary for the LDF to formally identify the full
Policy Context4
2
Pu
blish
ed N
ovemb
er 09 Settlem
ent H
ierarchy Meth
od
olo
gy

settlement hierarchy for Calderdale. This includes classifying Local Service Centres and Basic ServiceCentres, whilst also identifying any other towns that the Council may feel warrant Principal Town status,should any settlement be deemed suitable for this purpose.
2.7 Policy YH7 provides a policy context for Local Service Centres, which states they should retain andimprove local services, and facilities, support economic diversification and meet locally generated needsfor both market and affordable housing.The RSS also provides criteria relating to travel times to essentialfacilities by public transport. This has been done from two perspectives; for identifying accessibility ofthe whole of the population to a new destination, such as a school or hospital; and measuring theaccessibility to various services from a new destination or origin, such as a potential housing site.
2.8 These criteria will be most important during preparation of the LDF when assessing individual siteallocations, however they have also been incorporated into this settlement hierarchy model wherepossible.
Local Policy
2.9 Currently the most important local policy documents in consideration of the settlement hierarchy are theReplacement Calderdale Unitary Development Plan (RCUDP) and the Sustainable Community Strategy,Calderdale Futures. Both of these documents promote the creation of sustainable communities byimproving accessibility to services and facilities.
2.10 In addition other parts of the LDF evidence base will compliment the Settlement Hierarchy as they aredeveloped. These include:
the Strategic Flood Risk Assessment (SFRA);the Employment Land Review (ELR);the Strategic Housing Land Availability Assessment (SHLAA)the Open Space, Sport and Recreation Study; andthe Green Belt Review
5Policy Context
2
Set
tlem
ent
Hie
rarc
hy M
eth
od
olo
gy
Pu
blis
hed
Nov
emb
er 0
9

3 Methodology - research data
3.1 The data for this study was collected through a combination of primary research and secondary datasources. The initial study work comprised the primary research element, including a questionnaire. Thequestionnaire was publicised and distributed in the summer of 2008 through Talkback (Calderdale'sCitizens Panel) and online via Limehouse consultation software. The questionnaire asked people howimportant they felt that a range of facilities and services were to be within walking distance of the home,from schools, health services, retail and leisure to community facilities, sports/recreation, employmentand public transport.
3.2 Results and feedback from the questionnaire helped to determine the full range of secondary data thatneeded to be collected for the purposes of undertaking the study. This resulted in obtaining data from anumber of different sources and pulling this together to be held in a common Geographical InformationSystem (GIS) format to enable consistent mapping of the data. A summary of these data collectionsources is set out in Table 3.1.
Table 3.1 Data Collection Sources
SourceCriteriaTheme
OS Points of Interest Data*Calderdale Corporate G.I.S
Nursery SchoolEducation
Primary School
Secondary School
OS Points of Interest Data*, NHS Calderdale'Register of Primary Medical Contractors',British Dental Association (BDA) Directory.
GP SurgeryHealth
Dentist
OS Points of Interest Data*, site visits, PostOffice Network Change Programme 2008,
Post OfficeRetail &town centres
Bank/building societies
Planning Applications Register & AccessibilitySurvey 2005-2008.
Supermarket
Pub/restaurant
Markets
Calderdale Unitary Development PlanEmployment land provisionEmployment
Calderdale Accessibility Survey 2005-2008Retail floorspace provision
Calderdale Corporate G.I.SLibraryCommunityFacilities
Calderdale Accessibility Survey 2005-2008Community centre
Calderdale Accessibility Survey 2005-2008Sports hall/swimming pool
OS Points of Interest Data*Sports ground
Public park
OS Points of Interest Data* & DiscoverCalderdale Events and Attractions Guide 2009
Arts, Theatre and Cinema
Methodology - research data6
3
Pu
blish
ed N
ovemb
er 09 Settlem
ent H
ierarchy Meth
od
olo
gy
SourceCriteriaTheme
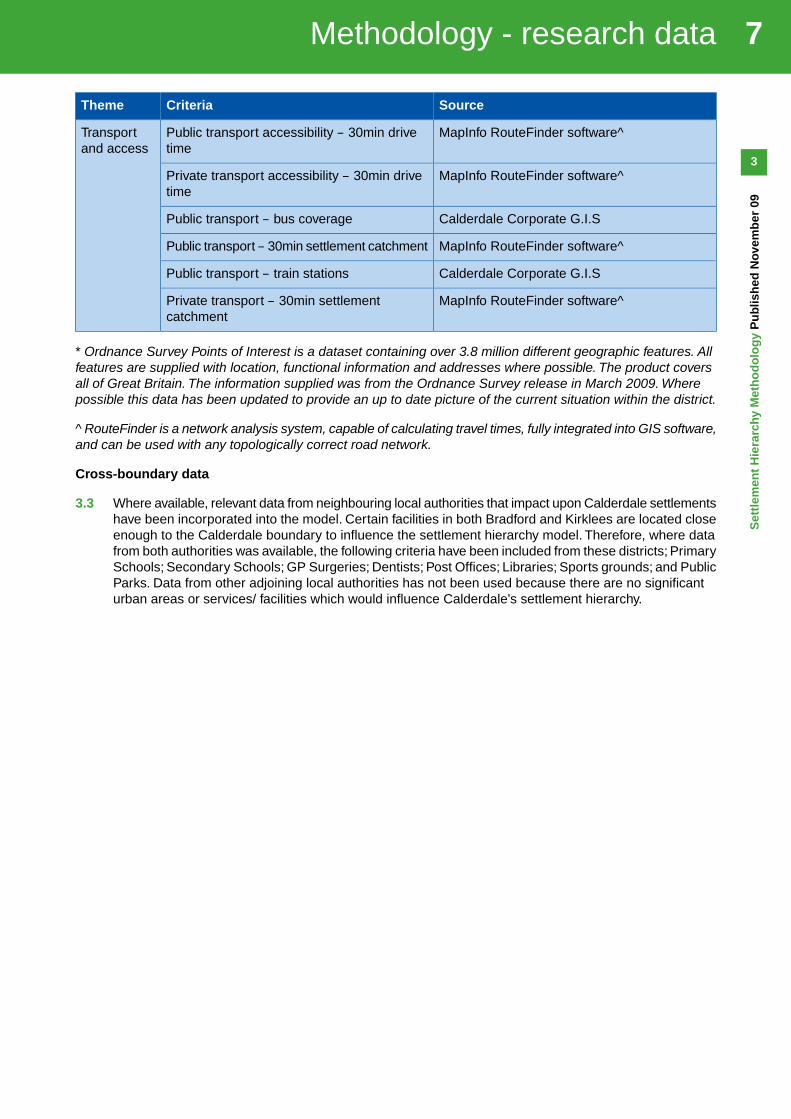
MapInfo RouteFinder software^Public transport accessibility – 30min drivetime
Transportand access
MapInfo RouteFinder software^Private transport accessibility – 30min drivetime
Calderdale Corporate G.I.SPublic transport – bus coverage
MapInfo RouteFinder software^Public transport – 30min settlement catchment
Calderdale Corporate G.I.SPublic transport – train stations
MapInfo RouteFinder software^Private transport – 30min settlementcatchment
* Ordnance Survey Points of Interest is a dataset containing over 3.8 million different geographic features. Allfeatures are supplied with location, functional information and addresses where possible. The product coversall of Great Britain. The information supplied was from the Ordnance Survey release in March 2009. Wherepossible this data has been updated to provide an up to date picture of the current situation within the district.
^ RouteFinder is a network analysis system, capable of calculating travel times, fully integrated into GIS software,and can be used with any topologically correct road network.
Cross-boundary data
3.3 Where available, relevant data from neighbouring local authorities that impact upon Calderdale settlementshave been incorporated into the model. Certain facilities in both Bradford and Kirklees are located closeenough to the Calderdale boundary to influence the settlement hierarchy model. Therefore, where datafrom both authorities was available, the following criteria have been included from these districts; PrimarySchools; Secondary Schools; GP Surgeries; Dentists; Post Offices; Libraries; Sports grounds; and PublicParks. Data from other adjoining local authorities has not been used because there are no significanturban areas or services/ facilities which would influence Calderdale's settlement hierarchy.
7Methodology - research data
3
Set
tlem
ent
Hie
rarc
hy M
eth
od
olo
gy
Pu
blis
hed
Nov
emb
er 0
9
4 Methodology - modelling
4.1 This settlement hierarchy study adopts a GIS model to measure the sustainability of Calderdale'ssettlements. The model has been refined based upon responses received to the questionnaire andconsultation, and further research on approaches undertaken by other local authorities. This section ofthe methodology provides details of the final adopted model. 5 'Amendments to the methodology' detailsthe key changes made between the previously consulted model (November 2008) and this final version.
4.2 The model employed involves the following key stages of work:
Stage 1: Identifying the assessment criteria - principal services and facilities to consider, includingidentifying appropriate walking distances, journey times and land coverages for accessibilitymeasurement.Stage 2:Weighting the assessment criteria - consideration of the relative importance of each criteriaidentified in the model and how to build this into the sustainability assessment.Stage 3: Identifying the settlement hierarchy - calculation and comparison of the relative sustainabilityof each settlement.Stage 4: Areas of search - consideration of areas with high sustainability ratings for potential futuregrowth.
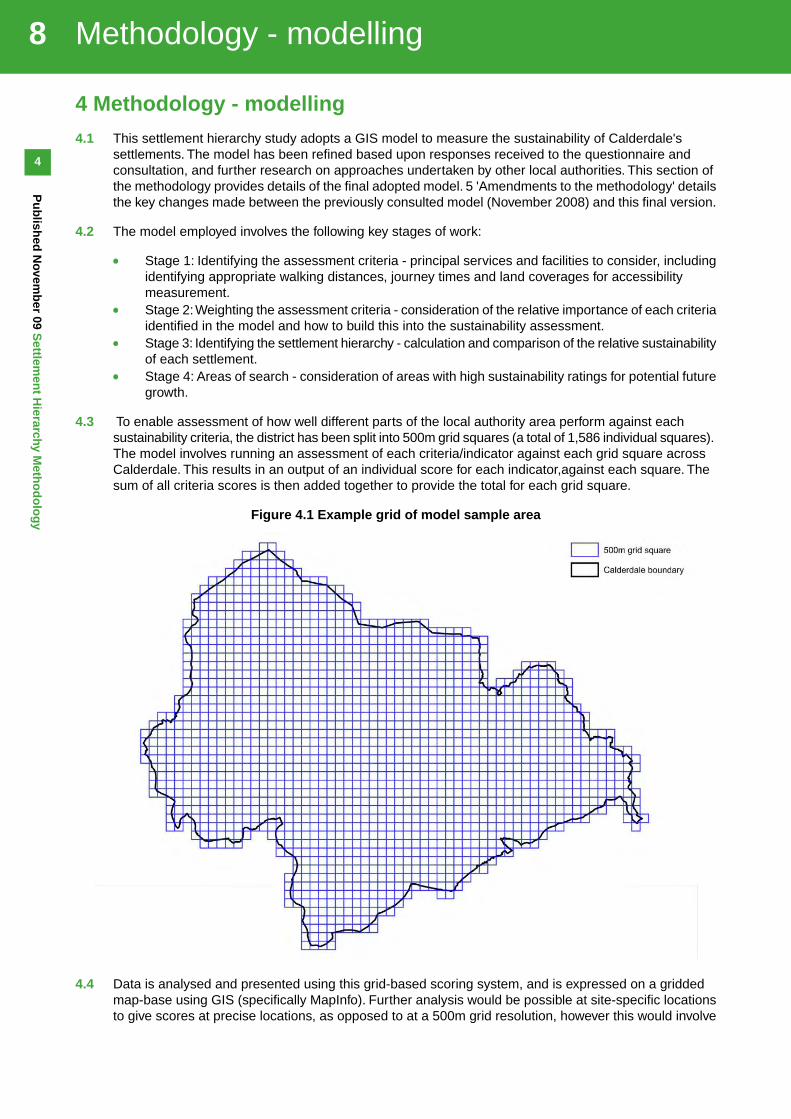
4.3 To enable assessment of how well different parts of the local authority area perform against eachsustainability criteria, the district has been split into 500m grid squares (a total of 1,586 individual squares).The model involves running an assessment of each criteria/indicator against each grid square acrossCalderdale. This results in an output of an individual score for each indicator,against each square. Thesum of all criteria scores is then added together to provide the total for each grid square.
Figure 4.1 Example grid of model sample area
4.4 Data is analysed and presented using this grid-based scoring system, and is expressed on a griddedmap-base using GIS (specifically MapInfo). Further analysis would be possible at site-specific locationsto give scores at precise locations, as opposed to at a 500m grid resolution, however this would involve
Methodology - modelling8
4
Pu
blish
ed N
ovemb
er 09 Settlem
ent H
ierarchy Meth
od
olo
gy

further calibration of the model and is considered beyond the scope of this study given the limitations oftime and resources.
Stage One: Identifying the assessment criteria
4.5 The starting point for identifying the assessment criteria were the principles set out within national planningpolicy and the criteria contained within the 2004 Settlement Study for the RSS. The following tableindicates how the regional criteria from the 2004 study have influenced the choice of local criteria in thisstudy. Table 4.1 'Data criteria' also details the scoring method for each criteria, which are based on theoutcomes of both the questionnaire, and professional judgement. The different criteria scoring methodsare determined either through the assessment of walking distances, the amount of land coverage for aspecific use, or in travel times. Each of these methods are discussed in more detail following Table 4.1'Data criteria'.
Table 4.1 Data criteria
Calderdale scoring methodCalderdale settlement hierarchy model criteriaRegional criteria(2004 settlementstudy)
Walking distance (750m)Education Nursery facilities (including nurseryprovision, nurseries and pre/ after schoolclubs)
Primary school
Secondary school
Walking distance (750m)Health GP surgeryDentist
Walking distance (750m)Financial andprofessionalservices
Banks/ Building societies (not including PostOffices/ shops undertaking ancillary bankingduties or insurance brokers)
Walking distance (750m)Public services LibraryCommunity centrePost officePlace of worship
Walking distance (750m)
Except public park (600m)
Leisure services Sports hall/ centre/ Swimming poolSports groundPublic park (Children’s play area or similar)Public house/ restaurantArts, Theatre and Cinema
Walking distance (750m)Retail Retail provisionSupermarketMarket
Area of landNot covered by 2004Settlement Study.
Employment provision
30 minute journey timeAccessibility to towns
Area of landRetail floorspace
Walking distance (400m) of busstop
Public transport - Bus coverage
9Methodology - modelling
4
Set
tlem
ent
Hie
rarc
hy M
eth
od
olo
gy
Pu
blis
hed
Nov
emb
er 0
9
Calderdale scoring methodCalderdale settlement hierarchy model criteriaRegional criteria(2004 settlementstudy)
Average number bus services perhour
Public transport - Bus frequency
Walking distance (750m)Public transport – Train Station
Contextual indicator onlyPopulation size
Identifying the assessment criteria: walking distances
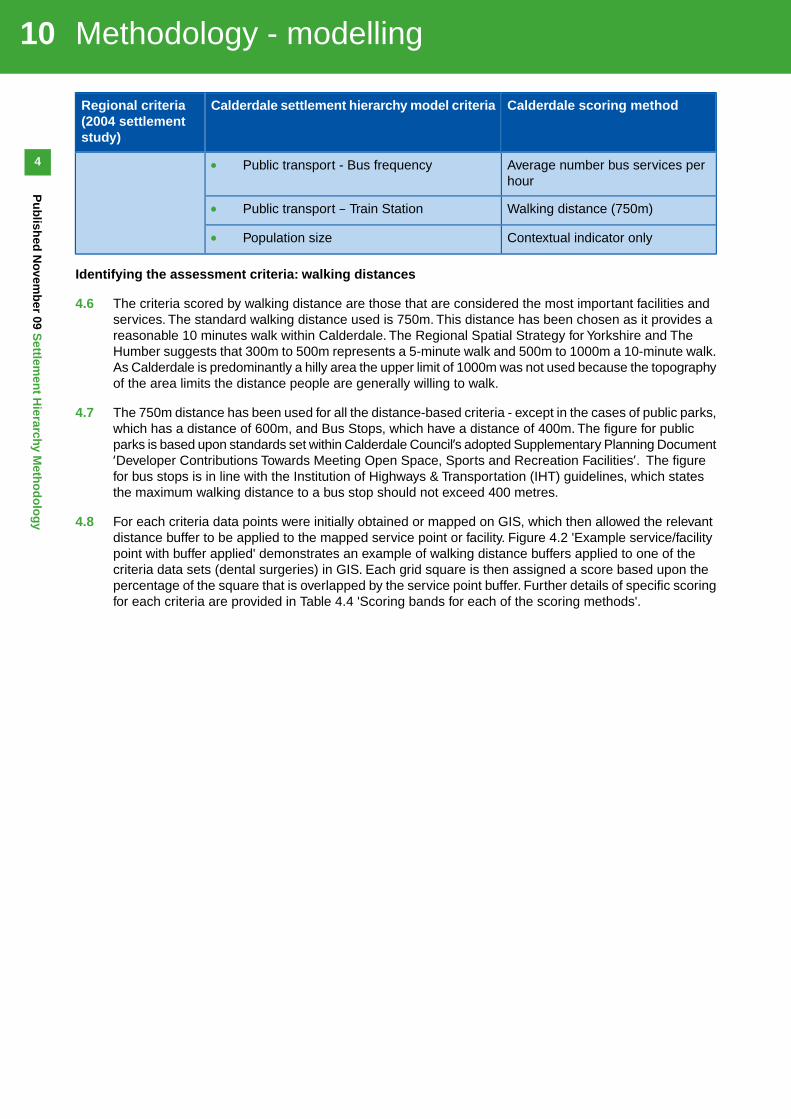
4.6 The criteria scored by walking distance are those that are considered the most important facilities andservices. The standard walking distance used is 750m. This distance has been chosen as it provides areasonable 10 minutes walk within Calderdale. The Regional Spatial Strategy for Yorkshire and TheHumber suggests that 300m to 500m represents a 5-minute walk and 500m to 1000m a 10-minute walk.As Calderdale is predominantly a hilly area the upper limit of 1000m was not used because the topographyof the area limits the distance people are generally willing to walk.
4.7 The 750m distance has been used for all the distance-based criteria - except in the cases of public parks,which has a distance of 600m, and Bus Stops, which have a distance of 400m. The figure for publicparks is based upon standards set within Calderdale Council’s adopted Supplementary Planning Document‘Developer Contributions Towards Meeting Open Space, Sports and Recreation Facilities’. The figurefor bus stops is in line with the Institution of Highways & Transportation (IHT) guidelines, which statesthe maximum walking distance to a bus stop should not exceed 400 metres.
4.8 For each criteria data points were initially obtained or mapped on GIS, which then allowed the relevantdistance buffer to be applied to the mapped service point or facility. Figure 4.2 'Example service/facilitypoint with buffer applied' demonstrates an example of walking distance buffers applied to one of thecriteria data sets (dental surgeries) in GIS. Each grid square is then assigned a score based upon thepercentage of the square that is overlapped by the service point buffer. Further details of specific scoringfor each criteria are provided in Table 4.4 'Scoring bands for each of the scoring methods'.
Methodology - modelling10
4
Pu
blish
ed N
ovemb
er 09 Settlem
ent H
ierarchy Meth
od
olo
gy

Figure 4.2 Example service/facility point with buffer applied
Identifying the assessment criteria: journey times
4.9 In addition to the local provision of services within walking distance, sustainability measures shouldincorporate journey times to other settlements to ensure that a locations connectedness can be properlyassessed. Access to major towns has been assessed in this settlement hierarchy model as these aregenerally the focus for the majority of services, leisure facilities, shops and employment opportunities.The time criteria of 30 minutes' journey time has been used as this corresponds with most of the TransportDestinations Accessibility criteria contained within Table 16.8 of the RSS.
4.10 Accessibility via two modes of transport have been used - public and private transport. Private transporthas been included because this is the most practical means for certain sectors of the population andcertain journeys. Public transport is an essential means of travel for many parts of the population whodo not have access to a private car.
4.11 GIS RouteFinder software has been used to calculate the number of centres (major towns) within andoutside Calderdale, that are within 30 minutes travelling distance from each grid square. RouteFinderuses the road network to assess all grid squares where an intersection occurs, taking account of therelative speeds of each mode of transport along different road classifications. The road speeds appliedfor the different road classifications on private and public transport are set out in Table 4.2 'Average roadspeeds for public and private transport'.
Table 4.2 Average road speeds for public and private transport
Speed - Public(miles/hr)
Speed - Private(miles/hr)
DescriptionRoadclasses
5056Motorway1
3540A road2
2835B road3
11Methodology - modelling
4
Set
tlem
ent
Hie
rarc
hy M
eth
od
olo
gy
Pu
blis
hed
Nov
emb
er 0
9

Speed - Public(miles/hr)
Speed - Private(miles/hr)
DescriptionRoadclasses
2530Minor Road4
2230Local Road5
1820Alley6
1315Slip Road7
1215Roundabout8
615Pedestrianised Street9
510Private Road - Publicly Accessible10
510Private Road - Restricted Access11
4.12 The RouteFinder software produces a catchment area output for each grid square similar to that indicatedin Figure 4.3 'Example of RouteFinder catchment area'. The software calculates the total number ofcentres included within each individual catchment area, resulting in the score for that grid square beingapplied as detailed in Table 4.4 'Scoring bands for each of the scoring methods'.
Figure 4.3 Example of RouteFinder catchment area
Identifying the assessment criteria: land coverage
4.13 In addition to walking distance and journey times, two of the criteria assessed in this settlement hierarchymodel are scored based upon the total land coverage within a cell, as opposed to distance to it. Thisapproach has been used for employment land and retail floorspace within an area.
4.14 For employment land, this provides a score on the availability of employment opportunities in the areawith the assumption that a greater percentage of land used for employment purposes equates to a greater
Methodology - modelling12
4
Pu
blish
ed N
ovemb
er 09 Settlem
ent H
ierarchy Meth
od
olo
gy

number of employment opportunities. It is recognised that this only provides a relatively cruderepresentation, however a greater level of detail would prove problematic given the limitations of timeand resources.
4.15 As with the other assessment criteria, the relevant score applied depending upon total land coverage orfloorspace is detailed in Table 4.4 'Scoring bands for each of the scoring methods'.
Final list of assessment criteria
4.16 The full list of assessment criteria that are included in the settlement hierarchy model, including informationon data sources, data type and units is set out in Table 4.3 'Assessment criteria'.
Table 4.3 Assessment criteria
ValueData TypeData source Data criteria
Education
750mWalking DistanceG.I.S.Nursery school1
750mWalking DistanceG.I.S.Primary school2
750mWalking DistanceG.I.S.Secondaryschool
3
Health
750mWalking DistanceG.I.S. & NHS CalderdaleGP surgery4
750mWalking DistanceG.I.S. & British Dental AssociationDentist6
Retail and associated town centre uses
750mWalking DistanceG.I.S. & Post OfficePost offices7
750mWalking DistanceG.I.S. & site visitsBanks/Buildingsocieties
8
750mWalking DistanceG.I.S.& Accessibility SurveySupermarkets9
750mWalking DistanceG.I.S.Market9a
750mWalking DistanceG.I.S. & Planning applicationsregister
Pub/restaurant10
Employment
Emp/HaArea CoveredU.D.P.Employmentprovision insettlements
11
Emp/HaArea CoveredAccessibility SurveyRetail LandProvision insettlements
12
Community Facilities
750mWalking DistanceG.I.S.Library13
750mWalking DistanceAccessibility SurveyCommunitycentre
14
750mWalking DistanceSports hall/Centre/
15
Swimmingpool
13Methodology - modelling
4
Set
tlem
ent
Hie
rarc
hy M
eth
od
olo
gy
Pu
blis
hed
Nov
emb
er 0
9

ValueData TypeData source Data criteria
750mWalking DistanceU.D.P.Sports ground16
600mWalking DistanceU.D.P.Public Park17
750mWalking DistanceG.I.S. & Discover Calderdale 2009Arts, Theatreand Cinema
17a
Transport and access
30 minsNumber ofcentres
Route Finder ModelA. Accessibilityto nearby
18
settlements –Publictransport
30 minsNumber ofcentres
Route Finder ModelB. Accessibilityto nearbysettlements –Privatetransport
400mWalking DistanceG.I.S.A. Bus stop19
30 minsDrive CoverageRoute Finder ModelB. Publictransportcoverage – 30min drive
750mWalking DistanceG.I.S.A. Trainstation
20
30 minsDrive CoverageRoute Finder ModelB. Privatetransportcoverage – 30min drive
4.17 The scores applied to each data type for each criteria are shown in Table 4.4 'Scoring bands for eachof the scoring methods'. These have been devised using the range of scores from all grid squares, andsplitting the range into four logical bands for the scoring of points. Points are awarded in bands of 0.25,0.5, 0.75 and 1 for each criteria assessment.
Table 4.4 Scoring bands for each of the scoring methods
PointsScoring Method
00% of grid square within specified distanceWalking distance
0.25Up to 25% grid square within specified distance
0.526% to 50% grid square within specifieddistance
0.7551% to 75% grid square within specifieddistance
176% to 100% grid square within specifieddistance
00ha of grid square Area covered by employment uses
0.250 to 0.5ha of grid square
Methodology - modelling14
4
Pu
blish
ed N
ovemb
er 09 Settlem
ent H
ierarchy Meth
od
olo
gy

PointsScoring Method
0.50.5 to 1ha of grid square
0.751 to 5ha of grid square
1Above 5ha of grid square
00 sq.m. Area covered by retail uses
0.25Up to 100 sq.m. of grid square
0.5100 to 500 sq.m. of grid square
0.75501 to 2000 sq. m. of grid square
1Above 2000 sq. m. of grid square
00 centres/settlements within 30 minutesNumber of centres/settlements within 30 minsjourney time – Public and Private transport*
0.251 - 3 centres/settlements within 30 minutes
0.54 - 6 centres/settlements within 30 minutes
0.757 - 8 centres/settlements within 30 minutes
19 + centres/settlements within 30 minutes
00 sq.m.B. Public and Private transport 30mins drivecoverage
0.251 – 60 sq miles coverage
0.561 – 120 sq miles coverage
0.75121 – 180 sq miles coverage
1Above 180 sq miles coverage
* The centres/ settlements used are: Halifax, Hebden Bridge, Todmorden, Brighouse, Elland, Sowerby Bridge, Bradford, Huddersfield, Dewsbury, Leeds, Wakefield,Burnley, Rochdale, Oldham, Keighley and Manchester.
Stage Two: Weighting the assessment criteria
4.18 The questionnaire responses in earlier rounds of consultation determined that all assessment criteriawould be retained as part of the model. There were no instances where criteria were deemed as ‘Notimportant’. The majority of responses were largely spread between ‘Very important’, ‘Important’ and‘Fairly Important’. The differences were those where large responses were shown as ‘Very important’for employment, health care, education and food shops and those largely seen as ‘Fairly important’ suchas sporting and community facilities, pubs and restaurants.
4.19 In their report ‘Making the Connections’, the Social Exclusion Unit (SEU) identifies ‘services with thegreatest impact on life opportunities’ as jobs, health care, learning and food shops. The split of theimportance of these facilities and services is largely consistent with the results presented by thequestionnaire responses.
4.20 It is therefore considered appropriate that access to employment, health care, education and food shopsfor example (services that are essential for life opportunities) should carry greater weight and be givengreater priority in the settlement hierarchy model than other criteria such as social, cultural and sportingfacilities. Table 4.5 'Categorisation and weighting of assessment criteria' lists the criteria by 'essential',whereby a weighting factor of 1 is applied, or 'other' where a weighting factor of 0.5 is applied. In effect,scores for those services/facilities deemed not to be essential (classified as 'other) are halved.
15Methodology - modelling
4
Set
tlem
ent
Hie
rarc
hy M
eth
od
olo
gy
Pu
blis
hed
Nov
emb
er 0
9
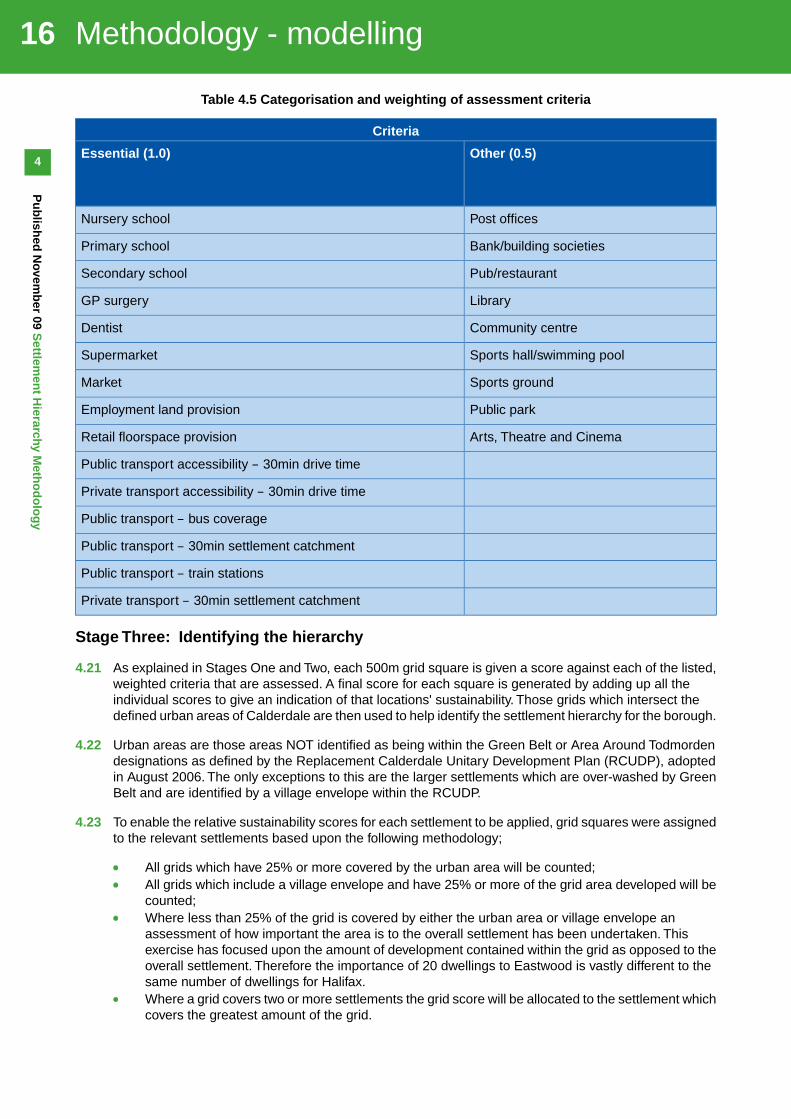
Table 4.5 Categorisation and weighting of assessment criteria
Criteria
Other (0.5)Essential (1.0)
Post officesNursery school
Bank/building societiesPrimary school
Pub/restaurantSecondary school
LibraryGP surgery
Community centreDentist
Sports hall/swimming poolSupermarket
Sports groundMarket
Public parkEmployment land provision
Arts, Theatre and CinemaRetail floorspace provision
Public transport accessibility – 30min drive time
Private transport accessibility – 30min drive time
Public transport – bus coverage
Public transport – 30min settlement catchment
Public transport – train stations
Private transport – 30min settlement catchment
Stage Three: Identifying the hierarchy
4.21 As explained in Stages One and Two, each 500m grid square is given a score against each of the listed,weighted criteria that are assessed. A final score for each square is generated by adding up all theindividual scores to give an indication of that locations' sustainability. Those grids which intersect thedefined urban areas of Calderdale are then used to help identify the settlement hierarchy for the borough.
4.22 Urban areas are those areas NOT identified as being within the Green Belt or Area Around Todmordendesignations as defined by the Replacement Calderdale Unitary Development Plan (RCUDP), adoptedin August 2006. The only exceptions to this are the larger settlements which are over-washed by GreenBelt and are identified by a village envelope within the RCUDP.
4.23 To enable the relative sustainability scores for each settlement to be applied, grid squares were assignedto the relevant settlements based upon the following methodology;
All grids which have 25% or more covered by the urban area will be counted;All grids which include a village envelope and have 25% or more of the grid area developed will becounted;Where less than 25% of the grid is covered by either the urban area or village envelope anassessment of how important the area is to the overall settlement has been undertaken. Thisexercise has focused upon the amount of development contained within the grid as opposed to theoverall settlement. Therefore the importance of 20 dwellings to Eastwood is vastly different to thesame number of dwellings for Halifax.Where a grid covers two or more settlements the grid score will be allocated to the settlement whichcovers the greatest amount of the grid.
Methodology - modelling16
4
Pu
blish
ed N
ovemb
er 09 Settlem
ent H
ierarchy Meth
od
olo
gy
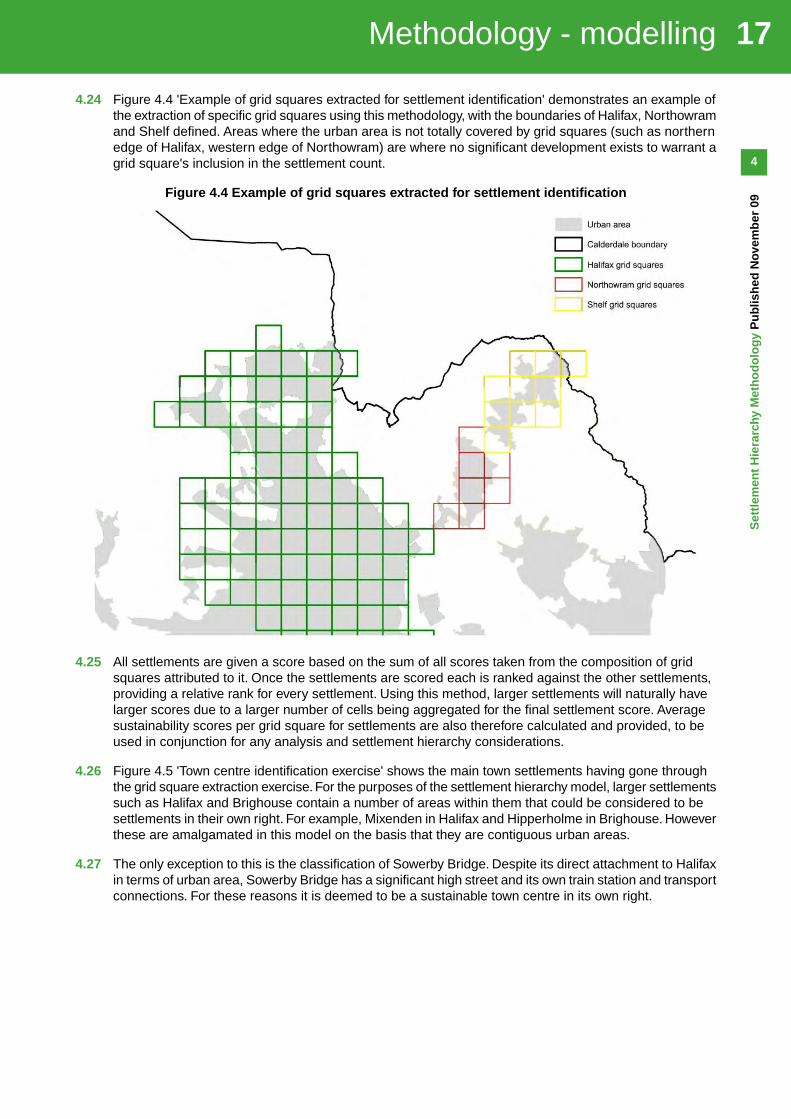
4.24 Figure 4.4 'Example of grid squares extracted for settlement identification' demonstrates an example ofthe extraction of specific grid squares using this methodology, with the boundaries of Halifax, Northowramand Shelf defined. Areas where the urban area is not totally covered by grid squares (such as northernedge of Halifax, western edge of Northowram) are where no significant development exists to warrant agrid square's inclusion in the settlement count.
Figure 4.4 Example of grid squares extracted for settlement identification
4.25 All settlements are given a score based on the sum of all scores taken from the composition of gridsquares attributed to it. Once the settlements are scored each is ranked against the other settlements,providing a relative rank for every settlement. Using this method, larger settlements will naturally havelarger scores due to a larger number of cells being aggregated for the final settlement score. Averagesustainability scores per grid square for settlements are also therefore calculated and provided, to beused in conjunction for any analysis and settlement hierarchy considerations.
4.26 Figure 4.5 'Town centre identification exercise' shows the main town settlements having gone throughthe grid square extraction exercise. For the purposes of the settlement hierarchy model, larger settlementssuch as Halifax and Brighouse contain a number of areas within them that could be considered to besettlements in their own right. For example, Mixenden in Halifax and Hipperholme in Brighouse. Howeverthese are amalgamated in this model on the basis that they are contiguous urban areas.
4.27 The only exception to this is the classification of Sowerby Bridge. Despite its direct attachment to Halifaxin terms of urban area, Sowerby Bridge has a significant high street and its own train station and transportconnections. For these reasons it is deemed to be a sustainable town centre in its own right.
17Methodology - modelling
4
Set
tlem
ent
Hie
rarc
hy M
eth
od
olo
gy
Pu
blis
hed
Nov
emb
er 0
9

Figure 4.5 Town centre identification exercise
4.28 In addition to the main town centres, Calderdale has a significant number of medium and smaller scalesettlements. These are identified through a similar process and their sustainability ranked using thesettlement hierarchy model in order to help steer any appropriate levels of future growth in these areas.Figure 4.6 'Other settlements identification exercise' identifies the grid squares that make up these 36smaller settlements that are considered in the study.
Methodology - modelling18
4
Pu
blish
ed N
ovemb
er 09 Settlem
ent H
ierarchy Meth
od
olo
gy
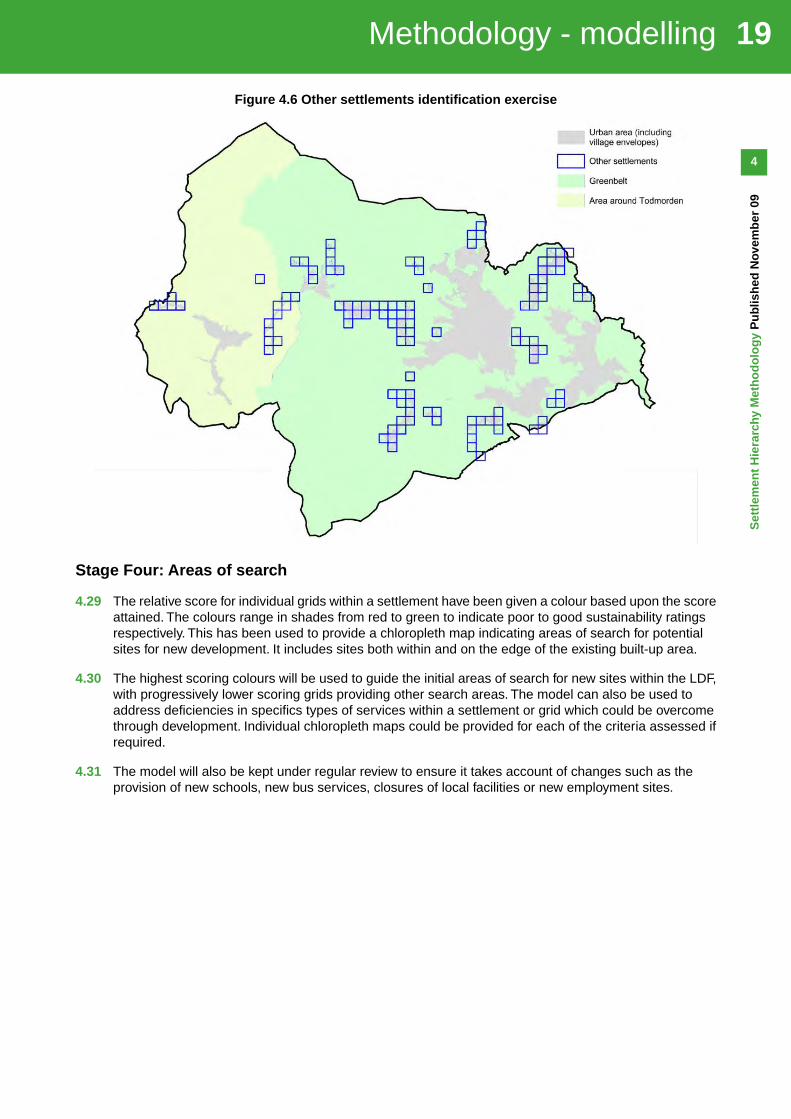
Figure 4.6 Other settlements identification exercise
Stage Four: Areas of search
4.29 The relative score for individual grids within a settlement have been given a colour based upon the scoreattained. The colours range in shades from red to green to indicate poor to good sustainability ratingsrespectively. This has been used to provide a chloropleth map indicating areas of search for potentialsites for new development. It includes sites both within and on the edge of the existing built-up area.
4.30 The highest scoring colours will be used to guide the initial areas of search for new sites within the LDF,with progressively lower scoring grids providing other search areas. The model can also be used toaddress deficiencies in specifics types of services within a settlement or grid which could be overcomethrough development. Individual chloropleth maps could be provided for each of the criteria assessed ifrequired.
4.31 The model will also be kept under regular review to ensure it takes account of changes such as theprovision of new schools, new bus services, closures of local facilities or new employment sites.
19Methodology - modelling
4
Set
tlem
ent
Hie
rarc
hy M
eth
od
olo
gy
Pu
blis
hed
Nov
emb
er 0
9

5 Amendments to the methodology
5.1 This final methodology has been significantly changed from the version which was consulted upon duringwinter 2008/09. The changes have largely been made in response to the comments made during theconsultation and because of the lessons learnt from the first run of the settlement hierarchy model.
5.2 This section highlights the major changes to the methodology and the model and the reason for thechanges.
Table 5.1 Major changes to the settlement hierarchy model methodology
ReasonChangesSection
To clarify how the methodology has been developed.Short sectionconcerning
1:Introduction
consultationincluded
Whilst this section contained useful theoretical information it wasconsidered this added little to the understanding of how thesettlement hierarchy model had been created.
Section condensed3:Methodology -research data
Additional sources of data have been used in calculating thescore for each criteria because some of the original data used in
Additional sourcesof data used
3:Methodology -research data (Table3.1) the model was found to be inaccurate.This issue was noted whilst
validating the model results and through consultation responses.To rectify this problem and ensure the model provides as accuratea picture as possible a range of other data sources have beenused, where relevant.
Calderdale has numerous markets across the district.These playa significant role in how the towns function and provide a wide
Markets added toscoring criteria
3:Methodology -research data (Table3.1) range of goods and services. Because markets provide an
important resource to the residents of the district it was consideredthis should be recognised in the settlement hierarchy.
The previous iteration of the model was considered to be lackingin terms of arts and culture provision.Whilst this is not considered
Arts, Theatre, andCinema added toscoring criteria
3:Methodology -research data (Table3.1) a 'life essential' requirement it is recognised that such facilities
do add to the attractiveness of a place for entertainment andreduces the need to travel to other destinations. On this basis anew criteria was created for Arts, Theatre and Cinema.
Whilst this criteria was considered to be important whilst scoringit was noted this creating a lot of double counting with the GP
Health clinicsremoved fromscoring criteria
3:Methodology -research data (Table3.1) facilities. On further investigation it also emerged that where
double counting did occur this did not necessarily mean that thefacility had more services than those facilities not being doublecounted. Those health clinics which were not also GP surgerieswhere only available to patients referred by their GP and werenot available as a first point of contact.Therefore because of bothof these issues it was considered that the GP Surgeries listprovided by the NHS was the only relevant data to use.
Following the consultation it was clear that to avoid too insularan approach in the settlement hierarchy model, it would be
Data from Bradfordand Kirkleesobtained
4:Methodology -inclusion ofcross-border data necessary to obtain data from adjoining local authorities. This
ensures that areas of Calderdale close to the authority boundaryare scored accurately taking account of services and facilitiesover the boundary and not just those within Calderdale. Where
Amendments to the methodology20
5
Pu
blish
ed N
ovemb
er 09 Settlem
ent H
ierarchy Meth
od
olo
gy
ReasonChangesSection
available, data has been incorporated into this version of themodel.
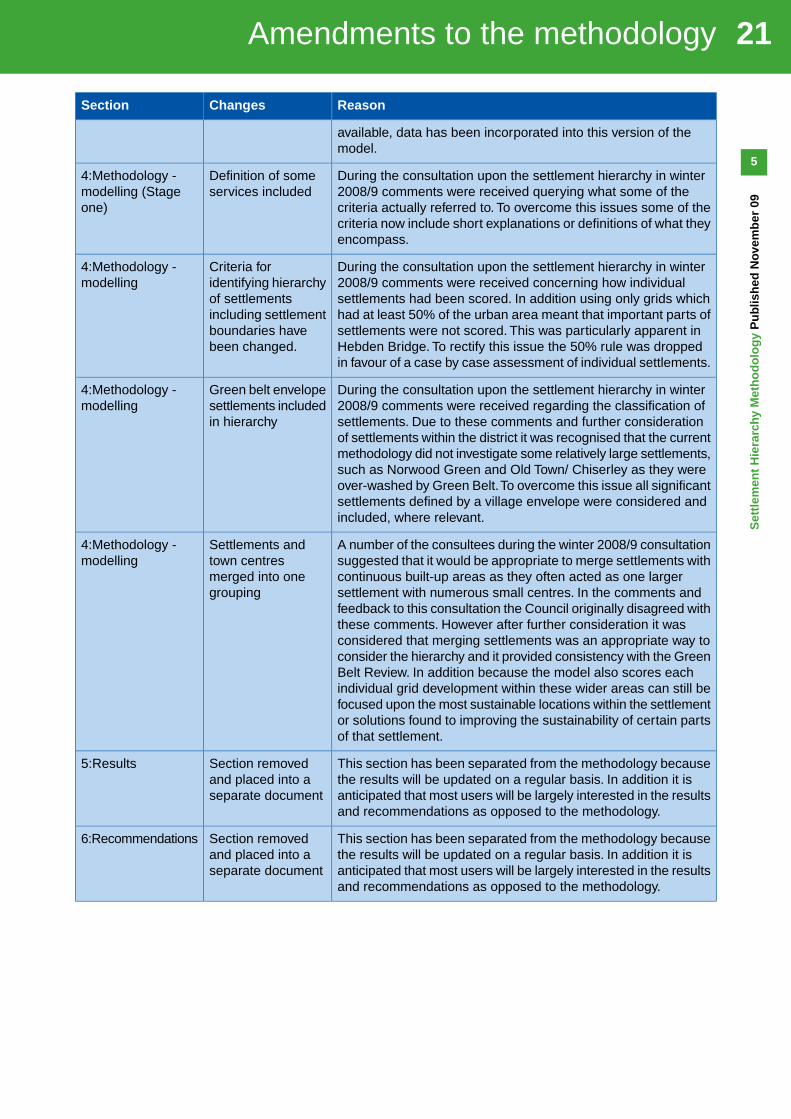
During the consultation upon the settlement hierarchy in winter2008/9 comments were received querying what some of the
Definition of someservices included
4:Methodology -modelling (Stageone) criteria actually referred to. To overcome this issues some of the
criteria now include short explanations or definitions of what theyencompass.
During the consultation upon the settlement hierarchy in winter2008/9 comments were received concerning how individual
Criteria foridentifying hierarchy
4:Methodology -modelling
settlements had been scored. In addition using only grids whichof settlementshad at least 50% of the urban area meant that important parts ofincluding settlementsettlements were not scored. This was particularly apparent inboundaries have
been changed. Hebden Bridge. To rectify this issue the 50% rule was droppedin favour of a case by case assessment of individual settlements.
During the consultation upon the settlement hierarchy in winter2008/9 comments were received regarding the classification of
Green belt envelopesettlements includedin hierarchy
4:Methodology -modelling
settlements. Due to these comments and further considerationof settlements within the district it was recognised that the currentmethodology did not investigate some relatively large settlements,such as Norwood Green and Old Town/ Chiserley as they wereover-washed by Green Belt.To overcome this issue all significantsettlements defined by a village envelope were considered andincluded, where relevant.
A number of the consultees during the winter 2008/9 consultationsuggested that it would be appropriate to merge settlements with
Settlements andtown centres
4:Methodology -modelling
continuous built-up areas as they often acted as one largermerged into onegrouping settlement with numerous small centres. In the comments and
feedback to this consultation the Council originally disagreed withthese comments. However after further consideration it wasconsidered that merging settlements was an appropriate way toconsider the hierarchy and it provided consistency with the GreenBelt Review. In addition because the model also scores eachindividual grid development within these wider areas can still befocused upon the most sustainable locations within the settlementor solutions found to improving the sustainability of certain partsof that settlement.
This section has been separated from the methodology becausethe results will be updated on a regular basis. In addition it is
Section removedand placed into aseparate document
5:Results
anticipated that most users will be largely interested in the resultsand recommendations as opposed to the methodology.
This section has been separated from the methodology becausethe results will be updated on a regular basis. In addition it is
Section removedand placed into aseparate document
6:Recommendations
anticipated that most users will be largely interested in the resultsand recommendations as opposed to the methodology.
21Amendments to the methodology
5
Set
tlem
ent
Hie
rarc
hy M
eth
od
olo
gy
Pu
blis
hed
Nov
emb
er 0
9