Hospital Reimbursement: - The Reimbursement Hydraulic - Cost Shifting
Upload
pharmacyiknCategory
view
449download
5
Dr Paul Cornes
Conflict of interest
Salary received:
• United Kingdom National Health Service
Honoraria received:
• Roche
• Janssen
• Sandoz
• Lilly
• European Generics Association
• Teva
• Hospira

Strive not to be a success,
but rather to be of value
Setting the threshold for
reimbursement of a treatment
Comparative Outcomes Group
ESO Task Force Advisory Board on
Access to Innovative Treatment in
Europe
European School of Oncology
Piazza Indipendenza, 2
6500 Bellinzona - Switzerland
Dr Paul Cornes,
Consultant Oncologist,
Bristol Haematology & Oncology Centre

Strive not to be a success,
but rather to be of value
Setting the threshold for
reimbursement of a treatment

Of the 12 new cancer drugs approved by the Food and Drug
Administration in 2012
11 were priced above $100,000 annually.
Only three were found to improve patient survival rates
and, of these, two increased survival by less than two months.
Kantarjian H et al. Making cancer drugs less expensive. Washington Post. February 22, 2013.
http://www.washingtonpost.com/opinions/making-cancer-drugs-less-expensive/2013/02/22/d8c8983e-7795-11e2-aa12-
e6cf1d31106b_story.html Accessed Sept 22, 2014

The options for future health spending include
the following:
Carry on spending at current rates – postpone
the inevitable decision to contain spending
Carry on spending at current rates and improve
efficiency and productivity
• that is, buy extra time before confronting the
inevitable decision to contain spending
Align health spending growth to general, long-
term growth in the economy as a whole
• with possible adjustments to devote a
modestly greater share of GDP to health care
as GDP grows.
Untenable in the
medium term
Viable possibly
medium term
Only long term
viable option if
the state is to
provide health
care from
general
taxation
Appleby J et al. Spending on health care - How much is enough? Kings Fund 2006. URL: http://www.kingsfund.org.uk/sites/files/kf/SpendingonHealthCare.pdf. Accessed
Nov 2, 2014

Physician level rationing
Oncologists do ration expensive treatments
• But they are not transparent in telling the patients
German Society of Hematology and Oncology
• Two-thirds of 345 participating oncologists withold costly
treatments in at least some instances
Reasons given
• 70% evidence for costly intervention was not convincing
enough,
• 59% unfavorable cost/benefit calculation.
Transparency
• Only 29% reported being explicit about their rationing decision
if the patient did not know or inquire about the respective
intervention.
Krause SW et al. Rationing cancer care: a survey among the members of the german society of hematology and
oncology.J Natl Compr Canc Netw. 2013 Jun 1;11(6):658-65.

Physician level rationing – with a financial
incentive!
USA - medical bills for the average
patient on chemotherapy can top
$100,000 a year.
• two of the largest health insurers
in the nation, United Healthcare
and Aetna, are tightening their
oversight over the treatment of
cancer by offering physicians
extra money to avoid newer, less
proven treatments.
• Evidence based therapy for lung
cancer offers 8 different
potential therapies
Mathews AW. Wall St J. May 27, 2014Insurers Push to Rein In Spending on Cancer Care. http://online.wsj.com/articles/insurer-to-reward-cancer-doctors-for-adhering-
to-regimens-1401220033. Accessed Sept 29, 2014. Abelson R. Insurers Test New Cancer Pay Systems. N Y Times Oct 19, 2010.
http://www.nytimes.com/2010/10/20/health/policy/20cancer.html?hpw. Accessed Sept 29, 2014
treatment
costs over a
12-month
period were
35 percent
lower
Rationing
had no effect
on patients.
Neubauer MA. Cost
Effectiveness of Evidence-
Based Treatment Guidelines
for the Treatment of Non–
Small-Cell Lung Cancer in the
Community Setting. JOP
January 2010 vol. 6 no. 1 12-
18
$350 month bonus fee

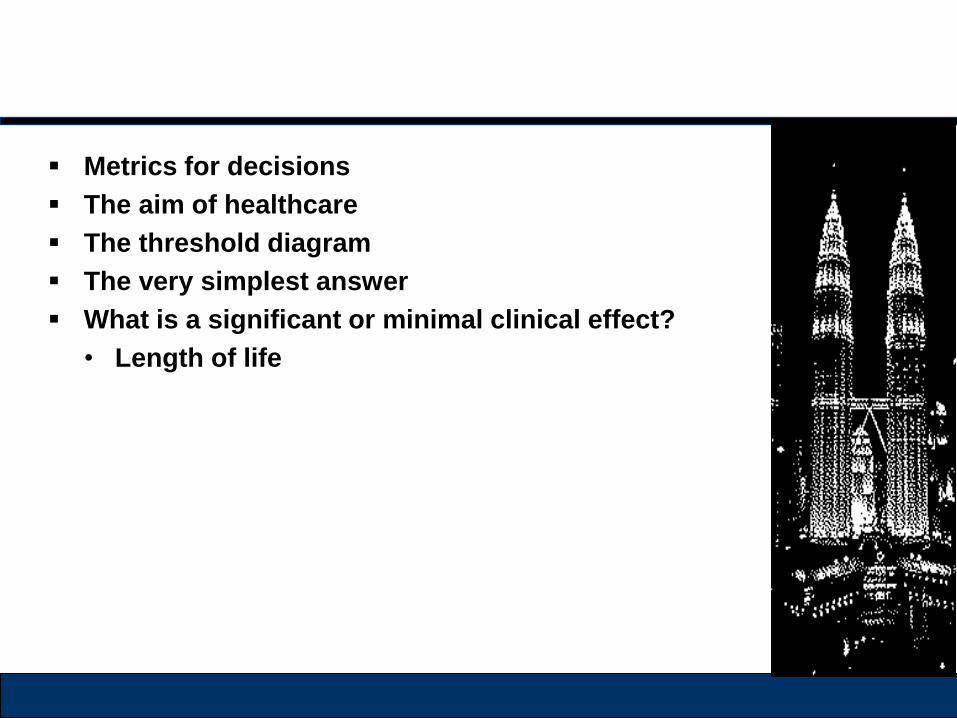
Metrics for decisions

The aim of healthcare
Aim of healthcare
• To live longer
• To live better
Aim of the health care systems
• to maximise health outcomes using available resources

The aim of healthcare – and its measures
The aim of healthcare is to help people live longer and better
Aim of healthcare Metric for health intervention
• To live longer Added Life Years ALY
• To live better Quality Of Life QOL
Metric for the two parallel aims
• ALY x QOL = QALY Quality Adjusted Life Year
Aim of the health care system
• to maximise health using available resources
• To gain the maximum QALYs for the health budget
Metric: Cost/ALY or Cost/QALY

The aim of healthcare
Not all policy initiatives appear not to be driven primarily by the
pursuit of QALY gain, but to focus instead on what might be
described as ‘process‐of‐care’ considerations.
For example -- Hospital waiting times targets
• While some health gain might arise from the quicker treatment
of patients, targets can also result in prioritising those who
have waited longest over those with the most severe health
problems
If Value based medicine is to be introduced – it should be part of
a drive for value in the whole health system
• And not just a mechanism to cap some budgets over others!
– Shah K et al. Is the aim of the English health care system to maximize QALYs?
Journal of Health Services Research and Policy.17(3), 157-164.

Choices in health economics
The Stockholm group asks us to consider new treatment options
Ref Stockholm Network Research Team. What Price for a Year of Life? The Threshold Discussion in Health Technology Assessment. 2008. URL:
http://www.stockholm-network.org/downloads/publications/HTA_4.pdf. Accessed Nov 2, 2014
Your Budget
is 3,750
million gold
coins

Choices in health economics
HTA model
Buy most cost
effective treatment
first, then next, until
the money is spent
RESULT
Fund treatments A,
B, C, D and E,
Total Cost 3,750
million gold coins
Do Not fund F,G,H
or I
Ref Stockholm Network Research Team. What Price for a Year of Life? The Threshold Discussion in Health Technology Assessment. 2008. URL:
http://www.stockholm-network.org/downloads/publications/HTA_4.pdf. Accessed Nov 2, 2014
Your Budget is 3,750 million gold coins

Choices in health economics
Political Equal
distribution model:
Buy all treatment
equally until the
budget is spent
RESULT
You could buy 1/3rd
of each treatment
option A B C D E F
G H 1
Total Cost 3,750
million gold coins
Ref Stockholm Network Research Team. What Price for a Year of Life? The Threshold Discussion in Health Technology Assessment. 2008. URL:
http://www.stockholm-network.org/downloads/publications/HTA_4.pdf. Accessed Nov 2, 2014
Your Budget is 3,750 million gold coins

Choices in health economics
Political Interest
model:
Buy all treatment to
satisfy well
organised patient or
producer groups
Ref Stockholm Network Research Team. What Price for a Year of Life? The Threshold Discussion in Health Technology Assessment. 2008. URL:
http://www.stockholm-network.org/downloads/publications/HTA_4.pdf. Accessed Nov 2, 2014
Your Budget is 3,750 million gold coins
The Austrian
Parliament during
breast cancer
awareness month

Choices in health economics
Political Interest
model:
Buy all treatment to
satisfy well
organised patient or
producer groups
RESULT
You could buy only
treatments C D and
H
Total Cost 3,750
million gold coins
Ref Stockholm Network Research Team. What Price for a Year of Life? The Threshold Discussion in Health Technology Assessment. 2008. URL:
http://www.stockholm-network.org/downloads/publications/HTA_4.pdf. Accessed Nov 2, 2014
Your Budget is 3,750 million gold coins

Choices in health economics
The HTA model saves more QALYs for a given investment in
health care
Ref Stockholm Network Research Team. What Price for a Year of Life? The Threshold Discussion in Health Technology Assessment. 2008. URL:
http://www.stockholm-network.org/downloads/publications/HTA_4.pdf. Accessed Nov 2, 2014
Now – who wants to be the Minister of Health?
The most effective option may make you unpopular!

Metrics for decisions
The threshold diagram

What are the metrics for the Economic Decision
Diagram?
Clinical Outcome
Bette
rW
ors
e
Cost difference
Less More
Length of Life = ALY
Quality of Life = Q
ALY x Q = QALY
Money The slope of the line is the
Incremental Cost Effectiveness
Ratio = ICER
ICER Unit = The extra money
required to improve health by 1
QALY
The greater the gain,
the more we should
be prepared to pay

What are the metrics for the Economic Decision
Diagram? WHO advice
Clinical Outcome
Bette
rW
ors
e
Cost difference
Less More
<1 x per capita
GDP / QALY = very
good value
>3 x per capita
GDP / QALY = poor
value
Per capita GDP is the
average National Gross
Domestic Product
(Earnings) per citizen per
year

What are the metrics for the Economic Decision
Diagram? WHO advice
Clinical Outcome
Bette
rW
ors
e
Cost difference
Less More
Per capita GDP is the
average National Gross
Domestic Product
(Earnings) per citizen per
year
Where is the dividing
line?
The slope of the line
is the Incremental
Cost Effectiveness
Ratio = ICER

What are the metrics for the Economic Decision
Diagram? WHO advice
Clinical Outcome
Bette
rW
ors
e
Cost difference
Less More
Where is the dividing
line?
In a National Health System
this is decided by willingness
to pay
In a private health system this
is decided by ability to pay

What are the metrics for the Economic Decision
Diagram? WHO advice
Clinical Outcome
Bette
rW
ors
e
Cost difference
Less More
Where is the dividing
line?
In a National Health System
this is decided by willingness
to pay
In a private health system this
is decided by ability to pay
How much
should
taxpayers be
prepared to pay
for a QALY gain?What about
insurers?

What are the metrics for the Economic Decision
Diagram? WHO advice
Clinical Outcome
Bette
rW
ors
e
Cost difference
Less More
Where is the dividing
line?
In a National Health System
this is decided by willingness
to pay
In a private health system this
is decided by ability to pay
What about
insurers?
Would they be
more
generous

What are the metrics for the Economic Decision:
Key Questions for Malaysian Oncology
1. Is cancer a special case compared to other illnesses?
2. What is the cost/effectiveness threshold at which we should
approve a new treatment for reimbursement?
3. What is the cost/effectiveness threshold at which we should
Remove a current treatment from reimbursement?
Should cancer treatments be seen as more
deserving than treatment for heart disease?
How much
should
taxpayers be
prepared to pay
for a QALY gain?

Metrics for decisions
The aim of healthcare
The threshold diagram
The very simplest answer

How can we improve Malaysian Guidelines?
By being explicit about the clinical effectiveness of the
interventions
This enables us to rank the value of potential treatment options
Tier Impact
Extremely
effective
Significant prolongation of
survival or
long term significant increase
in tumour control
Moderate
efficacy
Intermediate between the two
Minimal
efficacy
“statistically significant”
survival benefits of only short
duration
we will need payer and stakeholder consensus to
agree the parameters for our decisions !
What is the
“minimum
clinical
benefit” to
justify
treatment
from
Malaysian
Societal
perspectives?

Valuing Innovation
2013: Drs Kantarjian, Fojo, Mathisen, and Zwelling
Proposed 3 tiers of value for a new treatment
Ref Kantarjian HM et al. Cancer Drugs in the United States: Justum Pretium—The Just Price. J Clin Onc 2013;31(28):3600. DOI:
10.1200/JCO.2013.49.184
Tier Impact
Extremely
effective
Moderate
efficacy
Minimal
efficacy
Will need societal and payers
consensus

Valuing Innovation
2013: Drs Kantarjian, Fojo, Mathisen, and Zwelling
Proposed 3 tiers of value for a new treatment
Ref Kantarjian HM et al. Cancer Drugs in the United States: Justum Pretium—The Just Price. J Clin Onc 2013;31(28):3600. DOI:
10.1200/JCO.2013.49.184
Tier Impact
Extremely
effective
new drug prolongs survival by more than 6 months or by
more than one third of the life expectancy (eg, 12 months
becomes ≥16 months, or 30 months is increased to ≥40
months)
improves long-term survival or PFS by 10%
Moderate
efficacy
Intermediate
Minimal
efficacy
“statistically significant” survival benefits of 2 months or
prolong life by less than 15%
For debate – we propose this for the
2014-2015 guidelines

Valuing Innovation
Example: Mariotto AB, J Nat Ca Inst 2011;103:117
anti–vascular endothelial growth factor inhibitors in
metastatic colon cancer provide a median survival
advantage of 1.4 months over standard of care,
These drugs cost $5,000 to $11,000 per month.
With a median overall survival from start of second-
line therapy of 12 months, and a median duration of
therapy of 12 to 14 months, the total cost translates
into approximately $40,000 to $80,000 per patient per
additional month of life.
Ref Kantarjian HM et al. Cancer Drugs in the United States: Justum Pretium—The Just Price. J Clin Onc 2013;31(28):3600. DOI:
10.1200/JCO.2013.49.184 Mariotto AB, Yabroff KR, Shao Y, et al: Projections of the cost of cancer care in the United States:
2010-2020. J Natl Cancer Inst 103:117-128, 2011
Tier
Extremely
effective
Moderate
efficacy
Minimal
efficacy
We might chose reject reimbursement for this
treatment on both efficacy and value criteria

Valuing Innovation
2013: Drs Kantarjian, Fojo, Mathisen, and Zwelling
Set a challenge to us
• “Researchers, academicians, and professional societies
should demand better results and discontinue the practice of
exulting marginal outcomes”.
• “The bar should be raised for expectations from new drugs,
and hyping minor benefits of newer (more expensive) drugs
over older (less expensive) ones should not be endorsed by
tumor experts or professional societies unless such benefits
truly reflect incremental value worth the differential price.”
Ref Kantarjian HM et al. Cancer Drugs in the United States: Justum Pretium—The Just Price. J Clin Onc 2013;31(28):3600. DOI:
10.1200/JCO.2013.49.184
“This will also alleviate the pressure community oncologists
feel to prescribe newer drugs promoted by experts at
professional meetings"

How can we improve Malaysian Guidelines?
Add cost effectiveness
Cost/effectiveness
High
<1xGDP
Moderate
? X GDP
Poor
>?GDP
Clinical
effect
Extremely
effective
Moderate
efficacy
Minimal
efficacy
We hope to agree
MOH funding for
these
Push for generics, biosimilars, price
reductions or cheaper
dose/schedules to bring inside MOH
funding zone
Create value with generics,
biosimilars, or cheaper
dose/schedules to free-up resource

How can we improve Malaysian Guidelines?
Add cost effectiveness
Cost/effectiveness
High
<1xGDP
Moderate
? X GDP
Poor
>?GDP
Clinical
effect
Extremely
effective
Moderate
efficacy
Minimal
efficacy
Will need stakeholder
consensus to decide
Will need societal and payers
consensus

How can we improve Malaysian Guidelines?
Add cost effectiveness
Cost/effectiveness
High
<1xGDP
Moderate
1 <2 X GDP
Poor
>2GDP
Clinical
effect
Extremely
effective
Moderate
efficacy
Minimal
efficacy
For debate – we propose this for the
2014-2015 guidelines

How can we improve Malaysian Guidelines?
Add cost effectiveness
Cost/effectiveness
High
<1xGDP
Moderate
1 <2 X GDP
Poor
>2GDP
Clinical
effect
Extremely
effective
Moderate
efficacy
Minimal
efficacy


Metrics for decisions
The aim of healthcare
The threshold diagram
The very simplest answer
Practical steps in guideline writing

Making reimbursement decisions
For our process to be reasonable and accountable, there are four
conditions that we must fulfil:
1. Transparency: the process must be fully transparent about
the grounds for/rationales behind a decision.
2. Relevance: the decision must rest on reasons that all those
affected by the decision can accept as relevant to meeting
health needs fairly, given the resource constraints.
3. Revisability: decisions should be revisable in light of new
evidence and arguments.
4. Enforcement/regulation: there must be some kind of
regulation guaranteeing the three conditions described
above.
Ref

The 3 step reimbursement decision process
Assessment Phase:
• Output: Assessment report
Appraisal phase
• Output: Reimbursement advice
Decision‐making phase
• Output: Reimbursement decision
Ref
Potential Answers
1. Yes
2. Yes with restrictions
3. Defer until more data
4. No

The 3 step reimbursement decision process
Assessment Phase:
• Assessment criteria: health related, measurable
• Objective reporting, no value judgement
• Output: Assessment report
Appraisal phase
• Appraisal criteria: assessment criteria + other socially relevant
health(care‐sector) related criteria
• Weighting criteria, value judgement
• Output: Reimbursement advice
Decision‐making phase
• Decision criteria: appraisal criteria + other socially criteria
• Weighting appraisal outcome with other socially relevant
criteria, value judgement
• Output: Reimbursement decisionRef

The 3 step reimbursement decision process: suggested
schema if not clearly effective and very good value
Assessment Phase:
Appraisal phase
• Perform a very simple HTA and compare with published
ASK - Is it approval straightforward?
• High or moderate clinical benefit and <2x GDP
ANSWER
• Yes, well inside 2 x GDP
• close,
• No - >3xGDP
Decision‐making phase
Ref
WAIT: Full HTA is commissioned
ADVISE: Reject reimbursement as
intervention is very unlikely to be
cost effective
ADVISE: approve

HTA in Malaysia
Ref MaHTAS – Health Technology Assessment Section, Ministry of Health Malaysia. URL: http://www.inahta.org/our-members/members/mahtas/
Accessed Oct 9, 2014
WAIT: Full HTA is commissioned

Reimbursement decisions
Framework to take into
account when discussing the
reimbursement of a drug:
• efficacy, effectiveness,
• side-effects & safety
• user-friendliness
• added therapeutic value,
cost-effectiveness,
• budget impact,
• therapeutic and social
needs.
Metrics to take into account
when discussing the
reimbursement of a drug:
Ref
Balance of risks and benefits = OS
x QoL = QALY
Will be discovered in the “utility”
or “preference” scores.
Example: Patients prefer oral vs
i.v. drugs
Patients will trade off survival to
have a less effective oral
treatment

Reimbursement decisions
Framework to take into
account when discussing the
reimbursement of a drug:
• efficacy, effectiveness,
• side-effects & safety
• user-friendliness
• added therapeutic value,
cost-effectiveness,
• budget impact,
• therapeutic and social
needs.
Metrics to take into account
when discussing the
reimbursement of a drug:
Ref
QALY difference
COST/QALY = I.C.E.R
Incremental Cost-Effectiveness
Ratio
Gain or Loss: Monetary value
Example: Paying more for locally
produced treatments to stimulate
the economy

HTA in Malaysia
Office established – MaHTAS
Mission - Our vision is to ensure appropriate use of health
technology by influencing dicision-makers through collection,
analysis, dissemination of information on safety, effectivenes,
cost-effectiveness and health impact of technologies.
Our mission is to provide evidence for informed decision making
to policymakers, health care providers and consumers.
Ref MaHTAS – Health Technology Assessment Section, Ministry of Health Malaysia. URL: http://www.inahta.org/our-members/members/mahtas/
Accessed Oct 9, 2014

Reimbursement decisions
Framework to take into
account when discussing the
reimbursement of a drug:
• efficacy, effectiveness,
• side-effects & safety
• user-friendliness
• added therapeutic value,
cost-effectiveness,
• budget impact,
• therapeutic and social
needs.
Metrics to take into account
when discussing the
reimbursement of a drug:
Ref
Balance of risks and benefits = OS
x QoL = QALY
Will be discovered in the “utility”
or “preference” scores.
Example: Patients prefer oral vs
i.v.drugs
Patients will trade off survival to
have a less effective oral
treatment

Reimbursement decisions
Framework to take into
account when discussing the
reimbursement of a drug:
• efficacy, effectiveness,
• side-effects & safety
• user-friendliness
• added therapeutic value,
cost-effectiveness,
• budget impact,
• therapeutic and social
needs.
Metrics to take into account
when discussing the
reimbursement of a drug:
Ref
QALY difference
COST/QALY = I.C.E.R
Incremental Cost-Effectiveness
Ratio
Gain or Loss: Monetary value
Example: Paying more for locally
produced treatments to stimulate
the economy
Metrics for decisions
The aim of healthcare
The threshold diagram
The very simplest answer
What is a significant or minimal clinical effect?
• Length of life

What is a wonder drug?
Gillis B. Abiraterone Continues to Show Survival Benefit in Updated Interim Analysis. OncLive Feb 15, 2013. URL http://www.onclive.com/conference-coverage/gu-
2013/Abiraterone-Continues-to-Show-Survival-Benefit-in-Updated-Interim-Analysis#sthash.FGBsts9B.dpufAccessed October 7, 2014.
Mostly of reduced performance
status
Adds 5.2 months of life
But doesn’t cure
Is derived from Ketoconazole,
another CYP17 inhibitor that
blocks androgen biosynthesis
Delays deterioration in ECOG
performance status by 10.9 vs.
12.3 months = 43 days
cost per QALY = £63,200

Marginal benefits?
Randomised trial of CT
screening for lung cancer
Clinical benefit:
• 0.0316 life-years per person
(95% CI, 0.0154 to 0.0478)
• 365 x 0.0316 = 12 days extra
life
• 0.0201 QALYs per person
(95% CI, 0.0088 to 0.0314).
• 365 x 0.0201 = 7 Days of
good quality life
Ref: Black WC et al. Cost-effectiveness of CT screening in the National Lung Screening Trial.N Engl J Med. 2014 Nov
6;371(19):1793-802. doi: 10.1056/NEJMoa1312547

Is there a real minimum threshold for treatment?
Time-trade off studies
Silvestri G. BMJ. 1998;317:771
• U.S.A.: 81 patients previously treated with cis-platinum based
chemotherapy for advanced non-small cell lung cancer.
asked to indicate the minimum survival benefit required to
accept the side effects of chemotherapy
• chemotherapy with mild toxicity and
• chemotherapy with severe toxicity
asked to choose between chemotherapy and supportive care
• Benefit prolonged life by 3 months
• Benefit palliated symptoms, no survival gain
Silvestri G et al. Preferences for chemotherapy in patients with advanced non-small cell lung cancer: descriptive study based on scripted interviews.
BMJ. Sep 19, 1998; 317(7161): 771–775.

Time-trade off studies
Silvestri G. BMJ. 1998;317:771
• U.S.A.: 81 patients previously treated with cis-platinum based
chemotherapy for advanced non-small cell lung cancer.
asked to indicate the minimum survival benefit required to
accept the side effects of chemotherapy RESULTS
• chemotherapy with mild toxicity and Median 4.5m
• chemotherapy with severe toxicity Median 9m
asked to choose between chemotherapy and supportive care
• Benefit prolonged life by 3 months 22%
• Benefit palliated symptoms, no survival gain 68%
Silvestri G et al. Preferences for chemotherapy in patients with advanced non-small cell lung cancer: descriptive study based on scripted interviews.
BMJ. Sep 19, 1998; 317(7161): 771–775.

“Big Lung Trial” S Spiro. Thorax 2004;59:828
• 725 patients with un-resectable NSCLC
• randomised to receive supportive care alone (n = 361) or
supportive care plus cisplatin-based chemotherapy (n = 364).
• Results
• median survival 8.0 months v 5.7 months
• Chemotherapy improved OS by 9 weeks
Ref: S Spiro, et al. Chemotherapy versus supportive care in advanced non-small cell lung cancer: improved survival without detriment to quality of life.
Thorax. Oct 2004; 59(10): 828–836.

Time-trade off studies
Silvestri G et al. Preferences for chemotherapy in patients with advanced non-small cell lung cancer: descriptive study based on scripted interviews.
BMJ. Sep 19, 1998; 317(7161): 771–775.
Treatment preferences
for 81 patients who
had had
chemotherapy for lung
cancer.
Relation between
additional survival
offered and
percentage of patients
choosing
chemotherapy is
shown for mild toxicity
(scenario 1) and
severe toxicity
(scenario 2)
BIG
lung
trial 9
weeks

Time-trade off studies
Kim M K et al. Jpn. J. Clin. Oncol. 2008;38:64-70
A decade later the
findings are similar
Treatment preferences
for Japanese cancer
patients
Relation between
additional survival
offered and
percentage of patients
choosing
chemotherapy is
shown for mild toxicity
(scenario 1) and
severe toxicity
(scenario 2)
BIG
lung
trial 9
weeks

Metrics for decisions
The aim of healthcare
The threshold diagram
The very simplest answer
What is a significant or minimal clinical effect?
• Length of life
• Quality of life

What is a “meaningful clinical difference?”
Overall survival is a simple end-point to evaluate
• Extra length of life = ALY gain
But what if only Quality of life is improved?
• And what it it has not been directly measured?
The “minimally important difference” (MID) is easy to define
• The MID has been defined as the smallest change in a Patient
Reported Outcome (PRO) measure that is perceived by
patients as beneficial or that would result in a change in
treatment
And what if you don’t have a
validated PRO recorded
Revicki DA, et al. Responsiveness and minimal important differences for patient reported outcomes. Health Qual Life Outcomes 2006, 4:70

What is a “meaningful clinical difference?”
A QOL change that turned a patient from dependent on others to
independent living would be seen as a real benefit to patients
and carers
ECOG/ WHO PS 3, to independent, WHO PS 0-1Revicki DA, et al. Responsiveness and minimal important differences for patient reported outcomes. Health Qual Life Outcomes 2006, 4:70

What is a “meaningful clinical difference?”
A QOL change that turned a patient from dependent on others to
independent living would be seen as a real benefit to patients
and carers
ECOG/ WHO PS 3, to independent, WHO PS 0-1Pickard SA et al. Estimation of minimally important differences in EQ-5D utility and VAS scores in cancer. Health and
Quality of Life Outcomes 2010, 8:4
PS Utility
for all
patients
For Lung
cancer
only
0 0.85 0.78
1 0.73 0.68
2 0.63 0.55
3 0.45 0.52
Improvement
from 3 to 1 =
0.73-0.45 =
0.28 gain
If OS is not improved
by a treatment, and
median OS was 6
months there is no
ALY gain
If it improved mean
PS from 3 to 1 it
would gain 0.5 years
x 0.28 QOL= 0.14
QALYs gained
UK Data from
Pickard 2010
can be useful

What is a “meaningful clinical difference?”
A QOL change that turned a patient from dependent on others to
independent living would be seen as a real benefit to patients
and carers
ECOG/ WHO PS 3, to independent, WHO PS 0-1Pickard SA et al. Estimation of minimally important differences in EQ-5D utility and VAS scores in cancer. Health and
Quality of Life Outcomes 2010, 8:4
PS Utility
for all
patients
For Lung
cancer
only
0 0.85 0.78
1 0.73 0.68
2 0.63 0.55
3 0.45 0.52
AS a simple
measure for
HTA
1 x WHO PS gain is
0.1 to 0.18 Utility gain
UK Data from
Pickard 2010
can be useful
2 x WHO PS gain is
0.22 to 0.28 Utility gain
3 x WHO PS gain is
0.4 Utility gain

What is a “meaningful clinical difference?”
The Minimum Utility Gain to make a
noticeable difference is usually 0.10
– Pickard SA, 2010
• For a simple estimate HTA. This
equates to improvement in 1
ECOG/WHO performance level
A truly impressive QALY gain requires
a 2-3 ECOG/WHO performance level
gain
• Or 0.22 to 0.4 difference in QoL
Pickard SA et al. Estimation of minimally important differences in EQ-5D utility and VAS scores in cancer. Health and
Quality of Life Outcomes 2010, 8:4
1 x WHO PS gain is
0.1 to 0.18 Utility gain
2 x WHO PS gain is
0.22 to 0.28 Utility gain
3 x WHO PS gain is
0.4 Utility gain
So – a truly impressive symptomatic response, of duration 6 months, if
OS was not changed …
…might gain perhaps 0.5 x 0.4 = 0.2 QALYs

What is a “meaningful clinical difference?”
For the best results in a full HTA, we need to measure QOL using
a validated scale
• AND understand how society rates each health state
The simplest is to use the EQ5D 5 question tool
• From which we know Malaysian preference scores
3 x WHO PS gain is
0.4 Utility gain


Collecting EQ5D as a routine
Helps you decide if there is a meaningful benefit or loss in QOL
over time for a patient
• Can let you audit a protocol outcome
• Compare treatments
• Drive improvements in performance
Is used in the UK
• for routine Patient reported Outcomes surveys – to assess
variation between hospitals
• Used for “payment by results”
• For population health surveys to assess needs-based
allocation of resources
• For NICE assessments of preference in treatment and so
cost/QALY estimates for Valuation of cost utility
Devlin NJ. NHS Experience with the EQ5D as an outcome measure. Health Quality Council of Alberta, Cranmore, Canada,
18-19 Oct, 2012. URL http://www.slideshare.net/OHENews/devlin-canada-2012. Accessed October 7, 2014.

EQ5D is simple to collect – about 3 minutes

EQ5D is simple to collect – about 3 minutes
This patient has
scored 2,2,2,3,1
And a Global Visual
Analogue Q.o.L.
score of 0.65
3x3x3x3x3=243
potential results

Use of EQ5D to assess variation in QALY gained
by hip surgery by hospital in the UK
Devlin NJ. NHS Experience with the EQ5D as an outcome measure. Health Quality Council of Alberta, Cranmore, Canada,
18-19 Oct, 2012. URL http://www.slideshare.net/OHENews/devlin-canada-2012. Accessed October 7, 2014.

Cost per QALY difference between 336 UK
Hospitals
Devlin NJ. NHS Experience with the EQ5D as an outcome measure. Health Quality Council of Alberta, Cranmore, Canada,
18-19 Oct, 2012. URL http://www.slideshare.net/OHENews/devlin-canada-2012. Accessed October 7, 2014.

EQ5D in Malaysia
Faridah Aryani Md Yusof et al. Estimating an EQ-5D Value Set for Malaysia Using Time Trade-Off and Visual Analogue
Scale Methods. Value in Health 2012;15(1) suppl:S85-90

Faridah Aryani Md Yusof et al. Estimating an EQ-5D Value Set for Malaysia Using Time Trade-Off and Visual Analogue
Scale Methods. Value in Health 2012;15(1) suppl:S85-90
3x3x3x3x3=243
potential results
All 243 are now
scored for
Malaysia, ready for
local HTAs using
Malaysian Societal
values

A year lived at an EQ5D score 1,1,1,3,3 is worth about half a
QALY in Malaysia societal values
• 0.453 QALYs by Time Trade Off
• 0.511 QALYs by VAS
Faridah Aryani Md Yusof et al. Estimating an EQ-5D Value Set for Malaysia Using Time Trade-Off and Visual Analogue
Scale Methods. Value in Health 2012;15(1) suppl:S85-90

Minimum therapeutic benefit
Harvard Study, 1991
Survey of 51 oncologists
Lind SE,et al. Oncologists vary in their willingness to undertake anti-cancer therapies. Br. J. Cancer 1991;64:391-395

Minimum therapeutic benefit
A follow-up survey was conducted in March 1997 at a session on
NCCN clinical practice guidelines
“You are a 60-year-old oncologist with non-small-cell lung
cancer, one liver metastasis, and bone metastases. Your
performance status is 1.
• Would you take chemotherapy? Yes or no?”
YES
64.5% Medical Oncologists/Hematologists
67% Nurses
33% Radiation oncologists and other types of physicians
0% Nonmedical administrators
Do Doctors Refuse Chemotherapy On Themselves? http://anaximperator.wordpress.com/2010/05/06/do-75-of-doctors-refuse-
chemotherapy-on-themselves/. Accessed Sept 4, 2014

Minimum therapeutic benefit –
how do you ask the question?
Patients need to have the information required to obtain
informed consent
“Chemotherapy halves the odds of death with a serious toxicity
rate of 3%”
Chao, C. Adjuvant Chemotherapy for Breast Cancer: How Presentation of Recurrence Risk Influences Decision-Making. J Clin
Oncol 21:4299-4305.
Relative risk
Absolute risk

Minimum therapeutic benefit –
how do you ask the question?
Chao, C. Adjuvant Chemotherapy for Breast Cancer: How Presentation of Recurrence Risk Influences Decision-Making. J Clin
Oncol 21:4299-4305.
Different chance of
accepting
chemotherapy when
results are expressed
in Relative risk vs
absolute numbers

Metrics for decisions
The aim of healthcare
The threshold diagram
The very simplest answer
What is a significant or minimal clinical effect?
Debate on the value of a QALY threshold

International Comparisons 2008
US Medicare $50,000 or £34,000 per QALY
Stockholm Network Research Team. What Price for a Year of Life? The Threshold Discussion in Health Technology Assessment. URL:
http://www.stockholm-network.org/downloads/publications/HTA_4.pdf. Accessed Nov 2, 2014

What should we pay for a year of life?
Options to set a threshold that have general support:
Affordability – a multiple of per-capita annual income
• WHO <1 x GDP; 1 to 3; >3
Equity for all patients
Gerber AM and CE Phelps. Economic Foundations of Cost-effectiveness Analysis. Journal of Health Economics 1997(16):1-31.
Ubel PA. What Is the Price of Life and Why Doesn’t It Increase at the Rate of Inflation? Arch Intern Med 2003(163):1640-41
McGregor M. Cost-utility Analysis: Use QALYs Only With Great Caution. CMAJ 2003(168)4:433-4

Options to set a threshold that have general
support:
Affordability
– Endorsed by the WHO CHOICE programme and Commission on
Macroeconomics and Health (CMH)
• No more than 2 x per capita annual income (PCI)
– Garber AM, Phelps CE. Economic foundations of cost-effectiveness analysis. J
Health Econ. 1997 Feb; 16(1):1-31
– Evans DB & WHO Choosing Interventions that are Cost Effective (CHOICE)
Millennium Development Goals Team. Evaluation of current strategies and future
priorities for improving health in developing countries. BMJ. 2005 Dec 17;
331(7530):1457-61
– Sachs J. Macroeconomics and health: investing in health for economic
development. World Health Organization; Geneva: 2001
Garber AM, Phelps CE. Economic foundations of cost-effectiveness analysis. J Health Econ. 1997 Feb; 16(1):1-31
Evans DB & WHO Choosing Interventions that are Cost Effective (CHOICE) Millennium Development Goals Team. Evaluation of current strategies and future priorities for improving health in developing countries. BMJ. 2005 Dec 17;
331(7530):1457-61
Sachs J. Macroeconomics and health: investing in health for economic development. World Health Organization; Geneva: 2001
The $US50 000 per QALY (1982
year values) threshold commonly
used in the USA is similar to 2 x
Annual PCI ($US46 040)
This level rises
as society
becomes
wealthier
So the 2011
level = $US
100,000 per
QALY
Is 3x GDP too high?

Options to set a threshold that have general
support:
But the US is an unequal society.
The median wage in the US per person was only $26,695 in 2011
– How much do Americans earn? What is the average US income and other
income figures. Fiscal cliff talks only useful in context of incomes. My Budget
360. URL: http://www.mybudget360.com/how-much-do-americans-earn-what-is-
the-average-us-income/ Accessed Oct 30, 2014.
Conversion performed Oct 30, 2014. URL:
https://www.google.co.uk/search?q=convert+53%2C390+USD+to+gbp&oq=convert+53%2C390+USD+to+gbp&aqs=chrome..69i57.5277j0j4
&sourceid=chrome&es_sm=91&ie=UTF-8
The $US50 000 per QALY (1982
year values) threshold commonly
used in the USA is similar to 2 x
Annual PCI ($US46 040)
This level rises
as society
becomes
wealthier
So the 2008
level =
$US101,295
per QALY
A better
estimate of
affordability
may be
2 x
26,695 =
53,390
USD
Almost
identical to
NICE’s
30,000
GBP/QALY

What should we pay for a year of life?
Options to set a threshold that have general support:
Affordability – a multiple of per-capita annual income
Equity for all patients
• Equivalent cost effectiveness of Dialysis
• Not significantly different from the current average cost
effectiveness of the health system
Gerber AM and CE Phelps. Economic Foundations of Cost-effectiveness Analysis. Journal of Health Economics 1997(16):1-31.
Ubel PA. What Is the Price of Life and Why Doesn’t It Increase at the Rate of Inflation? Arch Intern Med 2003(163):1640-41
McGregor M. Cost-utility Analysis: Use QALYs Only With Great Caution. CMAJ 2003(168)4:433-4

What should we pay for a year of life?
The first reported formal threshold
• The ‘Medicare Dialysis Standard’ – $50,000 (US) for a QALY.
Originates from a 1982 ruling by the US public health fund
Medicare that concerned a programme to treat patients with
chronic renal failure.
The ruling intended to make sure that the treatment was only
applied in serious cases, so that it resulted in the mentioned
cost-per-QALY number.
Equity of access to health care then suggests that all other
treatment options up to – $50,000 (US) for a QALY should also be
provided.
Stockholm Network Research Team. What Price for a Year of Life? The Threshold Discussion in Health Technology Assessment. URL:
http://www.stockholm-network.org/downloads/publications/HTA_4.pdf. Accessed Nov 2, 2014

What should we pay for a year of life?
One level that is often advised is to set it at the level for Dialysis
• So that cancer patients and renal failure patients could have
the same access to treatment
• USA suggests haemodialysis works out at about $50,000/year
Under Medicare rules, renal dialysis is a federal entitlement to all
United States citizens, and is thus considered cost-effective by
US standards.
• As such, any other treatment that costs $50,000 or less per
QALY is considered cost-effective as well.
Gerber AM and CE Phelps. Economic Foundations of Cost-effectiveness Analysis. Journal of Health Economics 1997(16):1-31.
Ubel PA. What Is the Price of Life and Why Doesn’t It Increase at the Rate of Inflation? Arch Intern Med 2003(163):1640-41
McGregor M. Cost-utility Analysis: Use QALYs Only With Great Caution. CMAJ 2003(168)4:433-4
Shows close
agreement
with UK
N.I.C.E.
30,000 GBP

What should we pay for a year of life?
One level that is often advised is to set it at the level for Dialysis
• So that cancer patients and renal failure patients could have
the same access to treatment
• USA suggests haemodialysis works out at about $50,000/year
Critique is that
• medical advances and rising costs have forced this higher
since the original $50,000 calculation
Gerber AM and CE Phelps. Economic Foundations of Cost-effectiveness Analysis. Journal of Health Economics 1997(16):1-31.
Ubel PA. What Is the Price of Life and Why Doesn’t It Increase at the Rate of Inflation? Arch Intern Med 2003(163):1640-41
McGregor M. Cost-utility Analysis: Use QALYs Only With Great Caution. CMAJ 2003(168)4:433-4
Shows close
agreement
with UK
N.I.C.E.
30,000 GBP

What should we pay for a year of life?
Critique is that
• medical advances and rising costs have forced this higher
since the original $50,000 / Year calculation
Stanford recalculation by Lee et al:
• computer analysis of more than half a million patients who
underwent dialysis, adding up costs and comparing that data
to treatment outcomes.
• Cost/QALY = $129,000
Lee CP et al. An Empiric Estimate of the Value of Life: Updating the Renal Dialysis Cost-Effectiveness Standard. Value in
Health 2009;12(1):80-87

What should we pay for a year of life?
Critique of the critique is that
• Dialysis costs have risen fast than any extra clinical benefits
Renal Week 2009 presentation:
• 2009 Costs for a year of dialysis = $73,000
• Even modest improvements in the survival of patients with
end-stage renal disease undergoing dialysis may lead to
billions of dollars in extra costs
• Paying for "new advances" will cost the USA and extra $14
billion each year
MacReady N. Skyrocketing Costs of Dialysis May Require Difficult Decisions. Medscape Medical News November 09, 2009.
http://www.medscape.com/viewarticle/712019. Accessed Aug 31, 2014
Lee CP et al. An Empiric Estimate of the Value of Life: Updating the Renal Dialysis Cost-Effectiveness Standard. Value in Health 2009;12(1):80-87
Will these extras be worth it
compared with other things that
could be done with $14 Billion?

Comparisons with dialysis
What is the cost/benefit of the Malaysian Dialysis programme?
Budget is under threat with annual rise of between 7%-13% of
new patients joining dialysis program in the last five years.
Costs include:
RM50mil was spent on medication after transplantation
Arukesamy K. Government funds almost 60% of all haemodialysis funding. The Sun Daily. Posted on 27 December 2011 - 05:24am. http://www.thesundaily.my/news/249349 Accessed Aug 31, 2014
Malaysian patients spend $286mil on kidney dialysis yearly. Star/Asia News Network Dec 14, 2011. http://news.asiaone.com/News/AsiaOne+News/Malaysia/Story/A1Story20111214-
316098.html#sthash.rIyeRX7R.dpuf. Accessed Aug 31, 2014
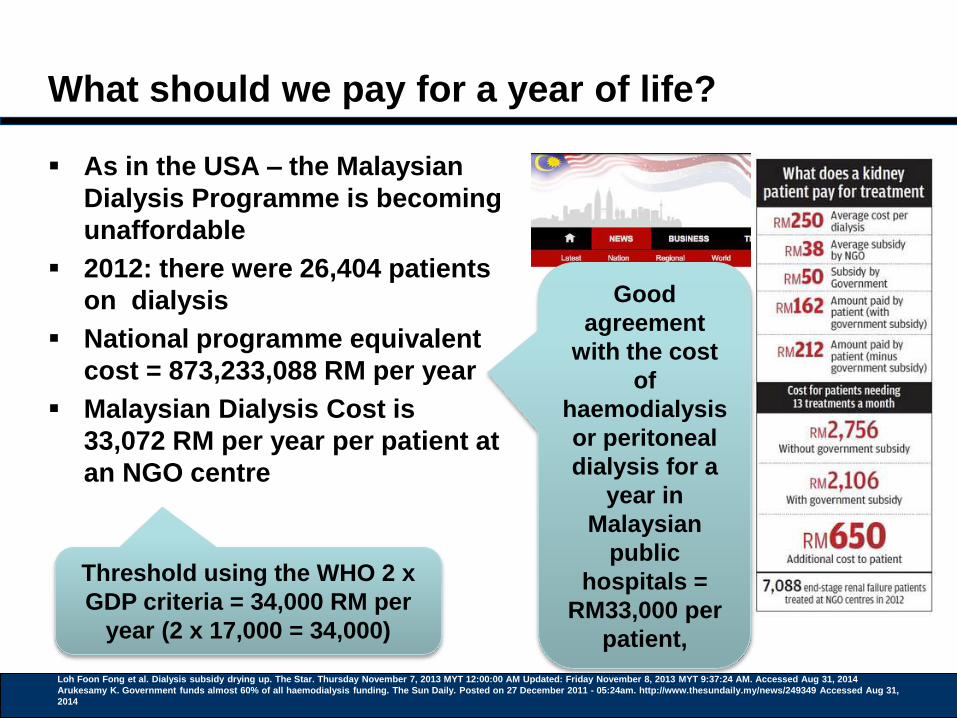
What should we pay for a year of life?
As in the USA – the Malaysian
Dialysis Programme is becoming
unaffordable
2012: there were 26,404 patients
on dialysis
National programme equivalent
cost = 873,233,088 RM per year
Malaysian Dialysis Cost is
33,072 RM per year per patient at
an NGO centre
Loh Foon Fong et al. Dialysis subsidy drying up. The Star. Thursday November 7, 2013 MYT 12:00:00 AM Updated: Friday November 8, 2013 MYT 9:37:24 AM. Accessed Aug 31, 2014
Arukesamy K. Government funds almost 60% of all haemodialysis funding. The Sun Daily. Posted on 27 December 2011 - 05:24am. http://www.thesundaily.my/news/249349 Accessed Aug 31,
2014
Threshold using the WHO 2 x
GDP criteria = 34,000 RM per
year (2 x 17,000 = 34,000)
Good
agreement
with the cost
of
haemodialysis
or peritoneal
dialysis for a
year in
Malaysian
public
hospitals =
RM33,000 per
patient,

What should we pay for a year of life?
As in the USA – the Malaysian
Dialysis Programme is
becoming unaffordable
2012: there were 26,404
patients on dialysis
National programme
equivalent cost = 873,233,088
RM per year
Malaysian Dialysis Cost is
33,072 RM per year per patient
at an NGO centre
Loh Foon Fong et al. Dialysis subsidy drying up. The Star. Thursday November 7, 2013 MYT 12:00:00 AM Updated: Friday November 8, 2013 MYT 9:37:24 AM. Accessed Aug 31, 2014
Arukesamy K. Government funds almost 60% of all haemodialysis funding. The Sun Daily. Posted on 27 December 2011 - 05:24am. http://www.thesundaily.my/news/249349 Accessed Aug 31, 2014
Faridah Aryani Md Yusof et al. Cost Utility Analysis of the Ministry of Health Dialysis Programme. iHEA 2007 6th World Congress: Explorations in Health Economics Paper. Available at
http://papers.ssrn.com/sol3/papers.cfm?abstract_id=993376. Accessed Aug 31, 2014
Threshold using the WHO 2 x
GDP criteria = 34,000 RM per
year (2 x 17,000 = 34,000)
Good
agreement with
the cost of
haemodialysis
or peritoneal
dialysis for a
year in
Malaysian
public hospitals
= RM33,000 per
patient,
Cost/QALY in
Malaysia
estimated at
RM43,000 for
haemodialysis
and RM41,000
for CAPD.
GDP for 2013 from - World Bank.
Malaysia Overview. Updated on
February 28, 2014. URL:
http://www.worldbank.org/en/countr
y/malaysia/overview. Accessed Oct
13, 2014. World Bank. Malaysia
Overview. Updated on February 28,
2014. URL:
http://www.worldbank.org/en/countr
y/malaysia/overview. Conversion
USD to MYR via Google Oct 13,
2014.
URL:https://www.google.co.uk/web
hp?sourceid=chrome-
instant&ion=1&espv=2&ie=UTF-
8#q=10500%20USD%20to%20MY
R. Accessed Oct 13, 2014.
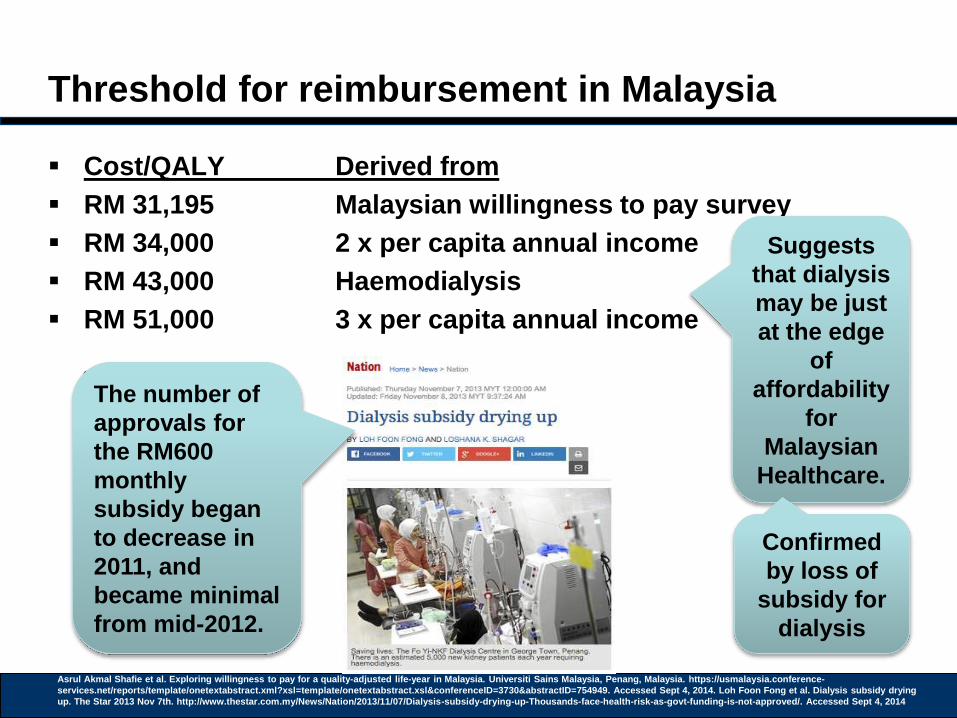
Threshold for reimbursement in Malaysia
Cost/QALY Derived from
RM 31,195 Malaysian willingness to pay survey
RM 34,000 2 x per capita annual income
RM 43,000 Haemodialysis
RM 51,000 3 x per capita annual income
Suggests
that dialysis
may be just
at the edge
of
affordability
for
Malaysian
Healthcare.
Asrul Akmal Shafie et al. Exploring willingness to pay for a quality-adjusted life-year in Malaysia. Universiti Sains Malaysia, Penang, Malaysia. https://usmalaysia.conference-
services.net/reports/template/onetextabstract.xml?xsl=template/onetextabstract.xsl&conferenceID=3730&abstractID=754949. Accessed Sept 4, 2014. Loh Foon Fong et al. Dialysis subsidy drying
up. The Star 2013 Nov 7th. http://www.thestar.com.my/News/Nation/2013/11/07/Dialysis-subsidy-drying-up-Thousands-face-health-risk-as-govt-funding-is-not-approved/. Accessed Sept 4, 2014
Confirmed
by loss of
subsidy for
dialysis
The number of
approvals for
the RM600
monthly
subsidy began
to decrease in
2011, and
became minimal
from mid-2012.
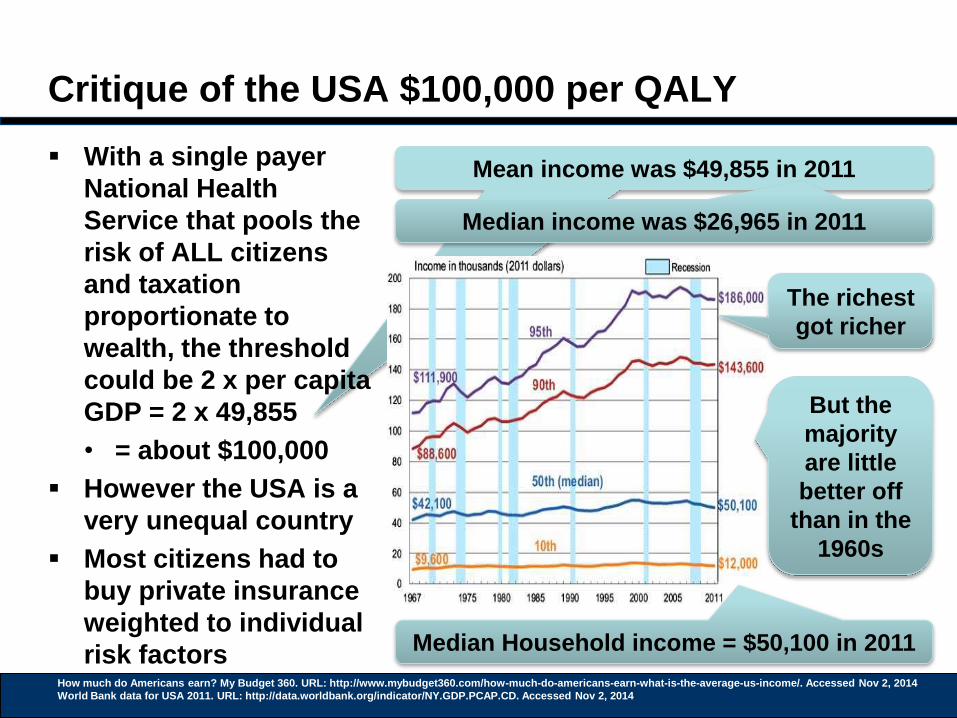
Mean income was $49,855 in 2011
Critique of the USA $100,000 per QALY
With a single payer
National Health
Service that pools the
risk of ALL citizens
and taxation
proportionate to
wealth, the threshold
could be 2 x per capita
GDP = 2 x 49,855
• = about $100,000
However the USA is a
very unequal country
Most citizens had to
buy private insurance
weighted to individual
risk factorsHow much do Americans earn? My Budget 360. URL: http://www.mybudget360.com/how-much-do-americans-earn-what-is-the-average-us-income/. Accessed Nov 2, 2014
World Bank data for USA 2011. URL: http://data.worldbank.org/indicator/NY.GDP.PCAP.CD. Accessed Nov 2, 2014
Median income was $26,965 in 2011
The richest
got richer
But the
majority
are little
better off
than in the
1960s
Median Household income = $50,100 in 2011

Mean income was $49,855 in 2011
Critique of the USA $100,000 per QALY
With a single payer
National Health
Service that pools the
risk of ALL citizens
and taxation
proportionate to
wealth, the threshold
could be 2 x per capita
GDP = 2 x 49,855
• = about $100,000
However the USA is a
very unequal country
Most citizens had to
buy private insurance
weighted to individual
risk factorsHow much do Americans earn? My Budget 360. URL: http://www.mybudget360.com/how-much-do-americans-earn-what-is-the-average-us-income/. Accessed Nov 2, 2014
World Bank data for USA 2011. URL: http://data.worldbank.org/indicator/NY.GDP.PCAP.CD. Accessed Nov 2, 2014
Median income was $26,965 in 2011
Very Close in agreement with the
UK N.I.C.E £30,000/QALY
threshold !
What the typical US citizen
could actually afford was 2 x
Median Salary of 26,965
approximately $54,000/QALY
$54,000 = £34,000

Critique of the USA $100,000 per QALY: Explains
why US medicine has become unaffordable
Mangan D. Medical Bills Are the Biggest Cause of US Bankruptcies: Study. CNBC Jun 25, 2013. URL: http://www.cnbc.com/id/100840148#. Accessed Nov 2, 2014
Kane L. Nearly One-Third of Americans Can’t Afford Health Care. Learnvest.com. Dec 21, 2012. URL: http://www.learnvest.com/2012/12/nearly-one-third-of-americans-
cant-afford-health-care-123/. Accessed Nov 2, 2014
Very Close in agreement with the
UK N.I.C.E £30,000/QALY
threshold !
Strongly validates 2 x GDP as an
upper reimbursement threshold !

US & UK agreement?
The US $50,000 or £34,000 per QALY upper limit is also identical
to the upper routine threshold calculated for the UK
Martin et al (2008) examined variations in NHS local purchaser
spending and mortality by disease area for one year
– Martin S, Rice N and Smith P (2008) “Does health care spending improve health
outcomes? Evidence from English programme budgeting data.” Journal of Health
Economics Vol.27 (4): pp826-842.
Cost to “buy” an Added Life Year (ALY) in UK cancer medicine is
£13,100 in 2008
• About 1 x GDP
Upper 95% CI spend for a QALY is £34,099
• About 2 x GDP

Metrics for decisions
The aim of healthcare
The threshold diagram
The very simplest answer
What is a significant or minimal clinical effect?
Debate on the value of a QALY threshold
Debate in Thailand

Development of Health Technology Assessment
in Thailand
Milestones
Sripen Tantivess, Health technology assessment and policymaking in Thailand.
http://www.worldhealthsummit.org/fileadmin/downloads/2013/WHSRMA_2013/Presentations/Day_3/Tantivess%20Sripen%20-
%20Health%20Technology%20Assessment%20and%20Policymaking%20in%20Thailand.pdf. Accessed Sept 17, 2014

Development of Health Technology Assessment
in Thailand
Established standards, guidelines, tools:
• National Methodological Guidelines for HTA
• Cost-effectiveness threshold – 1 GNI per capita per QALY
gained (120,000 Baht)
• Thailand’s HTA database
• Standard Costs Menu
Sripen Tantivess, Health technology assessment and policymaking in Thailand.
http://www.worldhealthsummit.org/fileadmin/downloads/2013/WHSRMA_2013/Presentations/Day_3/Tantivess%20Sripen%20-
%20Health%20Technology%20Assessment%20and%20Policymaking%20in%20Thailand.pdf. Accessed Sept 17, 2014

Development of Health Technology Assessment
in Thailand
HTA are used to decide coverage by
Universal Health Coverage plan – benefit package
• UHC manager: National Health Security Office (NHSO)
• Literally, all services are covered, except those on ‘negative’
list
• Interventions: diagnosis, treatment, prevention, health
promotion, rehabilitation
• Focus: safety, effectiveness, cost-effectiveness, budget
impact
Sripen Tantivess, Health technology assessment and policymaking in Thailand.
http://www.worldhealthsummit.org/fileadmin/downloads/2013/WHSRMA_2013/Presentations/Day_3/Tantivess%20Sripen%20-
%20Health%20Technology%20Assessment%20and%20Policymaking%20in%20Thailand.pdf. Accessed Sept 17, 2014

Development of Health Technology Assessment
in Thailand
HTA are used to decide coverage by
National List of Essential Medicines (NLEM)
• Executive Committee, with support from technical working
groups
• National pharmaceutical benefit package
• Interventions: pharmaceuticals, vaccines and other biological
products
• Focus: safety, effectiveness, cost-effectiveness, budget
impact and others
Sripen Tantivess, Health technology assessment and policymaking in Thailand.
http://www.worldhealthsummit.org/fileadmin/downloads/2013/WHSRMA_2013/Presentations/Day_3/Tantivess%20Sripen%20-
%20Health%20Technology%20Assessment%20and%20Policymaking%20in%20Thailand.pdf. Accessed Sept 17, 2014
If treatment is a drug

Development of Health Technology Assessment
in Thailand
Sripen Tantivess, Health technology assessment and policymaking in Thailand.
http://www.worldhealthsummit.org/fileadmin/downloads/2013/WHSRMA_2013/Presentations/Day_3/Tantivess%20Sripen%20-
%20Health%20Technology%20Assessment%20and%20Policymaking%20in%20Thailand.pdf. Accessed Sept 17, 2014
Recent examples of reimbursement decisions by HITAP
Renal Dialysis
• Was more expensive than 120,000 Baht/QALY
• Peritoneal dialysis for ESRD (ICER=435,000)
• Hemodialysis for ESRD (ICER=449,000)
Social considerations were included -
because this treated catastrophic diseases
with a life-saving intervention

Development of Health Technology Assessment
in Thailand
ยามะเร็งสุดแพงเข็มละ 7 หม่ืนบาท รกัษาหายใชเ้งินกว่าลา้น สปส./30 บ.เขา้ไม่ถึง Submitted by ปารณีย์ จิรสัยจิ์นดา on 18 June 2012 22:30
Recent examples of reimbursement decisions by HITAP
Trastuzumab for breast cancer (August 2014)
HITAP report (http://hitap.net/en/node/11172)
• the cost of Trastuzumab - Herceptin was Priced at 98,340 USD
• Up to 60% price reductions required of the pharmaceutical
company

Thresholds to set reimbursement
Country GDP in USD in 2012
Singapore 51,162
Japan 46,735
S Korea 23,113
Taiwan 20,328
Malaysia 10,304
Thailand 5,678
UK 38,649 (23665 GBP)
Adapted from the IMF's World Economic Outlook Database (April 2013). http://www.imf.org/external/pubs/ft/weo/2013/01/weodata/weorept.aspx?sy=2010&ey=2012&scsm=1&ssd=1&sort=country&ds=.&br=1&
pr1.x=74&pr1.y=12&c=548%2C924%2C576%2C528%2C532%2C578%2C158%2C542&s=NGDPDPC%2CPPPGDP%2CPPPPC&grp=
0&a=
Thailand set a cost/QALY threshold
of 120,000 Baht/QALY ≈ 1 x GDP in
2009
Raised to 160,000 Baht/QALY in
2013 ≈ 1.2 x GDP
UK set a routine cost/QALY
threshold of 20,000 GBP ≈ 1 x GDP
Rising to 30,000 GBP after careful
economic assessment ≈ 1.3 x GDP
Rising to 50,000 GBP in very
selected situations (end of life)
≈ 2 x GDP
Sripen Tantivess, Health technology assessment and policymaking in Thailand.
http://www.worldhealthsummit.org/fileadmin/downloads/2013/WHSRMA_2013/Presentations/Day_3/Tantivess%20Sripen%20-
%20Health%20Technology%20Assessment%20and%20Policymaking%20in%20Thailand.pdf. Accessed Sept 17, 2014
Raised to 449,000 Baht/QALY for
dialysis ≈ 2.8 x GDP

Metrics for decisions
The aim of healthcare
The threshold diagram
The very simplest answer
What is a significant or minimal clinical effect?
Debate on the value of a QALY threshold
Debate in Thailand
Practical steps in guideline writing

How many treatment pathways are needed for
each cancer?
Ref: Hoppe RT . Patterns of Care Process Study Newsletter [Hodgkins disease]. 1990-1991. Philadelphia, American College of radiology, 1991
The value of
decision tree
diagrams
Key part of USA
Patterns of care
studies
Describes work
up and staging
This tree results
in 5 Treatment
Summary
groups (TS 1 to
5)

How many protocols do we need?
5 cancers in Malaysia account for more than half the burden,
2007 data
– National cancer Registry Report, 2007
Remember – it takes as long to write the guidelines for a rare
cancer as a common one!
58.4%
National Cancer Registry Report, Malaysia Cancer Statistics – Data and Figure 2007, Ariffin OZ, Saleha IT, Ministry of
Health, Malaysia, 2011.

How many guidelines for treatment are needed?
Despite there being >200 types of cancer
• Most countries need <20 guidelines to cover >70%
of the cancer population in men and women
Ref: Mary Chin. 64 oncologists and nearly half women. Daily Express Feb 25, 2012. URL: http://www.dailyexpress.com.my/read.cfm?NewsID=868.
Accessed Oct 15, 2014
71.9% of all
male cancer
77.6% of all
female cancer
10 Guidelines + 5 more
Guidelines

How many guidelines for cost-effective
treatment are needed?
Despite there being >200 types of cancer
• Most countries need <20 guidelines to cover >70%
of the cancer population in men and women
Ref: Mary Chin. 64 oncologists and nearly half women. Daily Express Feb 25, 2012. URL: http://www.dailyexpress.com.my/read.cfm?NewsID=868.
Accessed Oct 15, 2014
71.9% of all
male cancer
77.6% of all
female cancer
10 Guidelines + 5 more
Guidelines
2012: 64
Oncologists
were working
in Malaysia
If 4 Oncologists took a week of study leave to draft
each cost-effectiveness guideline, then Malaysian
Specific guidelines could be written in 1 year that
covered >70% of the national cancer incidence
Or the insurers and MoH
need to fund 15 weeks
study leave for a team of 4
Oncologists to create the
National guidelines
Once created,
annual updates
take far less
time &
resource

Why is it in the interests of the MoH and
Insurers to support such a policy?
Investing in systems to promote Cost-Effective care is good
value
Thailand
• Health Intervention and Technology Assessment Program
(HITAP) cost-effectiveness group set up 2007
• MoH Invests in a staff of 50, 1 Million USD/Year costs
• By 2013, had saved Thailland’s MoH >1000 Million Baht
Ref Sripen Tantivess, Health technology assessment and policymaking in Thailand. URL:
http://www.worldhealthsummit.org/fileadmin/downloads/2013/WHSRMA_2013/Presentations/Day_3/Tantivess%20Sripen%20-
%20Health%20Technology%20Assessment%20and%20Policymaking%20in%20Thailand.pdf. Accessed Oct 15, 2014
>30 Million USD
>100 Million RM
A Five-fold return
on investment

DOI: http://dx.doi.org/10.1007/s11523-011-0196-3
Albert Einstein
Strive not to be a success,
but rather to be of value