Setting Personnel Strength Levels: Experience and ...
82
SEPTEMBE, Setting Personnel Strength Levels: Experience and Productivity in the Military
Transcript of Setting Personnel Strength Levels: Experience and ...

SEPTEMBE,
Setting PersonnelStrength Levels:Experience and Productivityin the Military


SETTING PERSONNEL STRENGTH LEVELS:
EXPERIENCE AND PRODUCTIVITY IN THE MILITARY
The Congress of the United StatesCongressional Budget Office
UBIT ' ' o IT
NOTES
All years referred to in this report are fiscal years unlessotherwise indicated.
Details in the text and tables of this report may not addto totals because of rounding.

PREFACE
The period since military conscription was ended in 1973 has been marked bya gradual shift toward greater seniority in the active enlisted forces. Thisshift is likely to continue into the 1990s, with large increases in the numbersof senior career personnel adding significantly to personnel costs and per-haps increasing productivity. This report, produced at the request of theSubcommittee on Military Personnel and Compensation, House Armed Ser-vices Committee, projects the future levels of experience in the enlistedforces and examines the cost and benefits of seniority growth. It also devel-ops alternatives to the services' enlisted strength plans that reflect in-creased productivity. In accordance with the mandate of the CongressionalBudget Office (CBO) to provide objective analyses, the report makes norecommendations.
Richard L. Fernandez of CBO's National Security Division preparedthe report under the general supervision of Robert F. Hale and Neil M.Singer. Elizabeth Sterman, also of the National Security Division, preparedmuch of the data. The author thanks Stanley A. Horowitz of the Institutefor Defense Analysis for his insightful review of an earlier draft. (Externalreviewers bear no responsibility for the final product, which rests solelywith CBO.) Thanks go also to the Policy and Systems Integration Office,Directorate of Manpower and Organization, Headquarters United States AirForce, which provided unplublished data from an earlier study sponsored bythe Air Force. CBO staff members Elizabeth Chambers, Paul Christy, andMichael A. Miller provided helpful comments. Francis S. Pierce edited themanuscript, assisted by Nancy H. Brooks, and Rebecca J. Kees prepared itfor publication.
Edward M. GramlichActing Director
September 1987
'HBFT

_.ii._.Jli._._ _ _ . . _ _ _ • JJJBL

CONTENTS
SUMMARY ix
I INTRODUCTION 1
Background 2
II PROJECTED EXPERIENCE STRUCTURES, ANDCOSTS, FOR THE ENLISTED FORCES 5
Projected Experience Structures 5Projection Assumptions 7Cost Projections 10The Costs of Seniority Growth 13
III EXPERIENCE AND PRODUCTIVITY 19
The Enlisted Utilization Survey 20The RAND Air Force Study 23Projections of Aggregate Productivity 27Limitations and Qualifications 30Conclusions 36
IV AGGREGATE PRODUCTIVITY LEVELS ANDENLISTED STRENGTH PLANS 39
Assumptions and Procedure 40Enlisted Strengths and Costs 41Conclusions 46
APPENDIXES
A Pay and Unemployment Elasticities 51B Development of Productivity Indexes
from the RAND Air Force Study 53
TfflflT ~n rr

-1I...1JL... _ . . JJJMIL
vi SETTING PERSONNEL STRENGTH LEVELS September 1987
TABLES
SUMMARYTABLE 1. Sources of Growth in Personnel
Costs over 1987 Levels xi
SUMMARYTABLE 2. Enlisted Strengths and Costs
under Defense Department Planand Changes under CBO Alternatives xv
1. Enlisted Personnel Cost Projections byCategory, Four-Service Total, 1987-1994 11
2. Sources of Growth in PersonnelCosts over 1987 Levels 13
3. Percent Distribution of EnlistedForces by Pay Grade, 1985Actual and 1992 Projected 14
4. Projected Costs of SeniorityGrowth Arising from MaintainingPromotion Rates and Timings 17
5. Projected Costs of SeniorityGrowth Arising from LongevityIncreases in Pay 17
6. Seniority Growth Costs andProductivity Improvements:1992 versus 1987 29
7. Personnel Strengths, Presentand Planned, with Alternativesunder Three Productivity Cases 42
8. Personnel Costs, Present andProjected, with Alternativesunder Three Productivity Cases 44
A-1. Assumptions for Pay and UnemploymentElasticities, by Service and Yearof Service 51

FIGURES vii
FIGURES
SummaryFigure.
1.
2.
3.
4.
5,
6.
7.
8.
Projected Changes in AverageProductivity (Case 1)
Junior Noncommissioned Officersas Percent of Enlisted Force,1974-1985
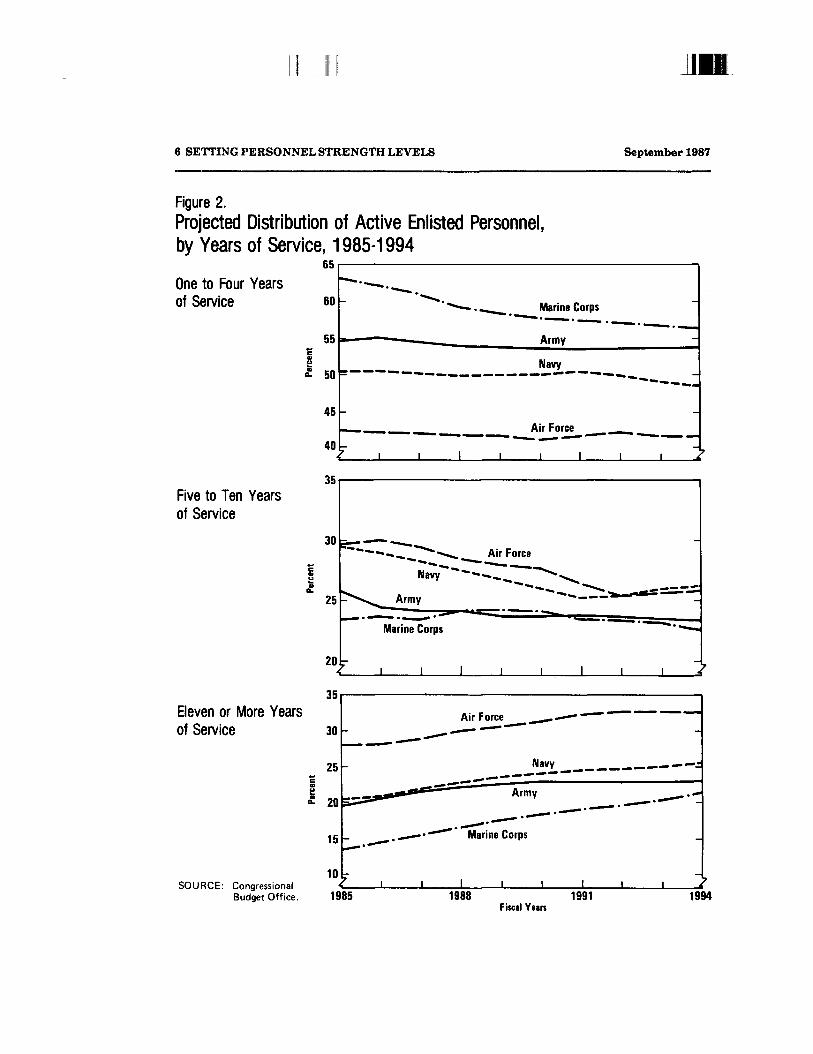
Projected Distribution ofActive Enlisted Personnel,by Years of Service, 1985-1994
Planned Changes in EnlistedStrengths from 1987 Levels
Productivity Indexes by Serviceand Year of Service
Relative Task Completion Times
Productivity Indexes byYear of Service
Projections of AverageProductivity in the EnlistedForce of Each Service
Changes in Enlisted StrengthLevels from 1987: Case 2
xm
9
22
24
26
28
43
IIBF "TT


SUMMARY
Since the end of the draft in 1973, there has been a trend toward moresenior enlisted forces. This trend, resulting from the higher reenlistmentrates of true volunteers as compared with draftees and draft-motivated vol-unteers, has important consequences for personnel costs. The CongressionalBudget Office (CBO) projects that seniority growth-that is, the increase inaverage years of service of enlisted personnel~in the four active serviceswill raise real personnel costs in the early 1990s substantially above their1987 levels. Over the five years 1988 to 1992, added costs will total at least$1.4 billion, and perhaps as much as $2.8 billion; in 1992 alone, costs will behigher by as much as $720 million.
These projected cost increases, amounting to 0.8 percent to 1.4 per-cent of total enlisted personnel costs in 1992, are an obvious target forefforts to reduce Defense Department personnel expenditures. Senioritygrowth thus raises two important questions:
o Will more senior forces offer benefits in terms of greater capa-bilities that will balance their greater costs?
o How would increased capabilities affect the appropriate sizes ofthe enlisted forces?
This study provides preliminary answers to these two questions, as wellas projecting the coming changes in enlisted seniority and in personnel costs.Available evidence on experience/productivity trade-offs in the military in-dicates that, as seniority increases through the early 1990s, all four enlistedforces will become considerably more capable. This may be a fairly inex-pensive way to improve defense capabilities. Seniority growth also meansthat cuts in enlisted strengths below planned levels could perhaps be madewithout reducing planned capabilities.
THE UPWARD TREND IN ENLISTED EXPERIENCE
In 1974, 28 percent of the draft-era volunteers completing their first enlist-ment terms chose to reenlist. Four years later, the first-term reenlistmentrate was up to 36 percent. As a result of this improved retention, the

SETTING PERSONNEL STRENGTH LEVELS September 1987
percentage of personnel in years-of-service five through ten rose substan-tially between 1974 and 1980 in every service-in the Army, for example,from 15.4 percent to 24.0 percent. The percentage continued to rise in the1980s, spurred by improved military pay, high civilian unemployment, and,perhaps, more favorable attitudes toward military service.
In the late 1980s and early 1990s, the large numbers of personnel cur-rently in years-of-service five through ten should be reflected in the seniorcareer forces. In the Air Force, for example, the proportion of the enlistedforce with more than 10 years of service should rise from 28 percent in 1985to 33 percent in 1994. The Army and Navy should experience similar gains,and the Marine Corps an even larger increase. In the latter service, thisgrowth will come implicitly at the expense of the first-term force; in theother services, the percentage of personnel in years-of-service five throughten will drop. These projections assume that the services will not alter theirreenlistment policies, that military pay will keep pace with pay in the pri-vate sector, and that the civilian unemployment rate will continue its de-cline through the early 1990s.
COSTS OF SENIORITY GROWTH
Seniority growth accounts for more than one-fourth of the $2.6 billion in-crease in real (inflation-adjusted) annual personnel costs that this study pro-jects between 1987 and 1992 (see Summary Table 1). Seniority-growth costsare reflected in the Administration's budget request, although Administra-tion estimates may differ from those of this study. No seniority growth isassumed in CBO's baseline projections of the federal budget, which are usedby the Congress in the budget process.
Two factors contribute to the $720 million projected cost of senioritygrowth: a rise in the average enlisted pay grade; and higher average paylevels because of longevity increases in basic pay.
How Seniority Growth Affects the Mix of Pay Grades
Unless promotion rates are reduced or promotions slowed, rising senioritywill increase the percentages of personnel in the top four of the services'nine enlisted pay grades. In the Navy, for example, this study projects anincrease for pay grades E-7 and above from 9.5 percent in 1985 to 11.5percent in 1992; in the Army, from 10.7 percent to 12.6 percent. The shiftsin grade distributions will add $300 million to personnel costs in 1992, rela-

SUMMARY ri
tive to what costs would be if the aggregate mix of pay grades in eachservice did not change. The projected shifts continue at least into the mid-1990s, contributing to additional cost growth in those years.
The cost increases could be limited by slowing promotions, particularlyto grades E-6 and E-7. If promotion times were delayed from 6 months to21 months (depending on the service), the services' grade mixes would re-main constant. Slowed promotion would adversely affect retention to someextent, an effect that this study did not explicitly consider.
How Seniority Growth Affects Pay Rates
Even without richer grade mixes, seniority growth should increase personnelcosts because longevity increases are a feature of the military basic pay
SUMMARY TABLE 1. SOURCES OF GROWTH IN PERSONNELCOSTS OVER 1987 LEVELS(In millions of 1987 dollars)
Soiirce of Growth
Richer Grade Mix
Longevity Pay Increases
Personnel Strength Changes
Real Pay Changes
1992
300
420
660
2,240
Total1988-1992
890
1,410
1,830
4,290
Changes in RetiredPay Accrual Rate a/ -970 -3,110
Total 2,640 5,310
SOURCE: Congressional Budget Office.
a. Effects of changes in the normal cost percentage used in calculating the accrual chargefor retired pay. Does not include effects of changes in real levels of basic pay.

xii SETTING PERSONNEL STRENGTH LEVELS September 1987
table. Longevity increases reward length of service independently of theeffects of promotion. Other cost elements-medical costs, for example--also will show growth as the enlisted forces become more senior. When thegrade mix is held constant, seniority growth contributes $420 million topersonnel costs in 1992, and more in succeeding years.
EXPERIENCE AND PRODUCTIVITY
Two attempts to measure productivity at various levels of experience haveyielded useful information. The Enlisted Utilization Survey (EUS), con-ducted by the RAND Corporation in the mid-1970s, examined productivitygrowth during the first enlistment term. Subsequent analyses of the datafound strong relationships between experience and productivity in a broadcross-section of military occupational specialties. The second study, whichlooked at one Air Force specialty, found substantial growth beyond the firstterm.
Productivity Indexes
Averaging across occupational specialties in the EUS yields plausible indexesof productivity by year of service over the first four years of service for theArmy, Navy, and Air Force. Each shows very low productivity in the firstyear of service, reflecting time devoted to training when productivity isassumed to be zero. The Marine Corps was not covered in the EUS; thepresent study has used the Army index in examining Marine Corps produc-tivity.
Because the results of the Air Force study were sensitive to the as-sumptions embodied in this analysis, the present study employs three alter-native indexes to span the range of likely productivity growth. Case 1,which is consistent with the assumptions of the original analysis, showssenior personnel as roughly 52 percent more productive than those with fouryears of service completed. Case 2 simply halves the improvement over thefourth-year reference point. Case 3 arbitrarily imposes the assumption thatproductivity does not improve beyond the first term. These three indexes ofproductivity by year of service were assumed to apply equally well to allfour services, and thus were linked to the first-term indexes developed fromthe EUS.

SUMMARY xiii
Projections of Aggregate Productivity
Applying the productivity indexes to the projections of experience struc-tures yields significant increases in aggregate productivity in all four ser-vices through the mid-1990s. The Summary Figure shows the percentagechanges, relative to 1987, in average productivity (total productivity dividedby total strength) under Case 1. In 1992, the gains range from 1.2 percentfor the Army to 2.9 percent for the Marine Corps. Productivity for theNavy, in particular, is projected to continue growing beyond 1992, as thedepressing effect of high numbers of new recruits diminishes with the com-pletion of the Navy's planned strength increase in 1991.
Projected productivity gains are smaller under Case 2, generally abouttwo-thirds as large as under Case 1. These gains probably represent a con-servative lower bound on the true improvement that can be expected. TheCase 3 gains average about half as large as those of Case 2, but it seemsunrealistic to assume that experience beyond the first term adds nothing toproductivity.
Summary Figure.Projected Changes in Average Productivity (Case 1)
1987 1988 1989 1990 1991Fiscal Years
1992 1993 1994
SOURCE: Congressional Budget Office.NOTE: Average productivity projections were made by multiplying projected personnel strengths in each
year of service by the corresponding value of the (Case 1) productivity index, summing the result,and dividing by total personnel strength.
imrrr

IBI
xiv SETTING PERSONNEL STRENGTH LEVELS September 1987
Based on these results, allowing the projected seniority growth to oc-cur would appear to be a less expensive means of achieving modest improve-ments in defense capability than, for example, increasing enlisted personnelstrengths. Conversely, the gains in productivity might allow strength reduc-tions relative to planned levels.
ALTERNATIVES FOR ENLISTED STRENGTH LEVELS
The Navy plans to increase enlisted strength by 5.3 percent between 1987and 1992. If experience can substitute for numbers, the seniority growthprojected here could raise Navy enlisted capabilities by 5.3 percent with amuch smaller increase in strength. The Army, in contrast, plans no changein enlisted strength. It, too, will experience seniority growth, however,suggesting that the capabilities of the Army's 1987 enlisted forces could bemaintained with smaller numbers of personnel. This study presents alterna-tive enlisted strength levels for all the services, giving each service a pro-file of future aggregate productivity matching its profile of planned futurestrengths.
This approach assumes that the services have not already factoredproductivity growth into their personnel plans. In fact, planned personnelgrowth has been reduced in recent years, perhaps in part because of growthin seniority and productivity. Despite substantial seniority growth, however,service manpower reports contain no specific examples of large numbers ofjobs being done by fewer, more senior personnel, which suggests that growthin seniority and productivity has not been fully considered.
Using the conservative productivity estimates of Case 2, this studyfinds that 35,000 fewer personnel would be required in 1992 than the De-partment of Defense plans (see Summary Table 2). Cost savings wouldamount to $760 million in 1992, and over the five years 1988 to 1992 wouldtotal $2.2 billion. In all services but the Navy, the cuts would reduce per-sonnel strengths in 1992 below 1987 levels.
Under Case 1, which assumes full productivity growth consistent withthe underlying studies, personnel reductions in 1992 relative to plannedlevels would amount to 52,000. Five-year cost savings would total $3.6billion, with a drop of $1.1 billion in 1992 alone. Even the extreme assump-tion of Case 3~no growth in productivity after the first term-would resultin a personnel reduction of 18,000 relative to levels planned for 1992.

SUMMARY xv
LIMITATIONS AND CONCLUSIONS
Several factors place important limits on the usefulness of this productivityanalysis and make it difficult to draw firm conclusions as to possiblechanges in enlisted strengths. The data underlying the indexes, the onlyinformation available, are very skimpy beyond the first term, somewhat outof date, and not entirely appropriate for application to an entire service. Inaddition, the services' manpower systems may not have the flexibility totake full and prompt advantage of the productivity improvements that comewith greater average experience. Moreover, it is possible that some of theproductivity improvements have already been taken account of in the ser-vices' plans. Clearly, more research on these issues is needed.
The reductions in personnel strength discussed in this paper should notbe taken as recommendations for specific action. Until the needed researchis completed, the alternatives above should be interpreted instead as indica-tions of the general magnitudes of reductions that might be warranted. Inthe meantime, a conservative approach to policy changes seems appropriate.
SUMMARY TABLE 2. ENLISTED STRENGTHS AND COSTS UNDERDEFENSE DEPARTMENT PLAN ANDCHANGES UNDER CBO ALTERNATIVES
Strengthin 1992
(Thousands)
Costs(In billions of 1987 dollars)
Total1992 1988-1992
Defense DepartmentPlan
Reductions under:
1,871
SOURCE: Congressional Budget Office.
52.2 252,9
CaselCase 2Case3
523518
1.10.80.4
3.62.21.0
TIBF ~ T T I T

Jinxvi SETTING PERSONNEL STRENGTH LEVELS September 1987
A conservative approach does not mean that the effects of senioritygrowth should be ignored entirely. The services have apparently decided toaccept increases in seniority that will add as much as $720 million per yearto their personnel costs by 1992, and they must have judged that the bene-fits of seniority growth are worth the cost. It seems reasonable to use theinformation contained in this analysis to review their decisions, especiallyconsidering the stringent limits that have been placed on defense spendingas part of efforts to reduce the federal budget deficit.

CHAPTER I
INTRODUCTION
More than two million men and women serve today in America's activemilitary forces. Roughly one-third of the Department of Defense budget isspent directly on these personnel: on recruiting, training, and transportingthem; on providing for their housing, food, and medical care; and on payingthem today and in their retirement. With military personnel costs absorbingso large a portion of the defense budget, and in light of continued interest inreducing the size of the federal budget deficit, considerable attention hasnaturally been focused on ways to reduce these expenditures.
Personnel costs in the 1980s and 1990s have been strongly influencedby the ending of military conscription in 1973. II The introduction of theAll-Volunteer Force (AVF) increased personnel costs in two important ways.First, the need to induce sufficient numbers of young men and women tovolunteer for military service led to a substantial increase in basic pay andrelated costs: in preparation for the draft's end, the Congress in 1971 nearlydoubled the pay of entering recruits. 21 The second effect-less obviousbecause it would not be seen immediately—was a gradual increase in variouscost elements, including pay, as first-term personnel were replaced by moresenior service members.
The shift toward more senior enlisted forces was a consequence of thereliance on volunteers to meet the military's need for new recruits. Asfirst-term personnel became more expensive, economy dictated a greaterreliance on trained, experienced personnel. The shift occurred naturallybecause the recruits who entered the AVF, without any direct or indirectpressure from a draft, were more inclined than their predecessors to reenlistafter completing their initial tours.
1. Authority for the draft ended on July 1, 1973. The last draft calls were issued inDecember 1972.
2. The raise in basic pay, over a typical recruit's first two years, amounted to 85 percent.More senior personnel received much smaller raises. Scheduled to take place in October1971, the raise was delayed until November 14 by President Nixon's wage-price freeze.An additional across-the-board increase of 7 2 percent was given on January 1,1972.
irarrr

11.
2 SETTING PERSONNEL STRENGTH LEVELS September 1987
Because military careers span 20 or more years, the transition to amature AVF is still under way. The enlisted forces of the 1990s will lookquite different from those of the 1980s, in that much higher percentages ofthem will have more than 10 years of service. Personnel costs will be higherbecause more service members will be married, because military familieswill be larger on average, and, most important, because automatic pay in-creases for longevity will ensure a rise in average pay levels, even apartfrom the cumulative effect of annual across-the-board pay raises.
The coming changes in the experience structures of the enlisted forcesraise some important questions, among them:
o What will be the extent of the changes?
o How much will they cost?
o To what extent will the coming changes increase the capabilitiesof the enlisted forces?
o How will increases in force capabilities affect the numbers ofpersonnel needed in the four active services?
This paper attempts to answer these four questions. Chapter II pre-sents projections of the experience structure of the enlisted force in each ofthe four active services and gives estimates of the cost increases that willresult from the continuing maturation of the AVF. Chapter III tackles themore difficult third question: it examines the relationship between experi-ence and productivity, using what data are available to derive indexes ofproductivity by year of service, and applies the indexes to the projections ofChapter II. The final chapter examines alternatives to the services' person-nel plans that would exploit the projected seniority growth by substitutingexperience for numbers without sacrificing planned levels of capability.
The remainder of this chapter sets the stage for what follows by show-ing the changes in enlisted experience structures that have taken place sincethe start of the AVF and giving a preliminary answer to the question: Ismore experience desirable?
BACKGROUND
The draft-era volunteers (not draftees) who completed their first terms infiscal year 1974 reenlisted at a rate of 28 percent across the four services(excluding ineligibles). Four years later, the first-term reenlistment rate

CHAPTERI INTRODUCTION 3
Figure 1.
Junior Noncommissioned Officers As Percent ofEnlisted Force, 1974-1985
30
25
= 20
15
Army
Air Force
Marine Corps
I1974 1976 1978 1980
Fiscal Years
1982 1984
SOURCE: Congressional Budget Office, based on Department of Defense manpower statistics.NOTE: Junior personnel are those in years-of-service five through ten.
was up to 36 percent. 3/ Figure 1 shows the major effect of this improvedfirst-term retention. In 1974, junior noncommissioned officers-consistingfor purposes of this study of those in years-of-service five through ten--accounted for 15.4 percent of the Army's enlisted force. By 1980, thatfigure had risen to 24.0 percent. Similar changes, though less extreme, tookplace in the other services during the 1970s. Although comparisons with1974 are colored to some extent by the effects of post-Vietnam force reduc-tions, the upward trend persisted into the late 1970s in all the services butthe Air Force.
In its 1970 report, the President's Commission on an All-VolunteerArmed Force, better known as the Gates Commission, foresaw the changetoward more senior enlisted forces: "The higher retention rate for truevolunteers inevitably produces a more experienced force. Our projections
3. Department of Defense, Washington Headquarters Services, Directorate for Information,Operation, and Reports, Selected Manpower Statistics Fiscal Year 1981.
"FT

11... 11
4 SETTING PERSONNEL STRENGTH LEVELS September 1987
indicate that, by 1980, 45 percent of Army enlisted men will have four yearsor more of service experience, as compared with 31 percent for a mixedforce [volunteers and draftees] of the same size." 47 The actual percentagewas closer to 50.
The Gates Commission could not foresee the events of the early 1980s.Two large military pay raises, high unemployment rates, and, perhaps, morefavorable attitudes toward military service boosted the first-term reenlist-ment rate to nearly 50 percent in fiscal year 1983. The effect is apparent inFigure 1: the Army's junior noncommissioned-officer force rose to almost28 percent of the total in 1983, while in the other services growth continuedthrough 1985.
Is a more experienced force desirable? The Gates Commission thoughtso, noting that: "Since experience involves on-the-job training, a more ex-perienced force is more productive than a less experienced one." 5/ Thecommission also pointed out that lower overall turnover, which is associatedwith a more senior force, reduces the number of personnel in training andother forms of "noneffective" status. Ten years later, the Defense ResourceManagement Study concluded that: "For many enlisted personnel occupa-tional groups, a force with more careerists and fewer first-termers would becost-effective based on current organizational structures." 6/
Evidence that productivity grows with experience is provided by theobvious increase in earnings with age. Economic theory indicates thatwages reflect a worker's marginal contribution to output, net of the value ofany on-the-job training the worker is receiving. One study found that highschool graduates aged 35 to 44 earned 68 percent more than those aged 22to 24. 71 A similar rise is evident in military pay tables: an enlistee withtwo years of service (in grade E-3) receives less than half as much in basicpay as one with 20 years of service (E-7). Although the connection betweenpay and marginal productivity is easier to show for the private sector thanfor the military, where occupational pay differences are small, the structureof military pay tables certainly creates a presumption that the servicesvalue experienced personnel more highly than junior personnel.
4. The Report of the President's Commission on an All-Volunteer Armed Force (New York:Collier Books/The Macmillan Company, 1970), p. 40.
5. Ibid., p. 41.
6. Donald B. Rice, Defense Resource Management Study: Final Report (Washington, B.C.:Government Printing Office, February 1979), p. 64.
7. Gary S. Becker, Human Capital (New York: Columbia University Press, 1964), p. 138.

CHAPTER II
PROJECTED EXPERIENCE STRUCTURES, AND
COSTS, FOR THE ENLISTED FORCES
The growth in the proportion of junior noncommissioned officers (NCOs) inthe active services since the start of the All-Volunteer Force has set thestage for substantial growth in the senior career forces during the late 1980sand early 1990s. This chapter begins by showing projections of the extent ofthat growth under current policies. A number of assumptions that underliethe projections are detailed in the second section. Personnel costs will risesignificantly over the period of the projections, as shown in the third sec-tion. The final section shows how much of the cost increases are attributa-ble to seniority growth. It breaks the increases down into two components,one resulting from higher average pay grades and the other from longevityincreases in basic pay.
PROJECTED EXPERIENCE STRUCTURES
CBO's projections show sharply rising percentages of senior NCOs~enlisteeswith more than 10 years of service-through the mid-1990s (see Figure2). II This group should account for 33 percent of Air Force enlisted per-sonnel in 1992, for example, compared with approximately 28 percent in1985. The Navy and Army should show similar growth-smaller in terms ofpercentage points but larger relative to their starting positions of roughly 20percent in 1985. The largest increase should occur in the Marine Corps:from 13.4 percent of the force to 19.6 percent. Given the modest growth inpersonnel strength planned for the Marine Corps, the rise implies a 50 per-cent increase in the number of senior NCOs.
For the most part, the projected growth in the senior NCO forcescomes implicitly at the expense of the group in years-of-service five
1. Figure 2 divides enlisted personnel into three groups: first-termers, approximated bythose in years-of-service 1 through 4; junior NCOs (YOS 5-10); and senior NCOs (YOS11 and above). The standard active duty service obligation for new recruits in the Navy,Air Force, and Marine Corps is four years. For consistency across the services, the figuretreats four years as the first term. The majority of Army recruits, however, choose two-or three-year obligations. Some Marine Corps recruits also are eligible for three-yearobligations, and Navy reservists going on extended active duty enter for two or threeyears.
6 SETTING PERSONNEL STRENGTH LEVELS September 1987
Figure 2.Projected Distribution of Active Enlisted Personnel,by Years of Service, 1985-1994
65
One to Four Yearsof Service 60
55
- 50
45
40
35
30
£25
20t
35
Eleven or More Yearsof Service 30
Marine Corps
Navy
Air Force ___— _«-——— —--
__j I i i
Five to Ten Yearsof Service
Air Force
Marine Corps
1 1 1 1 1
SOURCE: CongressionalBudget Office.
25
20
15
lot
Air Force
Navy
Marine Corps
1985 1988 1991Fiscal Years
1994

CHAPTER H PROJECTED EXPEIIENCE STRUCTURES AND COSTS 7
through ten. The Navy and Air Force, for example, show four percentage-point drops for this group, and less than one-half point drops for first-termers. In the Army the reduction is a little more evenly split bet\veen thetwo groups, but more than half comes from the junior NCO group. Only inthe Marine Corps, the smallest service, is the shift predominantly from thefirst-term to the senior NCO force.
PROJECTION ASSUMPTIONS
This study derived its projections from the services' 1985 year-end experi-ence profiles-the latest detailed data available. These were appropriatelyaged, and adjusted for a mixture of demand and supply effects. The keydemand-side factors are the services' reenlistment policies. Year-to-yearchanges in force sizes also play a role, although more in determining costs(below) than in affecting experience profiles. On the supply side, servicemembers' propensities to remain in the military have been shown to be influ-enced by military pay levels and the availability of private-sector jobs. Thissection discusses the demand and supply factors in turn, and then identifiesthe study's major economic assumptions.
Demand-side Factors
The projections of experience profiles shown above, as well as those dis-cussed in Chapter 4, assume that, in the absence of any change in members'propensity to remain in the military, retention rates would remain constantat their 1985 levels. This is roughly equivalent to assuming that the serviceswill not change their policies for determining who is eligible to reenlist, andthat reenlistment bonus funding will keep pace with the numbers of person-nel reaching key reenlistment points. 21
The magnitude of the changes in experience profiles projected hereraises some questions about the services' willingness to accede to them, andthus about the validity of the above assumption. 3/ Restricting reenlist-
2. The assumption also implies that new recruits will distribute themselves among initialtour lengths as they did in 1985, and that the tour lengths required of reenlistees willnot change.
3. This is most true for the Marine Corps, but because it is the smallest service this studydid not explore the sorts of policies that could be implemented to restrict seniority growth.The Army tightened reenlistment standards in 1983 and 1984, but this apparently wasdone to weed out marginal performers rather than to reduce seniority growth.
n»ir " " TI rr

8 SETTING PERSONNEL STRENGTH LEVELS September 1987
ments, however, would put greater pressure on recruiting. This would not bedesirable in the 1990s, when enlistment-age cohorts will be smaller thanthey have been in the 1980s.
Accession Levels. If reenlistment policies do not change, then accessionlevels—the numbers of new recruits brought in—will have to be adjusted toaccommodate desired strength levels. 4/ Strength increases, for example,would be achieved by increasing accessions rather than by easing reenlist-ment standards or offering additional inducements for reenlistment. Acces-sion adjustments would be feasible, as the requirements generated under allof the options considered here are modest by historical standards.
Enlisted Strength Plans. The projections shown in Figure 2 assume that theCongress will authorize the enlisted force sizes envisioned in the services'budget submissions for fiscal year 1988. These submissions call for modestgrowth in Marine Corps personnel strength, more substantial growth for theNavy, a small drop in Air Force strength in 1988, and an essentially constantsize for the Army. Figure 3 shows the plans in terms of percentage changesfrom 1987 strength levels. Small deviations from these plans~l percent or2 percent, for example-would not markedly affect the experience distribu-tions of the forces.
Supply-Side Factors
When employment conditions in the civilian economy change, military reten-tion rates are affected. Private-sector pay increases that are not matchedby raises in the military cause more service members to leave, as doesfalling civilian unemployment. The projections of the services' experiencestructures through this report reflect adjustments for the effects of pro-jected changes (described below) in these two factors. 51
4. This study assumed that neither these adjustments, nor outside factors such as thedeclining size of enlistment-age cohorts, would alter the demographic mix of enteringrecruits (including education and test scores). This implies that there will be a modestincrease in recruiting resources. Even without this increase, however, the demographicmix probably would not change enough to affect significantly the projections ofexperience structures.
5. The projections assume that the stay/leave decisions only of those members completingtheir current enlistment tours in a given year would be affected by outside factors. Mostchanges in status—extensions, reenlistments, losses—occur among this group.

CHAPTER H PROJECTED EXPERIENCE STRUCTURES AND COSTS 9
Figure 3.
Planned Changes in Enlisted Strengths from 1987 Levels
v r orce
1993 1994
il Years
SOURCE: Department of Defense (through 1992).
The effects of changes in pay and civilian unemployment were derivedfrom statistical estimates for the parameters of a model of retention deci-sions called the Annualized Cost-of-Leaving (ACOL) model. This modelassumes that the underlying preferences of individual service members formilitary as against civilian employment are constant over time. 6/ Appen-dix A gives the full set of pay and unemployment effects that were used.
Military Pay Levels. For this study, it was assumed that military pay raiseswould be given on October 1 of each year and would match private-sector
6. For a description of the model, see Department of Defense, Office of the Secretary ofDefense, Fifth Quadrennial Review of Military Compensation, Volume IB, "SupportingAppendixes to Uniformed Services Retirement System," Appendix I (January 1984).The present study used computer software and data developed for this Review. A briefdescription of the ACOL model appears in Congressional Budget Office, Eliminationof Double Tax Benefits for Military Homeowners (March 1986). For a theoreticaldevelopment and comparison of alternative models, including the ACOL, see John T.Warner, Military Compensation and Retention: An Analysis of Alternative Models anda Simulation of a New Retention Model (Arlington, Va: Center for Naval Analyses, CRC-426, August 1981).
77-384 0 - 8 7 - 2

L._LL_Li._. .. . UJBIL.
10 SETTING PERSONNEL STRENGTH LEVELS September 1987
pay increases during the preceding years. One exception to this rule is 1988;as this report was prepared, it seemed likely that the 1988 raise would be 3percent on January 1, 1988, slightly smaller than the projected private-sector increase in 1987. After 1988, the assumed matching requires realgrowth in military pay of about 1.5 percent per year. 7/
Civilian Unemployment. CBO's projections show a gradual drop in civilianunemployment to 5.8 percent in 1991.
COST PROJECTIONS
This study projects a rise of roughly 5.3 percent in real personnel costsbetween 1987 and 1992-about $2.6 billion in 1987 dollars-with continuedincreases thereafter. Table 1 shows the cost estimates for the enlistedforce projections presented in the first section of this chapter, aggregatedinto 12 broad categories. 8/ The cost totals should not be confused with themilitary personnel costs in CBO's baseline projections of the federal budget,which implicitly assume no seniority growth and no personnel strengthchanges. These factors are accounted for in the Administration's budgetrequest, but the projections here differ from the Administration's because ofdifferences in assumptions and in the treatment of inflation.
Basic pay and its associated allowances for quarters (BAQ) and subsis-tence (BAS) account for more than half of the total personnel costs identi-fied in the table. They account for an even larger share of cost growth, inpart because the economic assumptions stated above imply modest realgrowth in military pay. Virtually all of the cost growth appears in the direct
7. Congressional Budget Office, The Economic and Budget Outlook: Fiscal Years 1988-1992 (February 1987).
8. Although enlistment and reenlistment bonuses are normally included in personnelcosts, this study did not attempt to project costs for these programs. Bonuses are designedto correct shortages in specific military occupations, a level of detail that was beyondthe scope of this study. A.S noted in the previous section, an implicit assumption aboutaggregate levels of reenlistment bonuses underlies the projections of retention rates,but that assumption could not readily be translated into cost projections.

CHAPTER H PROJECTED EXPERIENCE STRUCTURES AND COSTS 11
TABLE 1. ENLISTED PERSONNEL COST PROJECTIONS BYCATEGORY, FOUR-SERVICE TOTAL, 1987-1994(In billions of 1987 dollars)
Category 1987 1988 1989 1990 1991 1992 1993 1994
BasicPay 22.0 21.9 22.3 22.7 23.2 23.7 24.1 24.6
Basic AllowanceforQuarters 2.7 2.7 2.8 2.8 2.9 3.0 3.0 3.1
Basic Allowancefor Subsistence 3.0 2.9 3.0 3.0 3.1 3.1 3.2 3.2
OtherPays 0.9 0.9 0.9 0.9 0.9 0.9 0.9 0.9
Other Allowances 1.6 1.6 1.6 1.6 1.6 1.6 1.6 1.6
Social SecurityPayroll Tax (PICA) 1.6 1.6 1.7 1.7 1.8 1.8 1.8 1.9
Permanent-Change-of-StationTravel 1.9 1.9 1.9 1.9 1.9 1.9 1.9 1.9
OtherCosts 0.1 0.1 0.1 0.1 0.1 0.2 0.2 0.2
Retired Pay Accrual 11.5 11.2 11.2 11.2 11.3 11.4 11.6 11.8
Individual Training 0.5 0.5 0.5 0.5 0.5 0.5 0.5 0.5
Recruiting andExamining 0.4 0.4 0.4 0.4 0.4 0.4 0.4 0.4
Medical Costs 3.4 3.4 3.4 3.5 3.6 _3/7 3.7 3.8
TotalCost 49.5 49.1 49.8 50.5 51.4 52.2 53.0 53.9
SOURCE: Congressional Budget Office.

112 SETTING PERSONNEL STRENGTH LEVELS September 1987
pay categories and in others that are tied, formally or informally, to basicpay. 9/ This study assumed that cost elements not tied to basic pay, suchas the cost per PCS move, would not change in real terms, although totalcosts in these categories could vary with changes in strength levels. Minorvariations would be evident in some of these nonpay categories if the figureswere not rounded to the nearest $100 million.
Sources of Cost Growth
Table 2 breaks down the cost increases over 1987 levels into componentsassociated with five factors: the richer mix of pay grades that may comewith seniority growth; higher average pay levels because of longevity in-creases in basic pay; changes in personnel strengths; changes in real paylevels; and changes in retirement accrual rates. The first two, which to-gether make up the cost of seniority growth, are discussed in detail in thenext section.
Increases in real (inflation-adjusted) pay rates are the biggest singlefactor in raising enlisted personnel costs, accounting for more than 60 per-cent of projected cost growth. In the 1990s, annual increases of roughly$700 million (1987 dollars) will be required if military pay is to keep pacewith private-sector pay. Pay raises also affect the cost growth attributableto other sources: personnel strength increases, for example, become morecostly.
Major cost savings should result from the enactment, in 1986, of a lesscostly retirement system. Although the system applies only to those whoentered after August 1, 1986, they will make up an increasing share of allpersonnel. The growing coverage of the new system contributes to a steadyreduction in the percentage of basic pay—the normal cost percentage—thatthe Defense Department projects must be set aside to fund military retire-ment.
9. Categories tied to basic pay include BAQ, BAS, Social Security tax payments (FICA),separation pay, unemployment benefits, the accrual charge for military retirement,and (under the assumptions of this study) medical costs. The accrual charge is computedas a percentage of total basic pay--the so-called "normal cost percentage"--and thuswill rise or fall in real terms with basic pay. In addition, however, the percentage figurethat DoD uses can vary from year to year as the structure and retention rates of thepersonnel force vary, and will fall as a less costly retirement system, enacted in 1986,covers a growing percentage of personnel. This study used DoD's projections of thenormal cost percentage, which show a drop from 52.2 percent in 1987 to 47.8 percentin 1992 (the latter figure was assumed to apply in 1993 and 1994 as well). The fallingpercentage explains why costs for retired pay accrual do not rise proportionately withbasic pay.

CHAPTER H PROJECTED EXPERIENCE STRUCTURES AND COSTS 13
TABLE 2. SOURCES OF GROWTH IN PERSONNEL COSTS OVER1987 LEVELS (In millions of 1987 dollars)
Source of Growth 1988 1989 1990 1991 1992 1993 1994
Richer Grade Mix 90 100 180 220 300 360 430
Longevity PayIncreases 220 220 250 300 420 520 570
Personnel StrengthChanges -70 220 390 630 660 670 680
Real PayChanges -430 210 760 1,520 2,240 2,920 3,620
Changes in Retired PayAccrual Rates sJ -220 -440 -640 -840 -970 -970 -970
Total -410 310 930 1,830 2,640 3,500 4,330
SOURCE: Congressional Budget Office.
NOTE: The figures in each line were calculated under the assumption that the sourcesof growth in the lines above had been eliminated. Altering the order ofcomputation would cause minor changes in the figures.
a. Effects of changes in the normal cost percentage used in calculating the accrual chargefor retired pay.
Personnel strength changes account for about one-quarter of the costincreases through 1991, when the Navy's planned growth will end. The smallcost reduction in 1988 reflects a planned cut in Air Force enlisted strengthin that year.
THE COSTS OF SENIORITY GROWTH
Seniority growth could add $720 million to personnel costs in 1992, and $2.3billion over the five years 1988 to 1992. 101 The two components of theseincreases-changes in the mix of pay grades and higher average pay levelswithin grades—are not equally likely, however, as the discussion belowmakes clear.
10. The CBO baseline projections of the federal budget, used by the Congress in the budgetprocess, implicitly assume that there will be no seniority growth. Thus, the cost increasesmay be interpreted as additions to the CBO baseline projections.

Jl .
14 SETTING PERSONNEL STRENGTH LEVELS September 1987
TABLE 3. PERCENT DISTRIBUTION OF ENLISTED FORCES BYPAY GRADE, 1985 ACTUAL AND 1992 PROJECTED
ArmyPayGrade
E-ltoE-3E-4
E-5E-6
E-7E-8 and E-9
1985
29.829.0
17.513.0
7.82.9
1992
29.428.5
17.112.5
9.13.5
Navy
1985
32.920.9
20.815.9
6.62.9
1992
32.220.4
19.016.9
8.23.3
Marine Corps
1985
51.218.1
13.98.7
5.22.8
1992
48.916.5
13.89.8
7.33.8
Air Force
1985
31.423.7
22.711.7
7.62.9
1992
30.921.1
22.713.7
8.53.0
SOURCE: Congressional Budget Office based on data from Defense Manpower Data Center.
Changes in the Mix of Pay Grades
A more senior force will naturally mean a larger percentage of personnel inthe senior pay grades unless either smaller percentages of personnel arepromoted to the senior grades or promotion to those grades is delayed. Inestimating costs, this study assumed that the 1987 mixes of grades withinyears of service would be maintained (although the grade mix for all person-nel would change as seniority grows). This is roughly equivalent to assumingthat promotion rates and timings remain as they were in the early 1980s.
Under the promotion assumption, this study projects substantial in-creases in the percentages of senior NCOs-those in grades E-7 and above--between 1985 and 1992 (see Table 3). Ill The Navy, for example, shows arise from 9.5 percent to 11.5 percent, and the Army from 10.7 percent to
11. This study did not formally model the enlisted promotion process. It derived thepercentages for 1992 by applying estimated 1987 distributions of grades within eachyear of service to the projections of 1992 year-of-service distributions. This procedureshould approximate the effects of maintaining the promotion practices that led to the1987 grade distributions. The 1987 estimates were formed by combining detailedinformation on 1985 distributions with less detailed information for 1987 publishedby the services.

CHAPTER!! PROJECTED EXPERIENCE STRUCTURES AND COSTS 15
12.6 percent. 127 The percentage of mid-level NCOs-those in grade E-6--is also projected to rise in every service but the Army.
Personnel Costs. The projected shift in the grade distributions adds $300million to personnel costs in 1992 (see Table 4), relative to what costs wouldbe if the aggregate mix of pay grades in each service stayed as it was in1987. 13/ This amounts to roughly 0.6 percent of total personnel costs.Over the five-year period 1988 to 1992, the grade shift adds a total ofnearly $900 million to costs. It continues to raise costs well beyond theperiod of the projections, driven primarily by continued seniority growth inthe Navy and Marine Corps.
Promotion Cuts. Experience suggests that some growth in the numbers ofsenior NCOs will take place, but it may not be as great as the projectionsindicate. The number of enlisted members in the two highest grades cannotlegally exceed 3 percent in any of the services, a constraint that is violatedby three of the services in the projections. Limits on the percentages in thetop six grades (E-4 and above), which are not legally binding, might also beviolated, although for the most part the shifts occur within the top sixgrades. The Marine Corps is the obvious exception to this generalization, asshown by the substantial drop for its lowest three grades.
Slowing promotions to maintain the 1987 grade distributions, and thuseliminate the costs projected in Table 4, would require delays for severalgrades. In the Marine Corps, for example, personnel in grade E-5 wouldhave to serve about 21 months longer in the 1990s than in the past beforebeing promoted to E-6. They would then spend a few months less in thatgrade than in the past, but their total time in service before promotion to E-7 would still be well over one year greater. 14/ Delays would be shorter inthe Army and Navy (roughly six months to one year more time in service
12. If legal limits on the percentage of enlisted personnel in grades E-8 and E-9 were notrelaxed, all of the projected growth would have to appear in grade E-7. Adjusting forthis would not have a major effect on the cost projections (below) because of the smallnumbers of personnel involved.
13. This assumes no change in retention rates in response to promotion delays or reducedpromotion rates. Reduced retention would tend to cut costs further, for given enlistedstrength levels.
14. The delays given are the differences, between 1987 and 1992, in the year and monthof service at which half of the personnel remaining have been advanced to the next highergrade. Because they were not derived from a formal model of promotion, the numbersare approximate and would not correspond exactly to changes in promotion timing ascalculated by the services.

16 SETTING PERSONNEL STRENGTH LEVELS September 1987
before promotion to E-6 and E-7) and shortest in the Air Force. Alterna-tively, reduced promotion rates could achieve similar savings.
The cost figures in Table 4 can be viewed as potential savings, savingsthat could be realized without forcing mid-level NCOs to leave and thuslosing the advantages of their experience. 15/ The second component ofseniority-growth cost is more inevitable, arising primarily from the struc-ture of the military basic pay table.
Longevity Increases in Basic Pay
The military basic pay table incorporates longevity increases-that is, payraises that automatically occur as a member's years of service rise, even ifthe member is not promoted to a higher grade. As a result, increasedseniority means increased basic pay costs even when the aggregate distribu-tion of grades within each service is held constant. Other cost elementsalso grow-medical care costs, for example (in part because older personneltend to have more dependents). 16/
Longevity increases in pay, and increases in other cost categories af-fected by the year-to-service distributions of enlisted personnel, will contri-bute $420 million to personnel costs in 1992, and more than $1.4 billion overthe five years 1988 through 1992 (see Table 5). 177 In 1992, the last year ofthe Five Year Defense Plan, personnel costs will be almost 1 percent higherthan they would be if the 1987 experience structures were maintained. Costgrowth would continue in 1993 and 1994, and probably well beyond the endof the projection period.
15. Some would choose to leave, of course, because slowed promotion would reduce theirfuture military pay. Reduced retention would tend to increase the savings, at the costof lost experience. As noted above, this study ignored the retention effect in projectingthe cost savings under slowed promotion. Available studies of retention tend to derivetheir predictions of the effects of changing promotion policies—if they do so at all—fromassumptions about members' rates of time preference.
16. Some costs fall—training costs, for example-because more senior personnel have lowerloss rates, but these reductions are small compared with the increases in pay costs.
17. These estimates result from projecting the costs of the 1987 forces in each future year,adjusting the factors determining costs-accessions, losses, personnel by year of service-in proportion with planned strength changes. These costs were compared with thecosts of the projected forces (Figure 2), under the assumption that the aggregate mixof grades within each service would be the same as in 1987 (that is, the service-specificcosts underlying Table 1 less the grade-mix costs in Table 4).

CHAPTERn PROJECTED EXPERIENCE STRUCTURES AND COSTS 17
TABLE 4. PROJECTED COSTS OF SENIORITYGROWTH ARISING FROM MAINTAININGPROMOTION RATES AND TIMINGS
Service 1988 1989 1990 1991 1992 1993
TABLE 5. PROJECTED COSTS OF SENIORITY GROWTH ARISINGFROM LONGEVITY INCREASES IN PAY
1988 1989 1990 1991 1992 1993
1994
In Millions of 1987 Dollars
ArmyNavyMarine CorpsAir Force
Total
2020104090
40103020
100
60305040
180
80406040
220
90807060
300
1001109070
360
10014011080
430
As a Percent of Personnel Costs
ArmyNavyMarine CorpsAir Force
Total
SOURCE:NOTE:
0.10.10.30.30.2
0.20.10.60.20.2
0.40.21.00.30.3
0.40.31.30.30.4
0.50.51.50.50.6
0.50.71.90.50.7
0.50.92.20.60.8
Congressional Budget Office.Numbers may not add to totals because of rounding.
1994
In Millions of 1987 Dollars
Army 20 50 70 100Navy 50 ' 40 50 70Marine Corps 50 40 50 60Air Force 110 90 80 70
Total 220 220 250 300
As a Percent of Personnel Costs
Army 0.1 0.3 0.4 0.5Navy 0.4 0.3 0.3 0.4MarineCorps 1.1 1.0 1.2 1.4AirForce 0.8 0.7 0.6 0.5
Total 0.4 0.5 0.5 0.6
SOURCE: Congressional Budget Office.NOTE: Numbers may not add to totals because of rounding.
1201508080
420
0.61.01.70.50.8
Figures include
130200
90110520
0.71.31.90.71.0
changes
140230110100570
0.71.52.20.71.1
in all costcategories that are affected by the year-of-service mixes of the enlisted forces.

.11 -11 _
18 SETTING PERSONNEL STRENGTH LEVELS September 1987
The service breakdowns show patterns consistent with the year-of-service projections displayed in Figure 2. The Air Force dominates the totalcost growth in the early years because its planned strength cut in 1988 willimmediately reduce the percentage of lower-paid junior personnel in its en-listed force. The Navy accounts for the largest share beginning in 1992 as itcompletes its enlisted strength buildup and reduces its annual accession re-quirements. Throughout the projection period, Marine Corps costs for sen-iority growth are largest as a percent of the service's total personnel costs.As Figure 2 showed, the Marine Corps is projected to have the greatestgrowth in senior NCO strength. Moreover, most of that growth comes im-plicitly at the expense of the lowest-paid group, those in their first enlist-ment terms.
Unlike the costs in Table 4, the estimates in Table 5 do not indicatethe savings that would result from any specific set of policies. Growth inexperience could be slowed, of course, but maintaining 1987's year-of-ser-vice structures even roughly would prove very difficult. Nonetheless, thecosts in Table 5 provide a useful benchmark against which to assess theproductivity gains that are the subject of Chapter III.

CHAPTER III
EXPERIENCE AND PRODUCTIVITY
Chapter II showed that growing seniority will be an important trend in theenlisted forces in the late 1980s and early 1990s. It also showed that thisgrowth will add an average of between $450 million and $800 million dollarsper year to personnel costs in 1991 through 1994, depending on promotionand other policies. This chapter raises the question: Are the returns togreater seniority sufficient to justify the added costs?
The data available to address the question are very limited. This mayseem surprising, given that the shift toward a more senior force has beenunder way since the start of the All-Volunteer Force. The lack of datareflects the ways in which the services determine how many personnel theyrequire and at what experience levels. The key term is "require": thenotion of requirements assumes that there is one best way to staff anyfunction. Any shortfalls, such as giving a unit fewer personnel even thoiighthey have a richer experience mix than the stated requirement, are assumedto degrade performance. Although in a steady state this approach is proba-bly appropriate for the services' personnel programming functions, it doesnot lend itself to deriving trade-offs among personnel of different experi-ence levels. I/
Fortunately for the purposes of this study, two attempts to measureproductivity at various levels of experience have yielded useful information.The Enlisted Utilization Survey (EUS), conducted by the RAND Corporationfor the Defense Advanced Research Projects Agency in the mid-1970s, ex-amined productivity growth during the first enlistment term for a variety ofenlisted specialties in the Army, Navy, and Air Force. Subsequent analysesof the data at RAND and at the Center for Naval Analyses (CNA) revealedstrong relationships between experience and productivity. 21 The second
1. It also limits the manpower system's flexibility, a point that is raised in the final sectionof this chapter.
2. Gus W. Haggstroin, Winston K. Chow, and Robert M. Gay, Productivity Profiles of First-Term Enlisted Personnel (Santa Monica, Calif.- The RAND Corporation, N-2059-RC,February 1984). Alan J. Marcus and Aline 0. Quester, "Determinants of LaborProductivity in the Military" (Alexandria, Va.: Center for Naval Analyses, November1984).
rr

20 SETTING PERSONNEL STRENGTH LEVELS September 1987
attempt, also a RAND study but in this case performed for the U.S. AirForce, found substantial productivity growth over a full range of experiencelevels. 3/ These two studies are described in greater detail below.
A third study, which followed a very different approach from the firsttwo, confirms that the experience/productivity relationships found in theabove studies are not simply a result of their survey-based approaches. Inthose two studies, supervisors were asked to rate the performances of thepersonnel working under them. The third study, an examination of variousoccupational specialties aboard Navy ships, relied on a more objective out-put measure: the amount of time that major systems served by personnel inthe selected specialties were not fully operational. 4/ These downtimeswere related to the characteristics of the personnel servicing the systems,including in each case some measure of average experience. The results arenot directly usable in the present analysis because of the forms of the ex-perience measures, but some statistically significant relationship betweenexperience and output was found for all but one of the enlisted specialtiesexamined. 5/
The next two sections describe the two studies that provide the pro-ductivity data for this examination, showing how they were used to deriveservice-specific indexes of productivity by year of service. Most of thedetails are relegated to Appendix B; what appears below is required for anunderstanding of the limitations that the available data impose on the con-clusions drawn in the next chapter. The third section presents the majorresults of this chapter: projections of aggregate productivity levels for eachof the services. The final section discusses the major limitations of the dataand, by extension, of the productivity projections.
THE ENLISTED UTILIZATION SURVEY
In the EUS, 27,000 first-term enlisted personnel were first asked to identifytheir immediate supervisors. In a written survey, those supervisors were
3. S. Craig Moore, Demand and Supply Integration for Air Force Enlisted Work ForcePlanning: A Briefing (Santa Monica, Calif.: The RAND Corporation, N-1724-AF, August1981).
4. Stanley A. Horowitz and Allan Sherman, Crew Characteristics and Ship Condition(Alexandria, Va.: Center for Naval Analyses, CNS1090, March 1977).
5. Another study employing an objective performance measure is: A. J. Marcus, PersonnelSubstitution and Navy Aviation Readiness (Alexandria, Va.: Center for Naval Analyses,Professional Paper 363, October 1982). The results indicated that, at the margin,personnel in grade E-7 and above are several times more productive than personnelin the junior NCO grades. This is too large a difference to be accepted without confirmingstudies.

CHAPTER HI EXPERIENCE AND PRODUCTIVITY 21
then asked to estimate the net productivity of the first-termers identified inthe first round at four points during their initial tours. 6/ The survey ex-plained that net productivity means the contribution of the individual to theunit's output after accounting for the supervision time that the individualrequires. Productivity was measured relative to that of a fully trained"journeyman," someone with exactly four years of service completed.
The RAND analysis of the EUS data derived usable results for occupa-tional specialties in all three of the services surveyed, including 16 in theArmy, 10 in the Navy, and 22 in the Air Force. Each specialty had beendesignated in the original survey effort as either high-, medium-, or low-skill, to assure a broad sample of skills in each service. For various reasons,the responses of many supervisors were excluded, leaving usable data for9,272 individuals. 7/ For each specialty, RAND averaged the productivityestimates among respondents at each of the four time-in-service points, andthen fitted standard learning curves to the four values.
The CNA analysis of the same EUS data used different methods butyielded results on the relationship between experience and productivity thatwere remarkably similar to those of the RAND study. Averaging amongNavy specialties yields a total productivity over the four years of a firstterm, expressed in journeyman-equivalent man-years, of 2.28 years for theRAND analysis and 2.34 years for the CNA analysis. 8/ Given the rangeamong specialties-from roughly 1.8 to 2.8-this difference in the averagesis very small. Because of the small differences, and for consistency amongthe services, this study relied exclusively on the RAND results.
The aggregate learning curves derived from the RAND analysis, shownin Figure 4, appear plausible. The curves indicate the average productivityduring each year of service, expressed~as it was by the rating supervisors-
8. The four points were: during the individual's first month at his initial duty station;at the time of the rating; one year after the rating; and after four years of service. Ratingsof "typical" first-termers were also solicited, although these were not used in the currentstudy. The typical enlistees were generally rated as less productive, on average, thanthe specific individuals.
7. The exclusions were made to ensure that: the supervisor had a reasonable basis forproviding estimates for the individual's entire first term; technical school graduateswere being evaluated in the specialty for which they were trained; necessary data forthe analysis were available; and the supervisors correctly understood the concept ofrelative net productivity.
8. The largest difference for any individual specialty was 0.23 man-years; in most casesthe differences were much smaller.
TIBIF " " O FT"

11L
22 SETTING PERSONNEL STRENGTH LEVELS September 1987
Figure 4.Productivity Indexes by Service and Year of Service
1.0
0.8
0.6
0.4
0.2
Army
Year of Service
SOURCE: Congressional Budget Office, from the RAND Corporation.NOTE: Productivity is measured relative to that of a typical enlistee who has completed four years of
service.
as a fraction of the productivity of a fully trained journeyman (that is, atypical individual who has just completed four years of service). 9/as
As should be expected, average productivity is very low during thefirst year of service. This results from the combination of low productivityonce the recruit reaches his first duty station, and the several months oftraining time that precede the first assignment. Productivity during train-ing is assumed to be zero. 107 The higher values for the Army than for the
9. Because the indexes measure average productivity over the course of the given yearsof service, the values in the fourth year are less than one. In addition, estimatedproductivity at the end of four years could differ from one because this study used theresults for actual recruits, rather than for "typical" recruits. The reference person inboth cases (the fully trained journeyman) was a typical enlistee with four years of servicecompleted.
10. Net productivity during formal training, basic and advanced, would actually be negativebecause of instructors' time inputs. This study did not attempt to take account of changesin aggregate productivity arising from changes in the total number of instructorsrequired as accession levels vary.

CHAPTER HI EXPERIENCE AND PRODUCTIVITY 23
other two services are consistent with the view that Army jobs are moreeasily learned. It should be noted, however, that the EUS data do not pro-vide a clear indication that the skill level of a specialty (as determined inthe original survey project) affects productivity.
Lacking any direct information on productivity in the Marine Corps,this study used the Army index for that service.
The age of the EUS data (the survey was conducted in 1975) is a causefor concern about their applicability to today's forces. Inevitably, it limitsthe conclusions that can be drawn about the future productivities of theenlisted forces. The final section of this chapter discusses these limitations.
THE RAND AIR FORCE STUDY
Like the EUS, the study performed for the Air Force was survey-based, butthere the similarity ends. A demonstration effort, it examined only onespecialty. It collected data on completion times for 26 separate groups oftasks typically performed by personnel in that specialty. Most important,the data covered personnel classified into six "labor types," covering a fullrange of experience, rather than just personnel in their first terms. Ill
The study was intended to demonstrate how requirements for person-nel of different skill levels and grades could be changed to improve thematch between requirements and available supplies. The data collectedwere similar, but not identical, to data routinely collected within the AirForce's Management Engineering Program. The single specialty, AerospaceGround Equipment (AGE) Maintenance, was one of two areas selected asbroadly representative prototypes. 12/ In the EUS, this specialty was iden-tified as "medium-skill."
The nature of the data collected is illustrated in Figure 5, which givesrelative completion times by year of service for three representative taskgroups: periodic inspection, unscheduled maintenance (simple equip-ment/subsystems), and corrosion control. All times are measured relative tothe time required by a person in the highest labor type (the plotted points
11. Labor types were defined by a combination of pay grade and skill level, an Air Forcemeasure of proficiency.
12. The project was halted before data were collected for the second area, GeneralAccounting.

.11 ...JJi_.
24 SETTING PERSONNEL STRENGTH LEVELS September 1987
Figure 5.Relative Task Completion Times
3.0\ Supervision Time
YA Periodic InspectionA /
2.0
1.0
Unscheduled Maintenance,\ Simple Equipment/Subsystems
1 3 5 7 9 11 13 15 17Year of Service
SOURCE: Congressional Budget Office, from RAND Corporation data.NOTE: Thin lines include supervision time.
are at the average year of service for each labor type). Two lines appearfor each task group; the upper line includes the supervision time required.For example, the top pair of lines shows that a person in the lowest labortype, who on average would have completed one year of service, requires 2.5hours to perform a periodic inspection job that the most experienced personcould complete in one hour. In addition, the equivalent of 0.5 hours of thejunior person's time would be required for supervision of the work. 13/ Forcorrosion control, the advantage of experience is much less, particularlybeyond the fourth year of service,
The detail of the data presents problems for the derivation of a singleaggregate index of productivity by year of service. It is not sufficientsimply to calculate such an index separately for each group of tasks andthen to average the indexes at each year of service; to do so would be toassume, implicitly, that the time of every member is spread across tasks inthe same proportions. In an actual work center, task assignments would bemade more rationally, with experienced personnel assigned primarily totasks in which their performance advantages over junior personnel are
13. The supervision would be performed, of course, by a more senior person.

CHAPTER m EXPERIENCE AND PRODUCTIVITY 25
greatest, and junior personnel to tasks in which their disadvantages areleast. Most corrosion control work, for example, would be performed bythose who have just completed their school training, and most periodic in-spection by seasoned career personnel.
This study mirrored the task assignment process that would take placein a work center through the techniques of linear programming. The goalwas to accomplish the required amount of work on each task while mini-mizing the total number of personnel required, subject to a number of con-straints. The constraints reflected practical considerations that would pre-vent the achievement of the most efficient short-run solution, such as theneed to provide junior people with the opportunity to gain experience in themore complex tasks. An additional constraint ensured that the mix of per-sonnel by labor type would be the same as that found in the work centerswhen the data were collected.
The linear programming procedure provided measures of the relativemarginal productivities of personnel in the various labor types; With thesevalues assigned to the average time in service for the labor types, linearinterpolation yielded the required index of productivity at each year of ser-vice.
Because the constraints imposed in the linear program affected theresults, and because choosing an appropriate set of constraints involvedsome judgment, two alternative indexes were developed. One of these, de-noted "Case 1," reflected an attempt to match the set of constraints identi-fied in the original study. The second, "Case 2," simply halved the improve-ment at each year of service over the reference point, the end of the fourthyear, to illustrate the effects of assuming lesser effects of experience onproductivity. Case 2 also approximated the results under an alternative setof constraints that also appeared to be plausible. A final index, "Case 3,"arbitrarily held productivity constant at its value for the end of the fourthyear of service, thus assuming no relationship between experience and pro-ductivity beyond the first term.
Figure 6 displays the three productivity indexes. The line for Case 1shows the most senior personnel as being roughly 52 percent more produc-tive than the reference person, the same journeyman as used in the EUS.This is a smaller return to experience than was estimated in a previous CBOstudy, based on earnings growth in the private sector (see the discussion inChapter I). 14/ Also, the data can support even higher estimates of the
14. Congressional Budget Office, Quality Soldiers: Costs of Manning the Active Army (June1986).

26 SETTING PERSONNEL STRENGTH LEVELS September 1987
Figure 6.Productivity Indexes by Year of Service
1.6
Casel
1.4
S1 1.2
XCase 2
i.or Case3
5 10 15 20Year of Service
SOURCE: Congressional Budget Office.NOTE: Productivity is measured relative to that of a typical enlistee who has completed four years of
service.
return to experience. 15/ Thus, Case 1 represents not an upper bound, butrather a judgment as to the most likely relationship between productivityand experience in military jobs.
Case 2 represents a very conservative interpretation of the same re-sults, conservative in the sense that it tends to minimize the estimatedproductivity gains that more senior forces will generate. Conservatism maybe appropriate when these results, derived from data on a single Air Forcespecialty, are to be applied to all four services. Case 3 was added as anadditional test of sensitivity. It might be taken as reflecting the agnosticposition that the data are too limited to permit any conclusions to be drawn.
The three alternative indexes for years-of-service five and beyondwere linked to the four service-specific indexes for years one through four
15. If no constraints are imposed on the task assignments of personnel at different skilllevels, the trade-off between senior and junior personnel-roughly an 82 percentadvantage of the most senior over someone with four years of service—approaches thaton the task with the greatest difference in performance times.

CHAPTER m EXPERIENCE AND PRODUCTIVITY 27
described in the previous section. This resulted in three indexes for eachservice, reflecting the three alternative cases for the period after the firstterm.
PROJECTIONS OF AGGREGATE PRODUCTIVITY
All four services should show increased aggregate productivity in their en-listed forces by the early 1990s, even if productivity growth beyond the firstterm is small (Case 2) or nonexistent (Case 3). Figure 7 shows projections ofproductivity per person in the enlisted forces of each of the services, meas-ured as percentage changes relative to 1985. The projections result fromthe mechanical application of the indexes described above to the year-of-service projections summarized in Figure 2 (Chapter II); the final section ofthis chapter discusses the limitations of this approach.
The largest productivity gains should be experienced by the MarineCorps. In 1992, the greater experience of the average Marine will makethat person 7.4 percent more productive than his counterpart in 1985 and 2.9percent more productive than in 1987 (Case 1). Under the more severeassumption of Case 3-no productivity growth beyond the first term~thegains will be more modest: 4.1 percent relative to 1985 and 0.7 percentrelative to 1987. The Marine Corps gains are largest primarily because thisstudy projects that it will undergo the most severe shift in its experiencestructure, with senior personnel in effect replacing first-termers.
Navy productivity gains probably would equal those of the MarineCorps were it not for the Navy's recent strength increases and its plans foradditional increases in the future. The high accession levels needed (underthe assumptions of this study) 'to support these strength increases tend todepress average productivity. After the planned growth is completed in1991, Navy productivity should rise rapidly.
The Air Force projections for 1988 show an effect opposite to thatobserved for the Navy. The Air Force plans to cut strength by 8,000 in1988. This should reduce its requirement for new recruits by about 10 per-cent relative to 1987, and so result in a temporary jump in average pro-ductivity.
Table 6 may help put the productivity gains in perspective, comparingthe 1992 gains, relative to 1987, with the costs of the increased senioritythat provides the gains. In 1992, personnel costs would be at least $420million higher for the services combined~up to $720 million if promotion
irarrr

11. - ill
28 SETTING PERSONNEL STRENGTH LEVELS September 1987
Figure 7.
Projections of Average Productivity in the Enlisted Force of Each ServiceArmy Navy
4 -
I 2s
s i0.
Case 1
-11985
i i I i i
1988 1991Fiscal Years
Air Force
1994 1985
10
1988 1991Fiscal Years
Marine Corps
1994
i 6
~ 4
Case 1.
i i i1985 1988 1991
Fiscal Years
1994 1985 1988 1991Fiscal Years
1994
SOURCE: Congressional Budget Office.

CHAPTER HI EXPERIENCE AND PRODUCTIVITY 29
rates and timings did not change-than they would be if the year-of-servicestructures were the same then as in 1987. Excluding any effects of richergrade mixes, the cost increases should range from 0.5 percent for the AirForce to 1.7 percent for the Marine Corps. Productivity would grow twiceas fast as costs under Case 1, and slightly faster than costs under Case 2.Only under the extreme assumption that senior career personnel are no moreproductive than someone just finishing the fourth year of service (Case 3)would the percentage cost increases exceed the percentage productivitygains. If projected changes in the grade mix are allowed to take place,however, costs could rise faster than productivity even under Case 1.
The returns to seniority growth can also be compared with total de-fense costs, of which the enlisted personnel costs examined in this studymake up only about one-sixth. The added costs in 1992-$420 million to$720 million-represent only 0.14 percent to 0.24 percent of the 1987 de-fense budget. Even under the least favorable case, percentage productivityimprovements would be several times larger.
That the returns to greater seniority may exceed the costs, in percent-age terms, has no particular significance in this military context; notions ofcost-effectiveness are not applicable to situations in which the returns (inthis case, productivity) cannot be measured in the same units as the costs.
TABLE 6. SENIORITY GROWTH COSTS AND PRODUCTIVITYIMPROVEMENTS: 1992 VERSUS 1987
Productivity ImprovementsCost Increases a/
In MillionsService of 1987 Dollars
Army 120-210Navy 150 - 220Marine Corps 80-150Air Force 80-140
(In percent)
In percent Case 1
0.6-1.11.0-1.51.7-3.20.5-1.0
1.21.82.91.6
Case 2
0.81.31.91.1
Case3
0.40.80.70.4
SOURCE: Congressional Budget Office.
a. Lower figures reflect seniority growth only, holding constant aggregate grade mixes;higher figures include projected increases in percentages of personnel in the seniorpay grades.
H»FT O IT

30 SETTING PERSONNEL STRENGTH LEVELS September 1987
What the results do indicate is that allowing the seniority growth probablywould be a cheaper way of achieving small improvements in capabilitiesthan, for example, adding 20,000 or 30,000 personnel to the enlisted forceswhile holding the year-of-service structures constant (assuming that werepossible). Conversely, the results may be interpreted as suggesting thatmodest reductions in strength, relative to planned levels, would not reduceenlisted-force capabilities. This is the main subject of the final chapter ofthis paper. Before drawing firm conclusions, however, it is important torecognize the limitations of the underlying productivity data and their appli-cation.
LIMITATIONS AND QUALIFICATIONS
Five main factors limit the usefulness of the productivity indexes and theconclusions that may be drawn when they are applied to the enlisted forceprojections:
o The data are very skimpy, especially beyond the first term.
o The data, particularly those from the EUS, are now rather old;relationships that held in 1975 may no longer apply because ofchanges since then both in the quality of recruits and in the
. nature of the work they are asked to do.
o The indexes were derived from specialty-specific data, and somay not be entirely appropriate for application to an entire ser-vice.
o Relative productivity estimates are technically applicable onlyto experience mixes that are close to those from which theywere estimated.
o Feasible productivity trade-offs may be limited by factors notconsidered here, such as manning requirements that are fixedbecause of past decisions on hardware designs, the small numbersof personnel in some work centers, and the inability of currentmilitary manpower systems to respond promptly and efficientlyto changes in experience levels.
These factors are discussed in turn below. A concluding paragraph summa-rizes the discussion.

CHAPTERm EXPERIENCE AND PRODUCTIVITY 31
Skimpy Data
Results for one Air Force specialty hardly provide a sound basis for general-izations about aggregate productivity in each of the services. Clearly, moredata on productivity growth beyond the first term are required. Nonethe-less, the Air Force data are at least drawn from a military source ratherthan from the private sector, and the specialty examined is probably nearthe middle of the complexity spectrum among military jobs, not at one ofthe extremes. The clear indication in the data that productivity improveswith experience suggests that the Case 3 indexes, although useful in meas-uring the sensitivity of results, do not represent the general situation in themilitary.
The more comprehensive EUS data would seem to be an adequatesource of information on productivity growth during the first term. Addi-tional data would be desirable, of course, especially if they were based onsome objective output measure such as was available in the study of systemdowntimes on Navy ships. Further analysis of the EUS data would also beuseful to answer more detailed questions, such as whether productivity onthe job improves at different rates for recruits with different aptitudes andeducation.
Old Data
The time that has passed since the EUS data were collected in 1975 raisesquestions about their applicability to the forces of the 1980s and the 1990s.This is especially true for the Army, in which two conflicting effects havebeen felt. On the one hand, Army recruits in the mid-1980s have been, byany measure, better than their counterparts of a decade earlier; a muchhigher percentage now enter with high school diplomas, for example, andaverage scores on the aptitude tests administered to recruits have beenhigher. Evidence on the relationship between aptitude and first-term per-formance is not conclusive, but it seems likely that the average recruit ofthe 1980s can perform a given job better than his or her counterpart in the1970s. 16/ On the other hand, Army jobs apparently have become more
16. Two studies indicating that higher-scoring recruits perform better are: Richard L.Fernandez and Jeffery B. Garfinkle, Setting Enlistment Standards and Matching Recruitsto Jobs Using Job Performance Criteria (Santa Monica, Calif.: The RAND Corporation,R-3067-MIL, January 1985); and Barry L. Scribner and others, "Are Smart TankersBetter? AFQT and Military Productivity," Armed Forces and Society, vol. 12 (Winter1986), pp. 193-206. Neither study found a strong time-in-service effect, but for the formerthis may have been due to problems in the performance measure. The "Tankers" studyexamined only a single occupational specialty. In Michael P. Ward and Hong W. Tan,The Retention of High Quality Personnel in the U.S. Armed Forces (Santa Monica, Calif.:The RAND Corporation, R-3117-MIL, February 1985), the effect of aptitude test scores
(Footnote Continued)

32 SETTING PERSONNEL STRENGTH LEVELS September 1987
complex, which presumably would slow recruits' attainment of full profi-ciency. 17Y It is impossible to know which of these effects has beenstronger.
Applying Specialty-Specific Results to an Entire Service
Two main problems arise when results for one or more specialties are ap-plied to an entire service (aside from the obvious possibility that the spe-cialties may not be sufficiently representative). The first-that experiencein the current job is not the same thing as years of service-should notaffect the results of this study. The second is more important: the perfor-mance of a unit~a battalion, a ship, or even a personnel records office—maynot be determined solely by the productivities of the individuals in the unit.
Specialty changes are a common feature of military service becausejobs differ in their retention patterns and in their needs for senior personnel.Naturally, members who change jobs will tend to be less productive initiallyin their new skill than they were in their old one, other things being equal.As a result, any index of productivity by experience level for a particularspecialty that was based on years in that specialty would tend to overstatethe returns to total service experience.
Fortunately, the data underlying the productivity indexes beyond thefirst term measured total service experience. 18/ Although the focus ofthe analysis was a job-specific experience measure, the study made for theAir Force reported average years of service for the individuals in each labortype. The years of service of members who had retrained-perhaps at theirfirst or second reenlistments-were averaged together with the years forthose who had never changed specialty. Thus, the productivity indexes re-flect the pattern of specialty .changes that led to the specific work forcethat was analyzed. To the extent that retraining into the specialty exam-ined is not typical, of course, the indexes will be flawed, but that is just partof the general issue of how representative the specific skills are of theentire force, which is discussed above.
16. on performance was negligible when speed of promotion was used as the performancemeasure and as a control for unobservable "quality." A summary of service efforts tomeasure on- the-job performance is available in: Office of the Assistant Secretary ofDefense (Manpower, Installations, and Logistics), Joint-Service Efforts to LinkEnlistment Standards to Job Performance, Third Annual Report to the House Committeeon Appropriations (December 1984).
17. Martin Binkin, Military Technology and Defense Manpower (Washington, D.C.:Brookings Institution, 1986).
18. Although the experience measure in the EUS data was job-specific, specialty changesare not important enough during the first enlistment term for this to create a problem.

CHAPTER in EXPERIENCE AND PRODUCTIVITY 33
The second problem arises because few if any military units consist ofindividuals working independently on their separate tasks. Most work iscooperative, with the skills of one person complementing those of coworkers(or fellow crew members, squad mates, and so forth). In this context, aver-aging the productivity improvements arising from individual experiencegains may not yield an accurate measure of capability improvement for theunit. Unit performance may be determined more by the weakest link—theinexperienced tank driver, for example, whose erratic movements offset anyadvantage of experience in the gunner's position. At a larger level, theweak link could be a specialty in which experience yields few rewards, andwhose members play a key role in the operation of a unit comprising person-nel in many specialties. The converse is also possible, however: greaterexperience in a few key positions may dramatically improve a unit's perfor-mance. 19/
Considerations of unit versus individual performance suggest thatanalyses of unit performance would be more appropriate sources of data forthis study than the individual-performance analyses actually used. Unfor-tunately, usable examinations of unit performance are not available. 20/Lacking them, this study implicitly assumed that the two tendencies de-scribed in the previous paragraph, to the extent they operate, exactly offsetone another in determining the aggregate capabilities of the services' en-listed forces. 217
19. One study described the phenomenon thus: "For some interactive tasks, there is a'bottleneck' effect, where performance is more determined by the least-able member,while for other tasks, there is an opposite effect, where the most-able memberpredominates and determines performance." See James P. Kahan and others, IndividualCharacteristics and Unit Performance: A Review of Research and Methods (Santa Monica,Calif.: The RAND Corporation, R-3194-MIL, February 1985), p. vi. The studydistinguished "coactive" tasks, "in which group productivity is a function of separate,albeit coordinated, individual efforts" (p. v); and "interactive" environments requiringcollaborative efforts. It concluded that individual abilities more strongly determineunit performance in coactive tasks than in interactive, and noted that interactive taskspredominate in the Army.
20. The CNA analysis of ship condition, described above, did examine unit performance,but although it provides qualitative support for the main conclusions of this chapterthe report on this work does not give useful quantitative results. The study also didnot examine the contribution of the various systems aboard a ship to the ship's abilityto fight.
21. Interactions between officer and enlisted personnel undoubtedly are also importantin determining a service's capabilities. This study ignores these interactions.
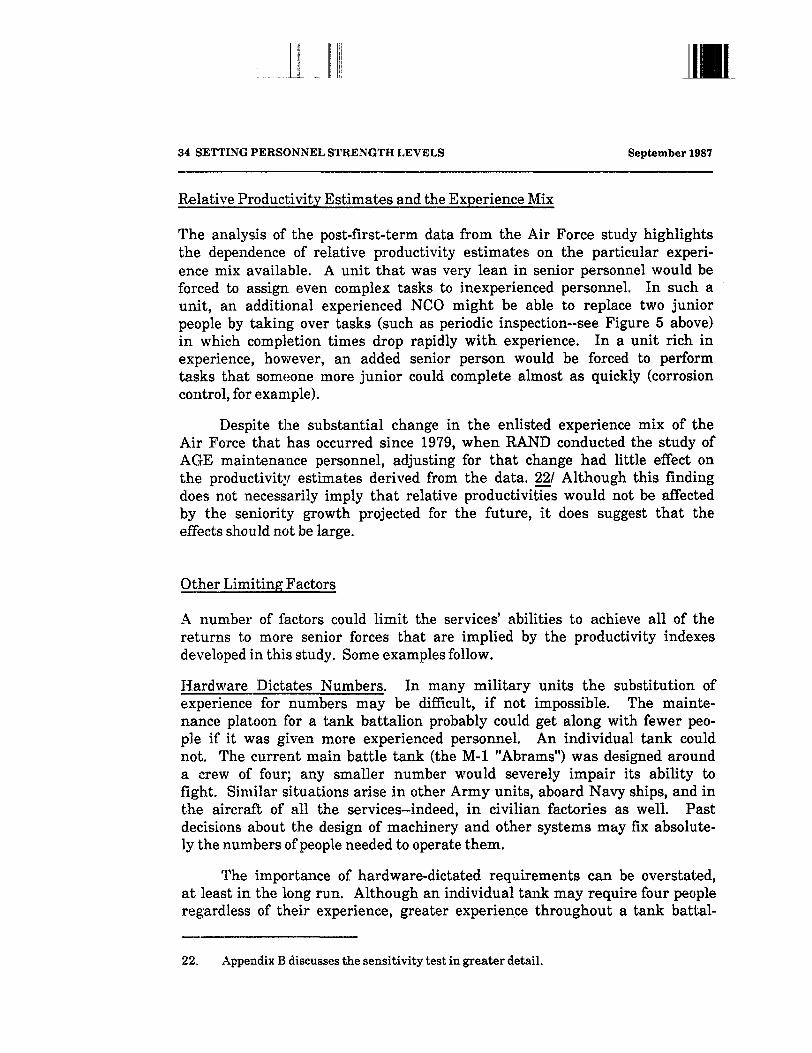
Ill34 SETTING PERSONNEL STRENGTH LEVELS September 1987
Relative Productivity Estimates and the Experience Mix
The analysis of the post-first-term data from the Air Force study highlightsthe dependence of relative productivity estimates on the particular experi-ence mix available. A unit that was very lean in senior personnel would beforced to assign even complex tasks to inexperienced personnel. In such aunit, an additional experienced NCO might be able to replace two juniorpeople by taking over tasks (such as periodic inspection-see Figure 5 above)in which completion times drop rapidly with experience. In a unit rich inexperience, however, an added senior person would be forced to performtasks that someone more junior could complete almost as quickly (corrosioncontrol, for example).
Despite the substantial change in the enlisted experience mix of theAir Force that has occurred since 1979, when RAND conducted the study ofAGE maintenance personnel, adjusting for that change had little effect onthe productivity estimates derived from the data. 227 Although this findingdoes not necessarily imply that relative productivities would not be affectedby the seniority growth projected for the future, it does suggest that theeffects should not be large.
Other Limiting Factors
A number of factors could limit the services' abilities to achieve all of thereturns to more senior forces that are implied by the productivity indexesdeveloped in this study. Some examples follow.
Hardware Dictates Numbers. In many military units the substitution ofexperience for numbers may be difficult, if not impossible. The mainte-nance platoon for a tank battalion probably could get along with fewer peo-ple if it was given more experienced personnel. An individual tank couldnot. The current main battle tank (the M-l "Abrams") was designed arounda crew of four; any smaller number would severely impair its ability tofight. Similar situations arise in other Army units, aboard Navy ships, and inthe aircraft of all the services—indeed, in civilian factories as well. Pastdecisions about the design of machinery and other systems may fix absolute-ly the numbers of people needed to operate them.
The importance of hardware-dictated requirements can be overstated,at least in the long run. Although an individual tank may require four peopleregardless of their experience, greater experience throughout a tank battal-
22. Appendix B discusses the sensitivity test in greater detail.

CHAPTER m EXPERIENCE AND PRODUCTIVITY 35
ion might improve the battalion's performance enough to justify reducingthe number of tanks in the unit. In addition, new tanks might be designedwith more capable crews in mind. Ships would seem to be the epitome oflong-lived hardware, but individual systems within a ship may be modernizedmany times during the ship's operational lifetime, allowing adjustments tobe made for more capable crews. In short, the limitations imposed by pasthardware decisions will tend to disappear with time, both because of newequipment and because organizational restructuring may prove appropriate.
Small Numbers. In an aircraft maintenance shop of fifty men and women, a10 percent reduction means dropping five positions. For the three-personnight shift, which is staffed in case repairs cannot wait until the morning,the 10 percent reduction probably means no decrease at all. Three peoplecould be the minimum number needed to bring to the job all required skills,or to perform all the tasks likely to be required of them simultaneously.
To the extent that manpower requirements in work centers or otherbasic organizational units are dictated by sub-units of small size, the suc-cess of any attempt to substitute experience for numbers will be limited.This is not to say that there are no solutions to problems of this sort; twomaintenance shops might be combined, for example. It does suggest, how-ever, that the productivity indexes developed in this study may overstatethe potential for exploiting productivity gains to reduce personnel strengths.The extent of this overstatement cannot be estimated without a much moredetailed examination of requirements than was possible for this study.
Response of the Manpower System. The very phrase "manpower require-ments" suggests a certain inflexibility of the services' manpower sys-tems. 23/ Requirements are determined through a bottom-up process. Atits base, work-center requirements describe the one best way to accomplishthe required tasks. These are aggregated upward to specialtywide and ulti-mately service wide requirements—in numbers and skill levels (or grades).Practical considerations-including supply constraints-may lead to modifi-cations at various levels in the process, or to deviations between availableinventories and stated requirements, but the process does not provide alter-natives to the one best aggregate manning structure. 24/
23. The term "requirements" as used here blurs the formal distinction between requirementsand authorizations.
24. This broad outline focuses on one key aspect of the services' requirements determinationprocesses. For a more complete description, see Department of Defense, ManpowerRequirements Report for Fiscal Year 1988, Appendix D (February 1987). The GeneralAccounting Office has assessed the rigor of various portions of the processes; a summaryis provided in DoD Manpower: Information on the Accuracy of Defense ManpowerRequirements (March 1986).
TBHT

I : 1
36 SETTING PERSONNEL STRENGTH LEVELS September 1987
Because they do not identify alternative manning structures, the ser-vices' requirements systems cannot promptly identify personnel savingswhen more experienced NCOs are available, nor can they ensure the bestuse of greater experience. They can indicate changes in requirements aftermore experienced personnel are in place, but this can mean lags of severalyears because requirements are not reviewed frequently. These points arenot intended as an indictment of the services' manpower requirements sys-tems. Indeed, those systems appear to be more rigorously developed than istypical in the private sector. They are well suited to a situation in whichenhancements in productivity come primarily from improvements in hard-ware; they do less well when the character of the manpower inputs changes.
The inflexibility of the services' manpower systems that derive fromthe requirements-determination process means that improvements in aggre-gate productivity may not come as quickly, or as completely, as this study'sprojections indicate. How important these effects will be is impossible topredict.
CONCLUSIONS
The data underlying this study's productivity indexes~the only informationavailable-are limited, somewhat old, and not ideally suited to the task towhich they have been applied. Considerations of these defects lead to nofirm conclusions about whether the two main sets of productivity indexes,Case 1 and Case 2, overstate or understate the true aggregate returns toexperience in the military. On balance, it appears that overstatement ismore likely., at least for the Case 1 indexes. This conclusion is based pri-marily on the difficulty that the services' manpower systems might havein fully exploiting the potential gains from a more senior force, and on theproblem of small numbers of personnel in some work centers. In combina-tion with the earlier conclusion that Case 2 represents a very conservativeinterpretation of the available data, this suggests that it may be appropriateto take the Case 1 and Case 2 projections as upper and lower bounds, re-spectively, of future changes in aggregate productivities.
Clearly, the long list of limitations argues for more research. Mostneeded are studies examining the effects of experience beyond the firstterm of service, The limitations also suggest that one must be conservativein reaching any conclusions. This paper adheres to that philosophy by show-ing results under cases that assume little or no increase in productivityalong with those that assume more substantial increases.

CHAPTER HI EXPERIENCE AND PRODUCTIVITY 37
The list of limitations could also lead one to decide that no conclusionscan be reached. The services seem to be planning, however, to acceptsubstantial increases in experience that will add as much as $720 million peryear to their personnel costs by 1992. They apparently feel they have infor-mation regarding trade-offs between experience and productivity that en-ables them to make this decision. Thus it seems reasonable to review alter-natives to their decision using the same information. This is done in thenext chapter.

J.I..

CHAPTER IV
AGGREGATE PRODUCTIVITY LEVELS
AND ENLISTED STRENGTH PLANS
Personnel strength levels are convenient, but deceiving, indicators of mili-tary force capabilities. Chapter II showed that the enlisted forces of allfour active services will likely undergo fundamental changes through themid-1990s, becoming composed increasingly of senior, experienced person-nel. These more experienced personnel will add significantly to personnelcosts-at least $420 million in 1992, relative to 1987, and as much as $720million if they are promoted at the same rates as in the 1980s. Added costswill be even greater in subsequent years. A focus on personnel strengthsalone ignores these important changes.
Weighting personnel at different experience levels by their relativeproductivities, rather than simply adding up their numbers, yields an alter-native measure of capability that attempts to capture the effects of projec-ted seniority growth. Available data are not adequate to permit firm con-clusions about the rate at which productivity grows with experience, orabout how individual productivities affect unit capabilities. The data aresufficient, however, to yield useful indications.
If the services are not taking account of productivity gains, they maybe overestimating their future needs for enlisted personnel. Put anotherway, if the Congress is satisfied that the capabilities of today's enlistedforces are adequate, given their sizes, it can reasonably consider strengthreductions, or increases smaller than requested, as the enlisted forces be-come more experienced.
This chapter examines the magnitudes of strength reductions orsmaller increases-and their associated cost savings-that could be madewithout sacrificing overall capabilities. The next section sets out the mainassumptions behind this examination and describes the basic procedurefollowed. The section following shows the capability-adjusted strengthlevels and costs, which depend upon which set of productivity indexes (Case1, 2, or 3) is used. The final section summarizes the principal findings ofthis study.
TT

40 SETTING PERSONNEL STRENGTH LEVELS September 1987
ASSUMPTIONS AND PROCEDURE
This study derived alternative strength profiles for each service that yieldprofiles of aggregate personnel productivity matching the planned strengthprofile for that service. The Army, for example, plans for essentially con-stant enlisted strength levels through 1992; the reduced strength levelsshown in the next section would keep aggregate productivity in the Armyconstant at its 1987 level. The Navy plans to increase enlisted strength by5.3 percent between 1987 and 1992; the alternative below would yieldroughly a 5.3 percent increase in aggregate productivity. In these alterna-tives, projected experience growth provides the required capability levelsdespite reductions, or smaller-than-requested increases, in personnelstrength levels.
Three key assumptions underlie this procedure:
o The services' enlisted strength plans represent requirements foraggregate personnel capabilities.
o Enlisted productivity levels in 1987 constitute valid base levelsrelative to which to fix capabilities into the future.
o Experience can substitute for numbers.
The first assumption implies that the services do not take account ofexperience growth in setting enlisted strength requirements. Although thismay seem rather extreme, the Defense Department's formal statement ofmanpower needs contains little indication to the contrary. II Only theNavy expresses dissatisfaction with current experience levels or indicatesthat it plans to expand its career force significantly. 2/ The Army, incontrast, states: "The data ... indicate that the Army has a seasonedleadership cadre. No significant changes are projected." 31 None of theservice statements suggests that its strength request would be higher ifseniority growth were not expected.
It should be noted that service strength plans have been sharply cutback in recent years. In 1984, for example, the Navy requested a 1986
1. Department of Defense, Manpower Requirements Report for Fiscal Year 1988 (February1987).
2. Ibid.,p.IV-8,IV-9,IV-17.
3. Ibid.,p.III-13.

CHAPTER IV AGGREGATE PRODUCTIVITY LEVELS 41
strength of 595,600; a year later, its request for 1986 was 586,300. Armyrequests were reduced by 3,000 between 1982 and 1987. Although reduc-tions in planned forces, and transfers of missions to the reserve components,explain much of the strength cuts, it is possible that improved productivityhas also figured in. If improved productivity has been important, however,the services have not shown its importance by providing specific examplesof large reductions in personnel linked to changes in personnel productivity.
The second assumption arbitrarily fixes as the base the last year, atthe time of this study, for which the Congress had approved a defense bud-get. As shown in Chapter II, experience levels in 1987 were substantiallyabove those in 1985, the last year before cuts under the Balanced BudgetAct of 1985 began affecting defense appropriations. Thus, 1987 is a verygood year, by historical standards, for military personnel capabilities.
The final assumption--that experience can substitute for numbers-wasimplicit in the analysis of the previous chapter, but several of the limita-tions and qualifications listed at the end of the last chapter raise concernsabout its validity. The question is not so much whether substitution is possi-ble at all, however, as it is the extent to which such substitution can reducetotal requirements. Thus, although the assumption probably is valid, it maybe appropriate to rely on the range of results bounded by Cases 1 and 2.
ENLISTED STRENGTHS AND COSTS
The alternative strength profiles through 1994, some of which show substan-tial cuts, are described below. The corresponding cost estimates follow thediscussion of strength levels; relative to service plans, possible savings ex-ceed $1 billion per year. Discussion of a potential side benefit-reducedaccession requirements-concludes this section.
Productivity-Adjusted Alternatives for Enlisted Strengths
Limiting aggregate productivity increases to the percentage increases inplanned strength levels could reduce the services' total 1992 enlistedstrength below its level in 1987 (see Table 7). If experience adds consider-ably to productivity (Case 1), strength could be reduced by almost 30,000.More modest effects of experience on productivity (Case 2) would still justi-fy a reduction of 12,000. Only in the unlikely event that an enlistee's exper-ience beyond the first term adds nothing to his or her productivity (Case 3)would an increase in strength be necessary.
nut

!. : L
42 SETTING PERSONNEL STRENGTH LEVELS September 1987
Personnel strength levels would drop even under the extreme assump-tion of Case 3 were it not for the Navy's current plan to increase itsstrength by 5.3 percent. Under Case 3, achieving a 5.3 percent gain incapability would require increasing Navy strength by 3.2 percent, less thanplanned but enough to outweigh the strength reductions in the other ser-vices.
TABLE 7. PERSONNEL STRENGTHS, PRESENT ANDPLANNED, WITH ALTERNATIVES UNDERTHREE PRODUCTIVITY CASES
Army NavyMarineCorps
AirForce Total
Enlisted Strengths (In thousands)
1987 666 509 179 493 1,848
1992:Service Plan 667 536 183 486 1,871Casel 658 513 173 475 1,819Case 2 662 518 176 480 1,836Case 3 665 525 179 484 1,853
Percent Changes
Relative to 1987:Service Plan 0.0 5.3 1.8 -1.4 1.3Casel -1.3 0.8 -3.4 -3.6 -1.6Case2 -0.7 1.8 -1.7 -2.7 -0.7CaseS -0.2 3.2 0.0 -1.8 0.3
Relative to 1992 Service Plan:Case 1Case 2Case3
-1.4-0.8-0.2
-4.3-3.4-2.1
-5.1-3.5-1.8
-2.3-1.3-0.5
-2.8-1.9-1.0
SOURCE: Department of Defense (1987 and service plans) and Congressional Budget Office.
NOTE: Strength levels may not add to totals because of rounding.

CHAPTER IV AGGREGATE PRODUCTIVITY LEVELS 43
Changes also can be assessed against service plans, rather than againstthe 1987 levels. Navy strength would be 2.1 percent to 4.3 percent below itsplan for 1992, Marine Corps strength 1.8 percent to 5.1 percent below itsplan. These large reductions reflect the substantial experience gains thatthis study projects for these two services. Reductions for the Army and AirForce are more modest, leading to total reductions for all services rangingfrom 1.0 percent to 2.8 percent. This would still amount to a reductionbelow planned levels of between 18,000 persons (Case 3) and 52,000 (Case 1).
In general, the largest cuts in enlisted strengths under the three alter-natives would come in 1988. This is apparent in Figure 8, for Case 2. Itreflects the lagged effect of strength changes on aggregate productivitywhen all of the cuts are made in accessions, as this study assumes theywould be (see Chapter II). New recruits add little to total productivity; onlyafter several years do the smaller numbers in the 1988 enlistment cohorthave a significant effect-hence the offsetting upturns in Army and AirForce strength levels in 1990.
Figure 8.Changes in Enlisted Strength Levels from 1987: Case 2
1987 1988 1989 1990 1991 1992 1993 1994Fiscal Years
SOURCE: Congressional Budget Office.
in—rr

Ill44 SETTING PERSONNEL STRENGTH LEVELS September 1987
Personnel Cost Savings under the Alternatives for Enlisted Strengths
Over the five years 1988 to 1992, the strength cuts under Case 1 would savea total of $3.6 billion in 1987 dollars relative to costs under the services'strength plans, an average of more than $700 million per year. Case 2 cuts
TABLE 8. PERSONNEL COSTS, PRESENT ANDPROJECTED, WITH ALTERNATIVES UNDERTHREE PRODUCTIVITY CASES
Army NavyMarineCorps
AirForce Total
1987
1992:Service PlanCaselCase 2Case 3
Relative to 1987:Service PlanCaselCase 2Case 3
Personnel Costs(In billions of 1987 dollars)
17.6 13.9 4.4 13.6
18.3 15.2 4.8 13.918.1 14.8 4.6 13.618.2 14.9 4.6 13.718.2 15.0 4.7 13.8
Percent Changes
3.8 9.6 7.9 2.22.6 6.3 3.5 0.23.1 7.1 5.0 1.03.5 8.2 6.5 1.7
SOURCE: Congressional Budget Office.
NOTE: Cost figures may not add to totals because of rounding.
49.5
52.251.051.451.8
5.33.03.84.6
Relative to 1992 Service Plan:Case 1Case 2CaseS
-1.2-0.7-0.2
-3.0-2.3-1.3
-4.1-2.7-1.3
-2.0-1.2-0.4
-2.2-1.5-0.7

CHAPTER IV AGGREGATE PRODUCTIVITY LEVELS 45
would save $2.2 billion, and even the modest cuts under Case 3 would save$1.0 billion. Table 8 shows the 1992 savings in more detail. 4/
Personnel costs will rise in real terms between 1987 and 1992 undereven the most severe alternative for strength cuts (Case 1). The Case 1cuts would limit the cost increase to $1.5 billion, however—a little morethan half the increase that would occur if the services' strength plans werecarried out. Costs rise even when strength levels are cut because real paylevels must grow if private-sector pay increases are to be matched and, to aesser extent, because of seniority growth. As shown in Chapter II, senioritygrowth will add at least $420 million, and possibly as much as $720 million,to 1992 costs.
The savings are evident when the costs of the three alternatives arecompared with the costs under the services' strength plans (bottom panel,Table 8). 51 Under Case 1, 1992 savings would range from 1.2 percent forthe Army to 4.1 percent for the Marine Corps, with a 2.2 percent savingoverall. That 2.2 percent amounts to $1.2 billion, with the Navy aloneaccounting for almost $500 million. The Case 2 savings—I.5 percent over-all-would be nearly $800 million. To put these savings in perspective, theCase 1 strength cuts would reduce 1992 defense costs by nearly as much ascutting two percentage points off the 1988 military pay raise, a cut thatwould reduce the pay of officers as well as enlistees. 6/
Accession Requirements
A side benefit of strength reductions would be an easing of recruiting pres-sures, which some have seen as a serious concern in the 1990s. Althoughaccession requirements would fall only slightly in the long run, large reduc-tions would occur in the years in which the strength cuts were made andagain when the smaller entry cohorts reached reenlistment points. Thus,strength cuts could be timed to ease recruiting difficulties, should theyarise.
4. The cost savings were projected under the assumption that richer grade mixes wouldbe permitted (see Chapter II). Savings are virtually identical, however, under thealternative assumption of no changes in aggregate grade mixes.
5. Measured relative to the CBO baseline projections of the federal budget, savings wouldfall between those measured relative to 1987 and those measured relative to the serviceplans.
6. Congressional Budget Office, Reducing the Deficit: Spending and Revenue Options(January 1987), pp. 59-60.
rr

ILL
46 SETTING PERSONNEL STRENGTH LEVELS September 1987
To give a specific example, the cuts under Case 2 would reduce thetotal requirement for nonprior-service (NFS) accessions by 4.7 percent in1988 and by 6.5 percent in 1991, relative to requirements under the services'strength plans. By service, reductions in 1988 would range from zero per-cent for the Navy (16.5 percent in 1991) to 8.8 percent for the MarineCorps. Total NFS requirements over the five years 1988 through 1992 wouldfall by 3.6 percent. Reductions of this magnitude would not completelyoffset the effects of smaller enlistment-age cohorts in the 1990s, but couldbe of significant help if problems arose with the quality of recruits.
CONCLUSIONS
The alternatives presented in the previous section should not be construed asrecommendations for strength reductions, either from current levels or fromlevels planned for the future. Rather, they should be taken as indications ofthe magnitudes of reductions that might be justified following a more com-plete examination of experience/productivity trade-offs in the military.The data underlying this study are too limited to provide a firm basis fordecisions on enlisted strength levels. Nonetheless, the main strength-levelalternatives-Case 1 and Case 2~are based on the best information current-ly available, and. so should not be completely discounted. Particularly note-worthy are the possible cost savings if aggregate productivity levels wereused to set enlisted strength levels, rather than the reverse as is now implic-itly done.
The results of this study should present a challenge to those who wouldpermit or encourage the experience trends in the enlisted forces without anyformal justification of the need for more seniority. Either they must acceptthat experience does enhance productivity, in which case strength cutsshould be possible, perhaps along the lines of the Case 2 alternative above;or they can reject this implication and, by extension, reject the need forgreater seniority. Tightened reenlistment standards, possibly accompaniedby severance payments to the more senior personnel forced out, could limitthe coming shifts. Cost savings on the order of $500 million in 1992 shouldbe possible if seniority growth were halted.
Acceptance of this study's productivity results need not necessarilymean acquiesence to personnel strength reductions. It could be argued that,however real the productivity gains accruing from more experienced person-nel, those gains cannot be translated into improvements in aggregate capa-bility that could be traded off against numbers. Some support for this viewappears in the limitations identified at the end of Chapter III. Even if the

CHAPTER IV AGGREGATE PRODUCTIVITY LEVELS 47
possibility of trading experience for numbers is granted, seniority growthappears to provide significant improvement in defense capability at fairlymodest cost. If this study's results are used to justify the projected senior-ity growth, however, the costs and benefits must be compared with those ofalternative means for improving capabilities, and of programs that might besacrificed to pay for greater experience in the enlisted force.
The coming seniority growth, like that of the last decade, is a naturalconsequence of the switch to a wholly volunteer military, It can be ex-ploited to improve defense capability or to ease the effects of defense bud-get cuts or slower growth; or its effects on productivity and costs can beignored, as has largely been the case in the past. This study should serve tobring these alternatives under closer scrutiny.


APPENDIXES
T F I T


APPENDIX A
PAY AND UNEMPLOYMENT ELASTICITIES
TABLE A-l. ASSUMPTIONS FOR PAY AND UNEMPLOYMENTELASTICITIES, BY SERVICE AND YEAROF SERVICE
Pay Elasticity
Year ofService
12345
678910
1112131415
1617181920
2122 +
SOURCE:
NOTE:
MarineArmy
0.02.82.42.21.8
1.71.61.31.11.0
0.90.80.70.50.5
0.00.00.00.02.5
2.40.0
Navy
0.00.02.52.52.4
2.81.71.41.21.1
1.00.80.50.40.3
0.00.00.00.52.8
1.90.0
Corps
0.00.02.82.82.6
1.71.51.51.51.4
1.20.80.80.50.5
0.00.00.00.02.6
2.10.0
AirForce
0.00.00.02.11.9
1.81.61.41.31.2
0.80.50.50.40.2
0.00.00.00.02.2
2.10.0
Unemployment Elasticity
Army
0.000.610.500.450.36
0.320.300.220.190.16
0.140.120.100.070.06
0.000.000.000.000.33
0.290.00
Navy
0.000.000.510.500.46
0.420.310.250.200.18
0.150.120.070.050.03
0.000.000.000.100.34
0.260.00
MarineCorps
0.000.000.540.510.46
0.280.260.230.220.20
0.160.100.100.060.05
0.000.000.000.000.30
0.260.00
AirForce
0.000.000.000.440.37
0.350.290.260.220.20
0.120.070.060.050.03
0.000.000.000.000.27
0.270.00
Congressional Budget Office.
These elasticities indicate the percentage change in the reenlistment rate atthe given year of service resulting from a 1 percent change in the variable.


APPENDIX B
DEVELOPMENT OF PRODUCTIVITY INDEXES
FROM THE RAND AIR FORCE STUDY
The Air Force study did not produce a final report; the only published infor-mation on its findings appears in the text of a briefing. II At CBO's re-quest, the Air Force provided the data developed in the study, as well as acomplete description of the study's methodology. The description, preparedby the study's principal investigator, included a number of cautions, to whichthe Air Force added several others; the cautions are detailed at the end ofthis appendix.
Data
The study divided the manpower in Aerospace Ground Equipment (AGE)maintenance into six labor types based on pay grade and skill level (an AirForce measure of proficiency). Labor-type 1, for example, consisted of allpersonnel in pay grades E-l through E-3, and labor-type 4 of those in gradeE-5 and with skill level 5 (the middle of three skill levels). On average, AGEpersonnel in labor-type 3 had completed four years of service, making this auseful reference group for computing relative productivities.
The data provided to CBO were of four general types:
o Estimates of productivities by labor type, relative to the pro-ductivity for labor-type 3, for each of 13 AGE maintenancetasks. 21
o Estimates of "check time" by labor type and task; check time isthe amount of time required for instruction/supervision/checkingof one hour's work.
1. S. Craig Moore, Demand and Supply Integration for Air Force Enlisted Work ForcePlanning: A Briefing (Santa Monica, Calif.: The RAND Corporation, N-1724-AF, August1981).
2. For brevity, this discussion refers to "tasks." In fact, each "task" comprised a groupof tasks that were selected to be fairly homogeneous with respect to the types of workerswho do them, the degree to which their performance improves with experience, andtheir changes in workloads over time. The groups generally contain about 8 to 25 tasks.

54 SETTING PERSONNEL STRENGTH LEVELS September 1987
o Information on monthly workloads by task.
o Information on the constraints in the task-assignment problemthat were developed in the study.
Relative Productivities by Task and Labor Type. Productivity estimateswere provided by 24 AGE maintenance supervisors who evaluated 90 individ-ual technicians working at two Air Force bases. Together, the 13 tasks forwhich the data were sufficient, two of them supervisory, accounted for abut75 percent of the work time of the AGE technicians; for the remaining 13tasks performed in AGE maintenance, the data were too few for reliableestimates. Relative productivities differed greatly across the tasks. At oneextreme, type-6 labor was 90 percent more productive than type-3 on onetask, whereas on another task the two labor types were equally productive.
Check Time. Except in the simplest task, work by any labor type excepttype 6 generated a check-time requirement. For type 1, the check timesaveraged about 0.13 hours per hour worked across the 11 nonsupervisorytasks; for type 3, the average was about 0.06 hours. Even type-6 laborgenerated check-time requirements in four of the tasks, including both ofthe supervisory tasks.
Workloads. Separate monthly workloads, in hours, were provided for thenonsupervisory tasks at each of the two bases. These workloads differedsubstantially between the two bases, both in their totals and in their distri-butions across tasks. Workloads for the two supervisory tasks were gener-ated by the check-time requirements for the other 11 tasks.
A specific example of the data appears below, showing the productiv-ity, check-time, and workload data for one of the tasks. The top line showsthe relative productivities; the entry for labor type 3 is 1.0 because that isthe reference group. On this task, type-1 personnel are roughly 28 percentless productive, and type-6 personnel 41 percent more productive, than per-sonnel of type 3. The last two columns give the monthly workloads at thetwo bases examined: 179 hours of type-3 labor or its equivalent at NortonAFB and 117 hours at March AFB. Finally, the bottom line shows the checktimes. For every hour that a type-3 person works on this task, for example,someone of a higher labor type must spend 0.098 hours (about six minutes)supervising, instructing, and checking the work.

APPENDIX B DEVELOPMENT OF PRODUCTIVITY INDEXES 55
RequirementsLabor Type
1 2 3 4
at AFBs
5 6 Norton March
RelativeProductivity 0.719 0.836 1.000 1.108 1.242 1.413 178.7 116.7
Check Time 0.155 0.131 0.098 0.068 0.031
Constraints. The materials provided identified four sets of constraints thataffect the allocation of labor types across tasks: workload constraints,forcing the workload requirements to be met; work-mix constraints, to en-sure an appropriate mix of tasks for the personnel of each labor type; avail-able time constraints, which specify the monthly hours per worker; andmanning mix constraints, giving an upper and lower bound for the percent-age of the work force in each labor type. 3/ Also provided were the actualpercentages of AGE maintenance personnel in each labor type throughoutthe Air Force at the time of the study. As discussed below, this study usedthe latter figures, rather than the bounds identified in the manning mixconstraints, to fix the distribution of labor types.
Methodology
The goal of this analysis is to determine relative productivities by labor typefor the entire AGE maintenance work force. As noted in Chapter III, simplyaveraging across the 13 tasks would not be appropriate; no rational managerfacing limited resources would assign the same mix of tasks to every person,as averaging implies. Instead, this study derived aggregate relative produc-tivities after first determining the optimal assignments of personnel totasks.
Optimality. Relative productivities are dependent on the labor-type mix ofthe available personnel (see below). Fixing the mix at the percentages
3. The present study did not apply the available-time constraints because they merelyrepresented the conversion from numbers of hours to numbers of people.

IIHli
56 SETTING PERSONNEL STRENGTH LEVELS September 1987
among all AGE maintenance personnel created a plausible measure of opti-mality: the fewer personnel required, the better the task assignments. Withthe mix across labor types fixed (for example, two type-Is for every type-3),minimizing the number of type-3s yields the same result as minimizing thetotal. Choosing to minimize type-3 labor means that all the productivitieswill be measured relative to this group, which with an average of four yearsof service is the same reference group used in the EUS.
An Example
The complete assignment problem is too complex to present here, involvingwell over 100 equations representing the various constraints. Rather thandescribe the problem in generalities, this section presents a simplified ex-ample with only two labor types and three tasks. The three tasks are de-noted SI (simple), CO (complex), and SU (supervisory); the two labor typesare 3 and 6. Hypothetical data for the three tasks appear below.
Labor Type
Task 3 6 Workload
Simple (SI)Relative productivity 1.00 1.25 400.00Check time 0.08 0.00
Complex (CO)Relative productivity 1.00 1.60 300.00Check time 0.11 0.04
Supervisory (SU)Relative productivity 1.00 1.30Check time 0.06 0.04
The task assignments are indicated by variables such as SI3, whichmeasures the hours of type-3 labor assigned to tasks SI. Similarly, SU6denotes the number of hours that type-6 personnel devote to the supervisorytask. The following equations state the problem:

APPENDIX B DEVELOPMENT OF PRODUCTIVITY INDEXES 57
Minimize: SI3 + C03 + SU3
Subject to:
1.00x813 + 1.25xSI6 >_ 400.001.00xCO3 + 1.60xCO6 >. 300.00 (Workload constraints)
0.08xSI3 + 0.11x003 +0.04xCO6 + 0.04xSU6 <_ 1.30xSU (Check-time constraint)
813 >. 0.3x(SI3 + CO3 + SU3)813 < 0.8x(SI3 + C03 + SU3)COS >_ 0.2x(SI3 + CO3 + SU3)COS <_ 0.4x(SI3 + CO3 + SU3)816 <_ 0.2x(SI6 + CO6 + SU6)C06 > 0.2x(SI6 + CO6 + SU6)COS < 0.9x(SI6 + C06 + SU6)SU6 > 0.3x(SI6 + C06 + SU6)SU6 <_ 0.6x(SI6 + CO6 + SU6) (Work-mix constraints)
816 + CO6 + SU6 = 0.5x(SI3 + COS + SU3) (Labor-type constraint)
The first two equations, which ensure that the required work is accom-plished, demonstrate that all requirements for hours of work are expressedin terms of type-3 labor. The time inputs of type-6 labor, SI6 and C06, aremultiplied by the relative productivities for this group in the two tasks (seeabove). If all the CO work was done by type-6 labor, for example, only187.5 hours would be required (300 f 1.6).
The third equation (check-time constraint), adds up the check timegenerated by each of the tasks. Note that type-6 labor in the SI task gener-ates no check time. The equation expresses another limitation imposed inthe original study: check time must be performed by a higher labor typethan that which generated it, except for type-6. This is why there is noeqiiation for check time performed by type-3 labor, and no entry for SU3 inthe single check-time equation.
The large group of work-mix constraints impose reasonable limits onthe distribution of time across tasks for each labor type. The first twoequations, for example, say that between 30 percent and 80 percent of type-
'WIT ~' "inr
Illl
58 SETTING PERSONNEL STRENGTH LEVELS September 1987
3 hours must be devoted to the SI task. The second two require that be-tween 20 percent and 40 percent of type-3 hours be spent on the CO task.Because these are the only two tasks open to type-3 labor in this example,the two sets of equations could be combined into one. In the full problem,however, the 13 tasks are divided into four categories, with the constraintsapplied to each category as a whole rather than to individual tasks. Thebounds in the full problem were determined as part of the original study,based on an examination of task workloads among the individuals in eachlabor type.
The fifth work-mix equation stands alone (no "greater than or equal")because all of the variables in the problem must be positive. Thus, between0 percent and 20 percent of type-6 hours must be spent on task SI.
Finally, the last equation requires that there be twice as many peoplein labor-type 3 as in type 6. In the full problem, the mix is fixed acrosslabor types at the distribution within the AGE maintenance specialty thatexisted when the original study was conducted.
Numerical Results. The following values solve the example problem:
SI3 =364.13SI6 = 28.70COS = 91.03COG =130.60SU6 = 68.27
Only five constraints are binding: the two workload constraints, the lowerlimits on C03 and SU6, and the labor-type constraint. Note that the check-time constraint is not binding; the amount of supervision time is driven bythe imposed lower limit, not by the task-generated check time. The samesituation arose in the full problem.
To determine the relative productivity of type-6 labor, the problem issolved again with the labor-type constraint replaced by a constraint that thetotal type-6 hours be less than or equal to the total in the first solution(227.58, equal to SI6 + C06 + SU6). This does not change any of the valuesabove because meeting the workload constraints still requires 455.16 type-3hours (twice the type-6). The new constraint is binding, and the shadowprice associated with it is the negative of the relative productivity of type-6labor. Recall that a shadow price measures the effect on the objectivefunction if the constraint is relaxed by one unit. In this case, relaxing theconstraint means adding one type-6 hour; the shadow price indicates thattype-3 hours could be reduced by 0.92 hours.
APPENDIX B DEVELOPMENT OF PRODUCTIVITY INDEXES 59
This result is certainly counterintuitive, indicating that type-6 labor isless productive than type-3 at the margin. The reason it obtains is that thebinding lower limit on type-6 supervision time forces every type-6 worker,including the marginal worker, to devote 30 percent of his or her time towork that, within the problem, is nonproductive. This is not to say that thelower limit makes no sense; it captures the requirement for supervisorywork that is not task-related, such as writing performance evaluations andcounseling junior personnel. The difficulty is that it is unreasonable toassume that when a senior person replaces some number of junior personnelthe total supervision requirement would increase.
A more plausible estimate of the relative productivity of type-6 per-sonnel is obtained when the total for hours of supervisory work (SU6 in thisexample) is fixed at its value in the first solution. 4/ With this done, therelative productivity of type-6 personnel is 1.31.
The Full Problem
Despite the simplicity of the example, it demonstrates all the essential ele-ments of the full problem. Although the initial estimate of type-6 relativeproductivity in the full problem was not less than one, it was less than theestimate for type-5 personnel. The constraints setting lower limits onsupervision time by labor of types 3 through 6 (types 1 and 2 could notsupervise) were all binding. Replacing those constraints, which are ex-pressed in percentage terms, with constraints fixing the absolute hours ofsupervision by each labor type changes an implausible downward-turning ex-perience/productivity profile into a more reasonable one that rises witheach step upward through the labor types.
To derive the Case 1 productivity index from the labor-type productiv-ities, this study assumed that the estimate for a given labor type would bethe productivity of someone with the average years of service of personnelin that labor type. Type-3 personnel, for example, had an average of about4 years of service, type-6 an average of about 16.5. Linear interpolationbetween successive points gave intermediate values.
Sensitivity to the Experience Mix. Between 1979 and 1985, the distributionof enlisted personnel in the Air Force changed considerably. The percentage
4. That is, the lower-bound constraint on SU6 is replaced with a constraint that 8U6 =68.27.
r—rr

60 SETTING PERSONNEL STRENGTH LEVELS September 1987
of first-term personnel dropped by about six points, and that of personnel inyears-of-service 5 through 10 rose by the same amount. If the AGE mainte-nance specialty experienced the same change, it would have meant roughly asix percentage-point shift from labor types 1 and 2 to types 4 and 5 (thetype-3 percentage would not be strongly affected because type-3 includesboth first- and second-term personnel). As noted in Chapter 3, this shiftmight be expected to affect the relative productivities derived from theAGE maintenance data. In fact, virtually all the effects are insignificant.
Little change occurred in the relative productivities because alteringthe mix of labor types only caused two changes in the sets of tasks to whichthe six labor types were assigned. The hours assigned changed, of course,but these changes alone cannot affect marginal productivities; in effect,they move the solution point along a flat portion of the production isoquant.The two alterations in task assignments, which affected labor types 3 and 6,increased the relative productivity of type-6 labor from 1.52 to 1.62. Thisrise seems anomalous, given that it was caused by increases in the percent-ages of type-4 arid type-5 labor. It appears to result from somewhat unusualpatterns of relative productivity within the two affected tasks. Presumably,the patterns are unusual because of the small sample size of the originalsurvey.
Qualifications
In supplying the data, the study's principal investigator noted several cau-tions. For the most part, these concern the applicability of the study'smethods-analysis of individual tasks and linear programming to examinealternative work forces~to the full range of Air Force occupational spec-ialties. Whether they affect the usefulness of the estimated aggregate pro-ductivities is unclear.
One caution mentioned by the principal investigator clearly is relevantto the current study. He noted: "The AGE maintenance work center andthe general accounting work centers were selected for this study becausethey showed clearcut promise for the substitutability of one within-specialtylabor type for another, for substantial productivity increases with greaterworker experience, and, consequently, for a wide range of alternative taskallocations and corresponding multiplicity of manpower configurations thatcould handle the associated workloads." This suggests that substituting ex-perience for numbers may be more feasible in this specialty than is true inother Air Force specialties, and that the relative productivities of seniorpersonnel may be lower in other specialties. These issues are discussed inChapter III.

APPENDIX B DEVELOPMENT OF PRODUCTIVITY INDEXES 61
The Air Force office that transmitted the data to CBO added furthercautions. Of particular relevance to the current study, it noted that "themethodology requires arbitrary assumptions to establish the model'sboundaries," and "type of equipment and workload mix vary significantlyfrom base to base." Although the importance of the latter is difficult toassess, one set of constraints that might be classed as "arbitrary assump-tions" played a major role in determining the results of CBO's analysis: thework-mix constraints. As noted above, the way in which the lower boundson supervision time were entered into the problem directly affected therelative productivity estimates. Because of this, and reflecting a desire tobe conservative, this study used a procedure that yielded relatively modestestimates of the returns to experience to derive the Case 1 indexes.
77-384 (80)
"HBTT ' """"" "" " IT


JUBiL