Seto, K.C., Woodcock, C.E., Song, C. Huang, X., Lu, J. and Kaufmann, R.K. (2002). Monitoring...
18
.C., Woodcock, C.E., Song, C. Huang, X., Lu, J. and Kaufmann, R.K. onitoring Land-Use change in the Pearl River Delta using Landsat TM. International Journal of Remote Sensing, 23(10): 1985-2004 David Black 10/02/2006
-
Upload
leslie-powell -
Category
Documents
-
view
215 -
download
1
Transcript of Seto, K.C., Woodcock, C.E., Song, C. Huang, X., Lu, J. and Kaufmann, R.K. (2002). Monitoring...
Seto, K.C., Woodcock, C.E., Song, C. Huang, X., Lu, J. and Kaufmann, R.K. (2002).
Monitoring Land-Use change in the Pearl River Delta
using Landsat TM.
International Journal of Remote Sensing, 23(10): 1985-2004
David Black10/02/2006

OUTLINE
• Economy of the area
• Why monitor land use change
• Land-use and Land cover
• Change detection techniques available
• Study area and pre-processing
• Methodology
• Accuracy assessment
• Main findings
• Conclusions
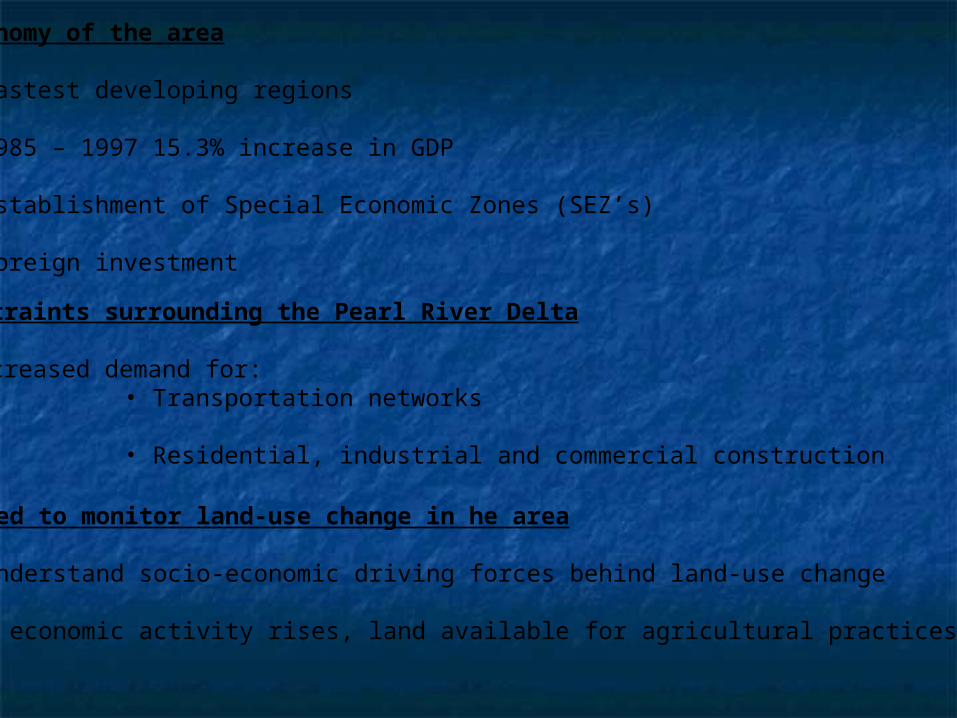
Why the need to monitor land-use change in he area
• Better understand socio-economic driving forces behind land-use change
• As socio economic activity rises, land available for agricultural practices is limited
Constraints surrounding the Pearl River Delta
• Increased demand for: • Transportation networks
• Residential, industrial and commercial construction
Economy of the area
• Fastest developing regions
• 1985 – 1997 15.3% increase in GDP
• Establishment of Special Economic Zones (SEZ’s)
• Foreign investment

Land-use and Land cover
• Land-use: corresponds to land-cover type i.e. how the land is used
• Land-cover: Measures physical attributes, conditions and characteristics of earth surface
Remote sensing and social sciences
• Recent use of satellite remote sensing in social sciences
• Integrate remote sensing with socio economic data
• Satellites observe land-cover not land-use
• Core requirement is that of how land is used

Change detection techniques available
• Image differencing, image regression, image ratioing etc
• No consensus to a “best” change detection technique
• Technique used depends on availability of data, study area, time and computing constraints and type of application
• Numerous studies carried out with difficulty in differentiating specific features
Advantages and disadvantages of Landsat Thematic Mapper
• Spatial resolution provides better discrimination of urban features
• Limited success from previous urban studies
• Spatial variance for urban environment is high
• Difficult to classify due to heterogeneous nature

STUDY AREA
(Source: Terraserver, 2006)
Shenzhen
• Co Registration
• Nearest neighbour resampling
• First order polynomial
• Landsat TM
• 10/12/1988 – 03/03/1996
• Root means squared (RMSE = 0.30 pixels)
• Radiometric correction
Pre - Processing

Methodology
• Accuracy of change map will at best be product of individual classification accuracy of each date
• These sources of error overcome using multi-temporal principal component technique
• Multidate Tasseled Cap transformation is scene dependent and proved successful in monitoring change
• Above method rotates TM data creating three planes (Brightness, Greenness and Wetness)
• Classification process involves five steps:
1. Define map classes
2. Associate land-covers with land-uses
3. Multi-step classification (supervised classification and spectral disaggregation)
4. Image segmentation
5. Map editing
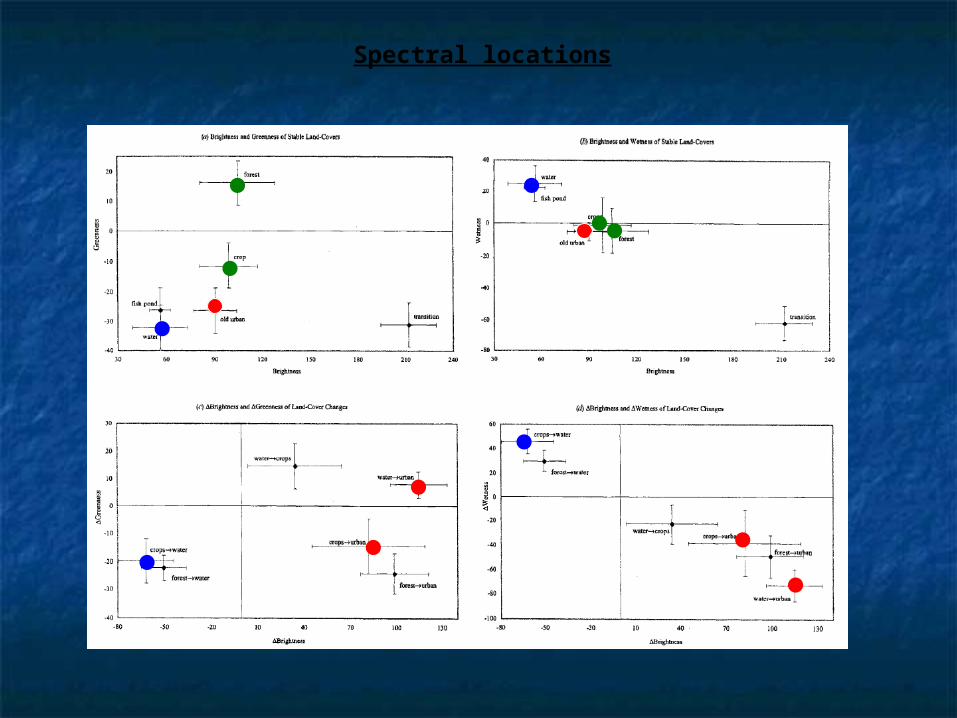
Spectral locations

Land cover classes and number of training
Site selection based on:
• Visual inspection (lab and field)
• Training sites selected from field in China in February 1998
• Sites Georeferenced
• Limited access to some areas

Multi-step classification

Image segmentation
• Visual inspection indicated speckle
• Distributed without a clear pattern
• Removed using multi-pass, region based image segmentation algorithm
• Segmentation process enlarges regions by merging neighbouring pixels into polygons
Map editing
• Areas of the Delta exclusively agriculture, classified as urban
• Areas at centre of Guangzhou were classified as crops
• Possibly due to atmospheric effects not uniform throughout the image
• Pollution also had an impact
• Single radiometric calibration was applied
• Overall resulted in relabelling 5% of entire image

Land-use change 1988 - 1996

Accuracy assessment
• Conducted using validation data independent of the training data
• 496 2x2 pixel sites
• Stratified random sampling
• 151 sites analysed in the field
• 345 analysed in the lab (at least two analysts)
• Analysis made without knowledge of each analysts choice of class

Users accuracy
Producers accuracy
Area estimates
Accuracy Assessment

Discussion
• Agricultural class main source of confusion, due to diversity and different crop types
• Multi-crop fields, terracing and small field sizes produce different textures and tones
• Generate heterogeneous surfaces
• Harvested rice fields essentially are bare soil areas, thus confusion with construction sites
• 1988 – 1996 experienced unprecedented scale of land conversion
• 1905km2 converted to urban. Increase of 364%
• 1988 2.67% of study area was urban. 1996 almost 10% of study area changed to urban
• ¼ of new urban areas were natural vegetation or water
• 151km2 of water converted to agriculture.

Conclusions
• Conceptual model composed of spectrally diverse land-covers provides good frame work to infer land-use change from land-cover
• Accuracy assessment was essential
• Unprecedented rates of change
• Urbanization rates of 300%
• Economic growth which has directly improved living standards
• Most conversion is from agriculture to urban areas thus has potential serious implications on regional food supply and biogeochemistry

References
• Seto, K.C., Woodcock, C.E., Song, C. Huang, X., Lu, J. and Kaufmann, R.K. (2002). Monitoring Land-Use change in the Pearl River Delta using Landsat TM. International Journal of Remote Sensing, 23(10): 1985-2004
• TERRASERVER (2006) [Online]. http://www.terraserver.com/

Questions ?


![K.C. Electric Is a Nonprofit Electric Cooperative K. …...K.C. ELECTRIC ASSOCIATION [Country News]coloradocountrylife.coop NOVEMBER 2015 7K. K.C. Electric Association is a nonprofit](https://static.fdocuments.in/doc/165x107/5f8b427967b3c91bd9221f78/kc-electric-is-a-nonprofit-electric-cooperative-k-kc-electric-association.jpg)