SESSION B3: GROWTH & INVESTMENT ACTIVITY: 5 … · 23/4/2013 · SESSION B3: GROWTH & INVESTMENT...
39
SESSION B3: GROWTH & INVESTMENT ACTIVITY: 5 AND 10 YEAR PREDICTIONS FOR EDMONTON Moderator: Sandy McNair, President, Altus InSite Panel: Peter Choy, Director, Industry Development, Edmonton Economic Development Corporation David Dale-Johnson, Stan Melton Chair in Real Estate, Alberta School of Business Jim Hewitt, Partner, Portfolio Management, KingSett Capital Dave Young, Senior Vice President, CBRE Limited
Transcript of SESSION B3: GROWTH & INVESTMENT ACTIVITY: 5 … · 23/4/2013 · SESSION B3: GROWTH & INVESTMENT...

SESSION B3: GROWTH & INVESTMENT ACTIVITY: 5 AND 10 YEAR
PREDICTIONS FOR EDMONTON
Moderator: Sandy McNair, President, Altus InSite Panel: Peter Choy, Director, Industry Development, Edmonton Economic Development Corporation David Dale-Johnson, Stan Melton Chair in Real Estate, Alberta School of Business Jim Hewitt, Partner, Portfolio Management, KingSett Capital Dave Young, Senior Vice President, CBRE Limited

2 Commercial Real Estate in Favour
Canada Bonds 1.96 %
Stock Market 5 .69%
IPD 14.10%
REIT 14.25%
$Source: TSE, index CapReit, - JANUARY 2013
3
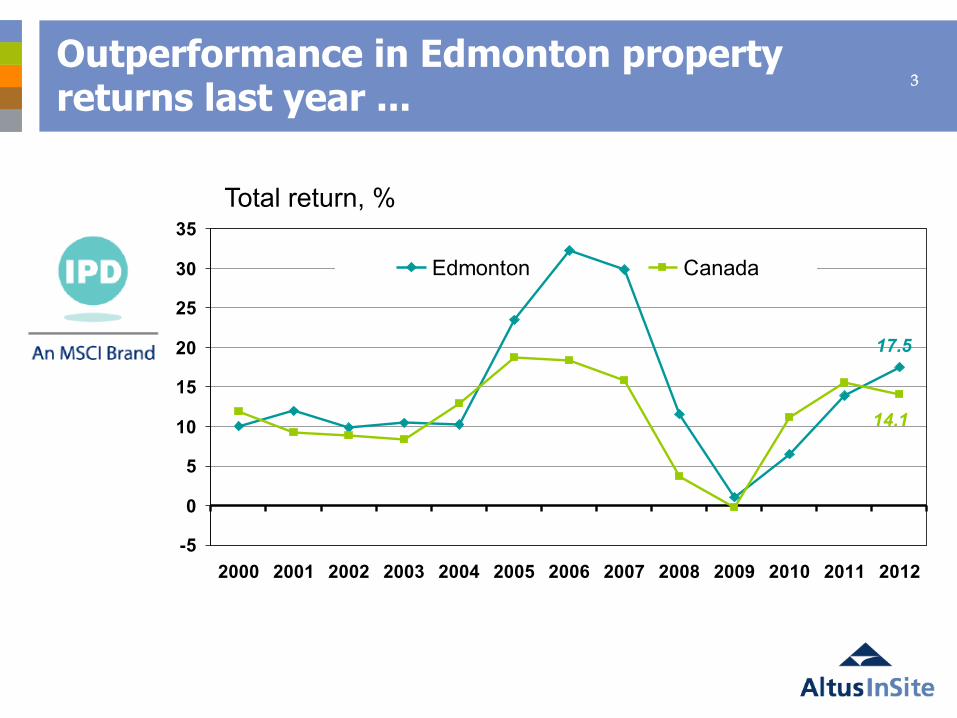
17.5
14.1
-5
0
5
10
15
20
25
30
35
2000 2001 2002 2003 2004 2005 2006 2007 2008 2009 2010 2011 2012
Edmonton Canada
Outperformance in Edmonton property returns last year ...
Total return, %
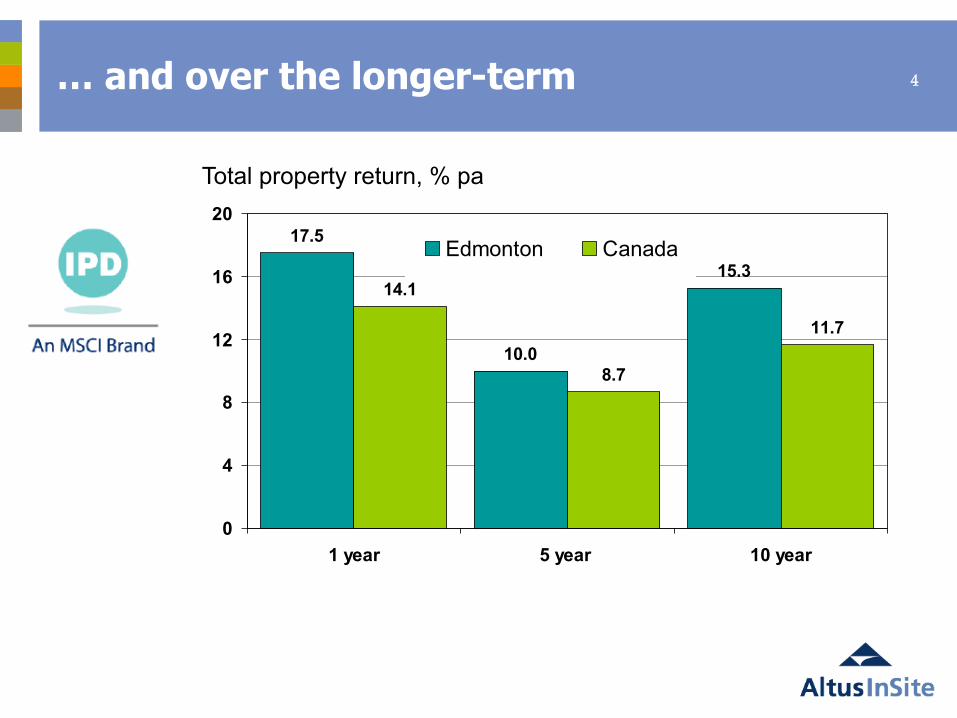
4 … and over the longer-term
17.5
10.0
15.314.1
8.7
11.7
0
4
8
12
16
20
1 year 5 year 10 year
Edmonton Canada
Total property return, % pa
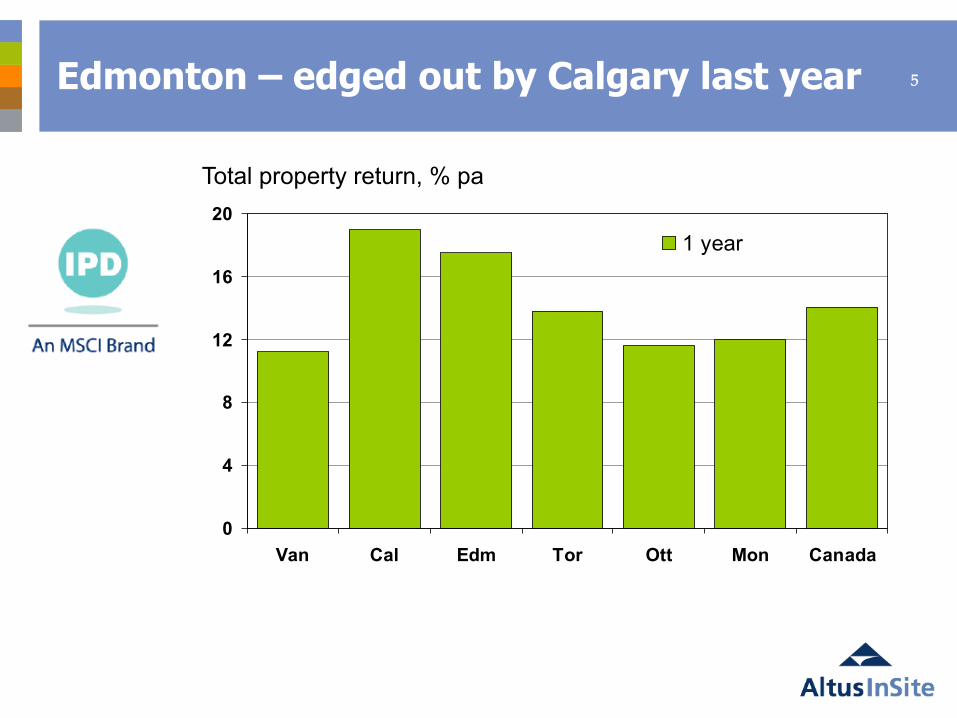
5 Edmonton – edged out by Calgary last year
0
4
8
12
16
20
Van Cal Edm Tor Ott Mon Canada
1 year
Total property return, % pa
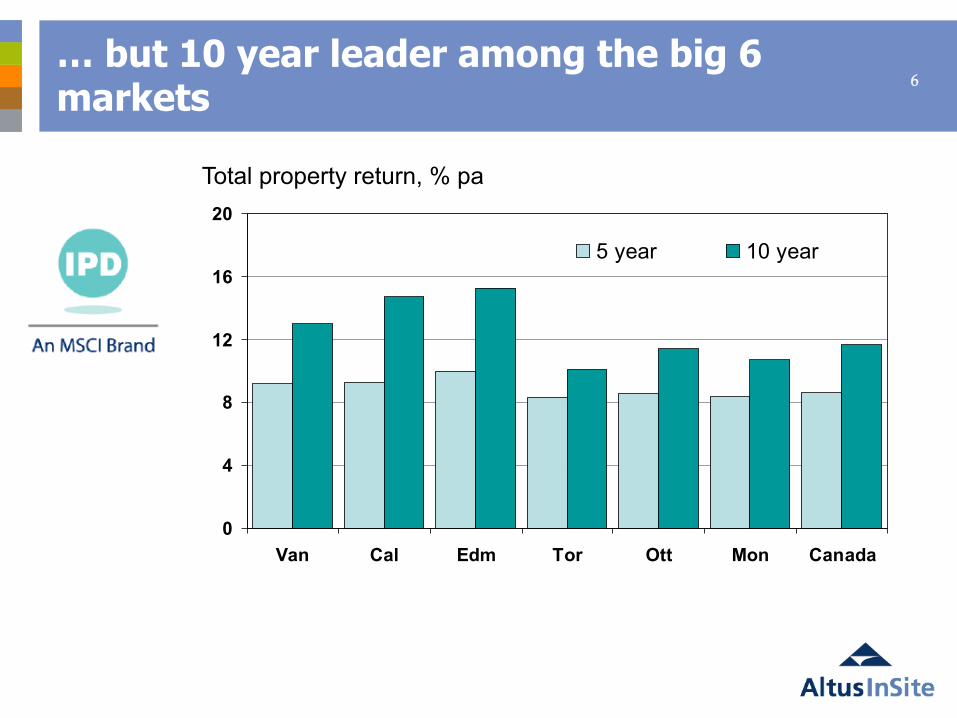
6 … but 10 year leader among the big 6 markets
0
4
8
12
16
20
Van Cal Edm Tor Ott Mon Canada
5 year 10 year
Total property return, % pa

7 … with strongest capital growth accompanied by a solid income return
0
4
8
12
16
20
Van Cal Edm Tor Ott Mon Can
Income return capital growth Total return
% pa, 10 year (2002-2012)

8 All Edmonton sectors delivered double-digit 10 year returns, led by office
0
4
8
12
16
20
Retail Office Industrial Mult-family/rental
1 year 10 yearTotal return, % pa

9 Yield Compression Have we finally leveled off?
Source : Altus InSite Investment Trends Survey Q1 2013
6.2% 5.6%
Average Yields 2008-‐‑2013

10 But we could go lower!
Source: Altus InSite, Investment Trends Survey – Q4 2012
Spread between NOI yield and Canada 10-‐‑year bond yield

11 Office Space Per Capita Major Markets in Canada
*Population source: Wikipedia 2011
0
10
20
30
40
50
60
Vancouver
Edmonton
Calgary
Regina
Saskatoon
Winnipeg
Toronto
Ottawa
Montreal
Quebec
Halifax

12 Age of Office Inventory in Canada
Source: Altus InSite, Q1 2013, excludes Government Owned Office Buildings
% of Total Existing Inventory Vancouver Edmonton Calgary Toronto Montreal
Pre 1960 10.7 5.1 3.1 13.1 19.4 1960 thru 1989 49.2 79.4 62.3 55.2 58.6
Since 2000 21.0 11.3 30.6 15.4 10.3 Current Under Construction
6.9 0.8 6.3 3.9 3.0

13
COMPLETIONS - 1955-2014
0.0
0.5
1.0
1.5
2.0
55 57 59 61 63 65 67 69 71 73 75 77 79 81 83 85 87 89 91 93 95 97 99 01 03 05 07 09 11 13
AR
EA
(000
,000
s S
Q. F
T.)
Existing Under Construction
Edmonton New Office Supply
Will New Supply bring back the Dark Days? In Edmonton a smaller portion of Population, GDP and Job Growth Converts into Demand for Office Space.
Canada Place 1985
Epcor 2011
Commerce Place 1990
Source: Altus InSite, Q1 2013

CB Richard Ellis | Page 14
EDMONTON INVESTMENT MARKET David B. Young

CB Richard Ellis | Page 15
INVESTMENT TRANSACTIONS (>$5M) & VOLUMES

CB Richard Ellis | Page 16
Source: CBRE Limited
INVESTMENT VOLUMES Edmonton Industrial and Land

CB Richard Ellis | Page 17
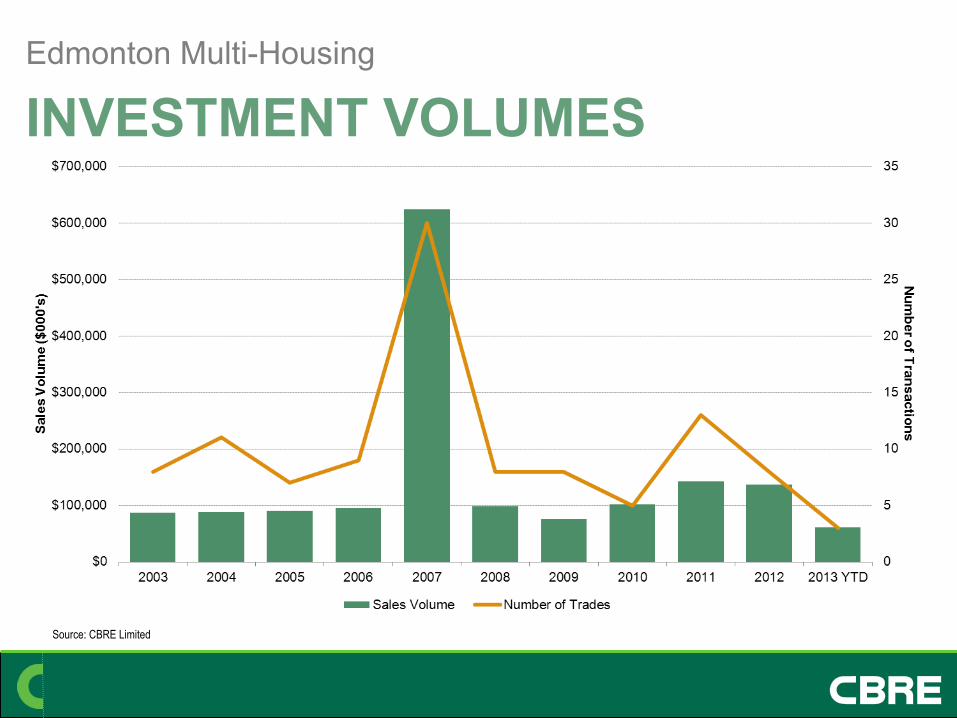
Source: CBRE Limited
INVESTMENT VOLUMES Edmonton Office Market

CB Richard Ellis | Page 18
Source: CBRE Limited
INVESTMENT VOLUMES Edmonton Retail Market
CB Richard Ellis | Page 19
Source: CBRE Limited
INVESTMENT VOLUMES Edmonton Multi-Housing

Edmonton Economic Performance April 2013
Prepared By: Edmonton Economic Development Corp.

www.edmonton.com Source: Conference Board of Canada
GDP Growth
0.0%
1.0%
2.0%
3.0%
4.0%
5.0%
6.0%
7.0%
8.0%
2011 2012 2013F 2014F
Edmonton Real GDP Growth and Forecast
Edmonton Canada

www.edmonton.com Source: Conference Board of Canada
GDP Growth
$30,000
$40,000
$50,000
$60,000
$70,000
$80,000
$90,000
$ 20
07
Real GDP per Capita - Major Canadian Cities
Calgary Edmonton Vancouver Ottawa Toronto Montreal

www.edmonton.com Source: Conference Board of Canada
Migration
-5,000
0
5,000
10,000
15,000
20,000
25,000
30,000
2010 2011 2012 2013F 2014F
Annual Net Migration
Interprovincial International Intercity
www.edmonton.com
Source: Conference Board of Canada
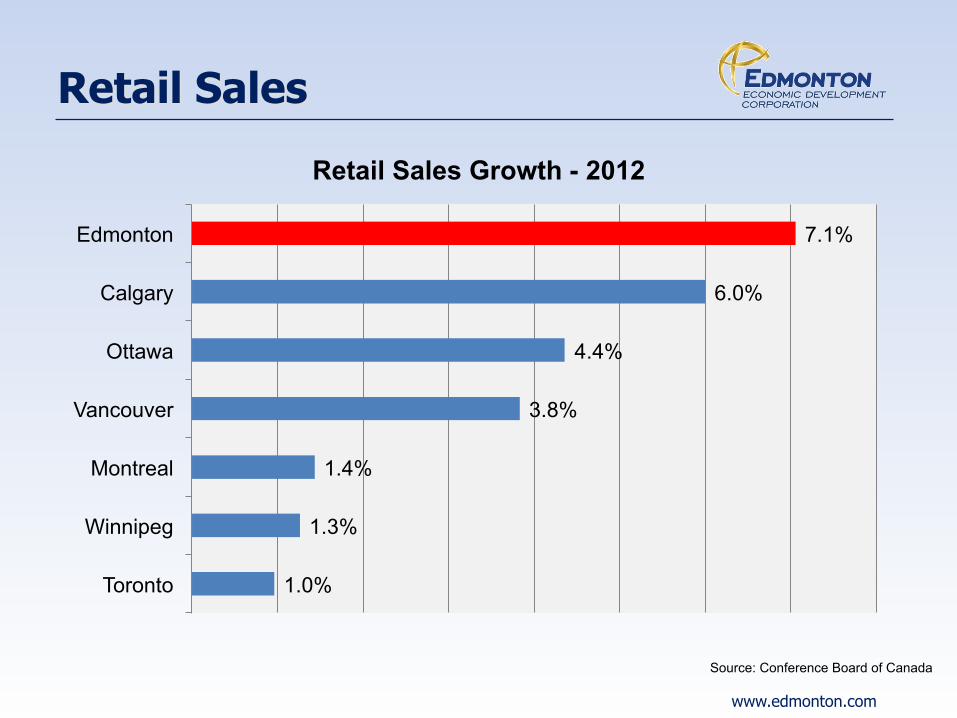
Retail Sales
1.0%
1.3%
1.4%
3.8%
4.4%
6.0%
7.1%
Toronto
Winnipeg
Montreal
Vancouver
Ottawa
Calgary
Edmonton
Retail Sales Growth - 2012

www.edmonton.com Source: Statistics Canada
Inflation
-1.0% -0.5% 0.0% 0.5% 1.0% 1.5% 2.0% 2.5% 3.0% 3.5% 4.0%
Inflation Rate
Canada Edmonton

www.edmonton.com Source: Statistics Canada
Inflation
110
120
130
140
150
160
170
180
190
200 Non-Residential Construction Cost Index (2002=100)
Office Warehouse Shopping centre Light factory

www.edmonton.com
Labour Market
Source: Statistics Canada
2%
3%
4%
5%
6%
7%
8%
9% Unemployment Rate
Canada Edmonton

U N I V E R S I T Y O F A L B E R T A U N I V E R S I T Y O F A L B E R T A
HIGHER EDUCATION ���‘ROLE IN THE EDMONTON ECONOMY’���
David Dale-Johnson. Ph. D.���STAN MELTON CHAIR IN REAL ESTATE���
4/23/2013

U N I V E R S I T Y O F A L B E R T A
OUTLINE
q Growth at U of A as measured by enrollment, faculty q Impact of U of A on Alberta and Edmonton Economy q Role of U of A in Edmonton relative to other major Universities (e.g.,
UBC, U of T, McGill) q Other institutions likely have significant impact - NAIT, Grant
MacEwan q Global Trends in Higher Education

U N I V E R S I T Y O F A L B E R T A
ENROLLMENT

U N I V E R S I T Y O F A L B E R T A
FACULTY

U N I V E R S I T Y O F A L B E R T A
UNIVERSITY OF ALBERTA ECONOMIC IMPACT
Economic Impact SFU uO1awa UBC U of A
Ins=tu=onal 658.5 711.0 2,014.0 2,020.8
Student 295.1 390.8 313.8 292.8
Visitors 165.5 18.1 283.5 212.5
Alumni Educa=on Premium 1,682.1 1,604.2 2,667.6 4,133.1
Impact of Research 851.7 1,208.8 5,097.3 5,654.3
Total Economic Impact 3,652.9 3,932.9 10,376.2 12,313.5
Impact Summary ($M; Adjusted to 2009/10 Fiscal Year)

U N I V E R S I T Y O F A L B E R T A
U OF A ECONOMIC IMPACT
q The University of Alberta is one of the largest drivers of the provincial economy;
q The University of Alberta induces a much higher level of regional economic activity than other studied peer institutions, both proportionally and as a total measure;
q At the individual level, the high education premiums that accrue to alumni suggest that university education means more in Alberta than in the other major provinces;
q $12.3 billion economic impact of the University of Alberta represents approximately 5.0% of Alberta’s GDP in that same period.

U N I V E R S I T Y O F A L B E R T A
UNIVERSITY OF ALBERTA RESEARCH/R & D
Per CMA resident

U N I V E R S I T Y O F A L B E R T A
TEC EDMONTON – SPIN OFF BENEFITS ���FOSTERED AT THE U of A
q TEC Edmonton, is a joint venture between the university and Edmonton Economic Development Corporation, forged to foster commercialization of research and bring the results of innovation to the benefit of Albertans.
q In 2012, TEC gauged the success of its programs by collecting feedback from 74 of about 85 clients. The companies had generated $73 million in revenue. Also, they raised $27 million financing in 2012 and done $17 million of R&D, and grown their employment from 600 to 750 people.
U N I V E R S I T Y O F A L B E R T A
TEC EDMONTON – EXAMPLES
q http://www.innovativetraumacare.com/
q http://www.metabolomictechnologies.ca/ http://www.vancouversun.com/business/From+idea+commercial+uccess/8019041/story.html
q https://www.loginradius.com/
q http://www.tecedmonton.com/Blog/tabid/435/entryid/105/SWYPE-A-100-million-made-in-Edmonton-technology-success-story.aspx
U N I V E R S I T Y O F A L B E R T A
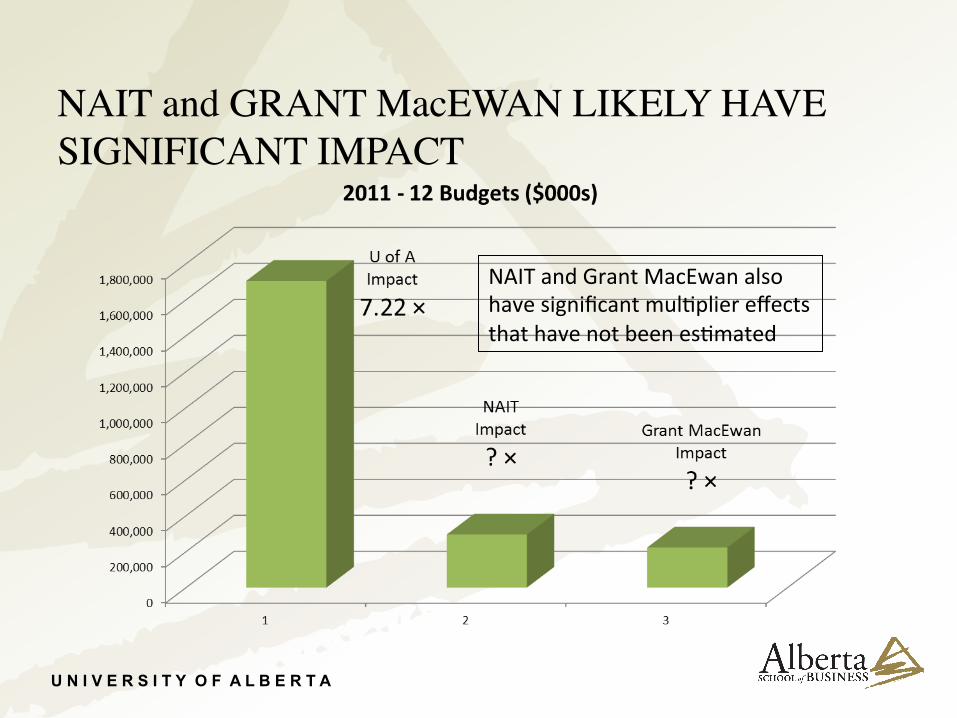
NAIT and GRANT MacEWAN LIKELY HAVE SIGNIFICANT IMPACT
NAIT and Grant MacEwan also have significant mul=plier effects that have not been es=mated
U N I V E R S I T Y O F A L B E R T A
TRENDS IN HIGHER EDUCATION
q Massive Open On-line Courses (MOOCs) evolve q Education and machine learning researchers at the University of
Alberta are joining forces with leading online education provider Udacity to further develop and refine methods for delivering academic courses online.
q In the UC and Cal State systems the 50 most oversubscribed lower division undergraduate courses that are deemed necessary for program completion, fulfilling transfer requirements, or meeting general education requirements will be made available online through a new framework employing multiple providers.

U N I V E R S I T Y O F A L B E R T A
TRENDS IN HIGHER EDUCATION
q Emerging economy universities increasing quality - Canadian, UK, Australian, US educated nationals return to their home countries and the quality of post-secondary education is increasing dramatically
q Implications for foreign student population q Opposing force is that a Canadian University education provides at
foothold for a job and possibly citizenship – that will remain in demand for countries where there is political risk
q $64,000 question – what will the University of the future look like? What does the U of A need to do to keep in the game.