Session 8.3: Business Work Improvement Course (Financial Statements and Analysis)
21
SESSION 8.3: FINANCIAL STATEMENTS AND FINANCIAL ANALYSIS Business Work and Improvement Course
-
Upload
lym-relampagos-ongoy -
Category
Business
-
view
46 -
download
0
Transcript of Session 8.3: Business Work Improvement Course (Financial Statements and Analysis)

SESSION 8.3: FINANCIAL STATEMENTS
ANDFINANCIAL ANALYSIS
Business Work and Improvement Course

II. Financial Statements
•Financial statements are the end-product of the financial accounting process.
•Major financial statements:• Income Statement•Statement of Cash Flows•Balance Sheet

Financial Statements
a. Income Statement – tells how much money does the business earn over a given period of time.
Gross Profit = Sales – C0st of Sales
Net Profit = Gross Profit – Expenses

Options to increase profit
1. Increase Sales – how? Quantity/Volume Sold
Or Selling Price
2. Decrease Expenses – how ?Reduce overhead expenses Reduce maintenance/repair costs

How to Determine the Cost of Sales
Trading BusinessBeginning Inventory xxxAdd: Purchases xxxTotal Inventory xxxLess: Ending Inventory xxxCost of Sales xxx
Beginning Inventory xxxAdd: Direct Materials, Direct Labor, overhead expenses (light, water, power, rents, indirect labor etc.) xxxTotal InventoryLess: Ending Inventory xxxCost of Sales xxx
Manufacturing
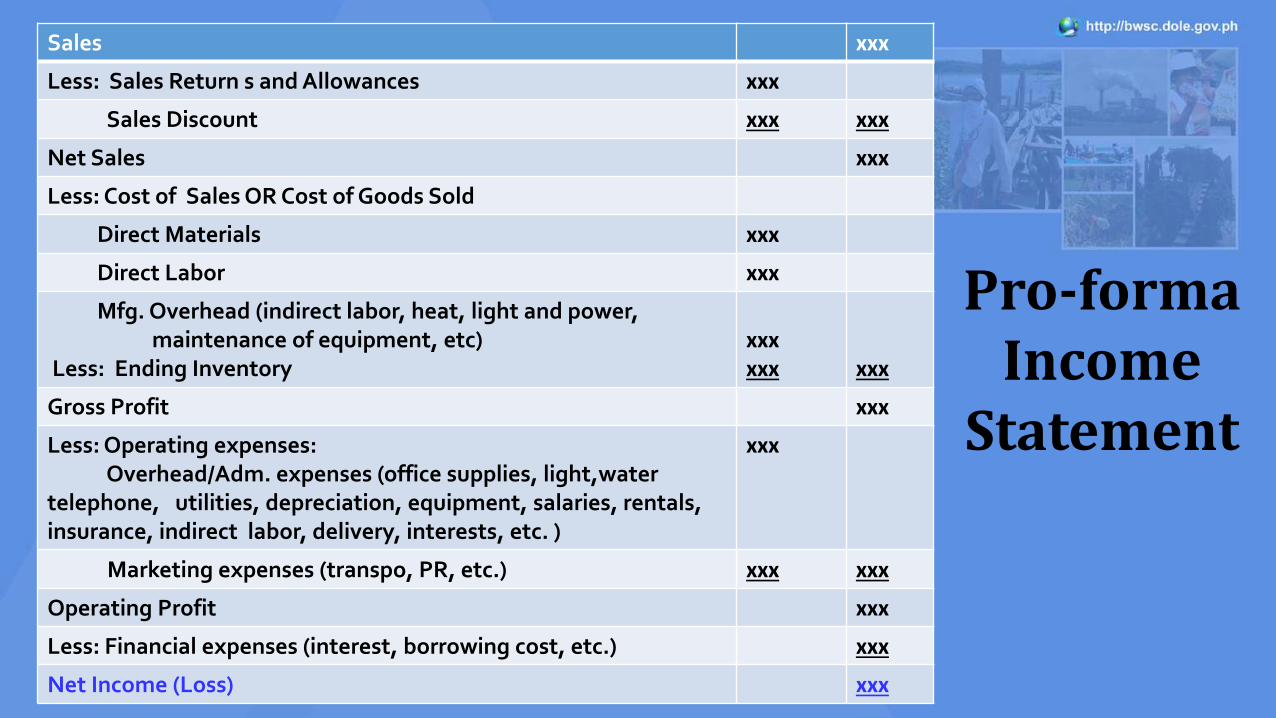
Sales xxx
Less: Sales Return s and Allowances xxx
Sales Discount xxx xxx
Net Sales xxx
Less: Cost of Sales OR Cost of Goods Sold
Direct Materials xxx
Direct Labor xxx
Mfg. Overhead (indirect labor, heat, light and power, maintenance of equipment, etc)
Less: Ending Inventoryxxxxxx xxx
Gross Profit xxx
Less: Operating expenses:Overhead/Adm. expenses (office supplies, light,water
telephone, utilities, depreciation, equipment, salaries, rentals, insurance, indirect labor, delivery, interests, etc. )
xxx
Marketing expenses (transpo, PR, etc.) xxx xxx
Operating Profit xxx
Less: Financial expenses (interest, borrowing cost, etc.) xxx
Net Income (Loss) xxx
Pro-forma Income
Statement

Financial Statements
b. Cash Flow Statement – tells how much cash is needed to meet obligations, when it is needed, and where it is coming from.
• Cash in-flow – cash coming INTO the business i.e. financial investment, sales revenues, interest on savings, etc.
• Cash out-flow – cash coming OUT of the business i.e. disbursements on: a. operating expenses (direct materials, direct labor), b. overhead costs (heat, light water, indirect labor, rental, etc.), c. acquisition of assets, and d. dividends and income tax payments.
• Covers pre-operating period

ParticularsDay/Week/Month
1 2 3 4 5 6 7 8 9
Cash at the beginning of the Period
Add: CASH INFLOW
Assistance from DOLE
Equity from ACP / proponent
Cash Sales /Interest
Income/collections
TOTAL CASH INFLOW
Less: CASH OUTFLOW
Direct Costs (direct materials and
labor, supplies, equipment, etc.)
Indirect Costs(rent, interest, electricity
telephone, depreciation)
Any other cash out (pre-operating
expenses, loan repayment, etc.)
TOTAL CASH OUTFLOW
Cash at the end of the month
Pro-forma Cash Flow Statement

Financial Statements
c. Balance Sheet – shows the snapshot of a company’s financial condition at a given period of time showing the business’ growth in terms of Net Worth. It shows the assets, liabilities and capital/equity at a given date.
Assets = Liabilities + Capital/Owner’s Equity
ASSETS LIABILITIES OWNER’S EQUITY
Current AssetsFixed AssetsOther Assets
Current LiabilitiesLong-term LiabilitiesAccrued expenses
Amount invested (DOLE, ACP, Beneficiaries, loans)Retained earningsreinvested

ASSETSCurrents Assets:
Cash Accounts Receivables Notes Receivables Inventories Prepaid Expenses
Total Current Assets
Fixed Assets (Net of Depreciation):
Land Building (Workplace) Equipment Machineries
Total Fixed Assets Other Assets
TOTAL ASSETS
xxxxxxxxxxxxxxxxxx
xxxxxxxxxxxxxxxxxxxxx
LIABILITIES AND OWNER’s EQUITY
LIABILITIES:Current Liabilities:
Accounts PayableNotes Payable
Other Liabilities Total Liabilities
OWNER’S EQUITY (Capital)DOLE Equity ACP Equity Beneficiary Counterpart Retained Earnings Total Owner’s Equity
TOTAL LIABILITIES AND OWNER’ EQUITY
xxxxxxxxxxxxxxx
xxxxxxxxxxxxxxx
xxx
Pro-forma Balance
Sheet

Financial Analysis
Test of Profitability: Return of Investment (ROI)
Test of Liquidity: Current Ratio
Test of Operating Leverage: Break-even Analysis

ROI - is the expected rate of return on the total cost invested to
the project.
ROI = Net Income/ Total Project Cost
Sources of data:1. Projected Net Income to be derived from the Projected Income
Statement2. Total Project Cost to be derived from the Total Project Cost
Schedule
What is ROI and How To Compute It?

Computation of ROI ( illustration)
Assumptions: Net Income - P 72,000.00Total Project Cost - P 215,000.00
ROI = Net Income/Total Project Cost= P72,000/P215,000.00 = .33 or 33%
This indicates that the livelihood is expected to generate a return of P33.00 for every P 100.00 invested in the project (DOLE + ACP +beneficiaries’ equity).
The higher the ROI, the more the project is profitable.

What is a Current Ratio and How To Compute It?
Current Ratio = Current Assets / Current Liabilities
Cash P11,572Short-term investments 76,853Receivables 14,921Inventory 1,920Other current assets 3,740Total Current Assets P109,006
Accounts Payable P 9,958Short-term debt 2,000Other Current Liab 21,945Total Current Liabi P33,903
The higher the ratio, the business is more able to pay its obligations. A ratio between 1.5 and 3 is generally considered healthy.
CR = P109,006 / P33,903 = 3.22
Current Assets Current Liabilities
Current Ratio (CR) - is a financial ratio which shows the liquidity of a business and its ability to generate sufficient funds (monetize products) to meet current operating needs and current debts

What is Break-even Analysis / Break-even Point?
Break-even Analysis (BEA)
is a tool in determining the point at which the project’s revenue (sales) equals the costs (fixed and variable costs) associated with it, with emphasis on the Break-even Point. It helps determine how much volume of product will be sold in order to make a profit.
Break-even Point (BEP)
is the point at which the company’s sales exactly cover its expenses in producing and selling its products, without making a profit or taking a loss.

Factors in Figuring out Break-even Point
1. Direct or Variable Costs – are costs that go into creating the product or service (direct materials and direct labor).
2. Indirect or Fixed Costs – are costs that do not depend on the volume of production (rents, water, light and power, advertising, office supplies, wages of office staff, staff)

Calculating Break-even Point
Break-even Point Volume/Units (BEV):
BEV = Fixed CostPrice per Unit- Variable Cost Per Unit
Break-even Point Sales (BES):
BES = BESP x Break-even Sales Units
Break-even Point Selling Price (BE SP):
BESP = Total Cost (Variable + Fixed Costs)Unit Volume

Sales:
Sales price per unit P12.50
Sales volume 1,000
Total Sales P12,500.00
Total Variable Costs P7,600.00
Total Fixed Costs 3,400.00
Net Profit/Loss P1,500.00
Illustration (figures in peso)

1. BEP Vol = ________Fixed Cost______________Price per Unit- Variable Cost Per Unit
= P 3,400.00 = P 3,400.00 P 12.50-P 7.60 P 4.90
= 694 units
3. BEP Sales = Price per Unit x Break-even Sales Volume = P 11.00 x 694 units= P 7,634.00
2. BEP SP = Total CostUnit Volume
= P 11,000.001,000 units
= P 11.00 per unit
Computation of BEP (illustration)
References:
• BRW Manual on Development of Self-Reliant Organization
• Technical Paper on Break-even Analysis
• Start Your Business Flyers of the DTI
• Rasul and Macalindong PPT on Project Development and Management
• https://cnx.org/contents/0OlLxNru@1/Basic -Accounting-Concepts---De
• http://definitions.uslegal.com/b/bookkeeping/

SALAMAT PO!
Financial Statements and Financial Analysis
Business Work and Improvement Course