Session 20 Daniel Furda, Bahareh Saffarian
20
Daniel Furda, Bahareh Saffarian Linköpings universitet Methods for work zone dynamic merge using traffic lights
Transcript of Session 20 Daniel Furda, Bahareh Saffarian

Daniel Furda, Bahareh Saffarian
Linköpings universitet
Methods for work zone dynamic merge using traffic lights
2
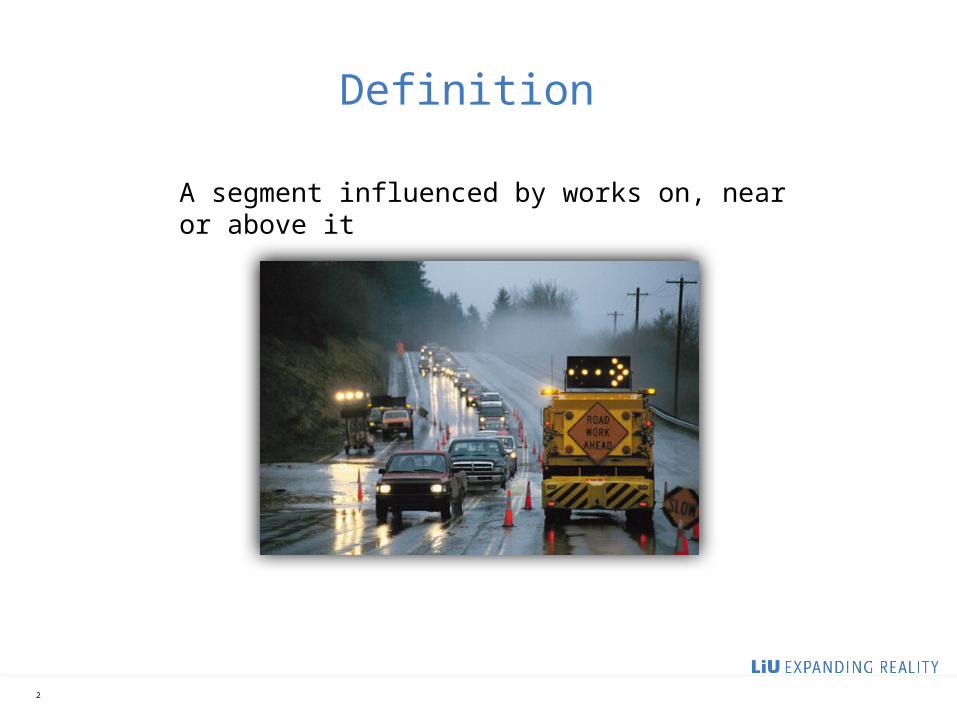
Definition
A segment influenced by works on, near or above it

3
Work zone classifications
• Duration of the work
• Type of the interaction between road and the work zone
• Work intensity
4
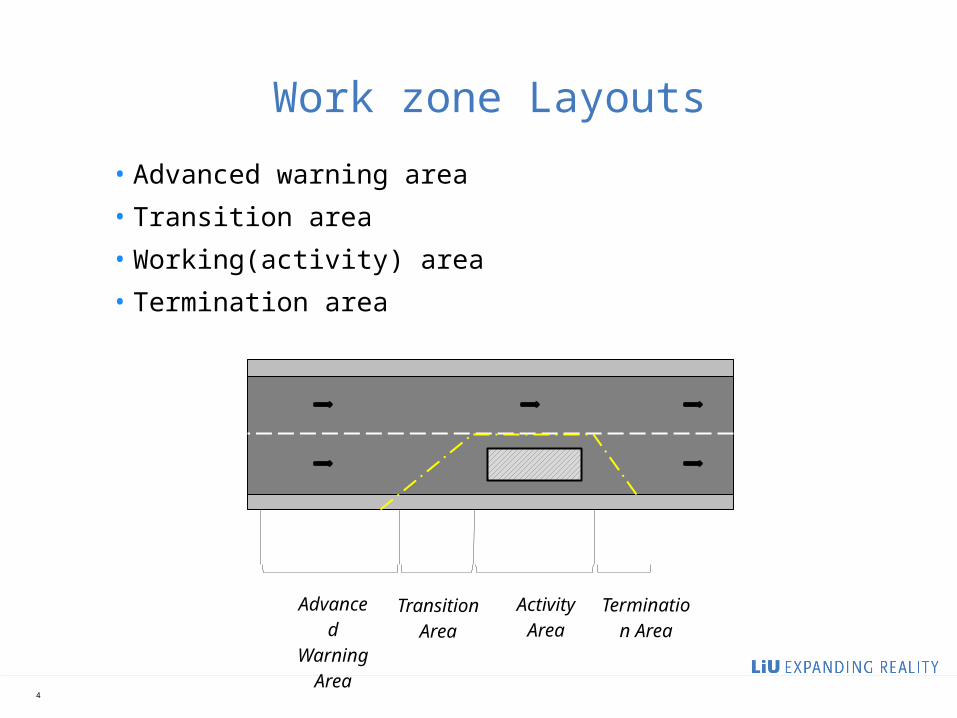
Work zone Layouts
• Advanced warning area
• Transition area
• Working(activity) area
• Termination area
Termination Area
Transition Area
Activity Area
Advanced Warning
Area

5
Work zone impacts
Work zone impacts
safety
mobility
Environ-mental
cost

6
Work zone traffic performance analysis
• Mobility analysis( V/C, LOS, travel time delay)
• Safety analysis
• Delay and cost analysis

7
significant influential factors
• Heavy vehicle percentage
• Number of open and close lanes
• Work intensity
• Position of closed lanes
• Weather conditions
• Lane width
• Ramp distance
• Temporary speed limit
• Work zone length

8
Dynamic Merge Systems
Early Merge
Late Merge
9
Experiment
• Microsimulation – Aimsun
• Late merge metering
• Control through traffic lights

10
Calibration of the model
• Driver reaction time = 0,5s
• Driver reaction time at stop = 0,7s
• Driver reaction time at lights = 0,7s

11
Layout of the work zone
Traffic ligthsOccupancy detectors
20m 100m

12
Assigned flow
0
500
1000
1500
2000
2500
3000
3500
Flow
(veh/h)
Simulation time (min)
15 30 45 60 75
13
Scenarios
• ALINEA metering system
• Fixed cycle times
• Continuous merge metering

14
ALINEA
Traffic ligthsOccupancy detectors
Controler
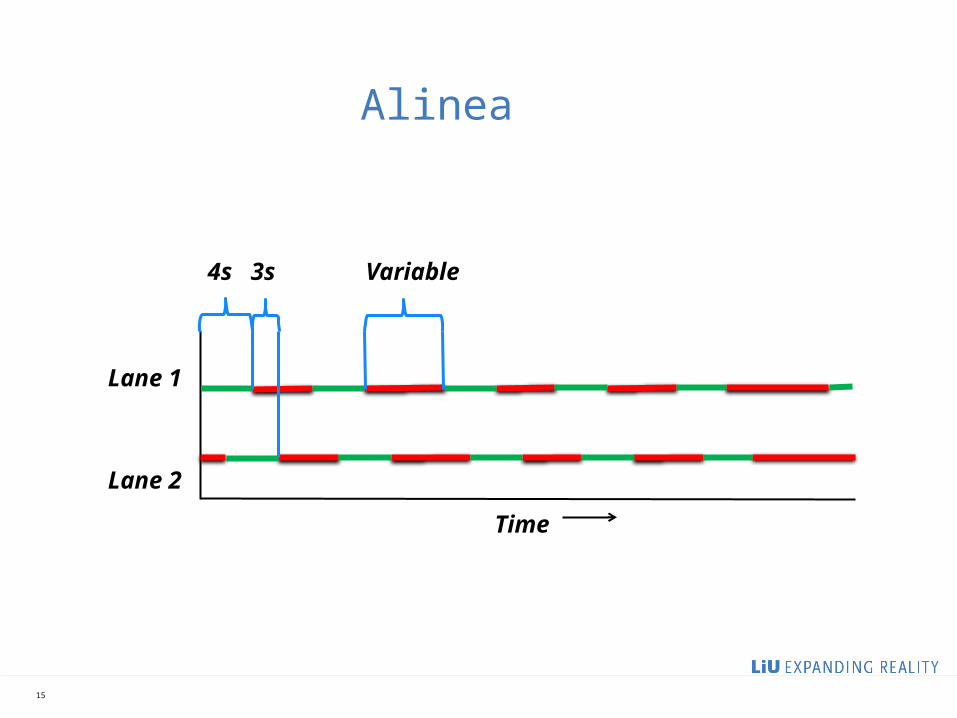
15
Alinea
Lane 1
Lane 2
4s 3s Variable
Time

16
Fixed cycle times
Cycle time (s)
Time
30 30
60 60
Lane 1
Lane 2
Lane 1
Lane 2
60
120
Lane 1
Lane 2
15 15
30

17
Continuous metering
Lane 1
Lane 2
1
Time
1

18
Fixed cycle times
5 15 25 35 45 55 65 75 850
50
100
150
200
250
300
AlineaFixed 120Fixed 60Fixed 30ContinNo control
5 15 25 35 45 55 65 75 85 950
50
100
150
200
250
300
350
Simulation time (min)
Mean Queue Length (veh)
Simulation time (min)
Delay Time per Vehicle (s)

19
Conclusion
• Extensive sensitivity analisys
• Evaluate the effect of lane-changing restrictions
• Calibration and validation of the model

www.liu.se


![WELCOME! [stcatherine.info] ED K-10 classes resume today, January 4th. ... January 4th @ 5:00 pm Mass for Jennifer Furda, ... Pagan idols were often made from ...](https://static.fdocuments.in/doc/165x107/5aab63477f8b9ac55c8bc9cb/welcome-ed-k-10-classes-resume-today-january-4th-january-4th-500-pm.jpg)