Session 127 Panel Discussion, Life and Annuity In … · IV. Spin-off / run-off / exit ......
36
Session 127 PD, Life and Annuity In-Force Management Moderator: David J. Weinsier, FSA, MAAA Presenters: Jennifer L. McGinnis, FSA, CERA, MAAA Brock E. Robbins, FSA, FCIA, MAAA David J. Weinsier, FSA, MAAA
Transcript of Session 127 Panel Discussion, Life and Annuity In … · IV. Spin-off / run-off / exit ......

Session 127 PD, Life and Annuity In-Force Management
Moderator:
David J. Weinsier, FSA, MAAA
Presenters: Jennifer L. McGinnis, FSA, CERA, MAAA
Brock E. Robbins, FSA, FCIA, MAAA David J. Weinsier, FSA, MAAA
Life and Annuity In Force Management2 015 SOA Annual Meeting Session 127 PD
Jennie McGinnis, FSA, MAAA, [email protected]
2015 SOA Annual Meeting | Session 127 | J. McGinnis
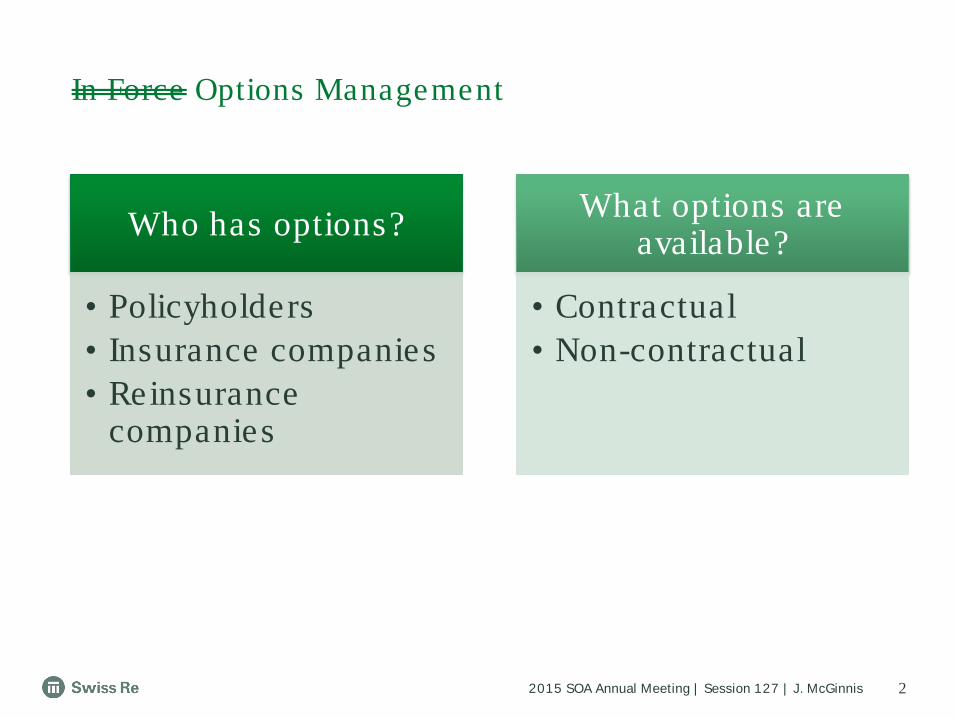
In Force Options Management
2
Who has options?
• Policyholders• Insurance companies• Reinsurance
companies
What options are available?
• Contractual• Non-contractual
2015 SOA Annual Meeting | Session 127 | J. McGinnis
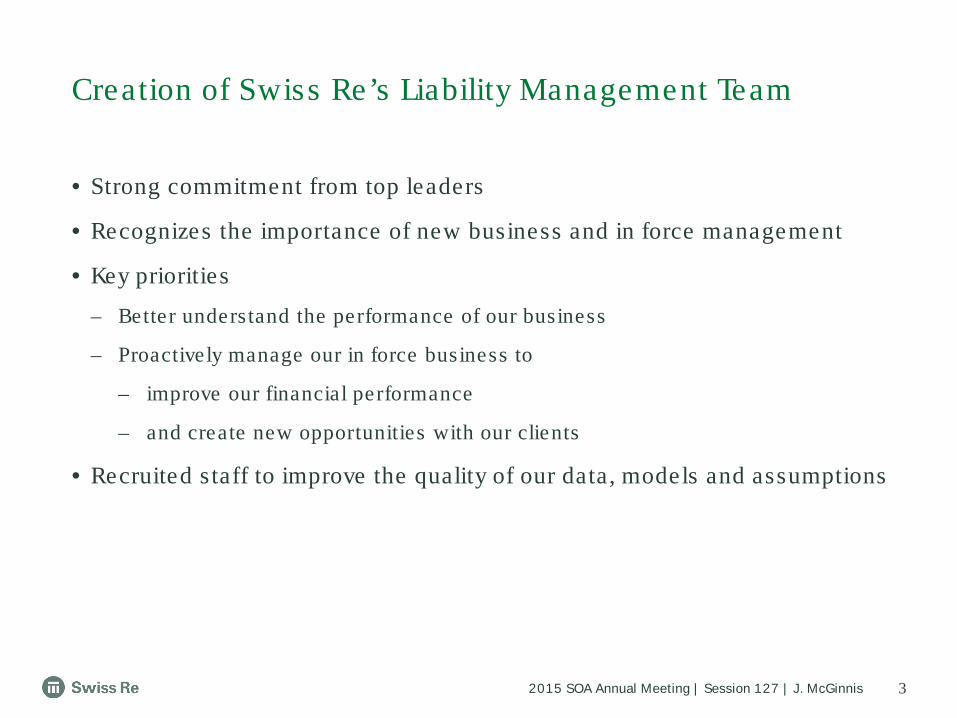
• Strong commitment from top leaders
• Recognizes the importance of new business and in force management
• Key priorities
– Better understand the performance of our business
– Proactively manage our in force business to
– improve our financial performance
– and create new opportunities with our clients
• Recruited s taff to improve the quality of our data, models and assumptions
Creation of Swiss Re’s Liability Management Team
3
2015 SOA Annual Meeting | Session 127 | J. McGinnis
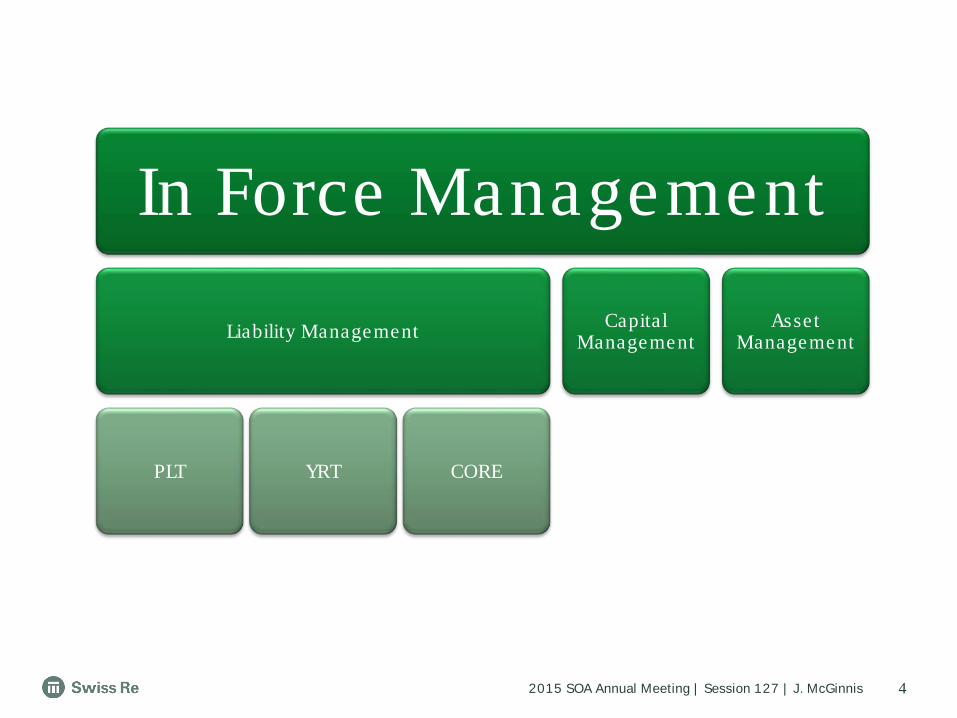
In Force Management
Liability Management
PLT YRT CORE
Capital Management
Asset Management
4
2015 SOA Annual Meeting | Session 127 | J. McGinnis
• The 2 013 SOA survey shows only a few companies vary assumptions by the primary driver – premium jump ratio
• Swiss Re’s experience, affirmed by the SOA survey
– Actively managing PLT business s ince 2 010 , supporting more than 5 0 implementations
– At least 2 5 companies have implemented a PLT management program
– Programs exis t to address in force , new business , or both
– The number of companies interested in evaluating their options is growing
• Considerations for implementation
– Cross functional teams
– Resource allocation
– Communication
Post Level Term (PLT) Management
5
2015 SOA Annual Meeting | Session 127 | J. McGinnis
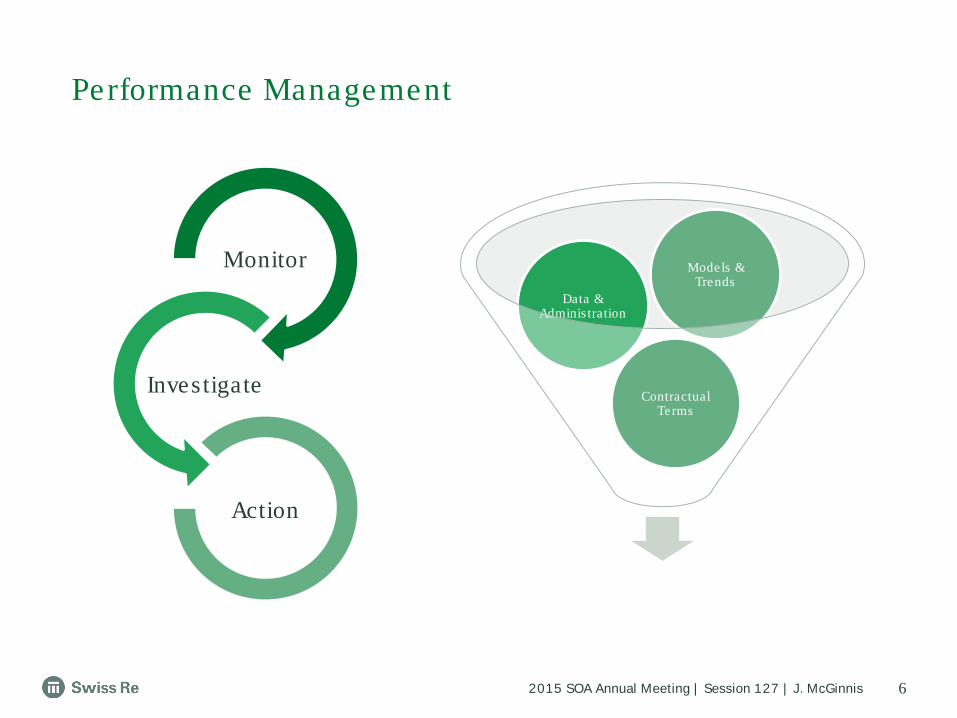
Performance Management
6
Monitor
Investigate
Action
Contractual Terms
Data & Adminis tration
Models & Trends
2015 SOA Annual Meeting | Session 127 | J. McGinnis
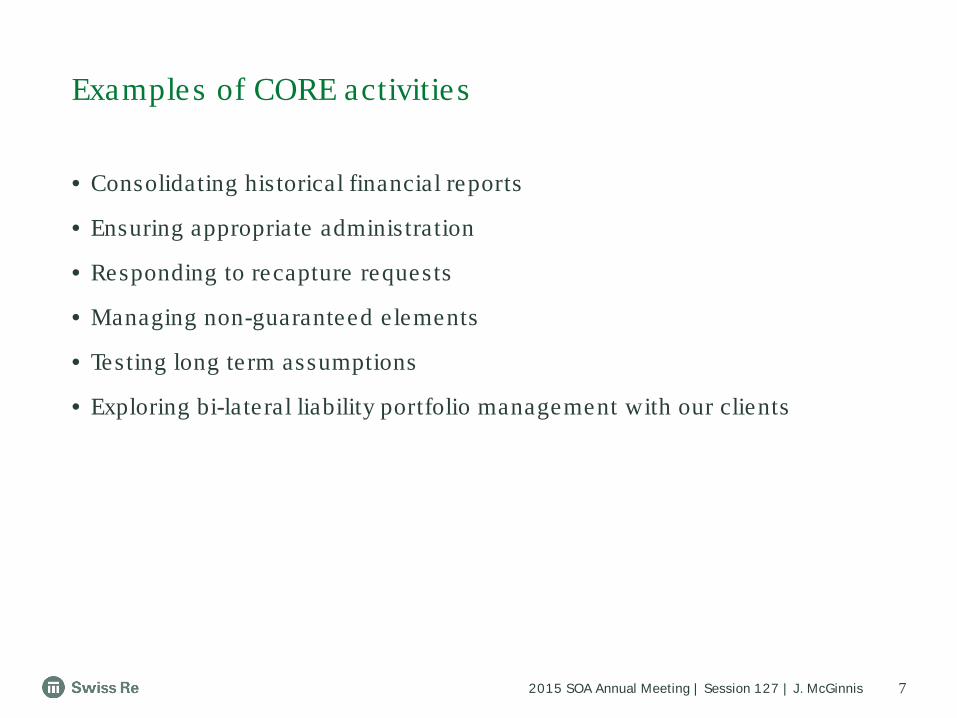
• Consolidating his torical financial reports
• Ensuring appropriate administration
• Responding to recapture requests
• Managing non-guaranteed e lements
• Testing long term assumptions
• Exploring bi-lateral liability portfolio management with our clients
Examples of CORE activities
7
2015 SOA Annual Meeting | Session 127 | J. McGinnis
Legal notice
8
©2015 Swiss Re. All rights reserved. You are not permitted to create any modifications or derivative works of this presentation or to use it for commercial or other public purposes without the prior written permission of Swiss Re.
The information and opinions contained in the presentation are provided as at the date of the presentation and are subject to change without notice. Although the information used was taken from reliable sources, Swiss Re does not accept any responsibility for the accuracy or comprehensiveness of the details given. All liability for the accuracy and completeness thereof or for any damage or loss resulting from the use of the information contained in this presentation is expressly excluded. Under no circumstances shall Swiss Re or its Group companies be liable for any financial or consequential loss relating to this presentation.

© Oliver Wyman
Life and Annuity Inforce Management
October 13, 2015
David J. Weinsier, FSA, MAAA
Session 127 PD2015 SOA Annual Meeting
1© Oliver Wyman 1
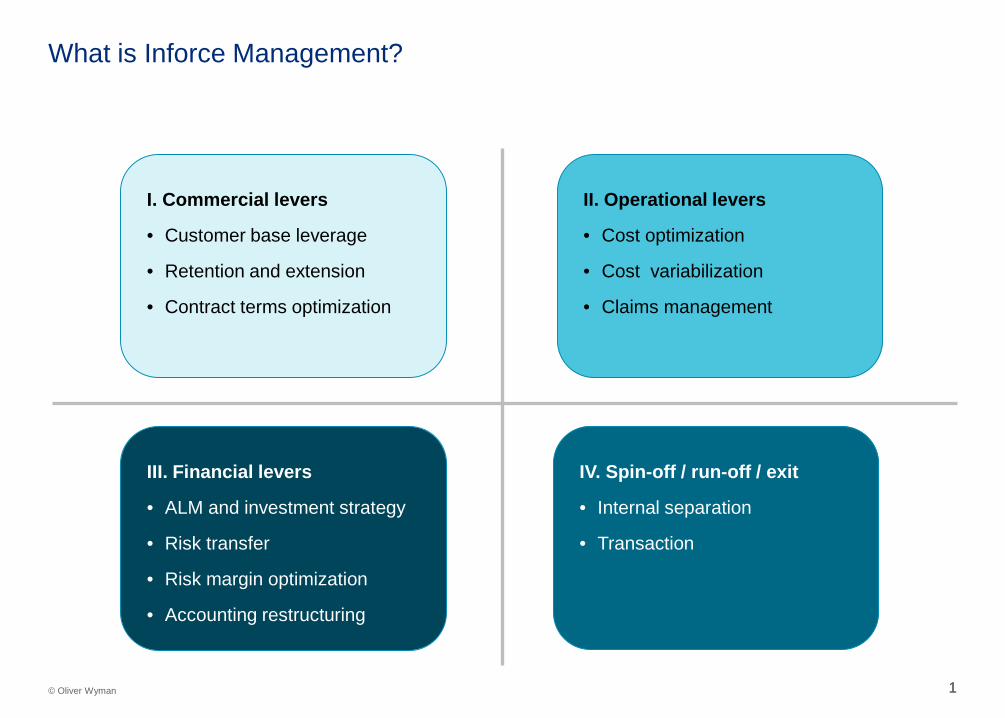
What is Inforce Management?
IV. Spin-off / run-off / exit
• Internal separation
• Transaction
I. Commercial levers
• Customer base leverage
• Retention and extension
• Contract terms optimization
II. Operational levers
• Cost optimization
• Cost variabilization
• Claims management
III. Financial levers
• ALM and investment strategy
• Risk transfer
• Risk margin optimization
• Accounting restructuring
22© Oliver Wyman
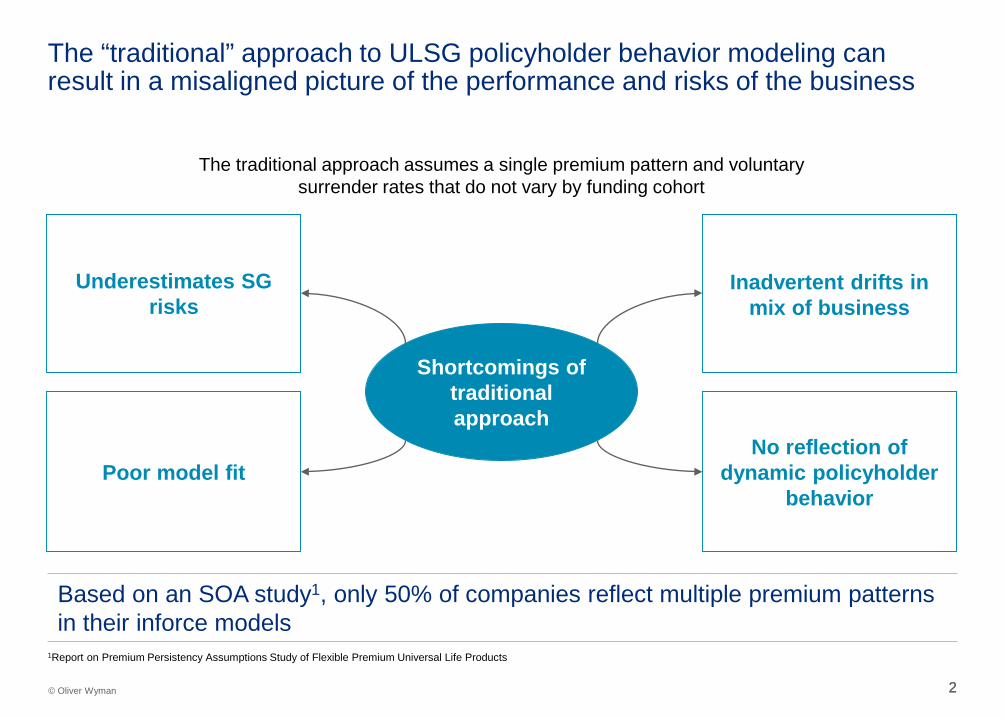
Underestimates SG risks
Inadvertent drifts in mix of business
Poor model fitNo reflection of
dynamic policyholder behavior
Shortcomings oftraditional approach
Based on an SOA study1, only 50% of companies reflect multiple premium patterns in their inforce models
The “traditional” approach to ULSG policyholder behavior modeling can result in a misaligned picture of the performance and risks of the business
1Report on Premium Persistency Assumptions Study of Flexible Premium Universal Life Products
The traditional approach assumes a single premium pattern and voluntary surrender rates that do not vary by funding cohort
3© Oliver Wyman 3
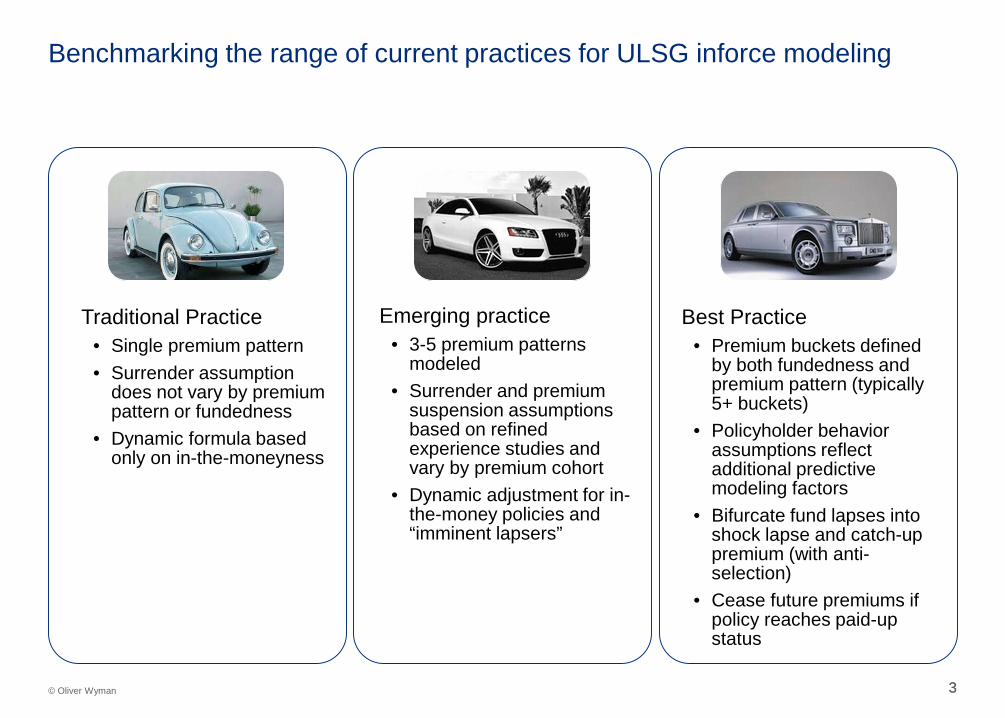
Benchmarking the range of current practices for ULSG inforce modeling
Traditional Practice• Single premium pattern• Surrender assumption
does not vary by premium pattern or fundedness
• Dynamic formula based only on in-the-moneyness
Emerging practice• 3-5 premium patterns
modeled• Surrender and premium
suspension assumptions based on refined experience studies and vary by premium cohort
• Dynamic adjustment for in-the-money policies and “imminent lapsers”
Best Practice• Premium buckets defined
by both fundedness and premium pattern (typically 5+ buckets)
• Policyholder behavior assumptions reflect additional predictive modeling factors
• Bifurcate fund lapses into shock lapse and catch-up premium (with anti-selection)
• Cease future premiums if policy reaches paid-up status
4© Oliver Wyman 4
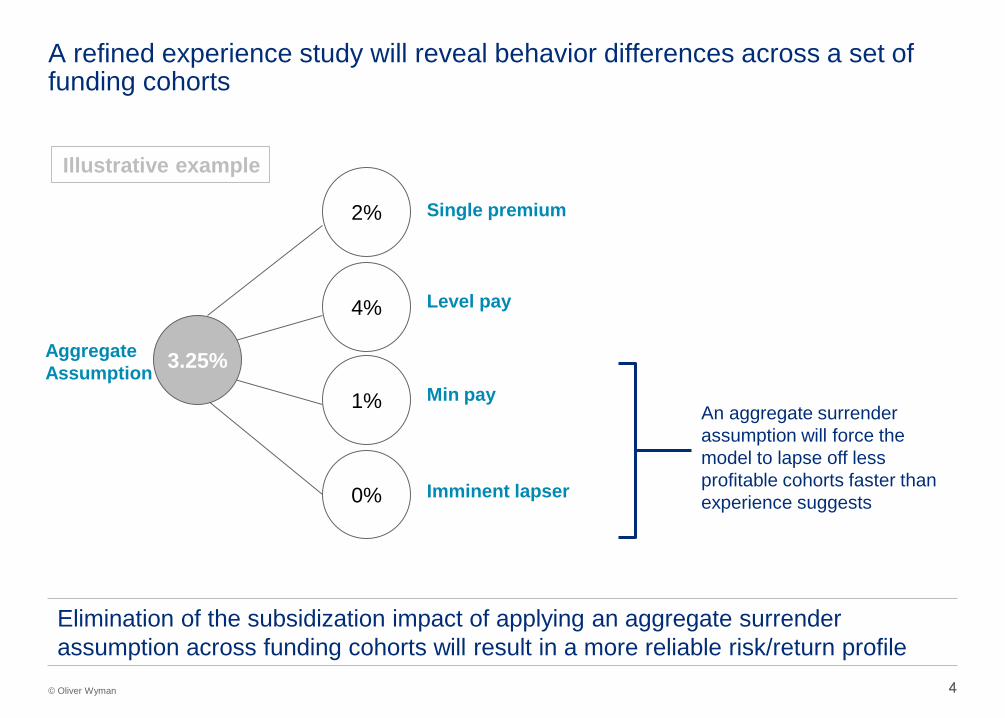
A refined experience study will reveal behavior differences across a set of funding cohorts
0%
1%
4%
2%
3.25%
Single premium
Level pay
Min pay
Imminent lapser
AggregateAssumption
An aggregate surrender assumption will force the model to lapse off less profitable cohorts faster than experience suggests
Elimination of the subsidization impact of applying an aggregate surrender assumption across funding cohorts will result in a more reliable risk/return profile
Illustrative example
55© Oliver Wyman
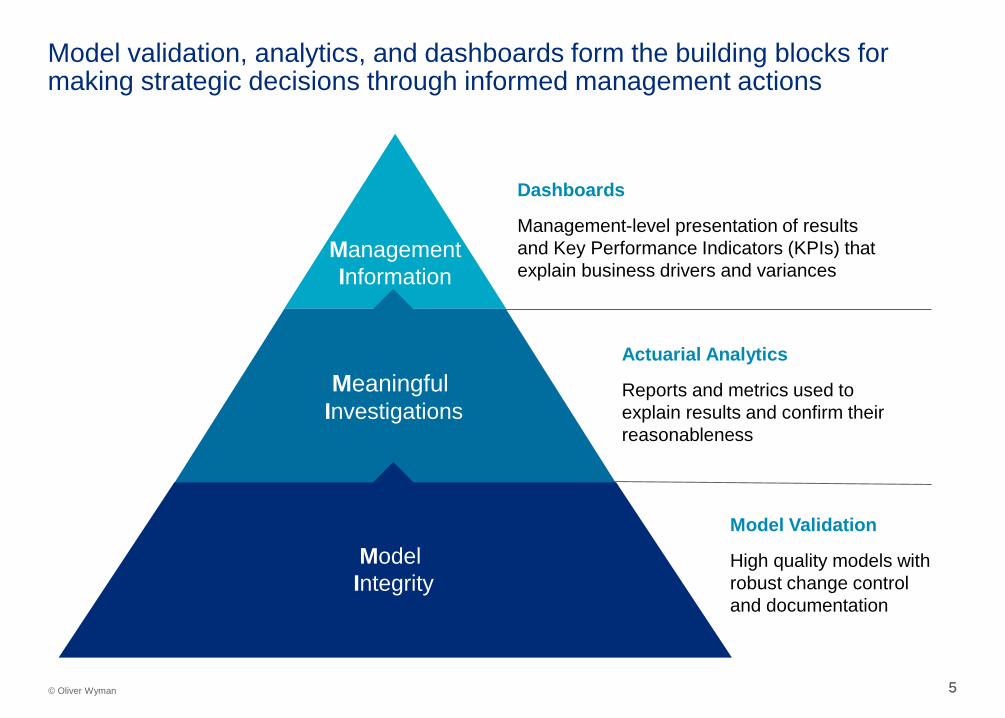
Model validation, analytics, and dashboards form the building blocks for making strategic decisions through informed management actions
Dashboards
Management-level presentation of results and Key Performance Indicators (KPIs) that explain business drivers and variances
Actuarial Analytics
Reports and metrics used to explain results and confirm their reasonableness
Model Validation
High quality models with robust change control and documentation
ManagementInformation
Meaningful Investigations
Model Integrity
66© Oliver Wyman
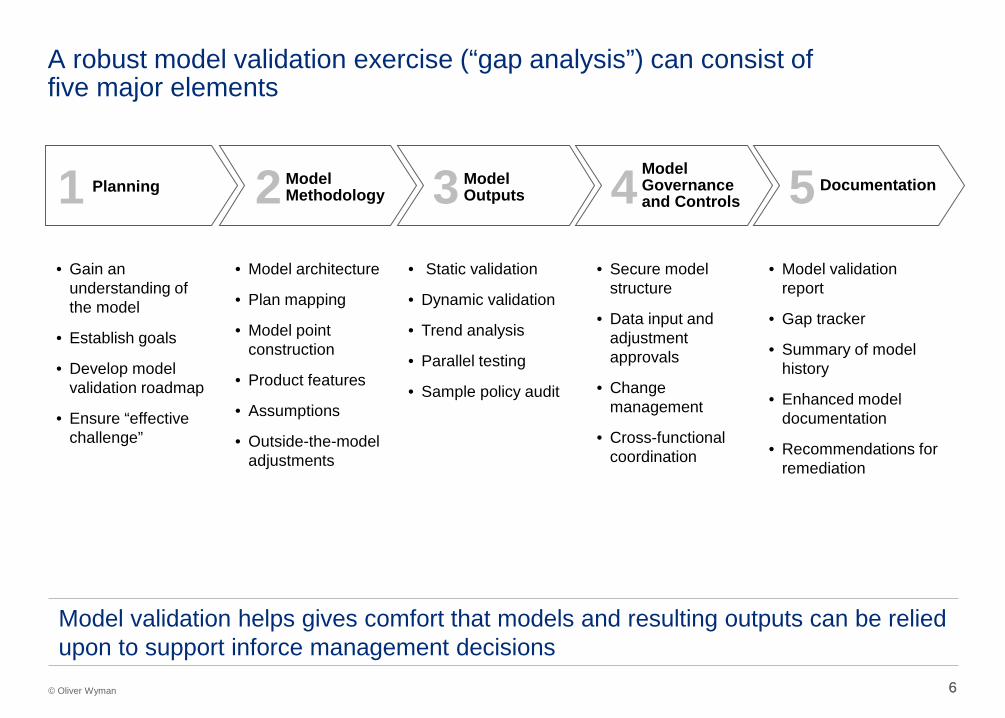
A robust model validation exercise (“gap analysis”) can consist offive major elements
Planning1 Model Methodology2 Model
Outputs3 Model Governance and Controls4 Documentation5
• Gain an understanding of the model
• Establish goals
• Develop model validation roadmap
• Ensure “effective challenge”
• Model architecture
• Plan mapping
• Model point construction
• Product features
• Assumptions
• Outside-the-model adjustments
• Static validation
• Dynamic validation
• Trend analysis
• Parallel testing
• Sample policy audit
• Secure model structure
• Data input and adjustment approvals
• Change management
• Cross-functional coordination
• Model validation report
• Gap tracker
• Summary of model history
• Enhanced model documentation
• Recommendations for remediation
Model validation helps gives comfort that models and resulting outputs can be relied upon to support inforce management decisions
77© Oliver Wyman
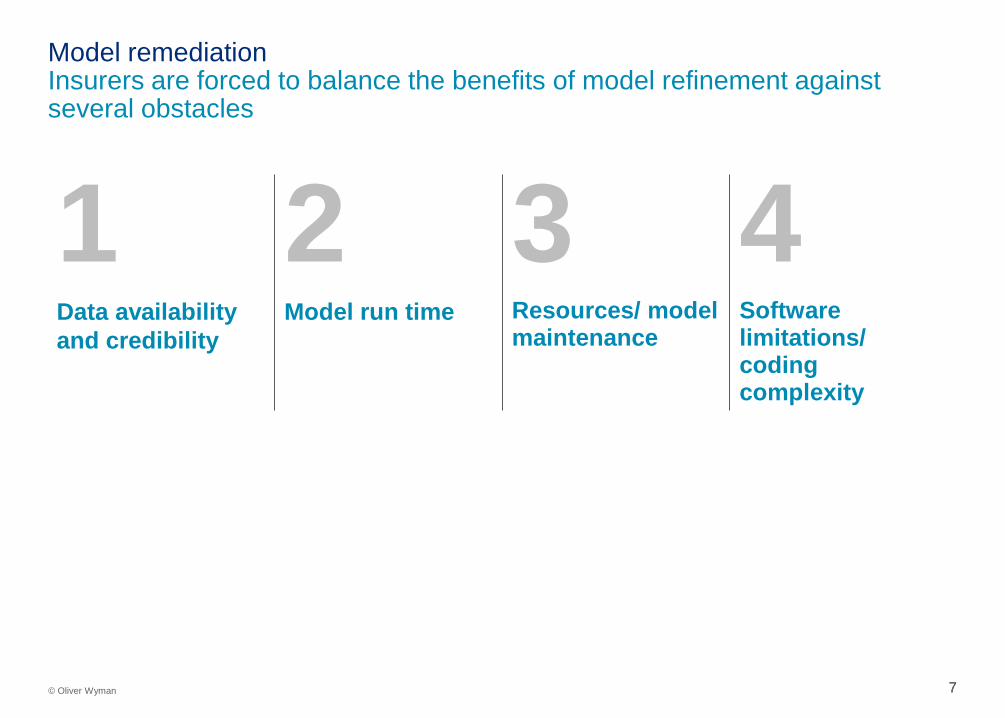
Model remediationInsurers are forced to balance the benefits of model refinement against several obstacles
1 2 3 4Data availability and credibility
Model run time Resources/ model maintenance
Software limitations/ coding complexity
SOA 2015 Annual Meeting & Exhibit
Session 127 PD: Life and Annuity Inforce Management
Brock Robbins, FSA, MAAAOctober 13, 2015
Inforce Management
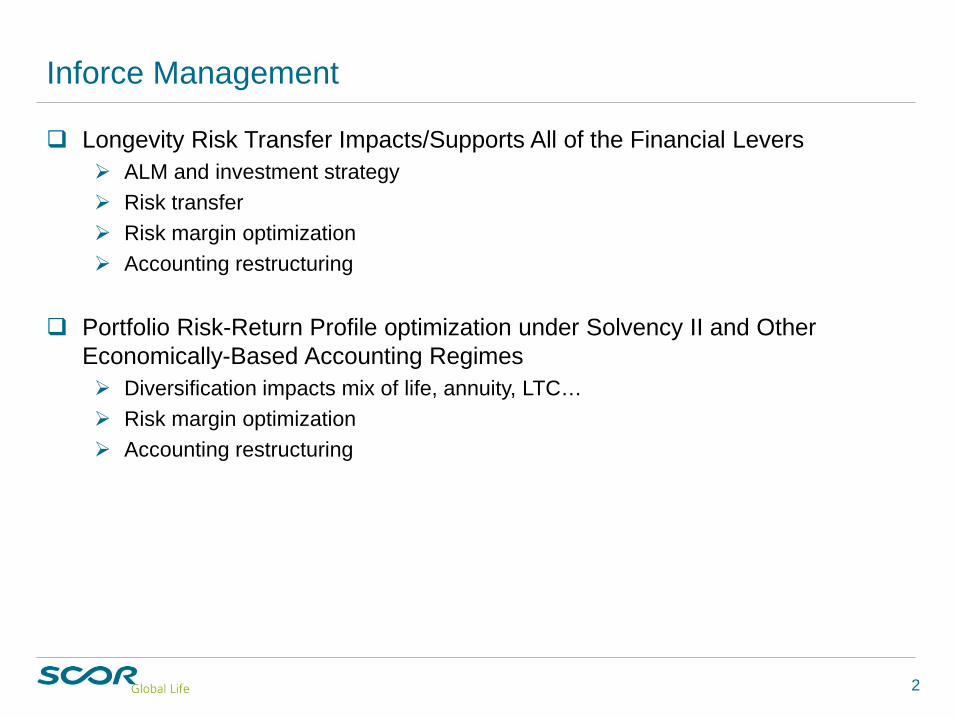
Longevity Risk Transfer Impacts/Supports All of the Financial Levers ALM and investment strategy Risk transfer Risk margin optimization Accounting restructuring
Portfolio Risk-Return Profile optimization under Solvency II and Other Economically-Based Accounting Regimes Diversification impacts mix of life, annuity, LTC… Risk margin optimization Accounting restructuring
2
3
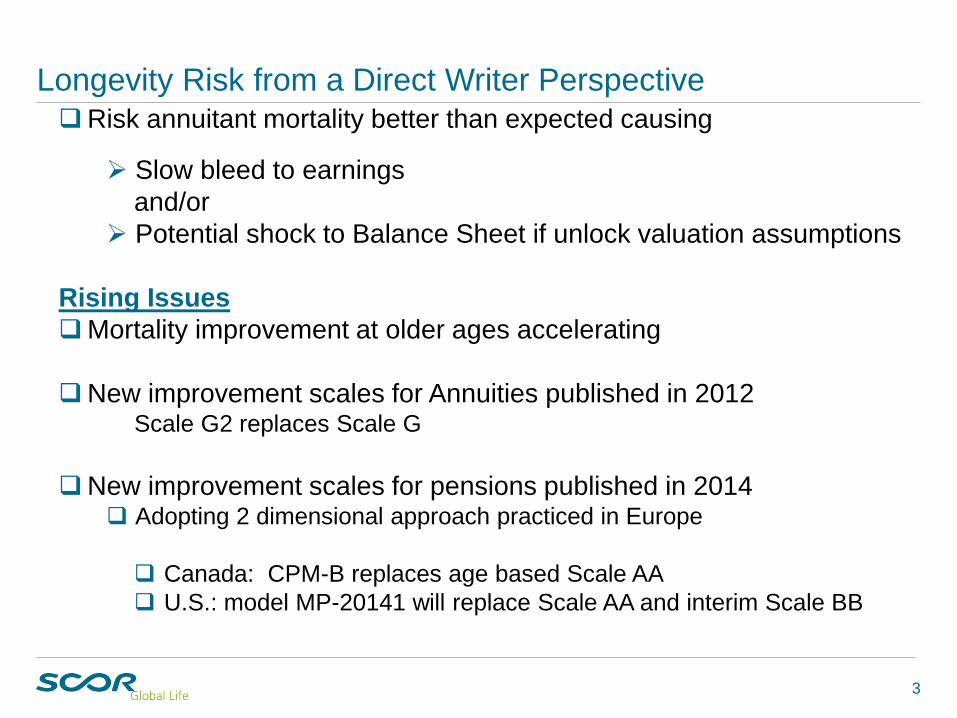
Longevity Risk from a Direct Writer PerspectiveRisk annuitant mortality better than expected causing
Slow bleed to earningsand/or
Potential shock to Balance Sheet if unlock valuation assumptions
Rising IssuesMortality improvement at older ages accelerating
New improvement scales for Annuities published in 2012Scale G2 replaces Scale G
New improvement scales for pensions published in 2014 Adopting 2 dimensional approach practiced in Europe
Canada: CPM-B replaces age based Scale AA U.S.: model MP-20141 will replace Scale AA and interim Scale BB
4
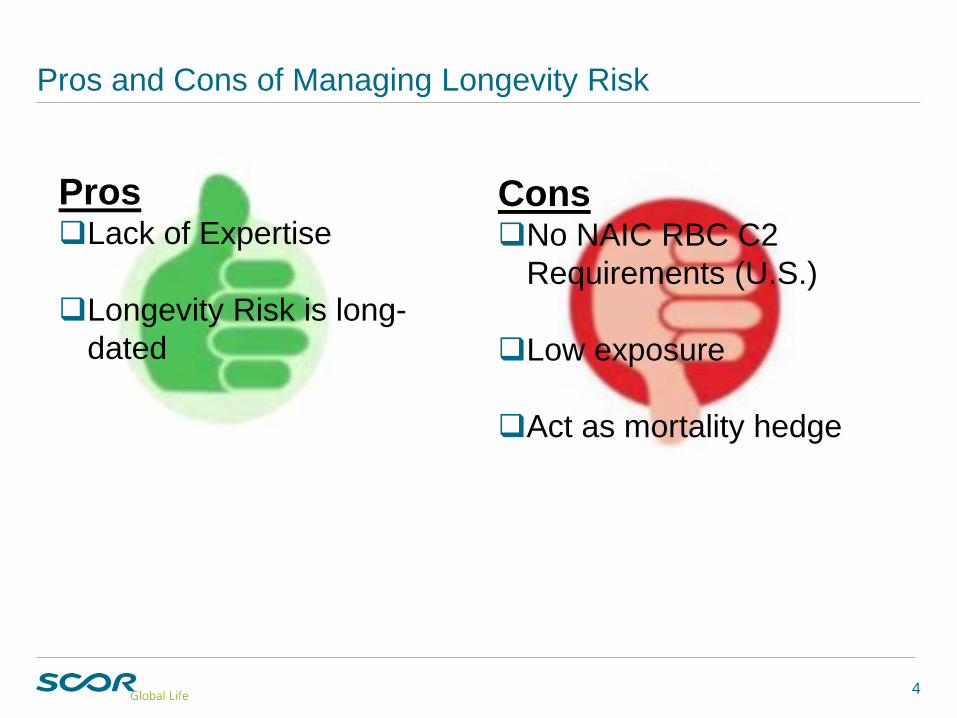
Pros and Cons of Managing Longevity Risk
ConsNo NAIC RBC C2
Requirements (U.S.)
Low exposure
Act as mortality hedge
ProsLack of Expertise
Longevity Risk is long-dated
5
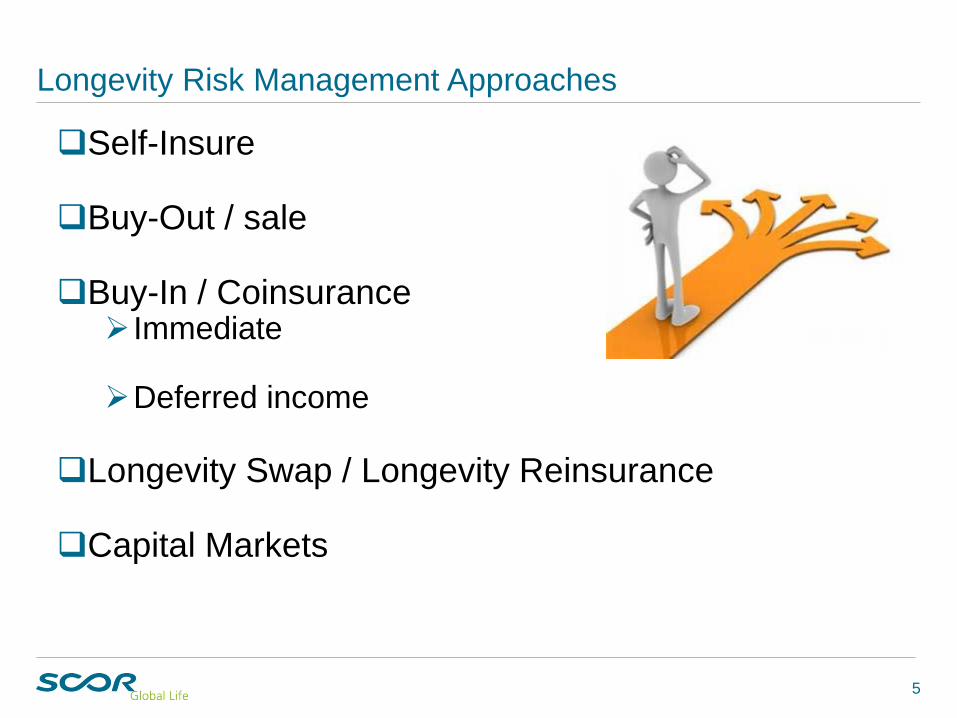
Longevity Risk Management Approaches
Self-Insure
Buy-Out / sale
Buy-In / Coinsurance Immediate
Deferred income
Longevity Swap / Longevity Reinsurance
Capital Markets
6
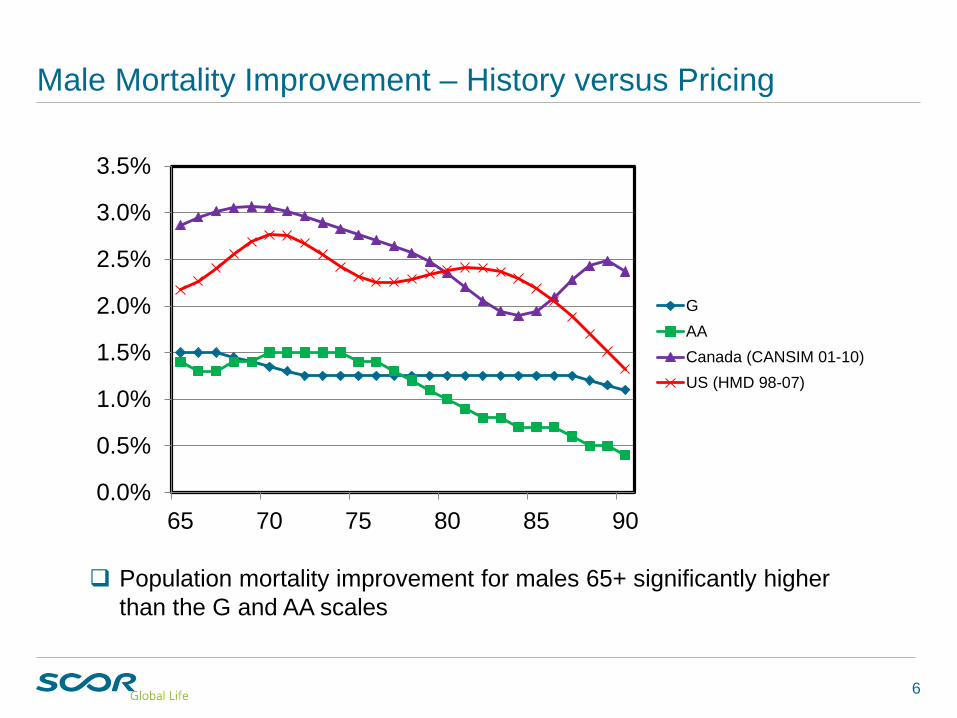
Male Mortality Improvement – History versus Pricing
0.0%
0.5%
1.0%
1.5%
2.0%
2.5%
3.0%
3.5%
65 70 75 80 85 90
GAACanada (CANSIM 01-10)US (HMD 98-07)
Population mortality improvement for males 65+ significantly higher than the G and AA scales
7
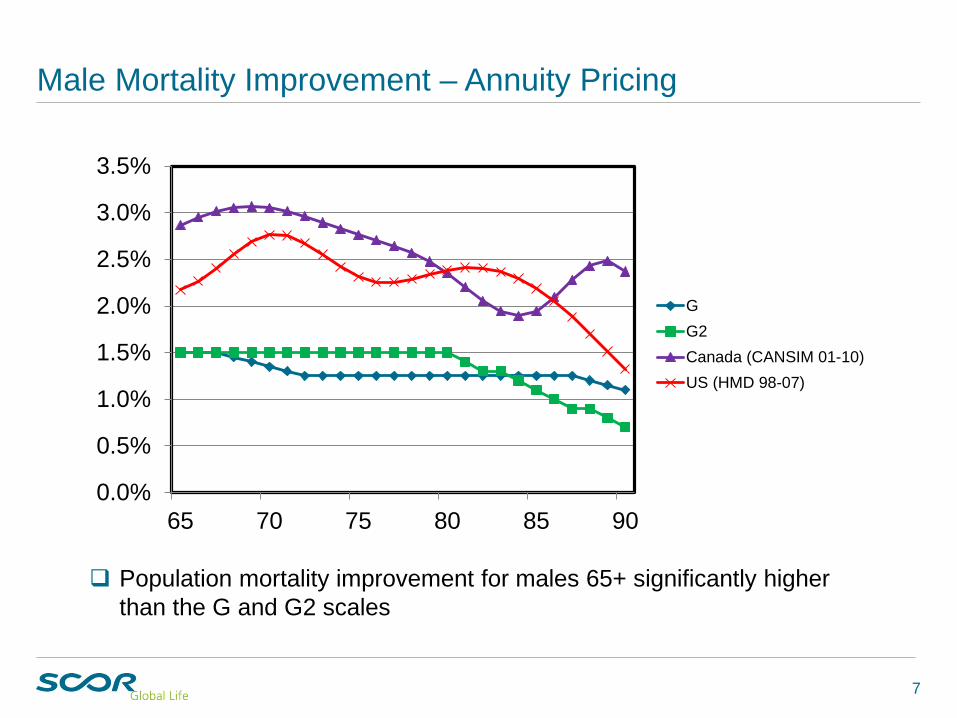
Male Mortality Improvement – Annuity Pricing
0.0%
0.5%
1.0%
1.5%
2.0%
2.5%
3.0%
3.5%
65 70 75 80 85 90
GG2Canada (CANSIM 01-10)US (HMD 98-07)
Population mortality improvement for males 65+ significantly higher than the G and G2 scales
8
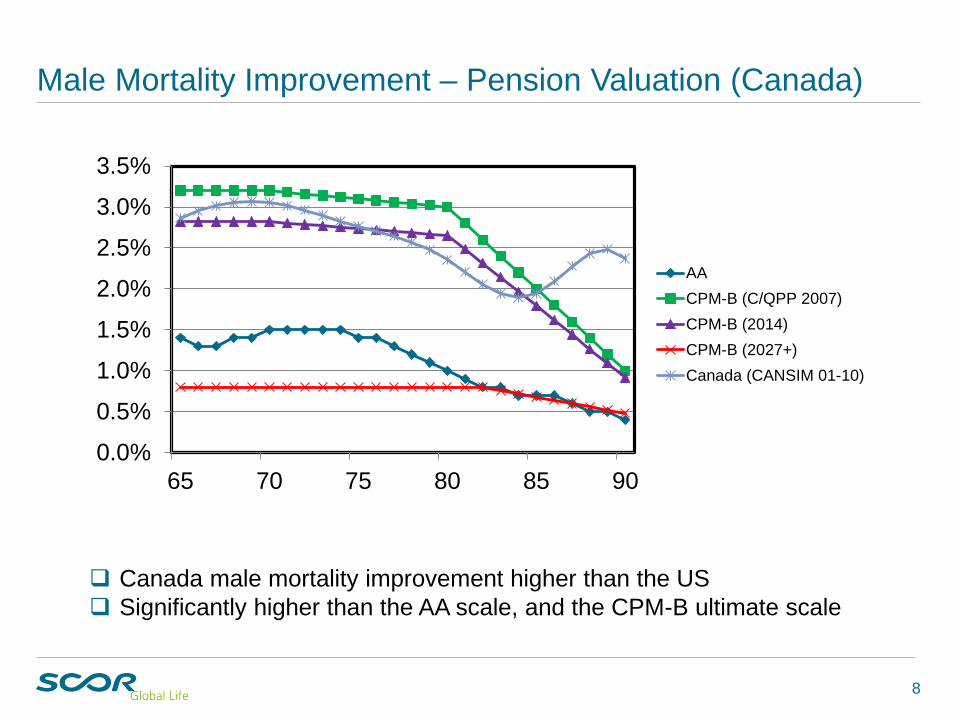
Male Mortality Improvement – Pension Valuation (Canada)
0.0%
0.5%
1.0%
1.5%
2.0%
2.5%
3.0%
3.5%
65 70 75 80 85 90
AACPM-B (C/QPP 2007)CPM-B (2014)CPM-B (2027+)Canada (CANSIM 01-10)
Canada male mortality improvement higher than the US Significantly higher than the AA scale, and the CPM-B ultimate scale
9
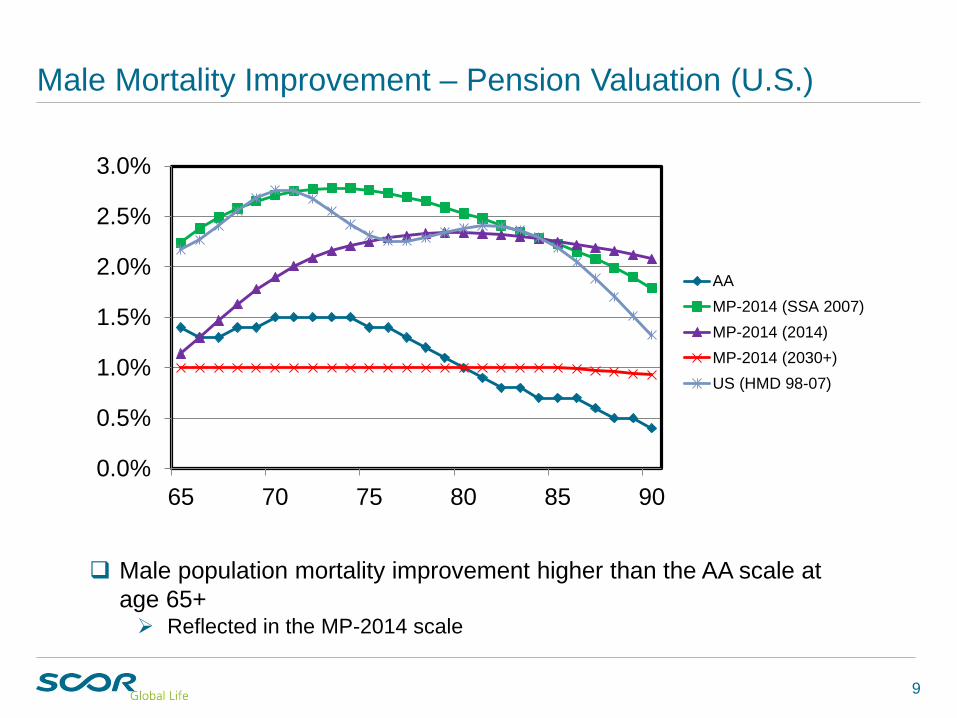
Male Mortality Improvement – Pension Valuation (U.S.)
0.0%
0.5%
1.0%
1.5%
2.0%
2.5%
3.0%
65 70 75 80 85 90
AAMP-2014 (SSA 2007)MP-2014 (2014)MP-2014 (2030+)US (HMD 98-07)
Male population mortality improvement higher than the AA scale at age 65+ Reflected in the MP-2014 scale
10
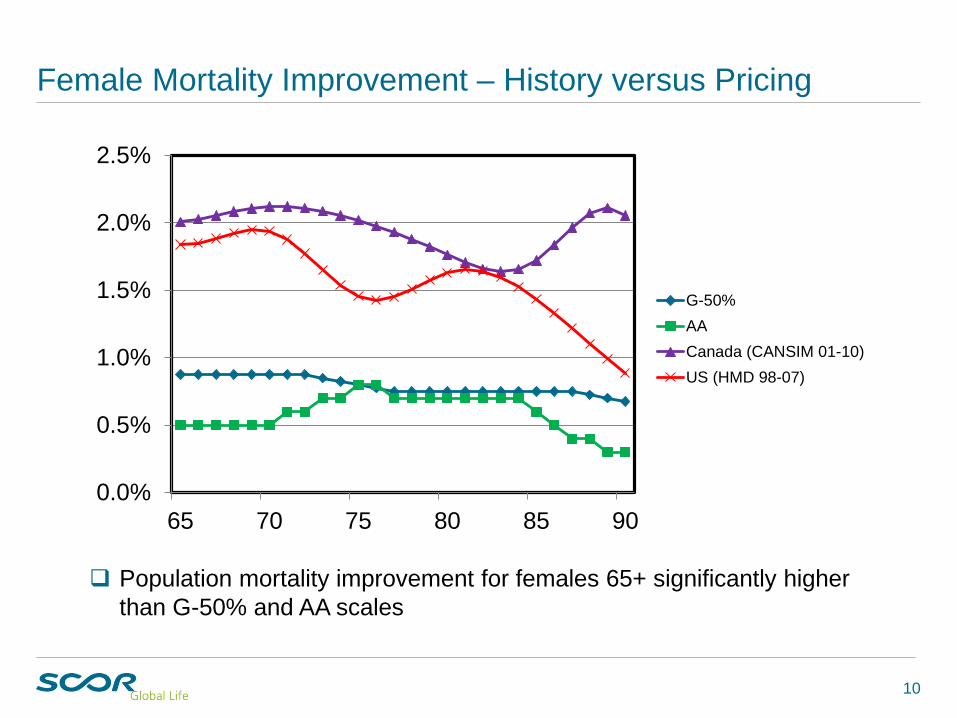
Female Mortality Improvement – History versus Pricing
0.0%
0.5%
1.0%
1.5%
2.0%
2.5%
65 70 75 80 85 90
G-50%AACanada (CANSIM 01-10)US (HMD 98-07)
Population mortality improvement for females 65+ significantly higher than G-50% and AA scales
11
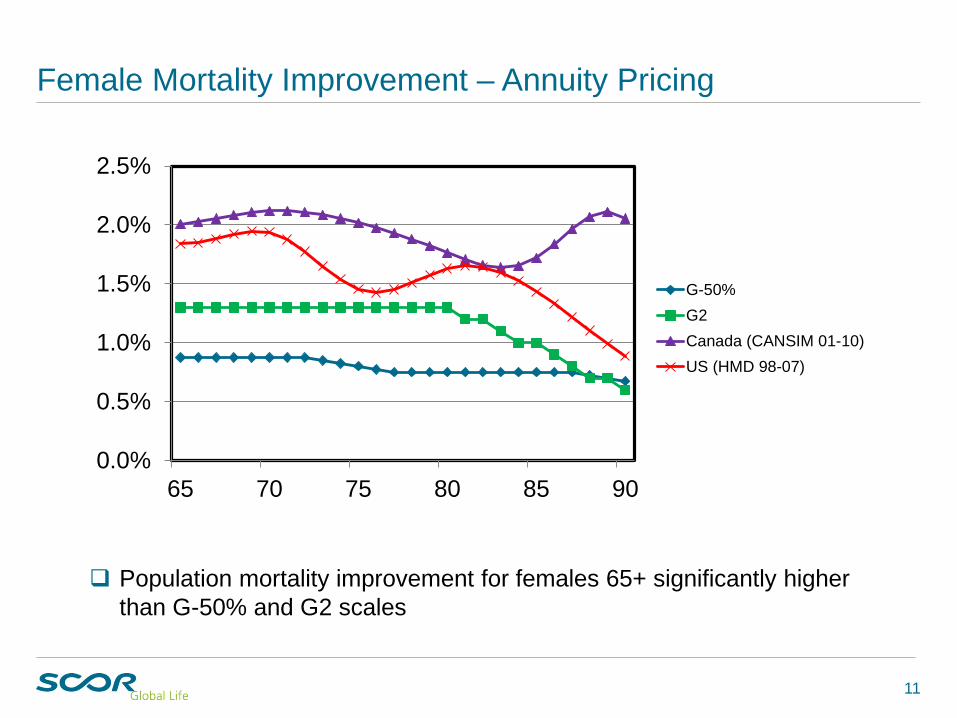
Female Mortality Improvement – Annuity Pricing
0.0%
0.5%
1.0%
1.5%
2.0%
2.5%
65 70 75 80 85 90
G-50%G2Canada (CANSIM 01-10)US (HMD 98-07)
Population mortality improvement for females 65+ significantly higher than G-50% and G2 scales
12
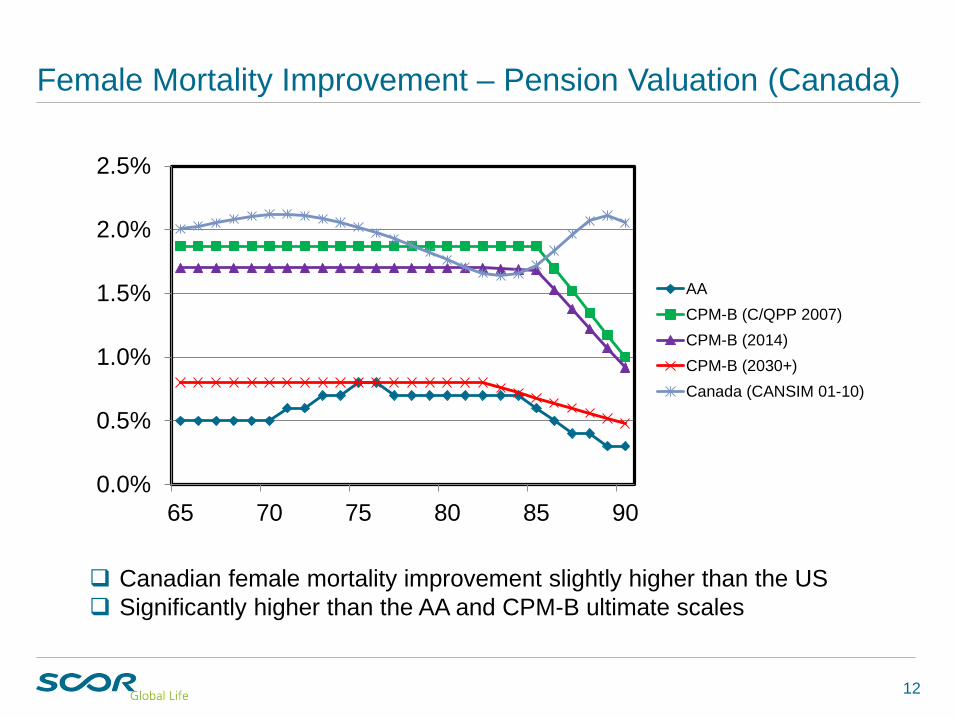
Female Mortality Improvement – Pension Valuation (Canada)
0.0%
0.5%
1.0%
1.5%
2.0%
2.5%
65 70 75 80 85 90
AACPM-B (C/QPP 2007)CPM-B (2014)CPM-B (2030+)Canada (CANSIM 01-10)
Canadian female mortality improvement slightly higher than the US Significantly higher than the AA and CPM-B ultimate scales
13
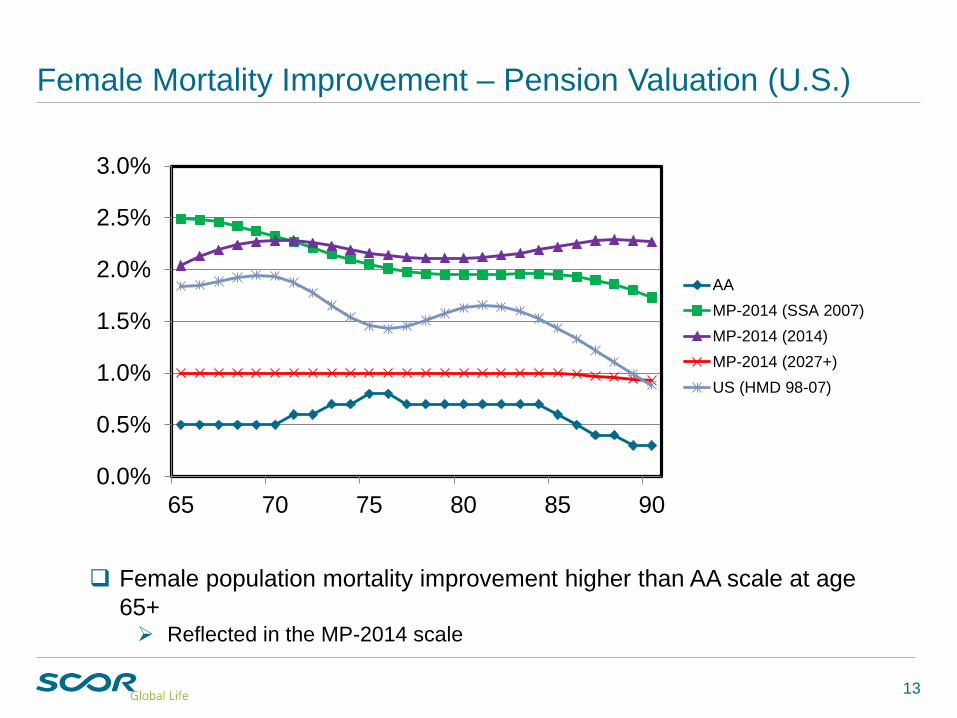
Female Mortality Improvement – Pension Valuation (U.S.)
0.0%
0.5%
1.0%
1.5%
2.0%
2.5%
3.0%
65 70 75 80 85 90
AAMP-2014 (SSA 2007)MP-2014 (2014)MP-2014 (2027+)US (HMD 98-07)
Female population mortality improvement higher than AA scale at age 65+ Reflected in the MP-2014 scale
14
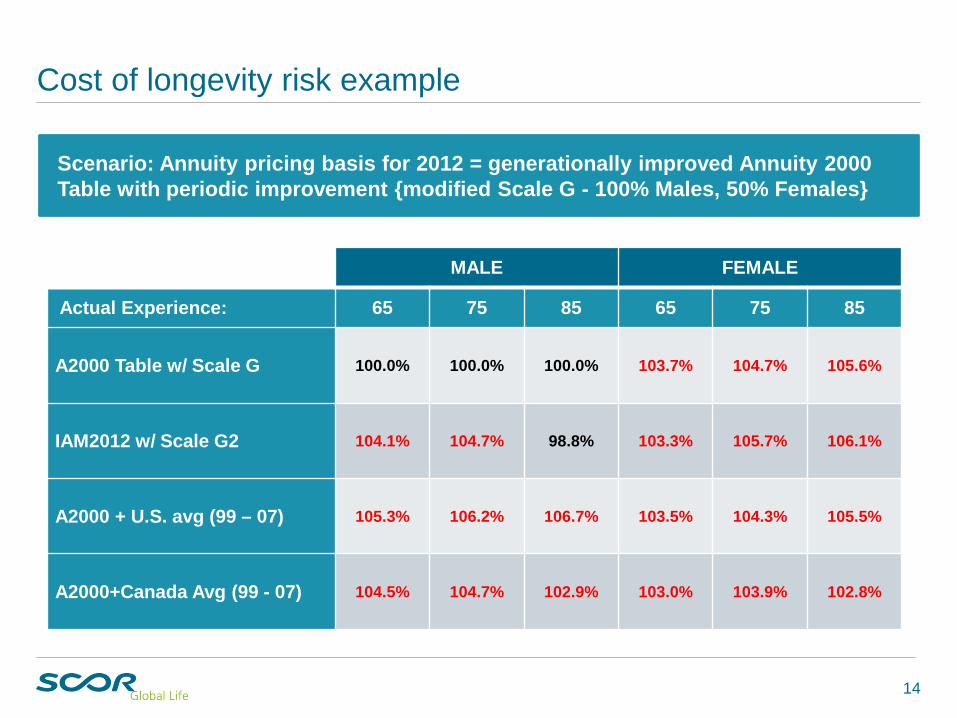
Cost of longevity risk example
Scenario: Annuity pricing basis for 2012 = generationally improved Annuity 2000 Table with periodic improvement {modified Scale G - 100% Males, 50% Females}
MALE FEMALE
Actual Experience: 65 75 85 65 75 85
A2000 Table w/ Scale G 100.0% 100.0% 100.0% 103.7% 104.7% 105.6%
IAM2012 w/ Scale G2 104.1% 104.7% 98.8% 103.3% 105.7% 106.1%
A2000 + U.S. avg (99 – 07) 105.3% 106.2% 106.7% 103.5% 104.3% 105.5%
A2000+Canada Avg (99 - 07) 104.5% 104.7% 102.9% 103.0% 103.9% 102.8%
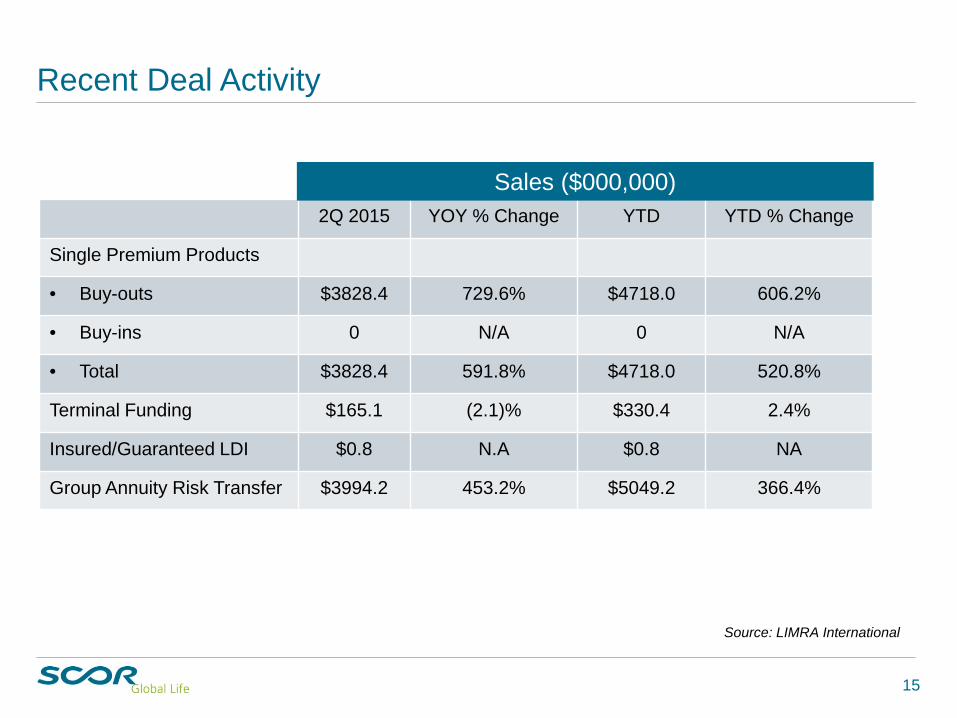
2Q 2015 YOY % Change YTD YTD % Change
Single Premium Products
• Buy-outs $3828.4 729.6% $4718.0 606.2%
• Buy-ins 0 N/A 0 N/A
• Total $3828.4 591.8% $4718.0 520.8%
Terminal Funding $165.1 (2.1)% $330.4 2.4%
Insured/Guaranteed LDI $0.8 N.A $0.8 NA
Group Annuity Risk Transfer $3994.2 453.2% $5049.2 366.4%
Recent Deal Activity
Sales ($000,000)
Source: LIMRA International
15
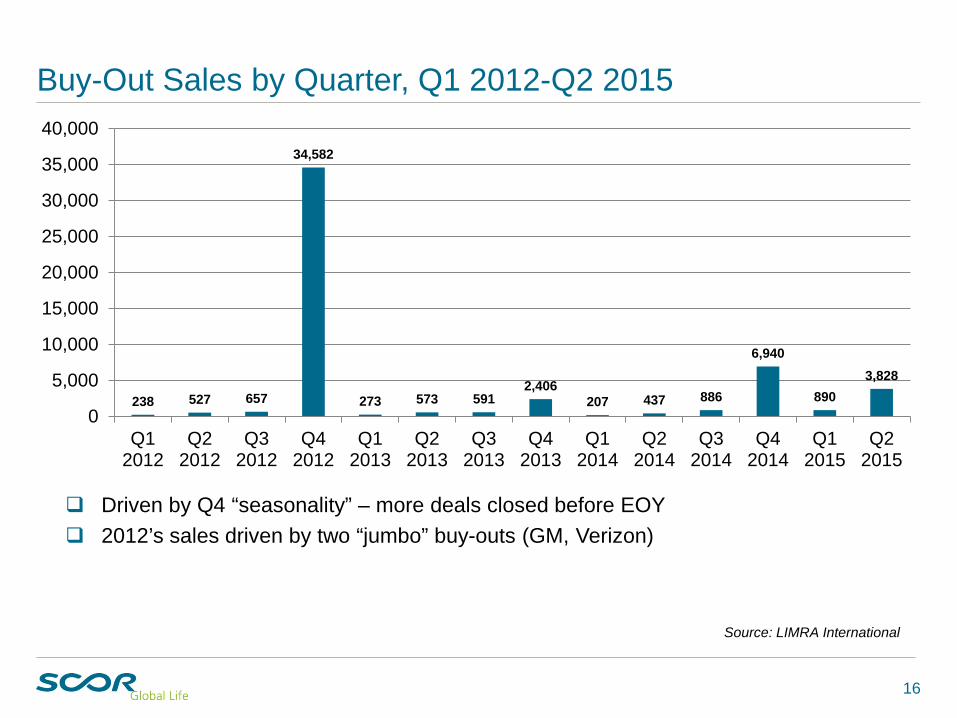
16
Buy-Out Sales by Quarter, Q1 2012-Q2 2015
238 527 657
34,582
273 573 5912,406
207 437 886
6,940
8903,828
0
5,000
10,000
15,000
20,000
25,000
30,000
35,000
40,000
Q12012
Q22012
Q32012
Q42012
Q12013
Q22013
Q32013
Q42013
Q12014
Q22014
Q32014
Q42014
Q12015
Q22015
Driven by Q4 “seasonality” – more deals closed before EOY 2012’s sales driven by two “jumbo” buy-outs (GM, Verizon)
Source: LIMRA International
17
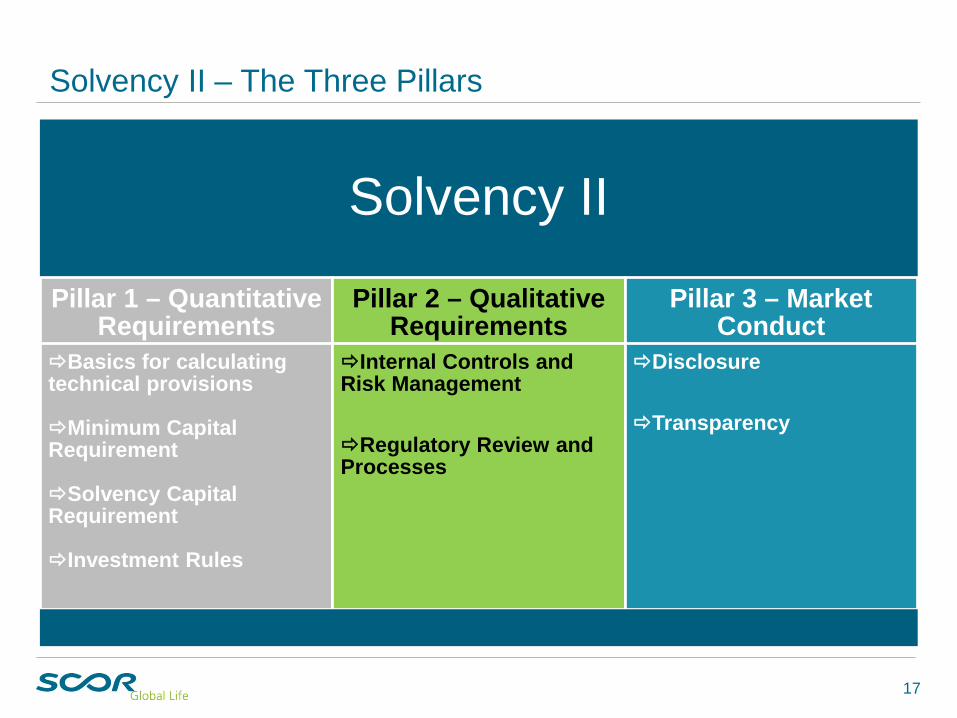
Solvency II – The Three Pillars
Solvency II
Pillar 1 – Quantitative Requirements
Basics for calculating technical provisions
Minimum Capital Requirement
Solvency Capital Requirement
Investment Rules
Pillar 2 – Qualitative Requirements
Internal Controls and Risk Management
Regulatory Review and Processes
Pillar 3 – Market Conduct
Disclosure
Transparency
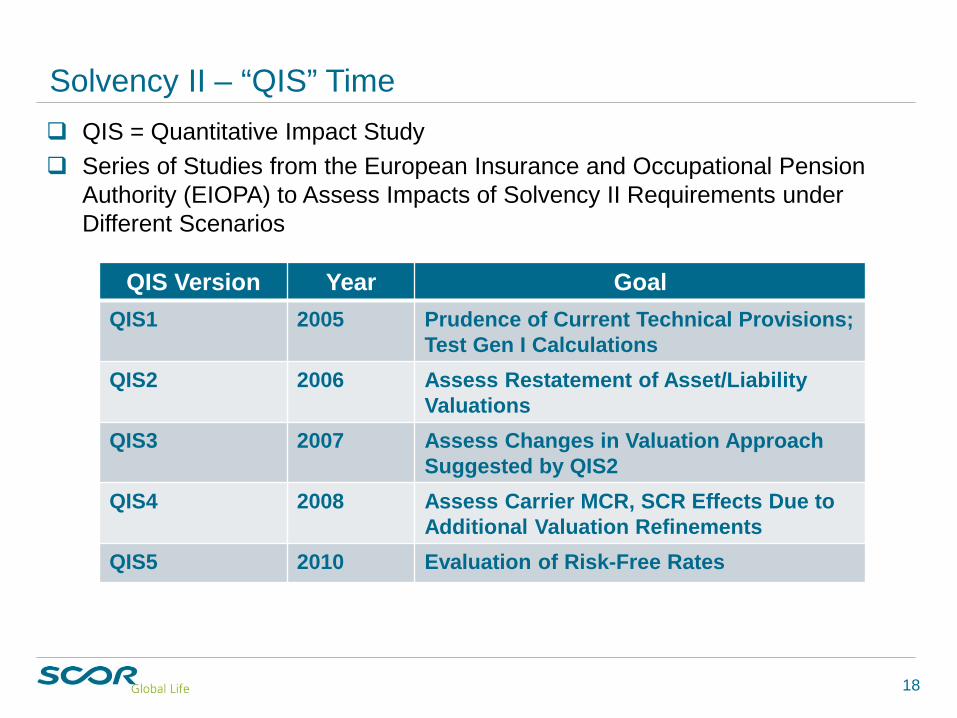
Solvency II – “QIS” Time QIS = Quantitative Impact Study Series of Studies from the European Insurance and Occupational Pension
Authority (EIOPA) to Assess Impacts of Solvency II Requirements under Different Scenarios
QIS Version Year GoalQIS1 2005 Prudence of Current Technical Provisions;
Test Gen I CalculationsQIS2 2006 Assess Restatement of Asset/Liability
ValuationsQIS3 2007 Assess Changes in Valuation Approach
Suggested by QIS2QIS4 2008 Assess Carrier MCR, SCR Effects Due to
Additional Valuation RefinementsQIS5 2010 Evaluation of Risk-Free Rates
18
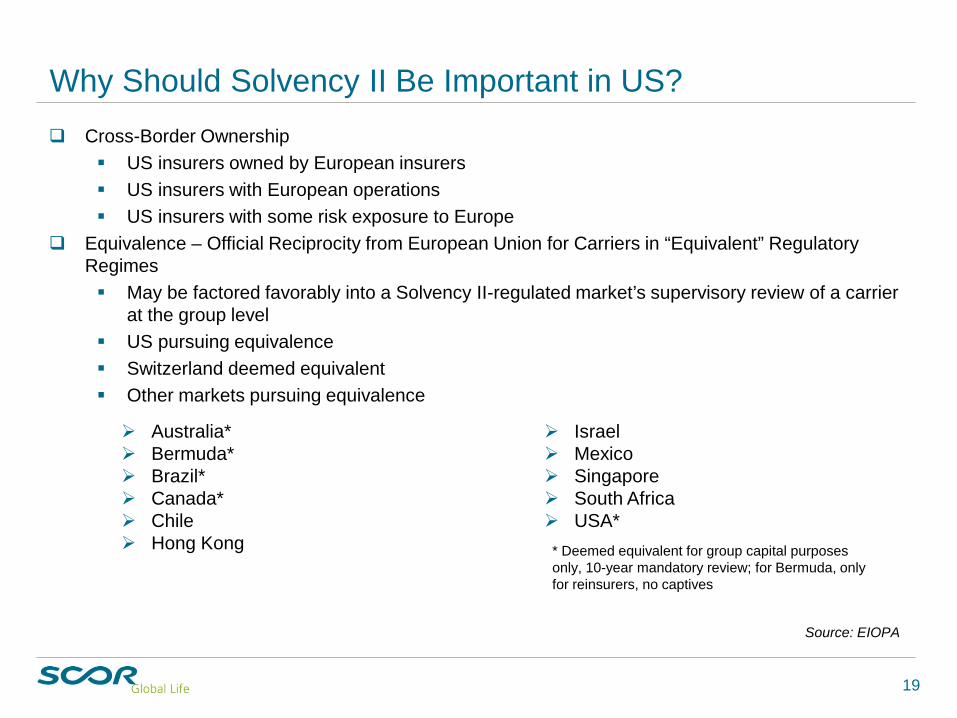
Why Should Solvency II Be Important in US? Cross-Border Ownership
US insurers owned by European insurers US insurers with European operations US insurers with some risk exposure to Europe
Equivalence – Official Reciprocity from European Union for Carriers in “Equivalent” Regulatory Regimes May be factored favorably into a Solvency II-regulated market’s supervisory review of a carrier
at the group level US pursuing equivalence Switzerland deemed equivalent Other markets pursuing equivalence
Source: EIOPA
Australia* Bermuda* Brazil* Canada* Chile Hong Kong
Israel Mexico Singapore South Africa USA*
19
* Deemed equivalent for group capital purposes only, 10-year mandatory review; for Bermuda, only for reinsurers, no captives