Session 1 - Silva, Singh, Richardson at MLconf NYC
27
Copyright © 2012, SAS Institute Inc. All rights reserved. DETERMINING THE NUMBER OF CLUSTERS IN A DATASET USING ABC I. KABUL, P. HALL, J. SILVA, W. SARLE, J. DEAN ENTERPRISE MINER R AND D SAS INSTITUTE
-
Upload
sessionsevents -
Category
Technology
-
view
59 -
download
0
Transcript of Session 1 - Silva, Singh, Richardson at MLconf NYC

Copyr i g ht © 2012, SAS Ins t i tu t e Inc . A l l r ights reser ve d .
DETERMINING THE NUMBER OF CLUSTERS
IN A DATASET USING ABC
I. KABUL, P. HALL, J. SILVA, W. SARLE, J. DEAN
ENTERPRISE MINER R AND D
SAS INSTITUTE

Copyr i g ht © 2012, SAS Ins t i tu t e Inc . A l l r ights reser ve d .
HOW MANY
CLUSTERS?
Sample Data

Copyr i g ht © 2012, SAS Ins t i tu t e Inc . A l l r ights reser ve d .
BACKGROUND USING RSS = WK TO DETERMINE # OF CLUSTERS
“Elbow” curve based on multiple k-means runs
Problem:
no reference clustering to compare
the differences Wk Wk1’s are not normalized for comparison
Copyr i g ht © 2012, SAS Ins t i tu t e Inc . A l l r ights reser ve d .
ALIGNED BOX
CRITERION
(ABC)
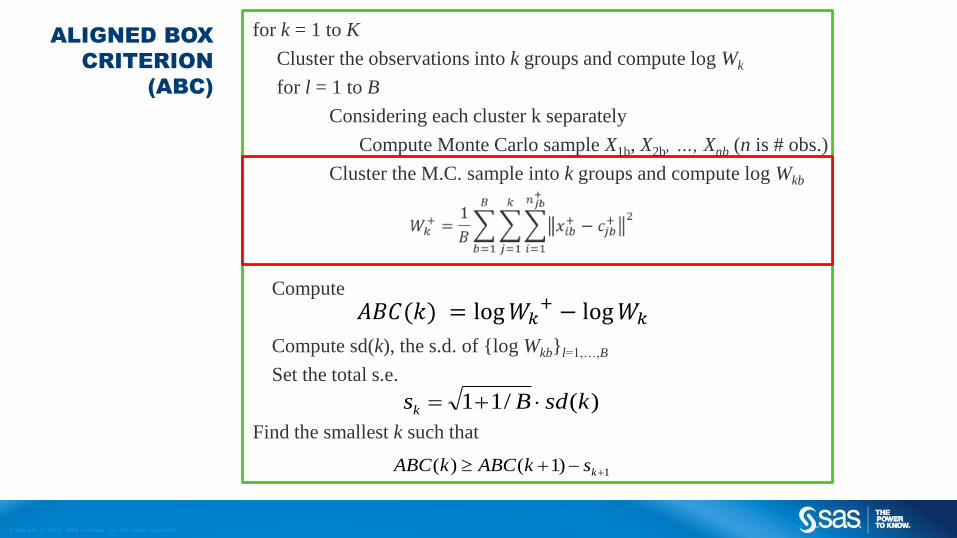
for k = 1 to K
Cluster the observations into k groups and compute log Wk
for l = 1 to B
Considering each cluster k separately
Compute Monte Carlo sample X1b, X2b, …, Xnb (n is # obs.)
Cluster the M.C. sample into k groups and compute log Wkb
Compute
Compute sd(k), the s.d. of {log Wkb}l=1,…,B
Set the total s.e.
Find the smallest k such that
)(/11 ksdBsk
1)1()( kskABCkABC
𝐴𝐵𝐶(𝑘) = log𝑊𝑘+ − log𝑊𝑘

Copyr i g ht © 2012, SAS Ins t i tu t e Inc . A l l r ights reser ve d .
ESTIMATING k REFERENCE DISTRIBUTIONS
Aligned Box Criterion

Copyr i g ht © 2012, SAS Ins t i tu t e Inc . A l l r ights reser ve d .
ESTIMATING k REFERENCE DISTRIBUTIONS
Aligned Box Criterion

Copyr i g ht © 2012, SAS Ins t i tu t e Inc . A l l r ights reser ve d .
Aligned Box Criterion
ESTIMATING k REFERENCE DISTRIBUTIONS

Copyr i g ht © 2012, SAS Ins t i tu t e Inc . A l l r ights reser ve d .
Aligned Box Criterion
ESTIMATING k REFERENCE DISTRIBUTIONS

Copyr i g ht © 2012, SAS Ins t i tu t e Inc . A l l r ights reser ve d .
Aligned Box Criterion
ESTIMATING k REFERENCE DISTRIBUTIONS

Copyr i g ht © 2012, SAS Ins t i tu t e Inc . A l l r ights reser ve d .
ESTIMATING k REFERENCE DISTRIBUTIONS
Wk*decreases
faster.
Gap Statistic Aligned Box Criterion

Copyr i g ht © 2012, SAS Ins t i tu t e Inc . A l l r ights reser ve d .
ESTIMATING k REFERENCE DISTRIBUTIONS
Gap Statistic Aligned Box Criterion
Alig
ne
d B
ox C
rite
rio
n
Clearer
Maxima.

Copyr i g ht © 2012, SAS Ins t i tu t e Inc . A l l r ights reser ve d .
ESTIMATING k TIMINGS ON REAL DATA
D = 32 dimensions
N = 13,184,290 observations

Copyr i g ht © 2012, SAS Ins t i tu t e Inc . A l l r ights reser ve d .
CONCLUSION
For large, highly dimensional and noisy data, ABC
delivers good scalability and robustness
Avoids quadratic complexity (e.g., silhouette)

Randomized Linear Algebra on Spark
Presented by: Mohitdeep Singh
Team: Ben Bowen1, Jey KoBalam2, Prabhat1, Oliver Ruebel1, Jiyan Yang3, Michael Mahoney2, Yushu Yao1
This work was supported by the Director, Office of Science, Office of Advanced ScienMfic CompuMng Research, Applied MathemaMcs program of the U.S. Department of Energy under Contract No. DE-‐AC02-‐05CH11231.

Problem Statement

RandNLA Principles Construct a sketch

RandNLA Principles Solve the sub-‐problem

Randomly select elements

Randomly select columns

Randomly select rows

Direct ApplicaMons
Ø Least Squares Problem: (Low precision): Solve the induced sub-‐problem. (High precision): PrecondiMon the sketch and invoke iteraMve solver Ø Low rank Matrix Approxima8on: EsMmate the row leverage scores associated with rank parameter k. Choose k rows from A based on the leverage scores in a determinisMc or randomized manner, denoted by X. Compute C based on X.

Current Progress
Look out for announcements
Refer: ImplemenMng Randomized Matrix Algorithms in Parallel and Distributed Environments: Yang et.al
O(100GB)
1) Handles both sparse and dense matrices 2) Minimizes communicaMon costs
TesMng on edison.

Using SAX for Time Series Anomaly Detection
Ray Richardson, CTO Simularity

What is SAX• SAX (Symbolic Aggregate approXimation) is a
method for representing a Time Series as a symbol - a fixed length string of “letters” drawn from a small alphabet
• SAX was invented by Dr. Eamonn Keogh of the University of California at Riverside
• SAX allows Time Series to be easily searched and matched, as it creates a symbol which can index the Time Series

How do we obtain SAX?
0 20 40 60 80 100 120
C
C
0
-
-
0 20 40 60 80 100 120
b b b
a
c c
c
a
baabccbc
First convert the time series to PAA representation, then convert the PAA to symbols
It takes linear time
Slide by Jessica Lin and Eamonn Keogh

Finding Anomalies• Each SAX “Space” (Alphabet Size + Length) has a
cardinality. The word in the previous slide (alphabet size = 3, length = 8) has a space cardinality of 38 or 6561 possible SAX words
• Each word is an index into that space. The previous example word baabccbc = 5779 (assuming a little-endian representation of the SAX word)
• As we look at incoming Time Series, we convert them to the appropriate SAX word, and count how many times we see each word

Computing the Anomaly• For any SAX word, we know the total number of Time Series, the
Cardinality of the Space, and the count of that particular word
• From this we can compute (among other things) a P-Value giving the probability of seeing a count which is so low (anomalous)
• This P-Value indicates how anomalous that particular SAX word (and the Time Series it represents) are with respect to all the Time Series that occur in the data.
• Note that P-Values are used only as an illustration - other metrics are actually more useful