
Session 1- SBA 101 MR - Edunomics...
31
SBA 101 Contents and slides may not be reproduced or referenced without permission and citation. Citation should include: Edunomics Lab at Georgetown University, 2017.
Transcript of Session 1- SBA 101 MR - Edunomics...

SBA101
Contentsandslidesmaynotbereproducedorreferencedwithoutpermissionandcitation.Citationshouldinclude:Edunomics LabatGeorgetownUniversity,2017.
1. Welcome!
2. SBA101:WhatisSBA?
3. SBADistrictCollaborativeNetwork:Whyanetwork?
SBA101

Federal$
State$
Local$
District$
School$
School$
School$
School$
Today’sfocus:Allocationofresourcesfromdistrictstoschools

Districtshaveafiduciaryresponsibilitytoapplyfundsequitablyacrossstudents
Comparingschoolsonperformancerequireslevelplayingfieldonspending
Allocationstrategiescandictateresourceuse,especiallyimportantamidstconstrainedresources
Allocationstrategiescaninhibitorenhanceeffortssuchasschoolautonomy,choice,accountabilityandcanaffectbehaviorinschools
Whydoesallocationmatter?

Per Pupil Costs for Each School
$3,000
$3,500
$4,000
$4,500
$5,000
$5,500
$6,000
DPS schools
Per
PU
pil
Exp
en
dit
ure
sForexample,DPSSpendingforeachschool,2005,beforeSBA
Isthisinequitable? Can’ttellbecausestudentmixdiffersacrossschools.
ONAVERAGE,districtwasspending:
$3,943perpupil$677perFRLpupil$407perBilingual$145perGifted
Butsomeschoolsgettingmorethanthoseaverages,andsomegettingless.
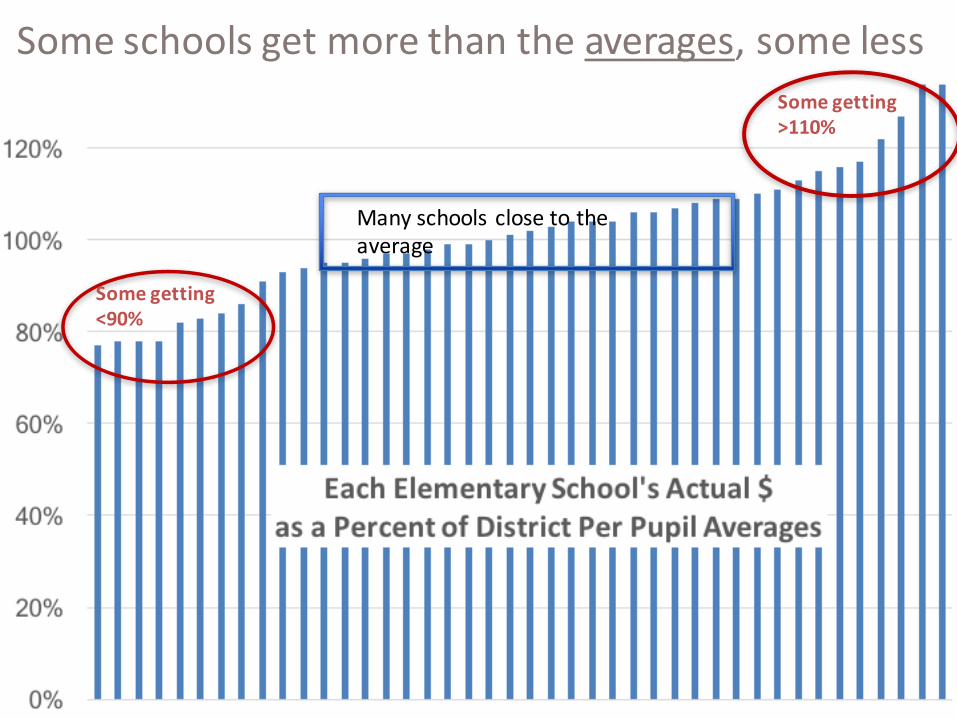
Someschoolsgetmorethantheaverages,someless
Manyschoolsclosetotheaverage
Somegetting>110%
Somegetting<90%

Dollarsareallocated(notstaffpositionsorotheringredients)onthebasisofstudents.Studentsareweightedaccordingtoneeds.
StudentBasedAllocation(SBA)models
Incontrast,traditionalallocationpractices distributepurchasedschoolingitems(staffpositions,supplies,books,etc.)toschools.

Chicago2005
Lookingatwhat’sspentateachschoolalsodoesn’t enablerelativecomparisons.
Traditionalstaffing-basedallocationmodel
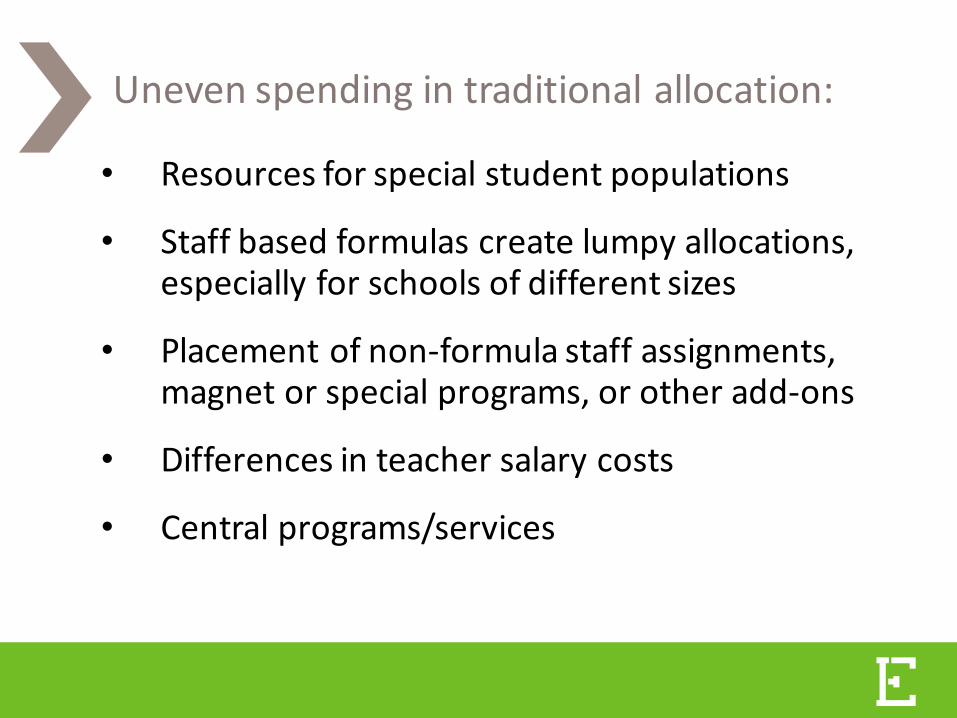
• Resourcesforspecialstudentpopulations
• Staffbasedformulascreatelumpyallocations,especiallyforschoolsofdifferentsizes
• Placementofnon-formulastaffassignments,magnetorspecialprograms,orotheradd-ons
• Differencesinteachersalarycosts
• Centralprograms/services
Unevenspendingintraditionalallocation:

Incontrast,student-basedallocationdivviesupfundsonthebasisofstudents.

StudentBasedAllocation(SBA)models
• Weightsaredeliberate• Formuladetailcanbesummarizedononepage• Districtleadersmanagetheweights,noteach
school’sallocationsorhowfundsareused• Spendingacrossschoolscanbecomparedin
percentagesintermstheirSBAallocation• Thedistrictspendsthesameamountona
studentregardlessofwherethatstudentattendsschool.

HowdoesSBAwork?The”averages”foreachstudentbecometheactualallocations:
$3,943perpupil$677perFRLpupil$407perBilingual$145perGifted
Districtscanrevisethebaseorweightstocreatemorepurposefulallocations
=BASE=.17or17%FRLweight=.10or10%Bilingualweight=.04or4%Giftedweight
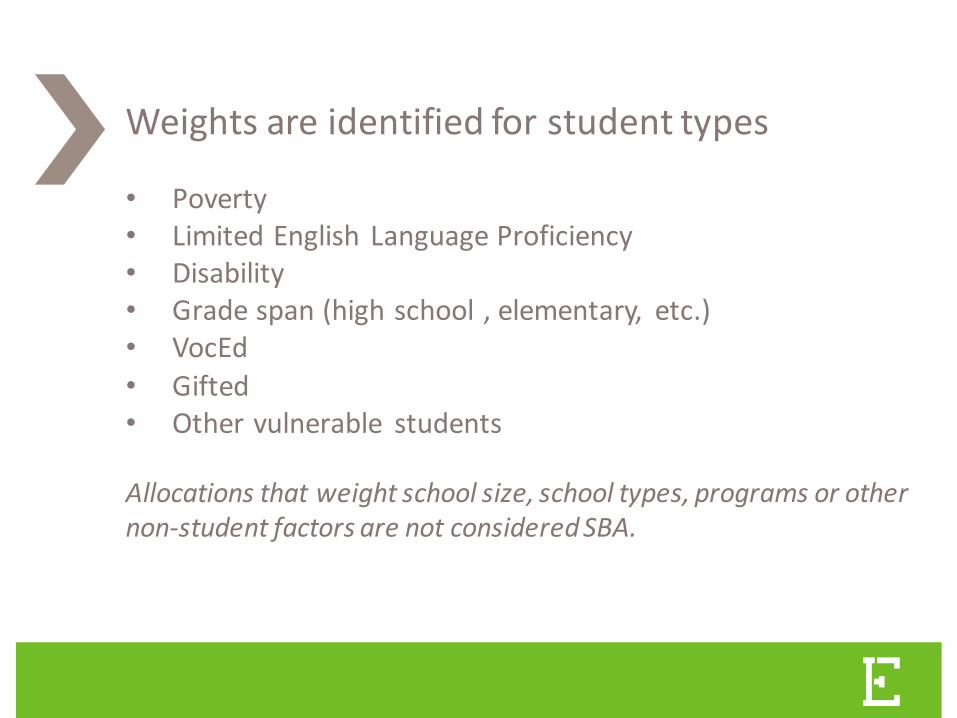
• Poverty• LimitedEnglish LanguageProficiency• Disability• Gradespan(highschool,elementary, etc.)• VocEd• Gifted• Othervulnerable students
Allocationsthatweightschoolsize,schooltypes,programsorothernon-studentfactorsarenotconsideredSBA.
Weightsareidentifiedforstudenttypes

E DUN OM I C S LAB AT GE ORGE TOWN UN I V E RSI TYE DUN OM I C S.GE ORGE TOWN .E D U
MetroNashvillePublicSchools
14
InitialstudentweightsinNashville.

PrinceGeorge’sCountyPublicSchoolDistrict
FY14Formula

• Equity• Transparency• Flexibilityinresourceuse• Accountability/Ownership• Studentchoiceandfundingportability• Financialsustainability• Service-orientedcentraldepartments
WhySBAmodelsaregainingtractioninU.S.

EDUNOMICS LAB AT GEORGETOWN UNIVERSITYEDUNOMICS.GEORGETOWN.EDU
Beyond equity, what value is there from school-level engagement in financials?
17

0
10
20
30
40
50
60
70
80
90
$2,000 $3,000 $4,000 $5,000 $6,000 $7,000 $8,000 $9,000
Per
cent
of
stud
ents
mee
ting
wri
ting
sta
ndar
d
Per pupil spending by school (salary/benefits expenditures only)
Spending Vs Performance across WA state's high poverty elmentary schools

0
10
20
30
40
50
60
70
80
90
$2,000 $3,000 $4,000 $5,000 $6,000 $7,000 $8,000 $9,000
Per
cent
of
stud
ents
mee
ting
wri
ting
sta
ndar
d
Per pupil spending by school (salary/benefits expenditures only)
Spending Vs Performance across WA state's high poverty elmentary schools
A. Weakrelationshipbetween$andoutcomesB. Twoschoolscouldspendsame$andget
differentoutcomesC. Couldspendsame$insameway andget
differentoutcomes(e.g.substantialschooleffects).
D. Verylittleawarenessatschoollevelofschooleffects
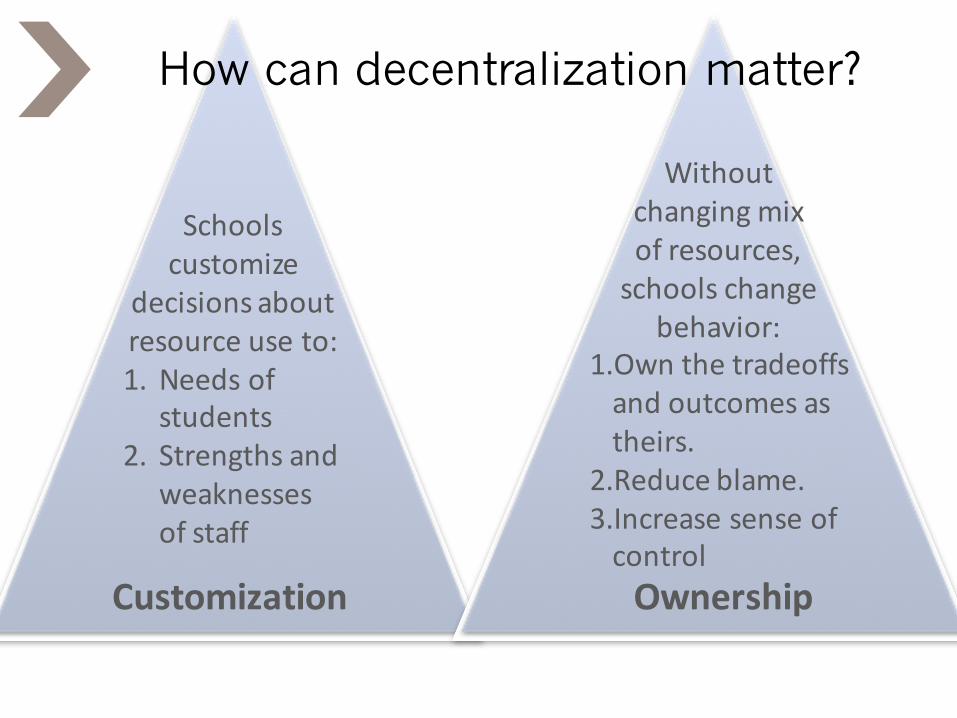
Schoolscustomize
decisionsaboutresourceuseto:1. Needsof
students2. Strengthsand
weaknessesofstaff
Customization
Withoutchangingmixofresources,schoolschange
behavior:1.Ownthetradeoffsandoutcomesastheirs.
2.Reduceblame.3.IncreasesenseofcontrolOwnership
How can decentralization matter?

EDUNOMICS LAB AT GEORGETOWN UNIVERSITYEDUNOMICS.GEORGETOWN.EDU
Onaverage,theylist____ barriersperprincipal! *
*Miller(2014). Policy barrierstoschool improvement:What’s realandwhat’simagined?CRPE.http://www.crpe.org/publications/policy-barriers-school-improvement-whats-real-and-whats-imagined
Whenprincipalsareaskedwhatstandsinthewayofleveragingtheirdollarstogetgreateroutcomesforstudents
21
Resource allocation
37%
Instructional innovation
40%
Teacher quality23%
16

• Notasmuchbenefitforsmalldistricts.
• Somedistrictsdon’thaveaplanforschoolswithdecliningenrollment. (Unwilling tocloseorallow flexible staffingwhenschoolshaveinsufficient resourcesforprototypicalstaffing).(Seattle)
• Createsadisconnectindistrictswantinglargecentraloperations.
• Notcompatiblewithdistrictswantinguniformity inservices
WhatisthecaseagainstSBA?

• Weightsinitiallyreflectexistingaverages(tominimizewinners/losers).
• Somedistrictsuseapilot.• Someallowholdharmless.• Ofteninitiallyuseaveragesalariesin
budgeting.• Overtime,moremoneyaddedtothe
“formula”
WhatdoesSBAimplementationlooklike?

Initially, most schools make only modest changes with their budgeting flexibility.
Changes that do take place, do so on the margin.

Principalsknowwhatstuffcosts
• Identify highest and lowest paid staff and examine workloads
• Consider costs of all functions in per pupil terms
• Are some services costing too much?• Consider tradeoffs. What else could this
money buy?• Changes will come from REALLOCATION
(vs. new monies).
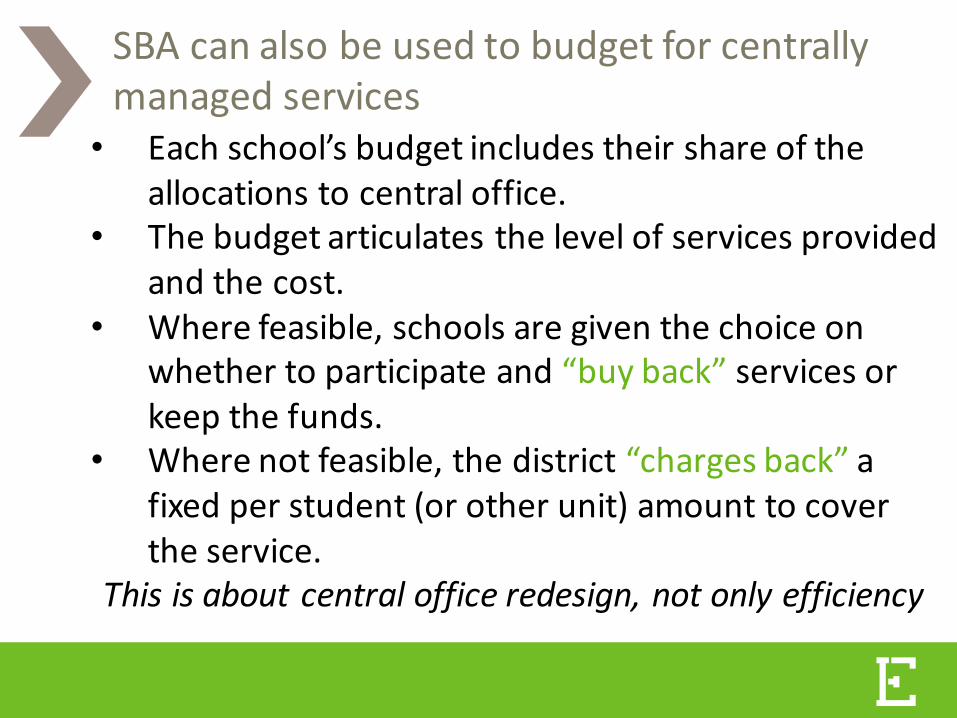
• Eachschool’sbudgetincludestheirshareoftheallocationstocentraloffice.
• Thebudgetarticulatesthelevelofservicesprovidedandthecost.
• Wherefeasible,schoolsaregiventhechoiceonwhethertoparticipateand“buyback”servicesorkeepthefunds.
• Wherenotfeasible,thedistrict“chargesback”afixedperstudent(orotherunit)amounttocovertheservice.
Thisisaboutcentralofficeredesign,notonlyefficiency
SBAcanalsobeusedtobudgetforcentrallymanagedservices

Pricingexamplesforcentrallymanagedservices
• Superintendent’soffice– $8.56perpupil,Chargeback
• Boardofdirectors– $5.02perpupil,Chargeback
• Accountability,research/datasupport– $6.80perpupil,Chargeback
• C&I:Educationalplanreview– $3082perschool,Buyback
• Grantwriting– $80perhour,Buyback
• Maildelivery– $2200for5days/wk,$900for2days/wk,$500for1day/wk

Districtfinanceleadsmeetviawebinar1Xmonth.Edunomics Labhosts
Dynamicandevolvinggroup—topicsdrivenbytheneedsofthepartnerdistricts
Threeprimarygoals:
• ToshareknowledgetosolvedistrictchallengesaroundproblemsofSBApractice
• Tocollectivelyproduceresearchdistrictsneedandwant• Toserveasatrustedprofessionalnetworkfordistrictfinanceleaders
specifictoaninnovativestudent-basedfinancialstrategy
SBADistrictCollaborativeNetwork

StudentBasedAllocationWorkingGroup
Atlanta Public SchoolsAustin Independent School DistrictBaltimore City Public SchoolsBoston Public SchoolsCamden City SchoolsChicago Public SchoolsCleveland Metropolitan School DistrictDenver Public SchoolsD.C. Public SchoolsDurango School DistrictHartford Public SchoolsHouston Independent School DistrictIndianapolis Public Schools
Metropolitan Nashville Public SchoolsMilwaukee Public SchoolsMinneapolis Public SchoolsNew Haven Public SchoolsNew York City DoENewark Public SchoolsOrleans Parish School BoardShelby County SchoolsSpokane Public SchoolsSyracuse City SchoolsTulsa Public Schools

NextMeetings
November14,2017
Possibleupcomingtopics• ESSAimpactondistricts• California’sLCFFresearchupdate• Takingstockofsalaryimpacts– andpossibleremedies• Communitybasedpartnerships• Achallengeposedbyonedistricttothegroup• Otherideas– [email protected]

Contentsandslidesmaynotbereproducedorreferencedwithoutpermissionandcitation.Citationshouldinclude:Edunomics LabatGeorgetownUniversity,2017.