
Service Time Management of Doctor’s Consultation …Service Time Management of Doctor’s...
14
I.J. Mathematical Sciences and Computing, 2017, 1, 49-62 Published Online January 2017 in MECS (http://www.mecs-press.net) DOI: 10.5815/ijmsc.2017.01.05 Available online at http://www.mecs-press.net/ijmsc Service Time Management of Doctor’s Consultation Using Parallel Service Time in Wesley Guild Hospital, Ilesa, Osun State, Nigeria David O. Ikotun a , Alaba T. Owoseni b , Justus A. Ademuyiwa a,b,* a Department of Mathematics and Statistics, Interlink Polytechnic, Ijebu Jesa, Nigeria b Department of Computer Science, Interlink Polytechnic, Ijebu Jesa and Department of Mathematics and Statistics, Federal Polytechnic, Ile-Oluji, Nigeria Abstract How to manage patient’s service time has been a burden in view of the condition of patients who have to wait for required service from doctors in many hospitals in developing countries. This paper deals with the management of service time of doctor’s consultation using parallel service time. Though, the theoretical underlying distribution of service time is exponential, but this research showed service time to be non- exponential but, normal. This unusual distribution of service time was attributed to non-identical services required by patients from doctors in the considered sample space. Secondly, the mean service time from each service point as researched was found the same. This showed that no line could be preferred to other. Index Terms: Service time, service point, exponential distribution, normal distribution, likelihood ratio test, central limit theorem. © 2017 Published by MECS Publisher. Selection and/or peer review under responsibility of the Research Association of Modern Education and Computer Science 1. Introduction A service time is the time a customer spends with the server in receiving service. The time it takes one particular server to complete a customers’ service, is often used in making decision about resources needed to provide the services therefore, there is a need for service time management for effective and efficient decision making. Service time management may be in the hospital between a doctor and patients, in the banking halls between a cashier and customers and even at automated teller machine terminals. The problem of very long service time cannot be underestimated, if service time is unduly long, the waiting time of later customers are very long. When customers are kept waiting in line for service, it may lead to break down of law and order. This happens at filling stations during the period of fuel scarcity for example, * Corresponding author – Rogushina Julia. E-mail address: [email protected]
Transcript of Service Time Management of Doctor’s Consultation …Service Time Management of Doctor’s...

I.J. Mathematical Sciences and Computing, 2017, 1, 49-62 Published Online January 2017 in MECS (http://www.mecs-press.net)
DOI: 10.5815/ijmsc.2017.01.05
Available online at http://www.mecs-press.net/ijmsc
Service Time Management of Doctor’s Consultation Using Parallel
Service Time in Wesley Guild Hospital, Ilesa, Osun State, Nigeria
David O. Ikotun a, Alaba T. Owoseni
b, Justus A. Ademuyiwa
a,b,*
a Department of Mathematics and Statistics, Interlink Polytechnic, Ijebu Jesa, Nigeria
b Department of Computer Science, Interlink Polytechnic, Ijebu Jesa and Department of Mathematics and
Statistics, Federal Polytechnic, Ile-Oluji, Nigeria
Abstract
How to manage patient’s service time has been a burden in view of the condition of patients who have to wait
for required service from doctors in many hospitals in developing countries. This paper deals with the
management of service time of doctor’s consultation using parallel service time. Though, the theoretical
underlying distribution of service time is exponential, but this research showed service time to be non-
exponential but, normal. This unusual distribution of service time was attributed to non-identical services
required by patients from doctors in the considered sample space. Secondly, the mean service time from each
service point as researched was found the same. This showed that no line could be preferred to other.
Index Terms: Service time, service point, exponential distribution, normal distribution, likelihood ratio test,
central limit theorem.
© 2017 Published by MECS Publisher. Selection and/or peer review under responsibility of the Research
Association of Modern Education and Computer Science
1. Introduction
A service time is the time a customer spends with the server in receiving service. The time it takes one
particular server to complete a customers’ service, is often used in making decision about resources needed to
provide the services therefore, there is a need for service time management for effective and efficient decision
making. Service time management may be in the hospital between a doctor and patients, in the banking halls
between a cashier and customers and even at automated teller machine terminals.
The problem of very long service time cannot be underestimated, if service time is unduly long, the waiting
time of later customers are very long. When customers are kept waiting in line for service, it may lead to break
down of law and order. This happens at filling stations during the period of fuel scarcity for example,
* Corresponding author – Rogushina Julia.
E-mail address: [email protected]

50 Service Time Management of Doctor’s Consultation Using Parallel Service Time in Wesley Guild Hospital,
Ilesa, Osun State, Nigeria
Customers needing urgent attention that are kept waiting might develop various complications on the waiting
line. Whenever expected inter arrival time is greater than mean service time, queue is developed and customers
would consider the time spent on queue as wasting time.
The study of service time will provide expected utilization of server. Servers are usually paid and there is
need to keep them optimized. A hospital cannot be of good service delivery if patients experience unduly long
service time. People dislike long service time. Especially in hospitals and in order to improve level of service,
hospital management board is usually interested in finding out the following:
Is it worthwhile to invest effort on service time?
Should priorities for certain customers be introduced?
Is waiting area of customers adequate?
The application of “service time” may be of particular benefit in health sector with high size of customers.
Service managers can make decision that increases the overall satisfaction of customers.
In this paper, it has been researched that the distribution of service time which is generally known to be
exponential has been proved otherwise due to the studied population that is, in a hospital where services
required by patients are not identical and so, we may experience a non-exponential distribution of service time.
During the course of the study, a well-known medical teaching hospital was considered and the data used as
contained in the appendix were analyzed scientifically.
Exponential distribution of service time is expected to be followed in communication industries where
customers call in and out. This may not be so in a hospital setting, an institution providing medical and surgical
treatment for sick or injured people. Customers coming with different ailments are not expected to spend the
same time with the doctor on consultation.
2. Related Works
This section provides a theoretical framework for this work and they are logically grouped as follows:
1.1. Arrival Process
As presented in [1], a paper on Markovian arrivals in stochastic modeling and in [2], some simplified
notation that carries as batch Markovian process were introduced. Also in [3], there was an analysis of gerber-
Slim discounted penalty function for risk processes with Markovian arrivals on insurance, mathematics and
economics. Alfa A. S. and Neut, M. F. (1995) presented a paper on modeling vehicular traffic using discrete
time Markovian process in transportation science [4] and in [5], stochastic process with application to biology
was introduced.
Asmussen S. and Koole G (1993) marked points’ process as limit of Markovian arrival stream [6]. [7]
introduced queue theory and matrix analysis and in [8], the work introduced queuing system with arrival input
disaster.
Lambert et al worked on queue with correlated service and inter-arrival times and application to optical
buffers as contained in [9]. Meier-Hellstern K. S. and Neuts M. F. (1990) in [10] worked on a single-server
queue with server vacations and a class of non-renewal arrival process.
1.2. Service Time
Halfin and Whilt (1981) developed server sizing heuristic for Erlang C model based on square root of
staffing principle [11]. In [12], it was observed that the mean time was 53 minutes but customer preferred to
spend maximum of 20 minutes. Also, as reviewed in [13], a positive correlation existed between arrival rate of

Service Time Management of Doctor’s Consultation Using Parallel Service Time in Wesley Guild Hospital, 51
Ilesa, Osun State, Nigeria
customers and bank service rate. Green and Kolesar (1991) worked on point stationary approximation PSA in
model arrival rate that vary slowly as compared to service level but, can be expressed as a function of time for
example a sinusoidal varying arrival rate [14]. The theme that nuns through these papers is the challenge
related to determine appropriate number of agents to staff given the tradeoff of operational cost and customer
service. Beales 1995, Dantzig (1995) explicitly incorporate variability in parameter value known as stochastic
program chance constraint program implement a confidence level of type constrains [15].
Ashley (2000) asserted that service system could promote service at faster rate than customer arrival rate;
waiting line could still form if the arrival and service process were random [16].
Service time follows exponential distribution. In a situation where service received by customers are not the
same, service may not follow exponential distribution.
3. Methodology
This section discusses the materials and methods used in the study. The methods include the statistical
models used for analysis as discussed below:
3.1. Maximum Likelihood Estimate of Mean (µ) and Variance (σ2)
n (1)
Log of likelihood:
(2)
(3)
(4)
Equate the equation to zero from (3):
(5)
(6)
(7)
52 Service Time Management of Doctor’s Consultation Using Parallel Service Time in Wesley Guild Hospital,
Ilesa, Osun State, Nigeria
From (3)
(8)
(9)
(10)
(11)
(12)
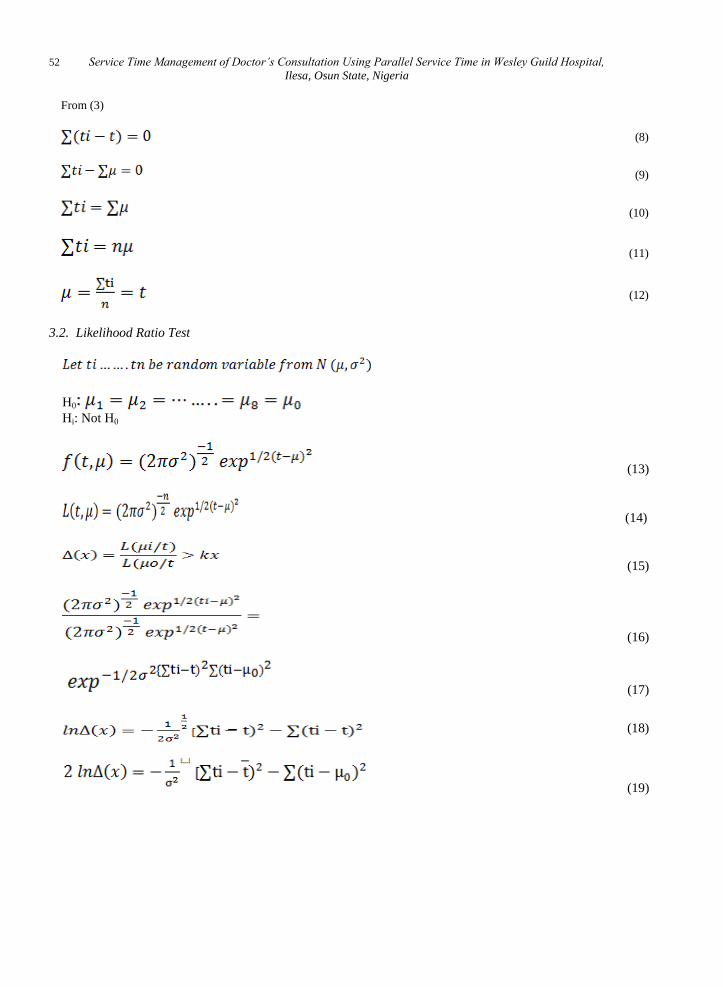
3.2. Likelihood Ratio Test
H0
Hi: Not H0
(13)
(14)
(15)
(16)
(17)
(18)
(19)

Service Time Management of Doctor’s Consultation Using Parallel Service Time in Wesley Guild Hospital, 53
Ilesa, Osun State, Nigeria
(20)
(21)
(22)
(23)
(24)
(25)
(26)
Squaring both sides:
(27)
(28)
(29)
3.3. Data Presentation and Analysis
Data is the information collected for the analysis of a given problem. The data collected involves 8 service
point, seven other people were employed for data collection. The number of customers served in 120 minutes
each day by the doctor were observed and recorded in minutes.
3.3.1. Data Presentation
The figures below show the histograms of service time against the total number of patients on daily basis per
doctor (server) using “R” statistical package for the representation.

54 Service Time Management of Doctor’s Consultation Using Parallel Service Time in Wesley Guild Hospital,
Ilesa, Osun State, Nigeria
Fig.1. Histogram for Server 1 (Doctor)
Fig.2. Histogram for Server 2(Doctor)
Fig.3. Histogram for Server 3(Doctor)

Service Time Management of Doctor’s Consultation Using Parallel Service Time in Wesley Guild Hospital, 55
Ilesa, Osun State, Nigeria
Fig.4. Histogram for Server 4(Doctor)
Fig.5. Histogram for Server 5(Doctor)
Fig.6. Histogram for Server 6(Doctor)

56 Service Time Management of Doctor’s Consultation Using Parallel Service Time in Wesley Guild Hospital,
Ilesa, Osun State, Nigeria
Fig.7. Histogram for Server 7(Doctor)
Fig.8. Histogram for Server 8(Doctor)
3.3.2. Kolmogorov-Smimov Tests’ Result
Server 1:
Fig 1: Histogram for server 1
> Ks. Test (s6, pexp, mean (s1))
One-simple Kolmogorov-Smirnov test
data: s6
Alternative hypothesis: two-sided
Server 2:
Service Time Management of Doctor’s Consultation Using Parallel Service Time in Wesley Guild Hospital, 57
Ilesa, Osun State, Nigeria
Fig 2: Histogram for server 2
> Ks. Test (s6, pexp, mean (s2))
One-simple Kolmogorov-Smirnov test
data: s6
Alternative hypothesis: two-sided
Server 3
Fig 3: Histogram for server 3
One-simple Kolmogorov-Smirnov test
data: s6
Alternative hypothesis: two-sided
Server 4:
Fig 4: Histogram for server 4
> Ks. Test (s6, pexp, mean (s4)
One-simple Kolmogorov-Smirnov test
data: s6
D = 1, p-value <2.2e-16
Alternative hypothesis: two-sided
Server 5:
Fig 5: Histogram for server 5
>Ks.test(s5,pexp,mean(s5)
One-sample Kolmogorov-Smirnov test
data: s6
=1, p-value<2.2e-16
Alternative hypothesis: two-sided
Server 6:
Fig 6: Histogram for server 6
>Ks.test(s5,pexp,mean(s5)
One-sample Kolmogorov-Smirnov test
data: s6
=1, p-value<2.2e-16

58 Service Time Management of Doctor’s Consultation Using Parallel Service Time in Wesley Guild Hospital,
Ilesa, Osun State, Nigeria
Alternative hypothesis: two-sided
Server 7:
Fig 7: Histogram for server 7
>Ks.test(s5,pexp,mean(s5)
One-sample Kolmogorov-Smirnov test
data: s6
=1, p-value<2.2e-16
Alternative hypothesis: two-sided
Server 8
Fig 8: Histogram for server 8
>Ks.test(s5,pexp,mean(s5)
One-sample Kolmogorov-Smirnov test
data: s6
=1, p-value<2.2e-16
Alternative hypothesis: two-sided
3.3.3. Data Analysis
Analysis of variance test was performed using R-package. The following object(s) are masked by
“GlobalEnv”:
Day, server
>anova=aov(server-day,data=ddat)
>summary (anova)
Source of Variation Degree of Freedom Sum of Squares Mean of Squares F-value Pr(>F)
Day 7 13 1.795 0.188 0.988
Residuals 381 3647 9.571
3.3.4. The Maximum Likelihood Ratio Test
The test was performed using R-statistical Package
>vp
4. Result
The analysis shows an important result which interprets as follows: The number of customers arrived at that
time was greater than the number of the cashiers. The probability of queuing on arrival in First Bank was 0.089
and Guaranty Trust Bank was 0.00035. These are weak probability but it is still possible for customer to wait
before receiving services. The average number of customers waiting to be served in First Bank was one

Service Time Management of Doctor’s Consultation Using Parallel Service Time in Wesley Guild Hospital, 59
Ilesa, Osun State, Nigeria
customer per minute while Guaranty Trust was one customer per minute which means at time there will be no
customer in the queue.
Average time spent in the system in First Bank was 24.41 minutes and average time spent in the queue was
1.03minutes which means that a customer spent at least 23.38minutes in the queue.
Guaranty Trust Bank, average time spent in the system was 11.52 minutes which is shorter than that of first
bank. If the time is extended to two hours in a day First Bank has 128 customers and Guaranty Trust Bank will
have 11,085 customers to be attended to.
Based on the descriptive statistics and non-parametric test, the histogram and Kolmogorov-Smirnov test
shows that service time does not follow exponential distribution. With the adoption of central limit theorem and
the descriptive statistics (histogram) we assume that the service time is normally distributed.
The result of the Analysis of Variance (ANOVA) and maximum likelihood ratio do not reject the null
hypothesis.
The assumption of service time always follows exponential distribution. It is a different case in this paper.
This is not strange because individual patient comes to the hospital with different types of ailments. We cannot
expect the patient diagnosed with cancer to spend the same time with the patient diagnosed with headache.
Assuming the research work was carried out in a bank where customers only withdraw or save money, it will
follow exponential distribution.
The result of ANOVA and Maximum Likelihood Ratio Test shows that the mean service time of the doctors
are the same since the null hypothesis is not rejected. This is because there is no permanent service point for a
particular doctor. Doctors are assigned to service point at random mainly because doctors are always on shift.
Acknowledgements
Our appreciation goes to my able mentor, Professor E. T. Jolayemi, of the Department of Statistics,
University of Ilorin, Nigeria, who offered useful advice and suggestion during the period of statistical
experiment and research. He also made correction of all mistakes.
References
[1] Artalejo J. A. and Gomez-Corral A. A state of independent Markov modulated mechanism for
generating event and stochastic model, 2010.
[2] Neuts M. F. The analysis of retrial queues, 2nd
Edition Dover Publication, 1999.
[3] Ahn S., Badescu A. L. and Ramaswami V. Time dependent analysis of finite buffer fluid flows and risk
model with dwident barrier, 2007.
[4] Alfa A. S. and Neut M. F. An improved distance estimation method, 1995.
[5] Allen J. R. L. Journal of Quaternary Sciences, 2003, 23(3).
[6] Asmussen S. and Koole. Journal of Applied Probability, 1993.
[7] Breur L. and Baun D. An introduction to queuing theory matrix-analytic method. Journal of Applied
Probability.
[8] Dubin A. N., Nishimura S. Journal of Applied Mathematics and Stochastic Analysis, 1999, V. 12H4,
393-415, 7.
[9] Lambert J. Van Houdt B. and Blondia C. Point process with finite probabilities, 2006.
[10] Meier-Hellstern K. S. and Neuts M. F. Lume Final Program and Abstract, 1990.
[11] Halfin, S and W. Heavy-Traffic limits for queue with many exponential serves, Operational Research,
1981, 29(3)567-588.
[12] Aamatu and Ariyo (1983): An appraisal of cost queuing in Nigeria Banking Sector.

60 Service Time Management of Doctor’s Consultation Using Parallel Service Time in Wesley Guild Hospital,
Ilesa, Osun State, Nigeria
[13] Oladapo J.O 1998: International Institution to parallel Processing.
[14] Green and Kolesar (1991): Staffing a service system with Appointment Based on Customer Awards.
Journal of Operational Research Society doi 10/507/Jor 2013
[15] Beal E, M.L (1995): On minimizing a convex function subject to linear me qualities journal of the Royal
statistical society.
[16] Ashly (2002): An appraisal of Cost Queuing in Nigeria. University of Iorin Publication.
Authors’ Profiles
David O. Ikotun was born on the 25th
of July 1977. He obtained higher national diploma in
statistics at Federal Polytechnic, Ede in 2002. He also has post graduate diploma in statistics,
2010 at Federal University of Technology, Akure.
He obtained master in statistics from the University of Ilorin. He is currently a lecturer in
the department of mathematics and statistics of Interlink Polytechnic, Ijebu Jesa, Nigeria.
Justus A. Ademuyiwa was born on 21st of November, 1977. He has higher national diploma,
2001 in statistics at Federal Polytechnic, Ado Ekiti.
He has post graduate diploma in statistics at Federal University of Technology, Akure and
master in statistics at University of Ilorin, Nigeria. He is currently the head of department of
statistics, Federal Polytechnic, Ile-Oluji, Nigeria.
Alaba T. Owoseni, as a Nigerian in the south-west part of the country, had bachelor of
technology in computer engineering from Ladoke Akintola University of Technology,
Ogbomoso, Nigeria in 2009 with master of technology in computer science from Federal
University of Technology Akure, Nigeria in 2015. Currently, he is preparing to commence his
doctor of philosophy in computer science.
APPENDIX
Day 1

Service Time Management of Doctor’s Consultation Using Parallel Service Time in Wesley Guild Hospital, 61
Ilesa, Osun State, Nigeria
Day 2
Day 3
Day 4

62 Service Time Management of Doctor’s Consultation Using Parallel Service Time in Wesley Guild Hospital,
Ilesa, Osun State, Nigeria
Day 5
How to cite this paper: David O. Ikotun, Alaba T. Owoseni, Justus A. Ademuyiwa,"Service Time
Management of Doctor's Consultation Using Parallel Service T me in Wesley Guild Hospital, Ilesa, Osun State,
Nigeria", International Journal of Mathematical Sciences and Computing(IJMSC), Vol.3, No.1, pp.49-62,
2017.DOI: 10.5815/ijmsc.2017.01.05