Qualitative Quantitative Research Methodology Exploring the Interactive Continuum


J. Service Science & Management, 2010, 3, 181-286 Published Online June 2010 in SciRes (http://www.SciRP.org/journal/jssm/)
Copyright © 2010 SciRes. JSSM
TABLE OF CONTENTS
Volume 3 Number 2 June 2010 The Research of Risk Management in Two Non-Independent IT System
Z. Yin, Y. F. Guo, M. S. Lai……………………………………………………………………………………………………181
Modeling Customer Reactions to Congestion in Competitive Service Facilities
M. Saidi-Mehrabad, E. Teimory, A. Pahlavani……………………………………………………………………………………186
Employee’s Personality Traits, Work Motivation and Innovative Behavior in
Marine Tourism Industry
S.–C. Chen, M.–C. Wu, C.–H. Chen…………………………………………………………………………………………198
Brand Relationships: A Personality-Based Approach
H. M. Nobre, K. Becker, C. Brito………………………………………………………………………………………………206
An Empirical Analysis on Industrial Organization Structure of Chinese Software
Service Outsourcing
J. W. Shen, H. Li ………………………………………………………………………………………………………………218
An Importance-Performance Analysis of Primary Health Care Services: Managers vs.
Patients Perceptions
F. J. Miranda, A. Chamorro, L. R. Murillo, J. Vega………………………………………………………………………………227
The Method of Real Options to Encourage the R & D Team
J. F. Gao, L. Jiang………………………………………………………………………………………………………………235
Principal-Agent Theory Based Risk Allocation Model for Virtual Enterprise
M. Huang, G. K. Chen, W.–K. Ching, T. K. Siu…………………………………………………………………………………241
Sustainable Tourism and Management for Coral Reefs: Preserving Diversity and
Plurality in a Time of Climate Change
M. J. C. Crabbe……………………………………………………………………………………………………………250
Perceived Organizational Support, Job Satisfaction and Employee Performance: An Chinese Empirical
Study
R. T. Miao, H.–G. Kim………………………………………………………………………………………………………257
Exploring the Nature of Information Systems Development Methodology: A Synthesized View Based on a
Literature Review
D. Mihailescu, M. Mihailescu……………………………………………………………………………………………………265
Pricing Traditional Travel Agency Services: A Theatre-Based Experimental Study
G. Catenazzo, E. Fragnière……………………………………………………………………………………………………272
How Employees See Their Roles: The Effect of Interactional Justice and Gender
N. Ando, S. Matsuda……………………………………………………………………………………………………………281

Journal of Service Science and Management (JSSM)
Journal Information
SUBSCRIPTIONS
The Journal of Service Science and Management (Online at Scientific Research Publishing, www.SciRP.org) is published quarterly
by Scientific Research Publishing, Inc., USA.
Subscription rates:
Print: $50 per issue.
To subscribe, please contact Journals Subscriptions Department, E-mail: [email protected]
SERVICES
Advertisements
Advertisement Sales Department, E-mail: [email protected]
Reprints (minimum quantity 100 copies)
Reprints Co-ordinator, Scientific Research Publishing, Inc., USA.
E-mail: [email protected]
COPYRIGHT
Copyright©2010 Scientific Research Publishing, Inc.
All Rights Reserved. No part of this publication may be reproduced, stored in a retrieval system, or transmitted, in any form or by
any means, electronic, mechanical, photocopying, recording, scanning or otherwise, except as described below, without the
permission in writing of the Publisher.
Copying of articles is not permitted except for personal and internal use, to the extent permitted by national copyright law, or under
the terms of a license issued by the national Reproduction Rights Organization.
Requests for permission for other kinds of copying, such as copying for general distribution, for advertising or promotional purposes,
for creating new collective works or for resale, and other enquiries should be addressed to the Publisher.
Statements and opinions expressed in the articles and communications are those of the individual contributors and not the statements
and opinion of Scientific Research Publishing, Inc. We assumes no responsibility or liability for any damage or injury to persons or
property arising out of the use of any materials, instructions, methods or ideas contained herein. We expressly disclaim any implied
warranties of merchantability or fitness for a particular purpose. If expert assistance is required, the services of a competent
professional person should be sought.
PRODUCTION INFORMATION
For manuscripts that have been accepted for publication, please contact:
E-mail: [email protected]

J. Service Science & Management, 2010, 3, 181-185 doi:10.4236/jssm.2010.32023 Published Online June 2010 (http://www.SciRP.org/journal/jssm)
Copyright © 2010 SciRes. JSSM
181
The Research of Risk Management in Two Non-Independent IT System
Zhe Yin1,2, Yunfei Guo2, Maosheng Lai1*
1Department of Information Management, Peking University, Beijing, China; 2Mathematics Department, Yanbian University, Yanbian, China. Email: [email protected] Received March 30th, 2010; revised April 30th, 2010; accepted May 31st, 2010.
ABSTRACT
Enterprises use IT system in business sector/information management sector and production management sector on purpose of the operation, which, of course, is inseparable from risk management. Two non-independent risk estimates functions are hence founded in order to receive the information of risk easily, that is, the cash flow-based evaluation functions. Applying the logarithmic probability-distribution function in the estimates function as well as giving an ex-ample by simulating, this essay has explained the affection of the uncertain factors to the enterprise management such as the business treatment and so on. At last, it has commented the application of the estimates function in the risk man-agement. Keywords: IT System, Non-Independent, Risk Management, Logarithmic Probability-Distribution Function
1. Introduction
The role of IT in business activities has been more and more important; besides, the amount of its investment is also increasing. The key of operating businesses more effectively is to base on the operating principles and to play the role of IT systems. The application of IT sys-tems can not only apply to business operations and main- tenance, but also to social services and business competi-tion [1].
Japanese companies consulting firms Shigeru Inoue [2] 2000, proposed that the key of risk management is enter-prise risk quantification, so the introduction of IT syst- ems need to use the reorganization of business structu- res [3], and through the systematic of business processes to achieve business strategy and IT systems integration and quantification of organic. UNISYS Corporation To-shiaki Otsuka [4] also proposed risk management should go through the entire IT system development, testing and operation cycle. When meeting a bad objective environ-ment, not only should we reconstruct the system, but also give the risk management throughout the system life cycle.
In order to carry out the risk management of the chan- ges in the external environment [5], this article deals only with a risk quantification, to determine the percentage of operating losses, and to reduce risk through information sharing. First, the cash flow-based evaluation function which can reflect the values of IT systems is embodied;
and considered the effects of IT investments and risk prediction of two non-independent IT systems such as knowledge management systems and intelligence proc-essing systems. Knowledge management systems are the IT systems of the operational management levels, while intelligent processing systems for of IT systems which are for the purpose of knowledge discovery, personaliza-tion-depth study of levels.
This article gives the logarithmic probability distribu-tion function and proposes specific statistical methods of quantifying the risk. Ultimately, in order to adapt to so-cial changes in the external environment, the application of the evaluation function in the risk management is also discussed.
2. The Role of Information Sharing
As a manager of IT systems, there is need to analyze business strategy and decision-making, and to determine the system operators who will invest in IT systems and operators who can increase efficiency of the systems through the application of IT systems. The system re-sponsible for CIO and the CEO positions of different operators are unlikely to adopt the same evaluation sys-tems. In order to fully share information, using the same assessment system and the introduction of discounted cash flow method [6] are the preferred methods of eva- luation function. As the evaluation function, not only can

The Research of Risk Management in Two Non-Independent IT System 182
it reflect their own business performance, but also accu-rately can it reflect the risks to the business environment. Therefore, in order to be prepared to risk, it is also nec-essary to venture into visual (through statistical tables and charts) besides quantifying, which can achieve a more intuitive result.
3. The Cash-Flow Considered Evaluation Function
In order to show the effect of IT systems, we introduce the evaluation function (the cumulative efficiency), wh- ich is composed of the IT investment costs, income and value-added.
1
{ ( ) ( )
( )} ( , )
T
t
F I Cope t CR t
CG t f r t Opb Opi
(1)
where I: construction costs of IT systems; Cope(t): maintenance costs of IT systems; CR(t): reduced costs within the enterprise; CG(t): increased turnovers according to IT systems con-
struction; T: lifetime of IT system; Opb: added value of improving the business environ-
ment; Opi: reduction effect of business management risk; ( , )f r t : function of the current conversion efficiency (r =
risk rate, t = time); The main idea of constructing evaluation function F is
that the profit is equal to the difference between input and income. Besides, the risk rate will change with the change of the time .So F is a dynamic function.
and 1
( , )(1 )t
f r tr
(2)
When the purpose of IT investments in the market is to improve the enterprise’s competitive edge, the system values is mainly in terms of increasing the value of the amount of CG(t) and its business environment the added value of Opb. And when for the management purposes, the system performance in terms of cost reduction is in the amount of the value of CR(t). When in order to im-prove the business environment or to lay a good founda-tion for business environment, importing IT systems to reduce costs or improve enterprise efficiency does not work at all.
The role of IT systems can be changed as the business environment to reduce Opi (risk reduction) as its neces-sity. The value of Opb, Opi and t can be used as the ref-erence variable of the business environment, which can be quantified by using options and other methods.
4. An Empirical Analysis of Aisk Quantitative
4.1 Examples and Statistical Methods to Quantify the Risk
Take medium-scale IT systems as an example, cost of the project A has been shown in Table 1. Initial develop-ment costs are 1 million yuan, annual maintenance costs are 150,000 yuan, the annual loss of initial cost is 30%, an annual increase of turnover is 20%, and value-added based on customer satisfaction is 100,000 yuan. Assum-ing that IT system life are 7 years, the investment benefit evaluation function (expression (1)) = 1.1253 million yuan. Cost of the project B is shown in Table 2. There is no problem from quantity to consider, then how much will the risks be?
The risk of cumulative incremental value of operating benefits (expression (1)) can be expressed through the probability distribution function, according to Pareto dis- tribution theory, cumulative incremental value of operat-ing benefits meets the log-normal distribution. Suppose the best reduced cost per year of project A is 300,000 yuan, the minimum is 50,000 yuan, the maximum is 320,000 yuan, operational efficiency expectations is 200,000 yuan, the standard deviation is 50,000 yuan; he best reduced cost per year of project B is 200,000 yuan, the minimum is 65,000 yuan, the maximum is 250,000 yuan, operational efficiency expectations is 150,000 yuan, the standard deviation is 30,000 yuan, and the correlation coefficient of the two projects r = −0.2, the cumulative incremental value of operating benefits meets the log- normal distribution .
Table 1. Costing table of project A
Initial investment I 1 million yuan
maintenance costs s /year Cope 150,000 yuan
reduced costs within the enterprise /year CR 300,000 yuan
increased turnovers according to IT systems construction /year CG
200,000 yuan
risk rate r (%) 5%
added value of improving the business environment Opb
100,000 yuan
Table 2. Costing table of project B
Initial investment Ⅱ 600,000 yuan
maintenance costs s /year Cope 100,000 yuan
reduced costs within the enterprise /year CR 200,000 yuan
increased turnovers according to IT systems construction /year CG
150,000 yuan
risk rate r (%) 4%
added value of improving the business environment Opb
60,000 yuan
Copyright © 2010 SciRes. JSSM

The Research of Risk Management in Two Non-Independent IT System 183
According to expression (1), the 7-year total cumula-tive increment economic benefits of project A is 60,230 yuan, 160,748 yuan and 177,280 yuan respectively when the reduced cost of project A is 50,000 yuan, 300,000 yuan and 320,000 yuan, respectively, and the corresponding natural logarithm, is, respectively, −1.79558, 2.77725 and 2.875145. The standard deviation of normal distribu-tion ln (5) = 1.600; the 7-year total cumulative increment economic benefits of project B is 5,514 yuan, 92,286 yuan and 126,143 yuan respectively when the reduced cost of project B is 65,000 yuan, 300,000 yuan and 320,000 yuan, respectively, and the corresponding natu-ral logarithm, is −0.5953, 2.22 and 2.5348, respectively, The standard deviation of normal distribution ln (3) = 1.100.
The logarithmic of cumulative incremental of economic benefits of project A in the interval [−1.79558, 2.875145] meets the normal distribution, and the logarithmic of cu- mulative incremental of economic benefits of project B in the interval [−0.5393, 2.5348] also meets the normal distribution. We need only to find the probability of color part in (Figures 1 and 2).
From
2u t /2
( ) [( ) / ],
1
2
p x u u
u e dt
( )
We can obtain
( 1.79558 0) {1 ( 2.1590)}
{1 ( 2.875145)}
{1 [(2.1590-1.0795)/1.6]}
{1 [(2.875145-1.0795)
p X p X
p X
/1.6]}
{1 0.8686} {1 0.9582}
=0.0896
Similarly, we can obtain
(0.5393 0) 1.234 0.7
0.8888 0.758
13.8%
p Y
We can see that the probability that the logarithm of benefit evaluation function of project A takes a negative value is 8.96%, that is, the probability of investment losses is 8.96%; the probability that the logarithm of benefit evaluation function of project A takes a positive value is 91.04%, that is not difficult to find the probabil-ity that investments can yield results is 91.04%; the pro- bability that the logarithm of benefit evaluation function of project B takes a negative value is 13.08%, that is, the probability of investment losses is 13.08%; the probabil-ity that the logarithm of benefit evaluation function of project B takes a positive value is 86.92%, that is not difficult to find the probability that investment can bear fruit is 86.92%.
0.4
0.35
0.3
0.25
0.2
0.15
0.1
0.05
0
Prob
abil
ity
-5 0 5
Logarithmic of cumulative incremental of economic benefits of project A
Figure 1. Normal distribution of project A
0.4
0.35
0.3
0.25
0.2
0.15
0.1
0.05
0
Prob
abil
ity
-5 0 5
Logarithmic of cumulative incremental of economic benefits of project B
Figure 2. Normal distribution of project B
Finally, we proceed to study the risk of the two project,
that is the risk situation of X Y . The two projects A and B are relevant, we can see that the pdf (probability density function) of Z X Y
2
2 22 2
2 2
1
2 2
X X Y Y
x a b
r
Z
X X Y Y
p x er
,
where 2 2, ~ , ; , ;X YX Y N a b r
Copyright © 2010 SciRes. JSSM

The Research of Risk Management in Two Non-Independent IT System 184
Proof
Since 2 2, ~ , ; , ;X YX Y N a b r
2
2
2 2
2 2
1,
2 1
1 exp
2 1
2
X Y
X YX Y
p x yr
r
x a x a y b y br
2
2
2 2
2 2
1
2 1
1 exp
2 1
2
Z
X Y
X YX Y
p xr
r
z a z a x z b x z br dz
Let and v x a b u z a We can obtain that
2
22
2 2
2
1 exp
2 1
2
1
2 1
X YX Y
Z
X Y
r
u v u v uur
p xr
du
Besides
22
2 2
2 2 22
2 2 2 2
2
22
X YX Y
X X Y Y X Y
X Y X Y Y
u v u v uur
r vu uv
r
2 2
2 2
2
2
2
X X Y Y
X Y
X Y
Y X X Y Y
ru
rv
r
2 2
2 2
1
2X X Y
v r
r Y
Let
2 2
2
21
1
X X Y
X Y
rt u
r
Y
2 22
X Y
Y X X Y Y
rv
r
So
2
2
2 2
22 2
exp2 2
2 2
tX X Y Y
Z
X X Y Y
p
v
rx e dt
r
Since v x a b and
2
2 2t
e dt
2
2 22 2
2 2
1
2 2
X X Y Y
x a b
r
Z
X X Y Y
p x er
So ( ) 1.0795 0.7622 1.8417E X Y EX EY
2 22
1.96 2 0.2 1.6 1.1 1.21
1.57
X Y X X Y Yr
p( 2.39088 0)
2.70 1.17
0.9965 0.8770
11.95%
X Y
4.2 Result Analysis
You can see risks reduce when the two projects relevant negatively from the above example, without considering the effects of environmental change, risk reduction OPi. Future research should take Opi into account. In particu-lar, with the case of the recent stock market volatility of the situation, the importance of risk management has received considerable attention. Risk management can be divided into the direct decision-making opportunities for risk management and indirect risk management whose profit has nothing to do with direct one. Both are closely linked into enterprise efficiency and business. The pro-motion of local management capacity can play through regional or global risk management into operations ac-tivities. As long as we handle of relations between local interests the global economic correctly, the objectives can be achieved by sharing resources, reducing risk, and the best operation and management purposes.
5. Conclusions
Investment in IT systems is the key to quantifying of the economic indicators during the application. Since the
Copyright © 2010 SciRes. JSSM

The Research of Risk Management in Two Non-Independent IT System
Copyright © 2010 SciRes. JSSM
185
top-down management style, is very difficult to forecast the future assessment of corporate efficiency, this paper presents the loss probability calculation method of risk quantification and easily sharing of risk information me- thod. (Figure 1, Figure 2) can play a function of profit and loss evaluation of the effectiveness of visualization. Future research purpose is the establishment of IT inve- stsment and run-time system, real-time investment eva- luation system in order to reduce investment risks.
REFERENCES [1] R. L. Nolan and F. W. Mcfarlan, “Information Technol-
ogy and the Board of Directors,” Harvard Business Re-
view, Vol. 83, No. 10, 2005, pp. 96-106.
[2] S. Inoue, “Risk Management,” Unisys Technology Review, Vol. 67, No. 6, 2000, pp. 100-119.
[3] J. F. Sowa and J. A. Zachman, “Extending and Formalizing the Framework for Information Systems Architecture,” IBM System Journal, Vol. 31, No. 3, 1992, pp. 590-616.
[4] T. Otsuka, “Software Testing Technology,” Unisys Tech-nology Review, Vol. 93, No. 8, 2007, pp. 70-88.
[5] J. Liu, “Introduction to Risk Management [M],” China Financial Press, Beijing, September 2005.
[6] T. L. Patton, J. F. Wang translated, “Enterprise Risk Ma- nagement\CFO Management & AMP; Products [M],” China Renmin University Press, Beijing, 2007.

J. Service Science & Management, 2010, 3, 186-197 doi:10.4236/jssm.2010.32024 Published Online June 2010 (http://www.SciRP.org/journal/jssm)
Copyright © 2010 SciRes. JSSM
Modeling Customer Reactions to Congestion in Competitive Service Facilities
Mohammad Saidi-Mehrabad, Ebrahim Teimory, Ali Pahlavani*
Department of Industrial Engineering, Iran University of Science and Technology, Tehran, Iran. Email: [email protected] Received February 16th, 2010; revised March 21st, 2010; accepted April 25th, 2010.
ABSTRACT
This paper reviews classic approaches for modeling customers’ choice behavior in competitive facility planning prob-lems. They are either deterministic or probabilistic and work by a utility function based on some factors whether cus-tomer-independent or dependent. This paper focuses especially on congestion, the most important factor in customer to service or fixed-server systems. Various behaviors which customers may divulge when they face with a congested facil-ity are extensively studied. We also define a new congestion-sensitivity reaction which has not been considered in the literature. Relevant modeling approaches are proposed to formulate customers-sensitivity to congestion. An illustrative example is also given to analyze and compare the proposed approaches. Keywords: Competitive Planning Models, Customers’ Choice Behavior, Congestion, Waiting Time
1. Introduction
A large part of planning problems which ask for firms’ location and pricing decisions occurs in a situation in which there exist other facilities providing the same or homogonous service or product. In the relevant models, planner aims to devise the better alternatives for a firm competing for customers’ purchasing power with other firms. For example, the problem of locating shop centers, banks, ATMs, super-markets and restaurants could be modeled using this paradigm [1]. This problem known as competitive facility location model maximizes market share, revenue or profit.
Prior to coming to a decision using the model, it is re-quired to determine how customers behave or how they decide to choose a facility and furthermore what is their expected expenditure.
There are two main categories on retail facilities choi- ce models: descriptive-determinist approach and explica-tive-stochastic approach.
Descriptive approaches are based on observation. They rely on unreal assumptions such as customers choose the closest facility. Most classic location problems such as p-median [2] and MCLP [3] are often formulated based on this assumption. Hotelling [4] was the first on study-ing a competitive location planning model using a de-scriptive approach. MAXCAP [5] is a well known com-petitive location problem based on this approach. Cus-tomers’ purchasing power is distributed among different
facilities according to a deterministic or zero-one ap-proach which is called also full capture [6]. In this case, the whole demand of a customer is captured by a facility which is the best for him/her according to a utility func-tion. Conventionally, the utility function is defined based on only distance or travelling time. This is true when differences between facilities are negligible, or in areas where shopping opportunities are few and transportation is difficult [7]. In many cases however, facilities are mul-tiform, i.e., they do differ in other aspects than the mere site where they are located, and customers will take these differences into account in the way they feel attracted to them [8].
In the explicative approach for formulating customers’ behavior, historical information is implemented to com-prehend dynamics of retail selling competition and how customers choose purchasing opportunities. Spatial in-teraction model as the most important branch of the ex-plicative approach is first developed by Huff [9]. Spatial interaction is the process whereby entities at different points in physical space make contacts, demand/supply decisions or locational choices [10].
Spatial interaction models postulate that customers compare alternatives based on their evaluation of the total utility of the facility and not merely on its location. Huff argued that when customers have several alterna-tives, they may consider visiting different facilities rather than restricting their patronage to only one facility. Based

Modeling Customer Reactions to Congestion in Competitive Service Facilities 187
on this claim, Huff coined his idea that assumes the cus-tomers’ behavior to be probabilistic rather than determi-
nistic. He defined a utility function as 2.j ijA d where A
is the facility’s attraction measure and d is the distance to the facility and β2 is the sensitivity of customers to dis-tance. In his model, the probability of patronizing facility j by customer i (xij) is determined as
2
2
., ,
.ij j ij
ijik k ik
k E k E
u A dx i N j E
u A d
(1)
where the denominator of Equation (1) sums up the utili-ties of customer i from all facilities (E).
As a result, if there are Di customers resided at demand point i, the expected number of customers visiting facil-ity j will be
. , ,ij i ijE D x i N j E (2)
Later, the inclusion of other characteristics in Huff's model originated other models. According to [11], char-acteristics of a retail facility could be categorized into two groups. The characteristics included in the first group are independent of customer’s origin (e.g. product quality, price, facility’s convenience level and its size). The other group includes characteristics that are depend-ent on the customer’s origin such as distance or travelling time.
By a Multinomial Logit model [12], the above prob-ability is given as the following.
exp( ), ,
exp( )ij
ijik
k E
Vx i N j E
V
y a central planner.
(3)
where Vij is the utility perceived by customer i from fa-cility j. Conventionally, this utility is expressed as a lin-ear additive function of facilities’ characteristics.
As pointed before, in addition to distance there are other criteria affecting customer’s choice behavior. Au-thors in [13] developed a competitive location and design model in which customers decide based on distance and some other design variables. These may be quality, con-gestion level or offered price. Among them, congestion is very important especially in a competitive service market. In the service sector, customers’ impatience to being served has been considered as a main issue of competi-tive advantage. Convenience in terms of service speed is usually accounted for premier on price. In this atmos-phere, a competitor will succeed if it responses fairly to this requirement.
Customers divulge their impatience by reacting to the level of congestion at facilities. For service-to-customer systems, the congestion is reflected to customers by wai- ting time or response time and for customer-to-service systems it is measured by waiting time or system occu-
pancy level. For a competing firm that plans to maximize its market
share, the congestion should be taken into account as a main customer’s choice criterion. A considerable part of the literature is devoted to an approach by which cus-tomers consider the congestion of facilities at their ori-gins. In this approach, it is assumed that customers know facilities’ congestion level at the beginning and decide a facility or a set of facilities based on a measure such as mean waiting time or mean occupancy level and/or total admissions. It has been extensively studied by various researchers.
For instance, Lee and Cohen [14] studied the existence and uniqueness of equilibrium demand for service facili-ties serving congestion-sensitive customers. Congestion is considered by customers in their initial decisions. In [15] MAXCAP model is improved to include waiting time as a customers’ choice criterion along with travel-ling time. However it utilizes a deterministic choice ap-proach and assumes all facilities to be single server. A multi-server facility location problem was developed [16] in which customers’ demand is distributed according to a Multinomial Logit model based on travelling and waiting time. There have been also some simultaneous optimization models. A simultaneous location and capac-ity optimization model is presented for a competitor in a market with customers considering the mean waiting time in their initial choices [17]. Aboolian et al. [18] presented a competitive web server location and design problem in which customers make choice based on the difference in expected response times between new and old facilities. Demand elasticity to congestion has been also studied in facilities planning issues [14,19]. In a dif-ferent approach [20], the author formulated a model for locating multiple-server, congestible facilities. He de-fined demand to be elastic to travelling time and also system occupancy level. However the customers' alloca-tion is deterministic b
This paper criticizes the common approach for model-ing congestion-sensitivity of customers involved in a competitive service market. We study the obvious reac-tions of customers that face by congested facilities. We also develop five different approaches for formulating such reactions in competitive planning models. Except one approach that presents a learning process on conges-tion level, the other approaches follow a two steps frame- work. In the first step customers decide probabilistically based on a utility function depending on distance and offered price. In the second step they take congestion into account and determine whether to patronize a facil-ity or not. The manner how they react to the congestion defines the behavior.
The rest of the paper is organized as follows. Section 2 describes our proposed frameworks for modeling cus-tomers’ reactions to congestion. Section 3 gives some
Copyright © 2010 SciRes. JSSM

Modeling Customer Reactions to Congestion in Competitive Service Facilities 188
experimental results on the models and finally Section 4 concludes the paper and proposes future research issues.
2. Our Modeling Frameworks
Suppose that the market is a network that includes some nodes (N = {1, 2, ..., n}) as demand origins and also as potential facility sites. Let E ⊂ N (|E| = q) be the set of our firm's facilities and E' ⊂ N (|E'| = q') be the set of other competitors’ facilities. There are also some edges (G) each of them indicates the availability of a direct path between two nodes. The network is in a metric space equipped with distance d being the shortest path distance.
Without loss of generality, it is assumed that custom-ers arrive from multiple infinite sources according to a Poisson process with mean demand generating rate
,i i N . They are served with FIFO discipline in fa-
cilities which utilize m servers all with exponentially distributed service time with mean 1/μ. Buffer volume of each facility is also limited to K. We have the following performance indicators:
(Utilization factor) / (4)
(Mean queue length) (5) ( ) PK
nn mL n m
r
(Mean waiting time) /w L (6)
where λ is the arrival rate of a facility and defined as the sum of demand generating rates of demand nodes pa-
tronizing the facility, is the effective arrival rate and Prn is the probability that there are n customers at a facil-ity. This probability is a function of the arrival rate, λ and is defined according to the structure of queuing system.
With the conventional approach for formulating cong- estion-sensitivity as explained in Section 1, customers consider all criteria simultaneously and they have to make a definite decision on destination facilities when they are at their origins. The planner assumes that they cannot deviate from their initial decisions. Obviously this is not a real adaptation from human decision making. Since customers usually follow a changing mood and moreover don’t know all criteria simultaneously, they follow a sequential decision making process.
Whether they employ a simultaneous or sequential de-cision making, the probability distribution of their de-mand should be determined.
We define this probability according to Multinomial Logit model [12] as
, ,ij
ik
c
ij c
k E E
ex i N j E E
e
(7)
where υ is a parameter defined as / 6 , and σ is the standard deviation in taste of the customers [16]. The dispersion in facility choice increases with smaller values
for υ resulted from higher values of σ. The main indicator of the probability is the cost in-
curred by customers to being served, cij. The determining factors of this cost may differ for different customers.
The manner through which the congestion is included in customers’ choices is the main issue considered by this paper. We describe different reactions of customers to congested competitive facilities and present appropriate approaches to determine the effective arrival rates of facilities and the firms’ market share.
2.1 Customers are Insensitive to Congestion
For the case which the arriving customers are not con-gestion-sensitive, cij in Equation (7) is defined as the sum of offered price and cost of travelling time to the facility.
. , ,ij ij ijc p f t i N j E E (8)
where tij is the travelling time between nodes i and j, pa-rameter f is the cost of unit time and pij is the service price offered by the facility located at j to customer i.
We have the following term for the effective arrival rate of facility j.
1
. ,n
j j i iji
x j E E
(9)
2.2 Customers Revise their Decisions According to their New Observations on Waiting Times
In this case the congestion level is stated by mean wait-ing time. It is assumed that customers initially don’t know anything about waiting time levels in a new estab-lished facility and they cannot foreknow congestion level. Therefore, at their first trip they choose facilities based on factors other than congestion. Their experienced wait- ing times are included in their second trip. This process will be continued until an equilibrium demand distribu-tion is found.
Therefore cij is defined as the sum of offered price, cost of travelling time to the facility and cost of waiting time at the facility.
.( ), ,ij ij ij jc p f t w i N j E E (10)
where wj is the mean waiting time of facility j according to Equation (6). The effective arrival rate in this case will be as the following
(1 Pr ),j j K j E E (11)
where K is the maximum capacity of the system and probability PrK denotes the probability that there are K customers at the facility. The state probabilities of the considered queuing system are computed according to [21] as
Copyright © 2010 SciRes. JSSM

Modeling Customer Reactions to Congestion in Competitive Service Facilities 189
Prk
0
0
Pr !
Pr !
0
k
k
k m
for k mk
for m k Km m
for k K
(12)
1
01 1
Pr 1! !
n mn mm K
n n mn m m
(13)
By this approach, it is assumed that at the first usage of network after a new facility’s establishment or net-work redesign, the mean waiting times of facilities are not known to the customers and their renewed knowl-edge about waiting time levels affects their next choices. To formulate this framework, we present a procedure with the following steps:
1) Set t = 0 and E , ( ) 0,tjw j E
2) Compute ( ).( ), ,t tij ij ij jc p f t w i I j E E ,
3) Compute , ,tijx i I j E E using Equation
(7),
4) Compute the arrival rates as ( 1)
1. ,
nt tj i iji
x
j E E and the effective arrival rates using Equa-
tion (11),
5) Compute E using Equation (6), ( 1) ,tjw j E
6) Check convergence condition. If it holds, stop with the current arrival rates else set t = t + 1 and go to step 2. Convergence is reached when the value of two succes-sive results for ,j j E E become close together,
i.e., ( 1) ( )t tj jj E E
, where ε is a nonnegative
small real number. Since the approach assumes that decisions made by
competing firms change the congestion level and the cus- tomers need to learn how to apply it in their choices, it better suits with decision making situations which highly affect the congestion level. Therefore it is efficient for competitive location and design planning models rather than pricing models.
2.3 Customers Balks from Entering the Facility When they Arrive
Similar to Subsection 2.2, it is assumed that customers initially don’t know anything about the congestion level of facilities. However they never consider congestion at their origins but behave in a sequential manner. At the first step they decide based on the sum of offered price and cost of travelling time i.e.
. , ,ij ij ijc p f t i N j E E (14)
At the second step, they react to the congestion when they arrive at a facility. As stated in [20], in the case of non-essential services, some of the arriving customers will choose not to wait if they see a long queue, i.e., they balk from waiting in the queue. We define a parameter β [0,1] which accounts for the decrease of the demand with respect to the system’s occupancy level faced by the customer.
Parameter βk is the percentage of the customers willing to wait in the queue given that k other customers are at-tending in the facility. It is defined as
max(0; )1
0k
k mif k K
K motherwise
(15)
where m is the number of servers and K is the maximum possible capacity of the facility. A typical instance for balking function for m = 2 and K = 10 is given in Figure 1.
With xij defined by Equations (7) and (14), the per-centage of customers i that patronize facility j and joins the queue, given that there are k other customers in the facility, is
. . , , , 1, 2,...,ijk k i ijx i N j E E k K (16)
As a result, the effective arrival rate of facility j would be as the following:
1 1 0
1 0
.Pr ( )
.Pr ( ). . ,
n n K
j ij ijk k ji i k
n K
k k j i iji k
x j E E
(17)
where λj is defined as
1
. ,n
j i iji
x j E E
(18)
The state probabilities (Prk) of the system are derived according to death and birth flow diagram [21] as the following,
Number of customers
Bet
a (C
aptu
red
Per
cent
age)
0 1 2 3 4 5 6 7 8 9 10 11 12 13 14 15
10.90.8
0.7
0.6
0.50.4
0.3
0.20.1
0
Figure 1. A typical balking function
Copyright © 2010 SciRes. JSSM

Modeling Customer Reactions to Congestion in Competitive Service Facilities 190
0
1 20
0Pr ,!
...Pr Pr ,
!
0
n
nn n m
n n m
n mn
m n Km m
n K
(19)
1
1 20
0 1
...1Pr
! !
nm Kn n n m
n mn n mn m m
(20)
2.4 Joined Customers Renege from Waiting
In the previous case, it is assumed that all the customers that join the queue stay until served by a server. However, it is also possible for an impatient customer to depart the queue, i.e., he/she may renege from waiting. In this case, after joining the queue each customer will wait a certain length of time to being served. If the service has not be-gun by then, he/she departs. This time is a random vari-
able whose density function is ( ) tr t e . Consequ-
ently, the effective arrival rate will be as the following:
1 0
. .Pr ( ). .n K
j k k k j i iji k
R x
(21)
where λj, βk, γi and xij are the same as Subsection 2.3 and Rk is the probability that a new arrived customer will survive to be serviced given that there are k customers in the facility on arrival and given that it joins. In [22] it is proved that
1kRk m
(22)
where .m
.
The state probabilities are derived according to death and birth flow as the following,
0
1 20
0Pr ,!
...P r Pr ,
! ( 1)
0
n
mn m n n m
nn m
n mn
m n Km
n K
(23)
1
1 20
0 1
...Pr
! ! ( 1)
n mm Kn m n n m
n n m n mn m
(24)
where / .
2.5 Balked or Reneged Customers may Veer from their Initial Destinations
In the case of essential services or a fierce competitive market, the balked or reneged customers may go directly to another facility rather than coming back to their origins, i.e., they veer and deviate from their initial decisions. In this case the second facility would indirectly capture their de-mand. We assume that customers do such upturns only for one cycle due to travelling time and cost issues.
Figure 2 illustrates the two situations in a simple net-work where there is a single demand node with four cust- omers and three facilities are serving them. Initially three customers choose to patronize facility F1 and one of th- em chooses facility F2 (Figure 2(a)). Because of unbea- rable congestion at facility F1, the customers balk or re-nege from waiting and return to their origins (Figure 2(b)). But this is not the case for all situations. They may go di-rectly to another facility close to facility F1 with the aim of being served in a less congested facility (Figure 2(c)).
We need to determine the percentage of customers
which may divulge such behavior. Assume that Pr Bl
is the balking prob-
ability for the customers interested initially in facility l
and
0(1 ).Pr ( ),
K
k k lkl E E
0Pr .(1 ).Pr (
KRl k kk
R
),k l l E E is the
reneging probability for them. To reflect the veering be-havior in the model, we also define a variable zlj which stands for the probability that a customer balked or re-neged from facility l, will choose facility j. This proba-
Figure 2. An example for comparison of two congestion- sensitivity manners: (a) Customers dispatching from the demand node; (b) customers balk or renege and return to their origins; (c) Some of balked or reneged customers go to another facility (veer)
Copyright © 2010 SciRes. JSSM

Modeling Customer Reactions to Congestion in Competitive Service Facilities 191
bility depends on the difference of prices offered by two facilities and travelling time between them as follows:
(1 / ). , , ,lj
lk
c
lj l m c
k E E
ez Q d l E E k j
e
l
j
(25)
. , , ,lj ij il ljc p p f t j l E E l (26)
where dm is the maximum distance between two nodes in the network and Ql is the centrality index for facility l. It is defined as
,' 1
ljj l
l
d
Q lq q
E E (27)
We implement the centrality index to determine how far the facility is from other facilities, i.e., the density of network’s areas. The density measure is utilized to define what part of balked or reneged customers from a facility will go to other facilities. For a facility established in a dense area, the probability that a balked or reneged cus-tomer will go directly to another facility will be higher than that for sparse areas. Figure 3 illustrates the effect of centrality index for the example depicted by Figure 2.
2.5.1 Only Balked Customers Choose to Go to Another Facility
In this case, the arrival rate could be partitioned into two parts, one part for directly captured demand and another one for indirectly captured demand of balked customers. Therefore, Equation (18) becomes
1
. .Pr . ,
l j
nB
j i ij il l lji l E E i N
x z j E E
(28)
Figure 3. An example illustrating the effect of centrality index: (a) Facility F3 is closer to F1 and larger part of balked or reneged customers decide to go to F3; (b) Facility F3 is farther to F1 and smaller part of them decide to go to F3
The effective arrival rate in this case is the same as Equation (17) where probabilities Prk are computed using Equations (19)-(20).
2.5.2 Both Balked and Reneged Customers Choose to Go to Another Facility
In this case, the arrival rate could be partitioned into three parts, the first part for directly captured demand, the second part for indirectly captured demand of balked customers and the third part for indirectly captured de-mand of reneged customers.
Therefore, Equation (18) becomes
1
. .Pr .
.Pr . ,
l j
l j
nB
j i ij il l lji l E E i N
Ril l lj
l E E i N
x z
z j E E
(29)
The effective arrival rate in this case is the same as Equation (21) where probabilities Prk are computed from Equations (23)-(24).
Obviously, the right-hand side of Equations (28) and (29) is a function of λjs ( j E E ). Therefore, it can be
written as a system of equations,
( ),j j E E
(30)
where
is the vector of facilities’ arrival rates. Since (.) is a non-linear function and there are (q + q') facili-
ties, Equation (30) indicates a non-linear system of (q + q') equations and (q + q') variables.
For solving this system of equations we employ a pro-cedure similar to fixed point iteration approach [23]. This procedure has the following steps:
1) Compute , ,ijx i N j E E using Equations
(7) and (14);
2) Set t = 0 and ( ) 0t
. Compute ( )Pr ( ),tk j k
0,1,2,..., K using Equations (19)-(20) or Equations (23)-(24);
3) Compute using Equation (28) or (29); )( )(tj
4) Compute a new value
)().1(. )()()1( ttt
, 10 (31)
where Γ is the vector of right hand side functions of Equation (28) or (29), (.) and θ is a problem-depen-
dant factor. 5) Check the convergence condition. If it holds, stop
with the current solution else set t = t + 1 and go to step 3. Convergence is reached when the value of two su-
ccessive results for
become close together i.e.
)()1( tt
, where ε is a nonnegative small real
number.
Copyright © 2010 SciRes. JSSM

Modeling Customer Reactions to Congestion in Competitive Service Facilities
Copyright © 2010 SciRes. JSSM
192
Having defined the possible reactions of impatient customers in congestible facilities, we can analyze them in a competitive planning model. The utilized measure for this purpose is the market share of firms or their fa-cilities. However, other measures could also be derived. The market share of our firm is defined as
1
/n
j ij E i
MS
(32)
In the next section we test the approaches through an illustrative example.
3. An Illustrative Example
Suppose that an area is formed as a network that includes 50 demand nodes. Three firms are competing with each other for customers’ purchasing power. They have just established some facilities. The deployment outline of the demand nodes and also the firms’ facilities is exhib-ited by Figure 4.
Note that all nodes in the network indicate a demand node. An oval node indicates that a facility of firm 1 has
been located in that node. A square node indicates that a facility belonging to firm 2 has been established in the node and a diamond node shows a facility of firm 3. The circles show the demand nodes with no established facility.
The length of available direct paths in the network is known and the shortest distance between each pair of nodes could be determined.
Table 1 gives the demand generating rates for demand nodes. Table 2 gives the queuing parameters for the competing firms. The price charged for customers is as-sumed to be p = 12, the same for all three firms. The val-ues for other parameters are given in Table 3.
Now we apply different congestion-sensitivity reac-tions and their relevant modeling approaches on the de-fined problem. The obtained results are given in Table 4. The table gives the market share of competing firms and their facilities from demand nodes. The last column gives the percentage of total captured demand of the market. Table 4 illustrates also the results for the case which disregards congestion effects (Subsection 2.1). It is given only for comparison purposes.
Figure 4. An outline of the market area in the example
Table 1. The nodes’ demand generating rates
Node Rate Node Rate Node Rate Node Rate Node Rate
1 1.2 11 3.9 21 1.9 31 1.1 41 3.8
2 1.7 12 1.8 22 2.7 32 4 42 3.7
3 4.1 13 4 23 1.2 33 2.3 43 0.1
4 1.5 14 0.8 24 1.1 34 2.1 44 4
5 3.3 15 0.7 25 1 35 2.4 45 1
6 2 16 1.5 26 2.2 36 1.5 46 2.6
7 1.5 17 1.7 27 0.9 37 2.9 47 2.2
8 0.8 18 1.3 28 1.7 38 1.7 48 1.3
9 3.1 19 0.7 29 0.1 39 0.4 49 3.3
10 2.8 20 1 30 2.3 40 1.2 50 0.2
Table 2. The queuing specifications of the firms
Firm Number of Facilities Facility Nodes (No. of Servers) System Capacity (K) Service Rate (μ)
Firm 1 2 37 (2), 39 (3) 10 5
Firm 2 7 2 (2), 11 (1), 14 (2), 21 (2), 34 (1), 38 (1), 45 (3) 8 4
Firm 3 2 4 (2), 29 (2) 15 5

Modeling Customer Reactions to Congestion in Competitive Service Facilities 193
Table 3. Other parameters of the network
Measure Value
Customers’ behavior uniformity (υ) 0.1
Cost of travelling and waiting time (f) 1
Reneging rate (α) 5
As it can be seen from Table 4, in the cases which
customers are congestion-insensitive or decide at origin based on their knowledge on waiting time levels, the whole available demand of the market is captured. This is because that; in these two cases the customers don’t escape from congestion but accept it as a usual phe-nomenon.
The case of “Balking and reneging” results in the least market capture because the congestion-sensitive or impa-tient customers leave highly congested facilities and re-turn to their origins. When a part of those leaving cus-tomers doesn’t return and decides to being served by other facilities, the overall capture increases. This is re-flected by “Balking, reneging and veering” case. A simi-lar analysis could be stated for “Balking” and “Balking and veering” cases.
It is interesting to note that facility F2 of firm 1 cap-tures maximum share of the market except for conges-tion-insensitivity case. This is because of its better loca-tion and also its larger number of servers. In the contrast, facility F2 of firm 2 captures the minimum share of the market except for congestion-insensitivity case. This is because that it has only one server and its system capac-ity and service rate are smaller than other facilities. In the congestion-insensitivity case, since the congestion effect is disregarded, the only parameters affecting customers’ behavior are price and facilities’ location. Since price is assumed to be the same for all facilities, their locations play the main role in determining market share. There-fore it is expected that a facility located at a dense area would capture a larger share of the market.
In the second set of experiments we analyze the effect of different parameters such as the default number of servers, mean service rate and system capacity on the firms’ market shares. The results are given by Figures 5-8.
Figure 5 presents the analysis with respect to the firm 3’s mean service rate which changes by −80% to +80% (in steps of 40%) around its base value (µ0 = 5).
Table 4. The market share of firms and facilities (percentage)
Firm 1 Firm 2 Firm 3
Customer behavior
F1 F2 Total F1 F2 F3 F4 F5 F6 F7 Total F1 F2 Total
Overall Capture
Congestion-insensitive 9.3 9.9 19.1 9.1 8.7 7.9 10.0 9.8 9.7 8.8 63.9 8.0 8.9 17.0 100.0
Learning to revise 9.6 10.4 20.0 9.3 8.0 8.1 10.1 8.9 8.9 9.3 62.6 8.3 9.1 17.4 100.0
Balking 8.4 9.4 17.9 8.0 6.4 7.0 8.7 7.1 7.1 8.3 52.4 7.6 8.4 16.0 86.3
Balking and veering 9.4 10.6 20.0 8.7 7.0 7.7 9.5 8.1 8.0 9.1 58.1 8.2 9.2 17.4 95.4
Balking and reneging 7.4 9.0 16.3 6.7 4.3 6.0 7.2 4.7 4.6 7.8 41.2 6.6 7.2 13.9 71.4
Balking, reneging and veering
9.3 11.1 20.4 8.2 5.8 7.5 9.0 6.9 6.9 9.4 53.7 7.8 8.8 16.6 90.8
(a)
(b)
Copyright © 2010 SciRes. JSSM

Modeling Customer Reactions to Congestion in Competitive Service Facilities 194
(c)
(d)
(e)
Figure 5. Sensitivity of firms’ market share to the change in mean service rate
Similarly, Figure 6 presents the analysis with respect
to the default number of servers for firm 3’s facilities and Figure 7 presents the analysis with respect to the default capacity of firm 3’s facilities.
Figure 8 shows the results of analyzing the effect of reneging rate of customers on the firms’ market share. We change its base value (α = 5) by −80% to +80% (in steps of 40%). This test could be applied only on two cases which deal with reneging customers.
We summarize our observations of the sensitivity ana- lyses as the following: From Figures 5 and 6, we conclude that more mar-
ket demand will be captured by firm 3 when the servers’ number assigned to its facilities or the mean service rate of its servers is high. The market shares of other firms decrease except for “Balking” and “Balking and reneg-ing” cases because in these two cases, the parameters and also the arrival rates of other firms are not changed.
(a)
(b)
(c)
(d)
(e)
Figure 6. Sensitivity of firms’ market share to the servers’ number
Copyright © 2010 SciRes. JSSM

Modeling Customer Reactions to Congestion in Competitive Service Facilities 195
The result achieved from analyzing the effect of sys-tem capacity (Figure 7) is similar to the mean service rate and servers’ number except for the case of “Learning to revise” in which a larger system capacity has a nega-tive effect on firm 3’s market share. This can be reasoned regarding the fact that a larger system capacity will cause longer waiting time. From Figure 8, we conclude that high reneging
rates lower the market share of all firms. The decrement slope in the case of “Balking and reneging” is high be-cause all reneged customers return to their homes. Variation of other parameters such as price, demand
rates and time to cost parameter has not considerable impacts on the final results.
(a)
(b)
(c)
(d)
(e)
Figure 7. Sensitivity of firms’ market share to the system capacity
(a)
(b)
Figure 8. Sensitivity of firms’ market share to reneging rate
Copyright © 2010 SciRes. JSSM

Modeling Customer Reactions to Congestion in Competitive Service Facilities 196
4. Conclusions and Future Research
In this paper we have considered customers' patronizing behavior in a competitive market. It has been concluded that the better approach for formulating customers’ cho- ice behavior in spatial competitive modeling is a prob-abilistic model based on three variables, distance, waiting time and price. With emphasis on congestion effects, we have also studied customers’ reactions to congested fac- ilities. These are especially balking, reneging and veering. This is the first paper considering congestion-sensitivity reactions in competitive congested systems and the first work studying veering as a usual event in congested sys-tems. By veering we mean the case in which after a cus-tomer balked or reneged from a facility, he/she may de-cide to patronize another facility rather than coming back to his/her origin.
Although the prevailing approach in the literature as-sumes that customers take congestion into account at their origins, it has been claimed that they initially don’t know a lot about facilities’ congestion level. Our pro-posed approaches retain customers unaware until they reach at the facilities. The first approach assumes that customers amend their future decisions according to the waiting time faced by them at the previous experiences. The four other approaches assume that customers react to the congestion when they reach at the facilities. They may balk, renege, veer or divulge a combination of them.
An illustrative example has also given to demonstrate differences between the outcomes of proposed ap-proaches. We have seen that congestion-sensitivity of customers has a considerable effect on the firms’ market share. Therefore, a much attention must be paid for for-mulating the congestion-sensitivity of customers in spa-tial planning models.
We have tried to study all possible reactions to the congestion. However, a special type of queues has been considered. It will be interesting to study other types of queuing systems.
REFERENCES [1] T. Drezner and Z. Drezner, “Finding the Optimal Solution
to the Huff Based Competitive Location Model,” Com-putational Management Science, Vol. 1, No. 2, 2004, pp. 193-208.
[2] S. L. Hakimi, “Optimum Locations of Switching Centres and the Absolute Centres and Medians of a Graph,” Op-erations Research, Vol. 12, No. 3, 1964, pp. 450-459.
[3] R. L. Church and C. ReVelle, “The Maximal Covering Location Problem,” Papers of Regional Science Associa-tion, Vol. 32, No. 1, 1974, pp. 101-118,
[4] H. Hotelling, “Stability in Competition,” Economic Jour-nal, Vol. 39, No. 153, 1929, pp. 41-57.
[5] C. ReVelle, “The Maximum Capture or Sphere of Influ-ence Location Problem: Hotelling Revisited on a Net-
work,” Journal of Regional Science, Vol. 26, No. 2, 1986, pp. 343-358.
[6] R. Aboolian, O. Berman and D. Krass, “Competitive Facility Location Model with Concave Demand,” Euro-pean Journal of Operational Research, Vol. 181, No. 1, 2007, pp. 598-619.
[7] M. D. Garcia Perez, P. F. Hernandez and B. P. Pelegrin, “On Price Competition in Location-Price Models with Spatially Separated Markets,” TOP, Vol. 12, No. 2, 2004, pp. 351-374.
[8] F. Plastria, “Static Competitive Facility Location: An Overview of Optimisation Approaches,” European Jour-nal of Operational Research, Vol. 129, No. 3, 2001, pp. 461-470.
[9] D. Huff, “Defining and Estimating a Trading Area,” Journal of Marketing, Vol. 28, No. 3, 1964, pp. 34-38.
[10] J. R. Roy and J. C. Thill, “Spatial Interaction Modeling,” Papers in Regional Science, Vol. 83, No. 4, 2004, 339- 361.
[11] A. Jain and V. Mahajan, “Evaluating the Competitive Environment in Retailing Using the Multiplicative Com-petitive Interactive Model,” In: J. Sheth, Ed., Research in Marketing, JAI Press, Greenwich, Vol. 2, 1979, pp. 217- 235.
[12] D. McFadden, “Conditional Logit Analysis of Qualitative Choice Behaviour,” In: P. Zarembka, Ed., Frontiers in Econometrics, Academic Press, New York, 1974.
[13] R. Aboolian, O. Berman and D. Krass, “Competitive Fac- ility Location and Design Problem,” European Journal of Operational Research, Vol. 182, No. 1, 2007, pp. 40-62.
[14] H. Lee and M. Cohen, “Equilibrium Analysis of Disagg- Regate Facility Choice System Subject to Congestion- Elastic Demand,” Operations Research, Vol. 33, No. 2, 1985, pp. 293-311,
[15] F. Silva and D. Serra, “Incorporating Waiting Time in Competitive Location Models,” Networks and Spatial Economics, Vol. 7, No. 1, 2007, pp. 63-76.
[16] V. Marianov, M. Rios and M. J. Icaza, “Facility Location for Market Capture When Users Rank Facilities by Shorter Travel and Waiting Times,” European Journal of Operational Research, Vol. 191, No. 1, 2008, pp. 32-44.
[17] A. M. Kwasnica and E. Stavrulaki, “Competitive Loca-tion and Capacity Decisions for Firms Serving Time- Sensitive Customers,” Naval Research Logistics, Vol. 55, No. 7, 2008, pp. 704-721.
[18] R. Aboolian, Y. Sun and G. J. Koehler, “A Location– Allocation Problem for a Web Services Provider in a Competitive Market,” European Journal of Operational Research, Vol. 194, No. 1, 2009, pp. 64-77.
[19] M. L. Brandeau, S. S. Chiu, S. Kumar and T. A. Gro- ssman, “Location with Market Externalities,” In: Z. Dre- zner, Ed., Facility Location, Springer-Verlag, 1995, pp. 121-150.
[20] V. Marianov, “Location of Multiple-Server Congestible Facilities for Maximizing Expected Demand, When Serv- Ices are Non-Essential,” Annals of Operations Research,
Copyright © 2010 SciRes. JSSM

Modeling Customer Reactions to Congestion in Competitive Service Facilities
Copyright © 2010 SciRes. JSSM
197
Vol. 123, No. 4, 2003, pp. 125-141.
[21] D. Gross and C. M. Harris, “Fundamentals of Queuing Theory,” 3rd Edition, John Wiley and Sons, New York, 2002.
[22] D. Q. Yue and Y. P. Sun, “Waiting Time of M/M/C/N Queuing System with Balking, Reneging, and Multiple
Synchronous Vacations of Partial Servers,” Systems En-gineering-Theory & Practice, Vol. 28, No. 2, 2008, pp. 89-97.
[23] C. T. Kelley, “Iterative Methods for Linear and Nonlinear Equations,” No. 16 in Frontiers in Applied Mathematics, SIAM, Philadelphia, 1995.

J. Service Science & Management, 2010, 3, 198-205 doi:10.4236/jssm.2010.32025 Published Online June 2010 (http://www.SciRP.org/journal/jssm)
Copyright © 2010 SciRes. JSSM
Employee’s Personality Traits, Work Motivation and Innovative Behavior in Marine Tourism Industry
Su-Chang Chen1, Ming-Chung Wu2, Chun-Hung Chen1*
1Department of Marketing and Logistics Management, National Penghu University, Penghu, Taiwan, China; 2Graduate Institute of Marine Creative Industry, National Penghu University, Penghu, Taiwan, China. Email: [email protected] Received March 30th, 2010; revised April 30th, 2010; accepted May 31st, 2010.
ABSTRACT
The purpose of this study is to understand the relationship among marine tourism employee’s personality traits, work motivation and innovative behavior. In order to meet this purpose, the study conducts questionnaire survey. Question-naire sample of 250 has been handed out and 215 valid samples have been collected. The results show that employees with higher intrinsic work motivation are more likely to generate innovative behavior. The compensation in extrinsic work motivation has a positive effect on employee’s innovative behavior. Intrinsic work motivation has mediated effect between personality traits and innovative behavior. Extrinsic work motivation has partial mediated effect between per-sonality traits and innovative behavior. Keywords: Marine Tourism Industry, Personality Traits, Work Motivation, Innovative Behavior
1. Introduction
Tourism has become one of the most important industries in the world, it was also called “industry without chim-neys”, and its economic influences are vital for many countries [1]. Based on 2007 world tourism analysis re-ports, global tourist numbers reached 898 million in 2007 and created US 7.06 trillion economic outputs, the in-come will account for 10.4% of the world’s GDP and 231 million people will be employed by the industry [2]. The tourism industry increasingly plays an important role in the global economic development. Taiwan’s global travel and tourism competitiveness was ranked 30th in the world, the total demand of tourism traveling industry reached US 3.789 billion, it contributed 4.51% to Tai-wan’s GDP and created five hundreds and thirty thou-sands job opportunities [2,3]. For many islands and coun- tries situated near sea, marine tourism is an important part in tourism industry, and it will compensate for Tai-wan’s inadequate land space for recreation by developing marine tourism.
Tourism industry is based on providing service and by contacting with customers to fully satisfy customers’ needs for goods or services, since works are completed by personnel workforces, and workforces are important assets for enterprises. Personnel are originators of inno-
vation, and they are the most precious resource in mod-ern enterprise. To encourage personnel transforming their creativity into practical innovative behavior has become a popular issue in recent years [4,5]. The business conti-nuity depends on its innovation of organizations; the creativity and innovation are the main innovation origin of the enterprises. If their employees can effectively execute their innovative behavior, it will help their en-terprises stand out of complicated business environment [6]. Earlier researches of innovative behavior were fo-cused on the discussion of personal creativity. However, personal creativity is just one part of personal innovative behavior, and innovative behavior starts from the creativ-ity of personnel, creativity helps the execution of innova-tive behavior [7]. Creativity and the personality traits of creator are mutually correlated, the relationship between personality traits and creativity was important research topic in the past [8]. The personality traits can considera-bly interpret the happening cause and forecasting on in-novative behavior [9]. However, it is not fully under-stood on the relationship between personality traits and innovative behavior in the past, this contributes to the research motive of this study. Work motivation is the composing element of creativity, they are correlated to some extent, and work motivation can be divided into

Employee’s Personality Traits, Work Motivation and Innovative Behavior in Marine Tourism Industry 199
intrinsic motivation and extrinsic motivation. Intrinsic motivation positively influences creativity, extrinsic mo-tivation is beneficial to the development of creativity in certain scenarios [10,11]. The creativity and innovative behavior of personnel are the main resources of enter-prise innovation, however, the innovative behavior of personnel will not generate automatically, and managers should give their employees appropriate work motiva-tions and further confirm the influence on their innova-tive behavior. It is hoped to offer references for man-agement in the industry. This study is to discuss what will affect innovative behavior by personality traits and work motivation; it is the second motivations of this study.
This research uses the employees of marine tourism industry in Penghu as the study target, and it is hoped to understand how personality traits and work motivation affect the innovative behavior.
2. Literature Review and Hypothesis
For many islands and countries situated near the sea, ma- rine tourism is always an important contributing compo-nent for tourism industry, the growth of marine tourism industry is faster than other tourism industries [12]. The related business include vocation resort, hotels, ferries, beaches, seabed tourism ship, yacht business, promenade sightseeing, swimming and diving equipment, fishing e- quipments, equipment leasing, ferry and cruise business, souvenir sell [12]. This research assumes that marine tourism industry should include all the recreational ac-tivities subjected by marine environment such as traffic, dinning, hotels, traveling, recreation, entertainment and other related industries, it includes those recreational activities that involve travel away from one’s place of residence.
2.1 The Relationship between Personality Traits and Innovative Behavior
Among the theory of personality traits, Costa, McCrae& Busch congregate many views of personality traits, their proposed personality traits are widely accepted [13]. The agreeableness, conscientiousness, extraversion and neu-roticism of personality traits can considerably interpret the happening cause and forecasting on personal behav-ior [14,15]. However some researchers indicated that if there are too many extrovert personnel in a team, it will have an adverse effect. While each does things in his way, it will be adverse to the achievements of a team [16].
Based on above literatures, this study proposes the hypothesis:
H1: The personality traits of the marine tourism per-sonnel have a significant influence on their innovative behavior.
2.2 The Relationship between Personality Traits and Work Motivation
Amabile et al. (1994) divided personality traits into six-teen types according to Myers-Briggs Type Inventory (MBTI) [17], it is found that personnel with extrinsic motivation inclination is positively related with the ex-traversion in personality trait; however, personnel with intrinsic motivation inclination is not positively related with the introversion in personality traits. According to above literature, personality traits and work motivation have mutual influence, and personnel with different per-sonality traits will have disparate work motivations.
Hence, this research proposes the following hypothe-ses:
H2: The personality traits of the marine tourism per-sonnel have a significant influence on intrinsic work mo-tivation.
H3: The personality traits of the marine tourism per-sonnel have significant influences on their extrinsic work motivation.
2.3 The Relationship between Work Motivation and Innovative Behavior
Work motivation produces influences on different stages of innovative behavior; intrinsic motivation has signifi-cant positive interpretation and forecast on personal crea-tivity and organizational innovation [18]. Most resear- ches indicated that extrinsic motivation like gaining rec-ognition and monetary reward will produce negative in-fluence and extrinsic motivation factors like lack of lib-erty, unable to get support from supervisors and afraid of being evaluated, these factors will bring negative forecast to creativity [17]. However, extrinsic motivation might not produce negative influence on personnel who carries on creative activity [18]. Some researchers assume that extrinsic motivation produces negative influence on crea-tivity; in the other hand, the predictability of extrinsic motivation on innovative behavior could be a positive or a negative influence.
Based on above literatures, this study proposes the hypothesis:
H4: The intrinsic work motivation of the marine tour-ism personnel has significant influences on their innova-tive behavior.
H5: The extrinsic work motivation of the marine tour-ism personnel has significant influences on their innova-tive behavior.
2.4 The Relationship among Personality Traits, Work Motivation and Innovative Behavior
Recent studies indicated that personality traits have a positive influence on innovative behavior [9,14] however some researchers proposed different opinions [16]. Intri- nsic motivation is positively related to innovative behav-
Copyright © 2010 SciRes. JSSM
Employee’s Personality Traits, Work Motivation and Innovative Behavior in Marine Tourism Industry
Copyright © 2010 SciRes. JSSM
200
lated area. These survey items were revised deliberately and then the questionnaires distributing procedure was conducted. The distributed spots were on the marine tou- rism commercial resort in Penghu, Taiwan. There were 250 questionnaires distributed totally, and we subtracted the invalid questionnaires which were blank and incom-plete answered, there were 215 valid samples back, the valid response rate was 86%.
ior [5,18], the factors of extrinsic motivation also have predictability on creativity [17,18]. Hence, this study tries to use the widely accepted “Big Five” personality traits and work motivation as research topic, and then discusses what kind of work motivation will be generate by some specific personality traits, and managers should give their employees appropriate work motivations ac-cording to different personality traits, and further confirm the influence on their innovative behavior. 3.3 Measurement Tool
Hence, this research proposes the following hypothe- ses: This study refers the study of McCrace & Costa (1992)
[16], the five personality traits (Big Five personality) were adopted as the evaluation index basis. The Cron-bach’s α value of personality traits was 0.72. In the work motivation, this study adopted Amabile et al. (1994) [17] & Fang’s (2002) [19] Work Preference Inventory (WPI) scale, the Cronbach’s α value for the both scales were 0.81 and 0.74. For the innovative behavior questionnaire, this study used the innovative behavior scale developed by Scott & Bruce (1994) [20]. The Cronbach’s α value was 0.88, the result indicated that the questionnaire reli-ability was acceptable.
H6: The intrinsic work motivation of the marine tour-ism personnel has significant mediating effect between their personality traits and innovative behavior.
H7: The extrinsic work motivation of the marine tour-ism personnel has significant mediating effect between their personality traits and innovative behavior.
3. Methodology
3.1 Research Framework
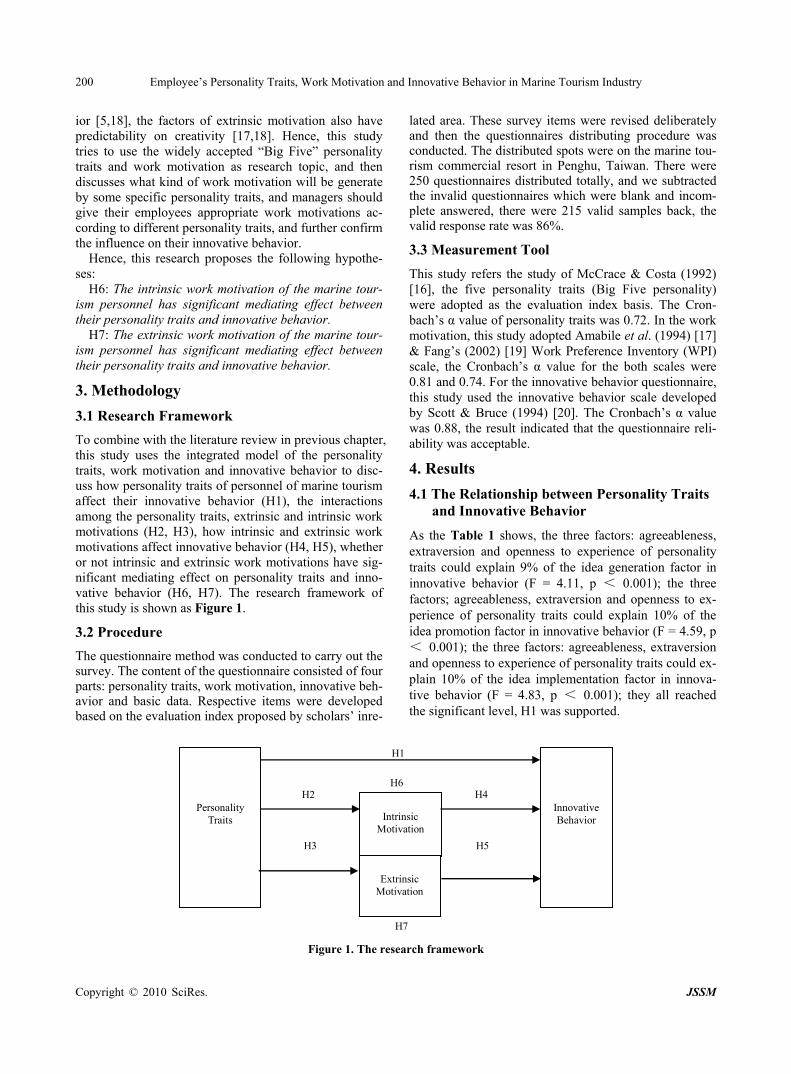
To combine with the literature review in previous chapter, this study uses the integrated model of the personality traits, work motivation and innovative behavior to disc- uss how personality traits of personnel of marine tourism affect their innovative behavior (H1), the interactions among the personality traits, extrinsic and intrinsic work motivations (H2, H3), how intrinsic and extrinsic work motivations affect innovative behavior (H4, H5), whether or not intrinsic and extrinsic work motivations have sig-nificant mediating effect on personality traits and inno-vative behavior (H6, H7). The research framework of this study is shown as Figure 1.
4. Results
4.1 The Relationship between Personality Traits and Innovative Behavior
As the Table 1 shows, the three factors: agreeableness, extraversion and openness to experience of personality traits could explain 9% of the idea generation factor in innovative behavior (F = 4.11, p < 0.001); the three factors; agreeableness, extraversion and openness to ex- perience of personality traits could explain 10% of the idea promotion factor in innovative behavior (F = 4.59, p < 0.001); the three factors: agreeableness, extraversion and openness to experience of personality traits could ex- plain 10% of the idea implementation factor in innova-tive behavior (F = 4.83, p < 0.001); they all reached the significant level, H1 was supported.
3.2 Procedure
The questionnaire method was conducted to carry out the survey. The content of the questionnaire consisted of four parts: personality traits, work motivation, innovative beh- avior and basic data. Respective items were developed based on the evaluation index proposed by scholars’ inre-
Personality Traits
Intrinsic
Motivation
Extrinsic
Motivation
Innovative Behavior
H1
H4
H5
H2
H3
H7
H6
Figure 1. The research framework

Employee’s Personality Traits, Work Motivation and Innovative Behavior in Marine Tourism Industry 201
4.2 The Relationship between Personality Traits
and Work Motivation
After regression analysis, shown in Table 1, the agreeab- leness and extraversion factors of personality traits could explain 9 % of the enjoyment factor in work motivation (F = 4.21, p < 0.001); the three factors: agreeableness, extraversion and openness to experience of personality traits could totally explain 19 % of the challenge factor in work motivation (F = 10.06, p < 0.001); they all reach- ed the significant level, H2 was supported. The three fa- ctors: conscientiousness, neuroticism and openness to experience of personality traits could totally explain 10% of the outward factor in work motivation (F = 4.64, p < 0.001); the four factors: agreeableness, extraversion, neu- roticism and openness to experience of personality traits could totally explain 10% of the outward factor in work motivation (F = 4.54, p < 0.001); they all reached the significant level.
4.3 The Relationship between Work Motivation and Innovative Behavior
As the regression analysis in Table 2 shows, the enjo- yment and challenge factors of intrinsic work motivation could explain 24% of the idea generation factor in inno- vative behavior (F = 33.96, p < 0.001); the enjoyment and challenge factors of intrinsic work motivation could explain 24% of the idea promotion factor in innovative (F = 33.10, p < 0.001); the enjoyment and challenge factors of intrinsic work motivation could explain 26% of the idea implementation factor in innovative behavior (F = 37.55, p < 0.001); they all reached the significant level. Hence, H4 was supported.
As the regression analysis in Table 3 shows, the com- pensation factor in extrinsic work motivation could ex-plain 10% of the idea generation factor in innovative behavior (F = 12.14, p < 0.00); the compensation fac-tor in extrinsic work motivation could explain 13% of the idea promotion factor in innovative behavior (F = 15.30, p < 0.001); the compensation factor in extrinsic work motivation could explain 14% of the idea implementation factor in innovative behavior (F = 17.08, p < 0.001); they all reached the significant level, H5 was supported.
4.4 The Relationship among Personality Traits, Work Motivation and Innovative Behavior
As the multiple regression analysis in Table 4 shows, the three factors: agreeableness, extraversion and openness to experience of personality traits were significantly cor-related with the idea generation factor in innovative beh- avior. The enjoyment and challenge factors of work mo-tivation were significantly correlated with the idea gen-eration factor in innovative behavior work motivation. However, if two factors of intrinsic work motivation were added into the predictive variables, the correlation among dependent variable and three personality traits fa- ctors became insignificant, the β-value would be smaller than the initial β-value, though the enjoyment and chal-lenge factors of intrinsic work motivation were still sig-nificantly correlated with idea generation.
As Table 5 shows, the three factors-agreeableness, ex-traversion and openness to experience of personality tra- its were significantly correlated with the idea promotion factor in innovative behavior. The enjoyment and chal-lenge factors of work motivation were significantly cor-related with the idea promotion factor in innovative be-havior. However, if two factors of intrinsic work motive- tion were added into the predictive variables, the correla-tion among dependent variable and three personality traits factors became insignificant, the β-value would be smaller than the initial β-value, though the enjoyment and challenge factors of intrinsic work motivation were still significantly correlated with idea promotion.
As the multiple regression analysis in Table 6 shows, the three factors: agreeableness, extraversion and openn- ess to experience of personality traits were significantly correlated with the idea implementation factor in innova- tive behavior. The enjoyment and challenge factors of work motivation were significantly correlated with the idea implementation factor in innovative behavior. How- ever, if two factors of intrinsic work motivation were ad- ded into the predictive variables, the correlation among dependent variable and three personality traits factors became insignificant, the β-value would be smaller than the initial β-value, though the enjoyment and challenge factors of intrinsic work motivation were still signify- cantly correlated with idea implementation.
Table 1. Regression analysis of personality traits and work motivation and innovative behavior
Enjoyment Challenge Outward Compensation Generation Promotion ImplementationVariable
β t β t β t β t β t β t β t Agreeableness –0.21 –2.87** –0.17 –2.35* –0.04 –0.60 –0.25 –3.42*** –0.15 –1.98* –0.20 –2.67** –0.18 –2.45*Conscientiousness –0.04 –0.58 0.07 1.07 0.17 2.30* 0.04 0.50 0.02 0.26 0.04 0.60 0.13 1.85Extroversion 0.27 3.41*** 0.34 4.58*** 0.05 0.58 0.23 2.91** 0.18 2.19* 0.20 2.45* 0.17 2.12*Neuroticism 0.08 1.12 0.08 1.20 –0.16 –2.40* –0.15 –2.23* 0.05 0.74 0.10 1.49 0.03 0.36Openness to experience
0.08 1.06 0.17 2.47* 0.17 2.31* –0.17 –2.33* 0.19 2.67** 0.15 2.13* 0.16 2.21*
Cumulative variance R2 0.09 0.19 0.10 0.10 0.09 0.10 0.10 Model F-value 4.21*** 10.06*** 4.64*** 4.54*** 4.11*** 4.59*** 4.83***
*p < 0.05, **p < 0.01, ***p < 0.001
Copyright © 2010 SciRes. JSSM

Employee’s Personality Traits, Work Motivation and Innovative Behavior in Marine Tourism Industry 202
Table 2. Regression analysis of intrinsic work motivation on innovative behavior
Idea generation Idea promotion Idea implementation Variable
β-value t-value β-value t-value β-value t-value
Enjoyment 0.31 4.92*** 0.35 5.52*** 0.42 6.69***
Challenge 0.29 4.51*** 0.24 3.70*** 0.18 2.86** Cumulative variance R2 0.24 0.24 0.26
Model F-value 33.96*** 33.10*** 37.55***
**p < 0.01, ***p < 0.001
Table 3. Regression analysis of extrinsic work motivation on innovative behavior
Idea generation Idea promotion Idea implementation Variable
β-value t-value β-value t-value β-value t-value
Extroversion –0.02 –0.27 0.04 0.56 0.06 0.95
Economic Reward 0.32 4.90*** 0.35 5.35*** 0.36 5.55***
Cumulative variance R2 0.10 0.13 0.14
Model F-value 12.14*** 15.30*** 17.08***
***p < 0.001
Table 4. Hierarchical regression analysis of personality traits and intrinsic work motivation on idea generation
Analysis 1 Analysis 2 Analysis 3 Variable
β t VIF β t VIF β t VIF
Agreeableness –0.15 –1.98* 1.28 - - - –0.04 –0.59 1.35
Conscientiousness 0.02 0.26 1.22 - - - 0.01 0.21 1.24
Extroversion 0.18 2.19* 1.47 - - - 0.01 0.08 1.65
Neuroticism 0.05 0.74 1.09 - - - 0.01 0.13 1.10
Openness 0.19 2.67** 1.20 - - - 0.13 1.92 1.23
Enjoyment - - - 0.31 4.92*** 1.14 0.30 4.67*** 1.19
Challenge - - - 0.29 4.51*** 1.14 0.25 3.62*** 1.34
Cumulative variance R2 0.09 0.24 0.26
Model F-value 4.11*** 33.96*** 10.33***
*p < 0.05, **p < 0.01, ***p < 0.001
Table 5. Hierarchical regression analysis of personality traits and intrinsic work motivation on idea promotion
Analysis 1 Analysis 2 Analysis 3 Variable
β t VIF β t VIF β t VIF
Agreeableness –0.20 –2.67** 1.28 - - - –0.10 –1.38 1.35
Conscientiousness 0.04 0.60 1.22 - - - 0.04 0.66 1.24
Extraversion 0.20 2.45* 1.47 - - - 0.04 0.50 1.65
Neuroticism 0.10 1.49 1.09 - - - 0.06 0.98 1.10
Openness to experience 0.15 2.13* 1.20 - - - 0.10 1.44 1.23
Enjoyment - - - 0.35 5.52*** 1.14 0.33 5.13*** 1.19
Challenge - - - 0.24 3.70*** 1.14 0.19 2.72** 1.34
Cumulative variance R2 0.10 0.24 0.26
Model F-value 4.59*** 33.10*** 10.27***
*p < 0.05, **p < 0.01, ***p < 0.001
Copyright © 2010 SciRes. JSSM

Employee’s Personality Traits, Work Motivation and Innovative Behavior in Marine Tourism Industry
Copyright © 2010 SciRes. JSSM
203
Based on the above results, the factors of innovative
behavior were significantly correlated with partial factors of personality traits, the factors of innovative behavior were also significantly correlated with factors of intrinsic work motivation. The correlation among factors of inno-vative behavior and factors of personality traits became less significant with the inclusion of factors of intrinsic work motivation; the β-value would be smaller than the initial β-value. It concluded that the intrinsic work moti-vation was the mediating variable between personality traits and innovative behavior. Hence, H6 was supported.
As the multiple regression analysis in Table 7 shows, when two factors of extrinsic work motivation were ad- ded into the predictive variables, the correlation among dependent variable and agreeableness and extraversion factors in personality traits became insignificant, the β- value would be smaller than the initial β-value, though the compensation factor of extrinsic work motivation was significantly correlated with idea generation.
When two factors of extrinsic work motivation were added into the predictive variables, the correlation among dependent variable and agreeableness and extraversion factors in personality traits became insignificant, the β- value would be smaller than the initial β-value, though
the outward factor of extrinsic work motivation was sig-nificantly correlated with idea promotion. It shows in Table 8.
When two factors of extrinsic work motivation were added into the predictive variables, the correlation among dependent variable and agreeableness and extraversion factors in personality traits became insignificant, the re-spective β-values on innovative behavior became smaller, though the compensation factor of extrinsic work moti-vation was significantly correlated with idea implemen-tation. It shows in Table 9.
According to the above research results, the factors of innovative behavior are significantly correlated with fact- ors of extrinsic work motivation. The correlation among factors of innovative behavior, factors of personality tra- its and factors of work motivation became less signific- ant when factors of extrinsic work motivation were add- ed into the predictive variables. Factors of personality tr- aits and factors of innovative behavior were insignificant though they were initially significant correlated, the re-spective β-values on innovative behavior also became smaller, therefore, the extrinsic work motivation was the mediating variable between personality traits and innova-tive behavior. Hence, H7 was partial supported.
Table 6. Hierarchical regression analysis of personality traits and intrinsic work motivation on idea implementation
Analysis 1 Analysis 2 Analysis 3 Variable
β t VIF β t VIF β t VIF
Agreeableness –0.18 –2.45* 1.28 - - - –0.07 –1.06 1.35
Conscientiousness 0.13 1.85 1.22 - - - 0.14 2.21* 1.24
Extraversion 0.17 2.12* 1.47 - - - 0.01 0.15 1.65
Neuroticism 0.03 0.36 1.09 - - - 0.02 –0.28 1.10
Openness 0.16 2.21* 1.20 - - - 0.11 1.63 1.23
Enjoyment - - - 0.42 6.69*** 1.14 0.42 6.59*** 1.19
Challenge - - - 0.18 2.86** 1.14 0.12 1.84 1.34
Cumulative variance R2 0.10 0.26 0.30
Model F-value 4.83*** 37.55*** 12.55***
*p < 0.05, **p < 0.01, ***p < 0.001
Table 7. Hierarchical regression analysis of personality traits and extrinsic work motivation on idea generation
Analysis 1 Analysis 2 Analysis 3 Variable
β t VIF β t VIF β t VIF
Agreeableness –0.15 –1.98* 1.28 - - - –0.06 –0.83 1.35
Conscientiousness 0.02 0.26 1.22 - - - 0.02 0.29 1.26
Extraversion 0.18 2.19* 1.47 - - - 0.10 1.25 1.53
Neuroticism 0.05 0.74 1.09 - - - 0.09 1.40 1.13
Openness to experience 0.19 2.67** 1.20 - - - 0.27 3.82*** 1.27
Outward - - - –0.02 –0.27 –0.02 –0.08 –1.26 1.14
Compensation - - - 0.32 4.90*** 0.32 0.36 5.47*** 1.14 Cumulative variance R2 0.09 0.10 0.21 Model F-value 4.11*** 12.14*** 7.62***
*p < 0.05, **p < 0.01, ***p < 0.001

Employee’s Personality Traits, Work Motivation and Innovative Behavior in Marine Tourism Industry 204
Table 8. Hierarchical regression analysis of personality traits and extrinsic work motivation on idea promotion
Analysis 1 Analysis 2 Analysis 3 Variable
β t VIF β t VIF β t VIF
Agreeableness –0.20 –2.67** 1.28 - - - –0.10 –1.44 1.35
Conscientiousness 0.04 0.60 1.22 - - - 0.03 0.46 1.26
Extraversion 0.20 2.45* 1.47 - - - 0.11 1.43 1.53
Neuroticism 0.10 1.49 1.09 - - - 0.16 2.43* 1.13
Openness to experience 0.15 2.13* 1.20 - - - 0.22 3.16** 1.27
Outward - - - 0.04 0.56 0.04 –0.01 0.16 1.14
Compensation - - - 0.35 5.35*** 0.35 0.38 5.80*** 1.14
Cumulative variance R2 0.10 0.13 0.23 Model F-value 4.59*** 15.30*** 8.69***
*p < 0.05, **p < 0.01, ***p < 0.001
Table 9. Hierarchical regression analysis of personality traits and extrinsic work motivation on idea implementation
Analysis 1 Analysis 2 Analysis 3 Variable
β t VIF β t VIF β t VIF
Agreeableness –0.18 –2.45* 1.28 - - - –0.08 –1.18 1.35
Conscientiousness 0.13 1.85 1.22 - - - 0.12 1.80 1.26
Extraversion 0.17 2.12* 1.47 - - - 0.08 1.04 1.53
Neuroticism 0.03 0.36 1.09 - - - 0.08 1.27 1.13
Openness to experience 0.16 2.21* 1.20 - - - 0.23 3.31*** 1.27
Outward - - - 0.06 0.95 0.06 –0.02 –0.23 1.14
Compensation - - - 0.36 5.55*** 0.36 0.39 6.05*** 1.14
Cumulative variance R2 0.10 0.14 0.24 Model F-value 4.83*** 17.08*** 9.33***
*p < 0.05, **p < 0.01, ***p < 0.001
5. Conclusions & Discussion
The hypotheses of this research are all established. It means that employees with higher intrinsic work motiva-tion are more likely to generate innovative behavior. The compensation in extrinsic work motivation has a positive effect to person’s innovative behavior. Intrinsic work motivation has mediated effect between personality traits and innovative behavior. Extrinsic work motivation has partial mediated effect between personality traits and innovative behavior.
The findings provide several implications, first of all, if personnel have more enjoyment and challenge in their intrinsic motivation, they will exhibit more innovative behavior, therefore, the marine tourism industry should reinforce the delight and challenge in the content of the work. Personnel often chase delightful or suitable works to fulfill self-actualized. However, most works are lack of delight and challenge, and most employers have the idea that personnel work only for payroll; the employers often overlook the delightful working environment brou- ght by work’s delight and the sense of achievement
brought by challenging work. Secondly, the compensa- tion of extrinsic motivation is the most positively influe- ntial factor for personnel’s innovative behavior, therefore, the marine tourism industry should implement a fair in-centive mechanism, and it will produce irresistible attrac-tiveness for personnel who are attached to fair incentive. In addition, the intrinsic work motivation of the marine tourism personnel will have significant mediating effect between their personality traits and innovative behavior. Therefore, the marine tourism industry should provide personnel with appropriate intrinsic work motivation according to their personal traits, it will make personnel acquire job satisfaction and the intrinsic work motivation provision will promote the development of innovative behavior. Finally, the compensation factor in extrinsic work motivation will have partial mediating effect be-tween their personality traits and innovative behavior. Therefore, the marine tourism industry should provide personnel with appropriate extrinsic work motivation according to their personal traits, if the personnel are attached to material life then the employer should give them tangible reward, i.e. money; if the personnel are
Copyright © 2010 SciRes. JSSM

Employee’s Personality Traits, Work Motivation and Innovative Behavior in Marine Tourism Industry 205
attached to spiritual life then they might want an endow- ment of power from the employer, and the appropriate reward will promote the development of innovative be-havior.
Future research can extend the present study in several directions. One direction would be to replicate the same questionnaire in different area and compares with this study. For this study uses the five big personality traits as the categorization standard for personality traits, future researches could be measured with other factors in per-sonality traits. In addition, this research uses intrinsic work motivation and extrinsic work motivation as the categorization of work motivation, the results could not fully support all the hypotheses proposed by this research, future researchers can measure with other factors to im-prove the predictabilities.
REFERENCES [1] H. Fayed and J. Fletcher, “Globalization of Economic
Activity: Issues for Tourism,” Tourism Economics, Vol. 8, No. 2, 2002, pp. 207-230.
[2] World Travel and Tourism Council (WTTC), “The 2007 Travel and Tourism Economic Research,” 2007。 http:// www.wttc.org/bin/pdf/original_pdf_file/world.pdf
[3] World Economic Forum (WEF), “Travel and Tourism Competitiveness Report,” 2007. http://www.weforum. org/pdf/tourism/Part1.pdf
[4] T. M. Amabile and R. Conti, “Changes in The Work En- vironment for Creativity during Downsizing,” Academy of Management Journal, Vol. 42, No. 6, 1999, pp. 630- 640.
[5] T. M. Amabile, R. Conti, H. Coon, J. Lazenby and M. Herron, “Assessing the Work Environment for Crea- tivity,” Academy of Management Journal, Vol. 39, No. 5, 1996, pp. 1154-1184.
[6] T. M. Amabile, “A Model of Creativity and Innovation in Organizations,” In: B. M. Staw and L. L. Cumming, Eds., Research in Organizational Behavior, JAI Press, Greenwich, Vol. 10, No. 2, 1998, pp. 123-167.
[7] R. F. Kleysen and C. T. Street, “Toward a Multi-Dimen- Sional Measure of Individual Innovative Behavior,” Jour- nal of Intellectual Capital, Vol. 2, No. 3, 2001, pp. 284- 296.
[8] E. C. Selby, E. J. Shaw and J. C. Houtz, “The Creative
Personality,” The Gifted Child Quarterly, Vol. 49, No. 4, 2005, pp. 300-316.
[9] T. A. Judge, J. E. Bono, R. Ilies and M. W. Gerhardt, “Personality and Leadership: A Qualitative and Quan- titative Review,” Journal of Applied Psychology, Vol. 87, No. 4, 2002, pp. 765-780.
[10] T. M. Amabile, “The Social Psychology of Creativity,” Springer-Verlag, New York, 1983.
[11] M. L. Ambrose and C. T. Kulik, “Old Friends, New Faces: Motivation Research in the 1990s,” Journal of Mana- gement, Vol. 25, No. 3, 1999, pp. 231-292.
[12] C. O. Tsai, “The Research on Marine Tourism Recreation Development, Standard and Management Infrastructure,” Taiwan National Science Council, 2000.
[13] P. T. Jr. Costa, R. R. McCrae and C. M. Busch, “Eva- luating Comprehensiveness in Personality Systems: The California Q-Set and the Five-Factor Model,” Journal of Personality, Vol. 54, No. 2, 1986, pp. 430-446.
[14] M. R. Barrick, G. L. Stewart, M. J. Neubert and M. K. Mount, “Relating Member Ability and Personality to Work-Team Processes and Team Effectiveness,” Journal of Applied Psychology, Vol. 83, No. 3, 1998, pp. 377-391.
[15] T. A. Judge, J. E. Bono, R. Ilies and M. W. Gerhardt, “Personality and Leadership: A Qualitative and Quanti- tative Review,” Journal of Applied Psychology, Vol. 87, No. 4, 2002, pp. 765-780.
[16] R. R McCrae and P. T. Jr. Costa, “An Introduction of the Five-Factor Model and its Applications,” Journal of Personality, Vol. 60, No. 2, 1992, pp. 175-215.
[17] T. M. Amabile, K. G. Hill, B. A. Hennessey and E. M. Tighe, “The Work Preference Inventory: Assessing In- trinsic and Extrinsic Motivational Orientations,” Journal of Personality and Social Psychology, Vol. 66, No. 5, 1994, pp. 950-967.
[18] T. M. Amabile, “Creativity in Context,” West View Press, Boulder, 1996.
[19] M Fang, “A Study of the Organizational Culture’s Cor- relation Influence on Intrinsic Work Motivation and Job Characteristics and Job Satisfaction in Taiwan Semi- Conductor Industry,” Management Review, Vol. 21, No. 3, 2002, pp. 69-96.
[20] S. G. Scott and R. A. Bruce, “Determinants of Innovative Behavior: A Path Model of Individual Innovation in the Workplace,” Academy of Management Journal, Vol. 37, No. 3, 1994, pp. 580-607.
Copyright © 2010 SciRes. JSSM

J. Service Science & Management, 2010, 3, 206-217 doi:10.4236/jssm.2010.32026 Published Online June 2010 (http://www.SciRP.org/journal/jssm)
Copyright © 2010 SciRes. JSSM
Brand Relationships: A Personality-Based Approach
Helena M. Nobre1, Kip Becker2, Carlos Brito3
1Instituto Superior de Administração e Gestão (ISAG), Rua do campo Alegre, Portugal; 2Administrative Sciences Department, Bos-ton University, Boston, USA; 3Universidade do Porto–Faculdade de Economia, R. Dr. Roberto Frias, Portugal. Email: [email protected], [email protected], [email protected] Received February 21st, 2010; revised April 2nd, 2010; accepted May 8th, 2010.
ABSTRACT
The authors investigated the relationship between brand personality and brand relationships. The conceptual model was based on the hypothesis that brand personality may nurture specific consumer-brand relationships and that these relationships may influence the quality of the ties that consumers develop with brands. An instrument from intimate interpersonal relationships was used to measure consumer-brand relationships. An SEM analysis conducted on a sam-ple of 733 consumer-brand relationships, involving nine highly known brands of different product categories, gave support to the theory. The research offers two significant contributions by: 1) Emphasizing the role of consumer-brand relationship in understanding multi-brand, symbolic consumption and 2) Offering a holistic perspective in the under-standing of brand personality. Keywords: Brand Personality, Brand Relationships, Interpersonal Relationship Theory
1. Introduction
Some authors consider brand as a partner in a dyadic relationship with the consumer [1-6]. The relational ap-proach may provide a better and broader understanding of the phenomena that arises between the customer and the brand. Investigating branding as a variable of con-sumer loyalty and customer retention may reduce influ-ences resulting from symbolic consumption [7] since loyalty may be considered as a specific kind of a rela-tionship [8]. Adopting a relational view of consumption is more consistent with the need to develop a more holis-tic approach of brand knowledge [9].
In 1998, in an innovator approach, Susan Fournier used the inter-personal relationship metaphor to study con-sumer-brand relationships. Susan Fournier postulated that brand is a partner in a dyadic relationship with the con-sumer highlighting the holistic character of the phen- omena. She concluded that consumer-brand relationships are a source of self-efficacy, self-esteem and self-identity.
Building on Fournier’s study, J. Aaker et al. [2] de-veloped a conceptual model to explain consumerbrand relationships which was based on the fact that acts of transgression and brand personality have a prominent role in the relationship strength formation. They reported two classes of relationships related to the brand person-alities of Sincerity and Excitement [10,11] which rely on
the same constructs of the two Ideals of Relationships: Intimacy-Loyalty and Passion [12]. A review of the con-sumer-brand relationship research indicated there was a need for further investigation in order to understand the type of bonds different consumers establish with distinct brand personalities, as well as the relevant relationship patterns that can affect consumer-brand interactions.
Recognizing this research gap, the researchers were motivated to develop a conceptual model whose premise was that a brand’s personality has an important role in the establishment of ties with the consumer. The hypot- hesis, that brand personality may nurture specific types of consumer-brand relationships and these consumer- brand relationships may influence the quality of the ties that consumers develop with brands, was constructed to test the model.
2. A Framework for Brand Personality
Utilizing a multivariate analysis design, J. Aaker [10] de- veloped the Brand Personality Scale which is a five-fac-torial model operationalized in terms of human charac-teristics and was inspired by the Big Five model of hu-man personality [13-15]. Despite its importance in the representation and explanation of brand personality [9], the scale is not generalizable to different cultures. As a result, J. Aaker et al. [11] developed transcultural studies

Brand Relationships: A Personality-Based Approach 207
in order to adjust the scale to other populations: the Ja- panese and Spanish populations.
The Spanish model included two universal factors-Sin- cerity and Excitement-as well as three culture specific fa- ctors. These are Passion (a specific element of Latin culture), Peacefulness (a shared element with the Japanese scale), and Sophistication (a mist of markers of North American Sophistication and North American Competence).
3. Interpersonal Intimate Relationships
In a new approach to the interpersonal relationships field, Fletcher et al. [12] developed the Relationship Ideals, a factorial model for explaining intimate (romantic) rela-tionships, which is composed of two basic factors: Inti-macy-Loyalty and Passion. Relationships of Intimacy- Loyalty are caring, respectful, honest, trusting and sup-portive; and relationships of Passion are related to feel-ings of excitement, fun and independence. The authors note that results may not necessarily be generalized to other relationship domains and social contexts but that issue could represent an interesting direction of research.
According to Aggarwall [3], customers will relate to brands in ways that resemble their social ties. Aggarwall further states that the norms of interpersonal relationships are a basis for the assessment that customers make of their relationships with brands. This study advances the assumption that the Relationship Ideal Scale [12] is ap-plicable to the consumer-brand relationship context.
4. The Conceptual Model
Building on the literature cited previously, the authors developed a conceptual model bringing together eleme- nts of several prior researchers (see Figure 1).
In an interpersonal-relationship theory perspective, Altman and Taylor [16] considered that the development of a relationship implies the gradual overlapping and exploration of the mutual selves of the partners involved in that relationship. They admit an unequivocal relevance of some features of personality on interpersonal proc-esses. It seems plausible, therefore, that there would be a relationship between brand personality and the type of relationship the customer establishes with the brand. On one hand, brand personality is partially determined by the experiences the consumers develop with that brand. On the other, it acts as a base of information which provides guidance to consumers on the establishment of their rela-tionships with brands [3] and influence the quality, or strength, of those ties [2]. Considering these facts, the authors posited the follow hypotheses:
H1: Brand Personality will be a predictor of Consum- er-Brand Relationships.
H2: Brand Personality will be a predictor of Relation- ship Strength.
Brand personality is one potential source of relation- ship expectations [17], in particular those relationship expectations relating to partner quality based on the sum of inferences consumers make through the observation of a brand’s behaviours [4]. The partner quality inferences have a foundation in judgements of equity and justice, in socioemotional benefits, and have the purpose of defin-ing the belief the customer has in his relationship with a brand [2]. Therefore, partner quality can be considered to be a mediating variable between brand personality and consumer-brand relationship:
H3: The influence of Brand Personality on Consumer- Brand Relationships will be partially mediated by the co- nsumer perceptions of Partner Quality.
Brand
Personality
Consumer Personality
Relationship
Strength Consumer-Brand
Relationship Partner Quality
Figure 1. Conceptual model of the influence of brand personality on consumer-brand relationship
Copyright © 2010 SciRes. JSSM

Brand Relationships: A Personality-Based Approach 208
In the literature, longevity of a relationship is associ-
ated with the quality and stability [6] or the strength of that relationship [18]. Moreover, the characterization of the two Relationship Ideals proposed by Fletcher et al. (1999) [12] indicated that relationships of Intimacy- Loyalty, rather relationships of Passion, are associated with lasting relationships. These are based on patterns of commitment, trust and intimacy. Considering this, it was hypothesized:
H4: The type of Consumer-Brand Relationship will be a predictor of Relationship strength.
The personality of the partners in a relationship influe- nces the content and the development of that relationship [19]. Thus, it is expected that:
H5: Consumer Personality will be a predictor of Cons- umer-Brand Relationships.
According to Auhagen and Hinde [20], partner per-sonality influences the behaviours in a relationship and biases the character inferences based on the observation of these behaviours. As such, the customer character ori- entation would be determinant in the way one evaluates the performance of a brand [3]. Taking this into account, the influence of consumer personality on consumer- brand relationship should also be indirect:
H6: The influence of Consumer Personality on Con- sumer-Brand Relationships will be partially mediated by the consumer perceptions of Partner Quality.
5. Methodology
5.1 Brand Selection
The study featured nine well known brands in the Portu-guese market. These brands represented different product categories, brand personalities and functional versus sym- bolic usage. The utilitarian brands were Continente (sto- res/supermarkets) and Luso (mineral water). The sym-bolic brands were Chanel (fragrances), Ferrari (sport aut- omobiles) and Nike (sports apparel). The both symbolic and utilitarian brands were Mercedes (automobiles), Vol- kswagen (automobiles) and Land Rover (sport utility vehicle-SUV). Finally, Coca-Cola (soft drink) was used as a control brand. The 2005 Superbrands Portugal [21], the 2005 Best Global Brands [22], and the information about sales performance of the Portuguese automobile industry in 2006 (supplied by the Automóvel Clube de Portugal [23]) provided guidance in the selection of the brands. Two additional aspects influenced the selection procedure. The first was that brand personality is more important in symbolic categories such as automobiles and fragrances [24]. The second was that the automobiles category is notable in terms of brand sensibility [25].
5.2 Participants
In order to reduce the possibility of participant fatigue, which could bias the results, two groups of four brands
were presented. To ensure a close profile to the sample, each group was composed by at least: one symbolic brand, one utilitarian brand, and one utilitarian/symbolic brand. Group 1 was composed of the brands: Continente, Nike, Mercedes, Land Rover, and Coca-cola. Group 2 was composed of the brands: Luso, Volkswagen, Chanel, Ferrari, and Coca-cola. Coca-Cola was included in each group as a control element in order to assess the varia-tions in the consumer perceptions. Coca-Cola was chosen as the control element because it is recognized as one of the most familiar brands in the world and should have no real differences in the two groups.
A total of 388 individuals participated in the study. A sample of convenience, by quotas in terms of age and gender, of 350 valid questionnaires was obtained. Acc- ording to the 2001 Census [26], age and gender were not statistically significantly different from the Portuguese population (age: (Msample = 40.3, Mpop. = 39.5), (t = 0.97, p = 0.33), gender: χ2(1) = 0.100, p = 0.75). The respondents were between 18 and 86 years old.
The participants and the commercial brands were cho- sen according to the identical principles that guided the research of Jennifer Aaker and her colleagues in the North American, Japanese and Spanish markets [10,11].
5.3 Measures
For the sake of proven test reliability and cross cultural consistency existing and tested instruments were used to measure each one of the constructs studied. The construct of Brand Personality was measured by the Spanish Brand Personality Framework [11] (see Appendix A) according to an imposed-etic approach [27]. The construct of Cons- umer-Brand Relationship was assessed by the short ver-sion of Relationship Ideals Scale [12] (see Appendix B). To analyze Relationship Strength and Partner Quality, the Relationship Strength Indicators and Partner Quality scale [2] (see Appendix C), respectively, were used.
Aware of the difficult task of choosing a stable fram- ework to access the Consumer Personality Baumgartner [28] suggests the Big Five taxonomy as a base to struc-ture a trait specific framework to consumer behavior. The Big Five is considered the most consensual framework that explores the individual differences with an accept-able level of abstraction [14] and allows studying the human personality at the first level of analysis according to McAdams [29]. In this study, for the sake of simplicity, the construct Consumer Personality was studied through the NEO-FFI [30] which is one of the Big Five instru-ments. The NEO-FFI is the short version of the NEO- Personality Inventory [13,15] which was translated by Margarida Lima and António Simões in 2000 (unpub-lished manuscript). Some psychometric studies devel-oped by Lima [31] confirmed the reliability and predic-tive validity of the NEO-Personality Inventory for the Portuguese population.
Copyright © 2010 SciRes. JSSM

Brand Relationships: A Personality-Based Approach 209
5.4 Procedures
The Relationship Ideals and Relationship Strength Indi-cators scales were translated from English to Portuguese. The Spanish Brand Personality framework was simulta-neously translated from Spanish and English to Portu-guese. The translations from English were assessed by two bilingual researchers and from Spanish by a biling- ual researcher. In order to test content validity [32], a preliminary instrument was developed. This instrument was replicated in two questionnaires according to two different groups of three well known brands. Coca-cola was again used as the control. Forty-two questionnaires were collected by faculty, staff and post-graduate stu-dents.
The final sample was collected using non-random me- thods. Participants were contacted directly by undergrad- duate students and some other volunteers who explained the purpose of the study and distributed the questionnaire with the instructions. The participants were instructed to answer the questionnaires when alone and then to return them. Participants were not paid. Each participant an-swered one of the two different questionnaires (related to the two groups of brands). To avoid primacy and regency effects [10], the order in which the five brands were pre-sented in the questionnaires and the order in which the personality and consumer-brand relationship traits appea- red were rotated.
In the first section of the questionnaires the particip- ants answered the NEO-FFI Scale. The second section of the questionnaires assessed the constructs Brand Person-ality, Consumer-Brand Relationship, Relationship Stren- gth, and Partner Quality. This section was repeated for every five brands of each questionnaire. The participants were asked initially about their familiarity with the brand on a five-point Likert scale (1 = I don’t know the brand, 5 = I know the brand very well). The answers of the re-spondents who rated below three, or failed this item, were rejected unless they were (or had been) consum-ers/users of the brand. Respondents were then invited to fill the brand personality scale. Consumers were then asked if they used/consumed the brand, why and how long they had used it and, in the case they were not cur-rent brand users, why not. The respondents were advised to continue answering the questionnaire only in the case they were (or had been) current users of the brand. Fi-nally, the brand users were requested to answer the Con-sumer-brand Relationship scale and the items related with Relationship Strength and Partner Quality.
5.5 Sampling and Non-Response Bias
No significant differences were found among the rates of Brand Personality, Consumer-Brand Relationship, Rela-tionship Strength, and Partner Quality for Coca-Cola, in the two sub-samples. In order to test the conceptual
model, a sample of consumer-brand relationships was extracted from the 350 valid questionnaires, according to the procedure used for sampling building by Cronin and Taylor [33]. The concern that J. Aaker’s Brand Personal-ity framework might not work in a research situation that aggregates data within a single product category [34] was a determinant in the sampling strategy. This sample in-cluded 733 consumer-brand relationships. About 80% of these relationships involved the brands Coca-Cola, Con-tinente, Luso, and Nike, and the remained 20% involved Volkswagen, Chanel, Mercedes, Land Rover, and Fer-rari.
6. Results
Confirmatory Factor Analysis (CFA) and Structural Equ- ation Modeling (SEM) were used to test the author’s proposed theoretical framework (see Figure 1). Statisti- cal software AMOS 16.0 [35] for Windows 2003 was used for estimating parameters and computing goodness- of-fit measures through Full-Information Maximum Likelihood (FIML) estimator. The hypotheses were con-sidered acceptable when a statistical level of p equal to or less than 0.05 existed.
6.1 Reliability
Reliabilities were calculated through Cronbach’s alphas coefficients based on the items for each factor of a given scale. High internal consistency was achieved for each factor of Brand Personality (Cronbach’s alphas ranged from 0.80 to 0.90), of Consumer-Brand Relationship (Cronbach’s alphas were 0.89 and 0.91, respectively), of Relationship Strength (Cronbach’s alphas ranged from 0.87 to 0.93), and for the one-dimensional scale of Part-ner Quality (Cronbach’s alpha was 0.91). With regard to Consumer Personality, high internal consistency was achieved for the measures of Neuroticism and Conscien-tiousness (Cronbach’s alphas were, respectively, 0.82 and 0.80), and acceptable internal consistency for Extro-version and Openness (Cronbach’s alpha was 0.71 in each case, above the minimum of 0.70 recommended by Nunnally, [36]). Agreeableness showed poor internal consistency with an alpha of 0.54.
6.2 Measurement Model
A CFA was conducted in order to assess the correspon-dence between measures and data. Each item or compo-nent was restricted to load on its pre-specified factor with the five first-order factors allowed to correlate freely. The model contained five latent variables (Brand Person-ality, Consumer-Brand Relationship, Consumer Person-ality, Relationship Strength, and Partner Quality) and 22 measures. The items were averaged for each one of the components of the scales. Although Agreeableness sho- wed poor internal consistency with a Cronbach’s alpha of
Copyright © 2010 SciRes. JSSM

Brand Relationships: A Personality-Based Approach
Copyright © 2010 SciRes. JSSM
210
suggesting evidence of discriminant validity [41]. Second, a chi-square test was performed for each pair of latent constructs on a measurement model constraining their correlation to equal one and on a baseline measurement model without this constraint. Then, the difference betw- een these two chi-square tests was submitted again to a chi-square test for each pair of constructs, resulting in a total of 10 significant chi-square-difference tests, also providing evidence of discriminant validity [37]. Third, the shared variance among any two constructs (i.e., the square of their correlation) was then compared with both their extracted variances (i.e., average variances ex-plained in the items by the constructs) [42]. Since the tests showed that all shared variances were less than the respective extracted variances, evidence of discriminant validity in the measures of all constructs under study was again taken for granted.
0.54, the items were also averaged in a single factor as according to the procedure used by Bagozzi and Dhol- akia [37].These composite variables served as indicators in the CFA, except in the case of the one-dimensional scale of Partner Quality, where the six items served as measures. This strategy was subordinated to the mini-mum sample size requirements for SEM designs of a ratio of 5 cases for each estimated parameter [38].
Results, as interpreted by the goodness-of-fit measures, indicated that the model fit the data well. The chi-square of this model was significant (χ2(107) = 408.4, p < 0.001), in opposition with the convention that an acceptable model is one that p is equal or in excess of 0.05. However, since the chi-square statistic is sensitive to sample size, additional fit measures (independent of sample size) were calculated. This model achieved 0.95, 0.96, 0.96, and 0.95 for NFI, CFI, IFI, and TLI, respectively (values of 0.90 or greater are recommended for an acceptable fit); and 0.06 for RMSEA (acceptable values range from 0.05 to 0.08, according to Hair, Anderson, Tatham, & Black [39]).
6.3 Path Analysis Model Estimates
Since the model showed construct validity the path dia-gram was estimated. The final model achieved a good fit: Chi-square = 519.0, df = 109, p < 0.001, RMSEA = 0.07, CFI = 0.95, IFI = 0.95, NFI = 0.94, and TLI = 0.94. Most of the direct paths proposed were statistically significant with the exception of the direct relationships between Consumer Personality and Partner Quality, Consumer Personality and Consumer-Brand Relationship, and Brand Personality and Relationship Strength (see Figure 2).
The analysis of the standardized loadings of each ind- icator on its construct, which were all statistically signi- ficant and sufficiently large, with an average loading size of 0.77, showed evidence of convergent validity [40].
Discriminant validity was assessed in three different ways. First, we checked whether the correlations between any two constructs were significantly different from one. The test showed that the respective confidence intervals (± two standard errors) do not include the value of one,
.71*.30*
Brand Personality
Consumer-BrandRelationship
R2 = .74
Partner Quality R2 = .28
Relationship Strength R2 = .58
.66*.53*
.00 .03
.06
Consumer Personality
Note: The estimates were completely standardized.*Coefficient is significant at the .001 level (2-tailed).
Figure 2. Path diagram

Brand Relationships: A Personality-Based Approach 211
As expected, the estimates confirmed that Brand Per-
sonality is a predictor of Consumer-Brand Relationships (hypothesis 1). It is interesting to note that Brand Per-sonality had a significant positive direct effect (0.66, p < 0.01) on Consumer-Brand Relationship. This prediction was strengthened by a significant indirect effect (0.16, p < 0.01) through Partner Quality. Although small, this in-direct effect supported the hypothesis 3. The total effect (0.82, p < 0.01) showed that Brand Personality had a strong positive effect on Consumer-Brand Relationship (see Table 1). Also as expected, a positive significant effect (0.71, p < 0.01) of the Consumer-Brand Relationship on Relationship Strength was noted which supported hypo- thesis 4. Results, however, did not support the hypothesis 2 since no significant direct effect of Brand Personality on Relationship Strength was found. To the contrary, a significant indirect effect of Brand Personality on Rela-tionship Strength (0.58, p < 0.01) was achieved that sug-gests Consumer-Brand Relationship mediates all the ef-fects of Brand Personality on Relationship Strength.
No significant effects were found for the path of Con-sumer Personality on Consumer-Brand Relationship and no significant indirect effects of Consumer Personality on Consumer-Brand Relationship through Partner Qual-ity were determined. Thus, both hypothesis 5 and hy-pothesis 6 were rejected.
Additionally, Partner Quality showed a moderate to small indirect effect on Relationship Strength (0.22, p < 0.01) through Consumer-Brand Relationship. By con- trast, no indirect effect was found for Consumer Person-ality on Relationship Strength through Consumer-Brand Relationship as implied in the theoretical framework.
7. Discussion
While recognizing the eventual influence of some exter-nal factors to this study (e.g., the product category or the context), the results demonstrated a clear contribution of brand personality on consumer-brand relationship. This provides two significant contributions that have both aca- demic and managerial implications. First, the study em-
phasizes the role of consumer-brand relationship in un-derstanding multi-brand, symbolic consumption. Second, the study results offer a more holistic perspective in the understanding of the construct brand personality. While brand personality has been significantly studied and de-veloped in literature with wide applications in brand management the notion of consumer-brand relationship has emerged recently and seems to lack practical imple-mentation.
The research has further demonstrated that the concept of brand relationship is valid and helps to organize mea- ning in a consumer’s mind. Moreover, the successful application of an interpersonal relationship inventory in a branding setting would be of particular interest to marke- ters and may provide a basic and a user friendly frame-work useful in the development of building long term relationship brand strategy.
The analysis suggests that consumer-brand relation-ship mediates all the effects of brand personality on rela-tionship strength and, therefore, brand personality did not demonstrate any direct impact on relationship strength. This may indicate that although important in terms of brand image brand personality per se does not insure rel- ationship stability and durability. The type of consu- mer-brand relationship may rather be an important indic- ator of customer loyalty. This is consistent with the liter- ature that considers brand personality mainly a differen-tiating element in an environment of symbolic consump-tion that allows for the simplification of the process of selection, instead a direct player on the buying decision process [24]. On the other side, these results were not consistent with the conceptual model for consumer-brand relationships proposed by J. Aaker et al. [2] where a di-rect effect of Brand Personality on Relationship Strength was indicated. A possible explanation is that the study of J. Aaker et al. was limited to the brand personalities of Sincerity and Excitement, which are associated to two classes of brand relationships that rely on the same con-structs of the Intimacy-Loyalty and Passion relationships.
Table 1. Standardized effects of the structural model
Partner Quality Consumer-Brand R. Relationship Strength
Direct Indirect Total Direct Indirect Total Direct Indirect Total
BP 0.53* 0.53* 0.66* 0.16* 0.82* 0.06 0.58* 0.64*
C-BR 0.71* 0.71*
CP 0.00 0.00 0.03 0.03 0.02 0.02
RS
PQ 0.30* 0.30* 0.22* 0.22*
(Note: Values in cells are completely standardized estimates. The rounding is the cause of some discrepancies between total effects and the respective direct effect plus the indirect effect. BP = Brand personality, C-BR = Consumer-Brand Relationship, CP = Consumer Personality, RS = Relationship
trength, PQ = Partner Quality. *Coefficient is significant at the 0.01 level (2-tailed).) S
Copyright © 2010 SciRes. JSSM

Brand Relationships: A Personality-Based Approach 212
Although consumer-brand relationship was measured
by a scale of attributes, the study of this phenomenon is not limited to attitudinal aspects. The behavioral com- ponent of brand relationships is captured by relationship strength through Commitment (see Appendix C). This behavioral component reflects operational investments in committed and lasting relationships and can be consid-ered behavioral indicators of loyalty [43].
8. Conclusions
It has been suggested that loyalty is a reflection of buyer brand commitment and an expression of relationship depth. As described by the author’s conceptual model (see Figure 1), the consumer’s brand relationship streng- th is a determinate of consumer personality, brand per-sonality, partner quality and the resulting consumer brand relationship. As such, the consumer’s relationship with a brand is certainly a gestalt with the whole greater than the sum of the parts. Actual brand loyalty results when a consumer’s intellectual and emotional relation-ship with a brand is sufficient to commit that customer to pay higher prices seek out brand/products for repurchase and are a source of referrals. Given this complexity, it is not surprising that the author’s did not find a meaningful correlation between brand personality and relationship strength. It was, however, less problematical to demon-strate the connection between brand personality with consumer brand relationships. The consumer’s relation-ship with a brand is dynamic and formed by the con-sumer’s perception of both the actual physical as well as the psychological elements of the product. It is this com-bination, and its relationship to price, which creates a consumer’s impression of value. The evaluation of a product’s physical aspects tends to be intellectual based on information about actual product features. The psy-chological aspect of the product as discussed is an emo-tional relationship formed by consumer beliefs and needs not to be rational.
One aspect of attempts to bond brands and personality relates to the manipulation of the non physical aspects of the brand personality characteristics. This often is to ei-ther maintain brand loyal customers or conversely steal shifting or disloyal customers from competing brands. There is a danger in relying on brand strategies that focus on the psychological repositioning, as opposed to actual product modification. The danger is that today’s sophis-ticated consumer, utilizing internet driven information, is no longer easily deceived by campaigns designed to promote an “illusion” of change to strengthen brand per-sonality with little actual price or product modifications. This is a clear warning that it is unlikely that Ford’s hol-low slogan “Quality is job one”, which may have stirred emotions and enhanced relationships in the 1980s, would be accepted by today’s intense consumer scrutiny. This
would reinforce that obtaining an in depth understanding of both the consumer brand relationship as well as the underlying relationship strength is essential. This is true as this understanding yields information about the degree of the bond strength between product/company and con-sumer. The delicate nature of a brand bond is illustrated by the difficulty of the author’s to demonstrate a rela-tionship between brand personality and relationship strength.
Fournier and Lee [44] point to the need to fashion a flexible brand relationship that allows individuals to adopt new roles as lives, ages and values change. The author’s model would suggest that, while needing to be adaptable to life and company changes, for the cons- umer brand relationship to be maintained, the company must be careful to assure that both the consumer’s perso- nality and the brand’s personality remain in equilibrium over time and environmentally related incidences.
One environmental threat to the equilibrium, which has not been adequately addressed by firms, relates to the new internet information age consisting of twittering, blogs and web ratings. These instant sources of commun- ication have made it possible, due to widespread and low cost information, for rapid disruptions in a brand’s image to occur for legitimate or irrational reasons. It would se- em that such disruptions could put pressures on the con-sumer relationship by altering brand perception. Fears resulting from sufficient actual incidences over the past five years have resulted in the increased importance of corporate business continuity programs whose major res- ponsibility is the mitigation of threats to the brand which could cause a shift in the relationship equilibrium. Rein-forcing the importance of the consumer as a partner in the relationship, firms must have a comprehensive un-derstanding of how the personalities of their consumer relate to partner quality and the consumer brand rela-tionship. This is essential if they are to effectively react to any incident of imbalance which could result in a shift in consumer brand preferences and thus a loss in con-sumers. Favaro, Romberger, and Meer [45], for example, state that even downturns in business cycles present op-portunities for firms to capture shifting loyal and non loyal consumers from competitors. They recommend that companies seize such opportunities to redirect shifters toward their product choices. While taking what some might consider an “older perspective” by stating that loyals are too costly to redirect it is possible that a broader understanding of the constructs underlying the consumer brand relationship may make attacks on loyals highly feasible.
9. Limitations and Suggestions for Further Research
Regarding the role of consumer personality on the estab-
Copyright © 2010 SciRes. JSSM

Brand Relationships: A Personality-Based Approach 213
lishment of consumer-brand relationships, the studies provided no relevant outcomes. It is interesting to note that the influence of consumer personality on consumers’ brand evaluation seems to be clear according to the lit-erature. This result could be influenced by the fact that, although a consensual framework in the psychology field, the Big Five model of human personality has not been greatly explored in terms of consumer behavior [28]. Thus, this initiative may offer an exploratory basis for further developments of the applicability of the Big Five to the consumer behavior context.
Another possible explanation for the lack of interesting effects relating to the consumer personality construct may be the fact that confidentiality in the responses was not always ensured, as the questionnaires were returned directly to the volunteers that collected the data. Since the questions under the rubric of consumer personality dealt with personal and, perhaps, intimate information, this problem should be addressed in future research.
When interpreting these findings one should have in mind that product category interactions might bias results. Thus, although this research relied on a rich database, future researchers may expand the number of different categories. It may also be advisable that more brand per-sonalities (both utilitarian and symbolic) be introduced to further extend the findings to a larger domain. In par-ticular, two different brands in a single product category might be a good way of controlling the likable product category influence on brand image [46]. In respect to the brand personality framework, significant differences were found only for symbolic or both symbolic and utili-tarian brands rather than for utilitarian brands (Conti-nente and Luso). This may be, however, a confirmation of the relative importance of brand personality construct in less symbolic categories.
10. Acknowledgements
To Fundação para a Ciência e a Tecnologia (FCT) that supported this study.
REFERENCES [1] D. A. Aaker, “Building Strong Brands,” Free Press, New
York, 1996.
[2] J. Aaker, S. Fournier and S. A. Brasel, “When Good Brands Do Bad,” Journal of Consumer Research, Vol. 31, No. 1, 2004, pp. 1-16.
[3] P. Aggarwal, “The Effects of Brand Relationship Norms on Consumer Attitudes and Behavior,” Journal of Consu- mer Research, Vol. 31, No. 1, 2004, pp. 87-101.
[4] M. Blackston, “Beyond Brand Personality: Building Brand Relationships,” In: D. A. Aaker & A. L. Biel, Eds., Brand Equity and Advertising: Advertising’s Role in Building Strong Brands, Lawrence Erlbaum, Hilsdale, New Jersey, 1993, pp. 113-124.
[5] S. Fournier, “Toward the Development of Relationship Theory at the Level of the Product and Brand,” In: F. R. Kardes and M. Sujan, Eds., Advances in Consumer Re-search, Association for Consumer Research, Provo, Vol. 22, 1995, pp. 661-662.
[6] S. Fournier, “Consumers and their Brands: Developing Relationship Theory in Consumer Research,” Journal of Consumer Research, Vol. 24, No. 4, 1998, pp. 343-373.
[7] S. Fournier and J. L. Yao, “Reviving Brand Loyalty: A Reconceptualization within the Framework of Consumer- Brand Relationships (Working Paper),” Harvard Business School, Boston, 1996.
[8] J. Jacoby and R. Chestnut, “Brand Loyalty,” Ronald Press, New York, 1978.
[9] K. L. Keller, “Brand Synthesis: The Multidimensionality of Brand Knowledge,” Journal of Consumer Research, Vol. 29, 2003, pp. 595-600.
[10] J. L. Aaker, “Dimensions of Brand Personality,” Journal of Marketing Research, Vol. 34, No. 3, 1997, pp. 347-356.
[11] J. L. Aaker, V. Benet-Martinez and J. Garolera, “Cons- umption Symbols as Carriers of Culture: A Study of Japanese and Spanish Brand Personality Constructs. Jour- nal of Personality and Social Psychology, Vol. 81, No. 3, 2001, pp. 492-508.
[12] G. J. O. Fletcher, J. A. Simpson, G. Thomas and L. Giles, “Ideals in Intimate Relationships,” Journal of Personality and Social Psychology, Vol. 76, No. 1, 1999, pp. 72-89.
[13] P. T. Jr. Costa and R. R. McCrae, “The NEO Personality Manual,” Psychological Assessment Resources, Odessa, 1985.
[14] O. P. John and S. Srivastava, “The Big Five Trait Tax-onomy: History, Measurement, and Theoretical Perspec-tives,” In: L. A. Pervin and O. P. John, Eds., Handbook of Personality: Theory and Research, 2nd Edition, Guild-ford Press, New York, 1999, pp. 102-138.
[15] R. R. McCrae and P. C. Jr. Costa, “The Structure of In-terpersonal Traits: Wiggins’s Circumplex and the Five- Factor Model,” Journal of Personality and Social Psy-chology, Vol. 56, No. 4, 1989, pp. 586-595.
[16] I. Altman and D. A. Taylor, “Social Penetration: The Development of Interpersonal Relationships,” Holt, Rine- hart and Winston, New York, 1973.
[17] D. E. Allen and J. Olson, “Conceptualizing and Creating Brand Personality: A Narrative Theory Approach,” In: J. Aaker & S. Fournier, Eds., A Brand as a Character, a Partner and a Person: Three Perspectives on the Ques-tion of Brand Personality, pp. 392-393; In: F. R. Kardes & M. Sujan, Eds., Advances in Consumer Research, As-sociation for Consumer Research, Provo, UT, Vol. 22, 1995, pp. 391-395.
[18] K. Storbacka, T. Strandvik and C. Grönroos, “Managing Customer Relationships for Profit: The Dynamics of Re-lationship Quality,” International Journal of Service In-dustry Management, Vol. 5, No. 5, 1994, pp. 21-38.
[19] M. S. Clark, R. Ouellette, M. C. Powell and S. Milberg, “Recipient’s Mood, Relationship Type and Helping,”
Copyright © 2010 SciRes. JSSM

Brand Relationships: A Personality-Based Approach
Copyright © 2010 SciRes. JSSM
214
Journal of Personality and Social Psychology, Vol. 53, No. 1, 1987, pp. 94-103.
[20] A. E. Auhagen and R. A. Hinde, “Individual Character- istics and Personal Relationships,” Personal Relation-ships, Vol. 4, No. 11, 1997, pp. 63-84.
[21] Superbrands, “Superbrands Portugal 2005,” Retrieved February 2007. http://www.superbrands. com
[22] Interbrand, “The 100 Best Global Brands by Value 2005,” Retrieved April 2006. http://www.interbrand. com
[23] Automóvel Club de Portugal, “Análise de Mercado em 2006,” Retrieved October 2006. http://autos.acp.pt/pdf/ 2006.pdf
[24] J. Lannon, “Asking the Right Questions: What do People Do with Advertising?” In: D. A. Aaker & A. Biel, Eds., Equity and Advertising: Advertising’s Role in Building Strong Brands, Lawrence Erlbaum, Hilsdale, New Jersey, 1993, pp. 143-162.
[25] J. Kapferer and G. Laurent, “La sensibilité aux marques, ” In: J. Kapferer & J. Thoenig, Eds., La Marque: Moteur de la Competitivité des Entreprises et de la Croissance de l’Économie, McGraw- Hill, Paris, 1989, pp. 93-124.
[26] Instituto Nacional de Estatística, “Census 2001–Resul- tados Definitivos,” INE, Portugal, 2002.
[27] J. W. Berry, “On Cross-Cultural Comparability,” Inter- national Journal of Psychology, Vol. 4, No. 2, 1969, pp. 119-128.
[28] H. Baumgartner, “Toward a Personology of the Con- sumer,” Journal of Consumer Research, Vol. 29, No. 2, September 2002, pp. 286-292.
[29] D. P. McAdams, “What do We Know when We Know a Person?” Journal of Personality, Vol. 63, No. 3, 1995, pp. 365-396.
[30] P. T. Jr. Costa and R. R. McCrae, “Revised NEO Person-ality Inventory (NEO-PI-R) and NEO Five-Factor Inven-tory (NEO-FFI) Professional Manual,” Psychological Assessment Resources, Odessa, 1992.
[31] M. P. Lima, “NEO-PI-R: Contextos teóricos e Psico- métri-cos ‘OCEAN’ ou ‘Iceberg’?” Unpublished Doctoral Dissertation, Faculdade de Psicologia e Ciências da Educação, Universidade de Coimbra, Portugal, 1997.
[32] A. Lancastre and L. F. Lages, “The Relationship between Buyer and a B2B e-Marketplace: Cooperation Determi-nants in an Electronic Market Context,” Industrial Mar-keting Management, Vol. 35, 2006, pp. 774-789.
[33] J. J. Jr. Cronin and S. A. Taylor, “Measuring Service Quality: A Reexamination and Extension,” Journal of Marketing, Vol. 56, No. 3, 1992, pp. 55-68.
[34] J. R. Austin, J. A. Siguaw and A. S. Mattila, “A Re-Ex-amination of the Generalizability of the Aaker Brand Per-sonality Measurement Framework,” Journal of Strategic Marketing, Vol. 11, No. 2, 2003, pp. 77-92.
[35] J. L. Arbuckle, “Amos 16.0 User’s Guide,” Amos Deve- lopment, Spring House, 2007.
[36] J. C. Nunnally, “Psychometric Theory,” Mc-Graw-Hill, New York, 1978.
[37] R. P. Bagozzi and U. M. Dholakia, “Antecedents and Purchase Consequences of Customer Participation in Small Group Brand Communities,” International Journal of Research in Marketing, Vol. 23, No. 1, 2006, pp. 45- 61.
[38] P. M. Bentler, “EQS Manual,” BMDP, Los Angeles, CA, 1989.
[39] J. F. Jr. Hair, R. E. Anderson, R. L. Tatham and W. C. Black, “Multivariate Data Analysis: With Readings,” 5th Edition, Prentice Hall, London, 1998.
[40] R. P. Bagozzi and G. R. Foxall, “Construct Validation of a Measure of Adaptative-Innovative Cognitive Styles in Consumption,” International Journal of Research in Marketing, Vol. 13, No. 3, 1996, pp. 201-213.
[41] J. Anderson and D. Gerbing, “Structural Equation Mod-eling in Practice: A Review and Recommended Two-Step Approach,” Psychological Bulletin, Vol. 103, No. 3, 1988, pp. 411-423.
[42] C. Fornell and D. F. Larcker, “Evaluating Structural Equation Models with Unobservable Variables and Mea- surement Error,” Journal of Marketing Research, Vol. 18, No. 1, 1981, pp. 39-50.
[43] G. T. Gundlach, R. S. Achrol and J. T. Mentzer, “The Structure of Commitment in Exchange,” Journal of Mar-keting, Vol. 59, No. 1, 1995, pp. 78-92.
[44] S. Fournier and L. Lee, “Getting Brand Communities Right,” Harvard Business Review, 2009, pp. 105-111.
[45] K. Favaro, T. Romberger and D. Meer, “Five Rules for Retailing in a Recession,” Harvard Business Review, 2009.
[46] A. Drolet and J. Aaker, “Off-Target? Changing Cogni-tive-Based Attitudes,” Journal of Consumer Psychology, Vol. 12, No. 1, 2002, pp. 59-68.

Brand Relationships: A Personality-Based Approach 215
Copyright © 2010 SciRes. JSSM

Brand Relationships: A Personality-Based Approach 216
Copyright © 2010 SciRes. JSSM

Brand Relationships: A Personality-Based Approach
Copyright © 2010 SciRes. JSSM
217

J. Service Science & Management, 2010, 3, 218-226 doi:10.4236/jssm.2010.32027 Published Online June 2010 (http://www.SciRP.org/journal/jssm)
Copyright © 2010 SciRes. JSSM
An Empirical Analysis on Industrial Organization Structure of Chinese Software Service Outsourcing
Jiawen Shen1*, Heng Li2
1School of Economics and Management, University of Science and Technology Beijing, Beijing, China; 2Department of Building and Real Estate, Hong Kong Polytechnic University, Hong Kong, China. Email: [email protected] Received February 8th, 2010; revised March 10th, 2010; accepted April 17th, 2010.
ABSTRACT
The global service outsourcing industry has developed rapidly; but how about the software service outsourcing industry in China? Employing the combination research methodologies of field survey, literature research and analysis of the collected data from the survey questionnaire using the SPSS statistic software and its relativity tests, this empirical study analyzed the market structure and performance of Beijing software service outsourcing industry. Based on the SCP paradigm of the industrial organization theory, the conclusion revealed that the market concentration of Beijing software service outsourcing industry was on the low level. The industry possesses the characteristics of low risk, low profit and low product differentiation. There is an apparent trend that increasing profit occurs to the large scale service organizations. Low level price competition dominates the industry at present. The market performance of the industry is therefore low, resulting in the low average profit to most service companies; but the average ratal of these firms is on an upward trend year after year. Keywords: Industrial Organization, SCP Paradigm, Software, Service Outsourcing, Industrial Structure, Empirical Analysis
1. Introduction
With the rapid development of information technology and increasing opening of trade environment, a new round of industry and economy transformation occurs on global scale, which is reflected by the formation of modern ser-vice industry, tech-concentrated manufacturing and more investment in R & D. This change promotes the devel-opment of outsourcing. Nowadays, the global service outsourcing industries have been developing rapidly, and more and more companies are turning into “the company without walls”. Saying “the world flattens”, Thomas L. Friedman described vividly this phenomenon in his book, “The World is Flat”.
The financial tsunami which was triggered by the sub- loan crisis of USA in 2008 had resulted in the serious impact on global economy. On the other hand, it has also made new opportunities for development of the global service outsourcing industry. Many multinational com-panies facing to re-shuffle have to reduce costs in order to preserve their core competencies, and meanwhile, try to outsource their non-core business. The international service outsourcing market will have a huge space for development. At the same time, with the consummation
of market-directed economy system and the decline of transaction costs of the service outsourcing market, the domestic service outsourcing market is also about to form new space for development. In 2007, the global software and information service industry had reached the scale of 940 billion U.S. dollars, of which the United States accounted for 36.5%; the European Union ac-counted for 27.7%; Japan 9.5% and China 8.7%. In 2007, China’s software service industry had achieved the value of 583.4 billion Yuan, of which outsourcing software and services exports accounted for 10.24 billion U.S. dollars. [1] The software service outsourcing has been developing rapidly in many Chinese cities in recent years, which promoted the upgrading of the industrial structure and the transformation of economic development models. Focusing on the Beijing outsourcing industry of software service, this paper empirically analyzed the status of the industrial and organizational structure. It provided the useful results and directions to the future development of the Chinese service outsourcing industry.
2. Literature Review
With regard to the definition of service outsourcing, ac-cording to “the notification of Ministry of Commerce on

An Empirical Analysis on Industrial Organization Structure of Chinese Software Service Outsourcing 219
the implementation of Qian Bai Si project on service outsourcing” issued in 2006 of China’s Commerce Min-istry, the service outsourcing is referred to the business of information system framework, application manage-ment and business process optimization, contracted to the outside service suppliers in order to reduce costs, optim- ize the industrial value chain and enhance the core com-petence. In the Business Dictionary, service outsourcing, which is generally based on the contract of agreed stan-dards, costs and conditions, transfers the service origi-nally performed by in-house staff to external organiza-tions. According to GARTNER, the IT service market is divided into the discrete service and the service out-sourcing; whereas the service outsourcing is further di-vided into information technology outsourcing and busi-ness process outsourcing.
The research of outsourcing service in economics can be summarized as follows. Firstly, it proposes the per-spective of transaction cost such as the Coase’s theory of transaction costs. Coase (1937), the leader of the field, first introduced the concept of transaction costs to the analysis of internal and external activities, and brought forward to that the number of transactions between manu- facturers with service providers would be increased with the deepening of Socio-professional division of labor. If the marginal revenue of social division of labor is greater than the marginal growth of transaction costs, then the division of labor would be deepened to promote the im-provement of manufacturing efficiency. Secondly, it pro-poses the perspective of the international division of la-bor such as the theory of comparative advantage, re-source endowments theory. Thirdly, it proposes the per-spective of economies of scale such as Krugman’s new trade theory that the intra-industry trade of the division of labor benefits from the economies of scale. Fourthly, the perspective of company management, such as the theory of company’s core competitiveness, supply chain and value chain theory.
Under the less market-oriented status, the service business such as the R & D, information, logistics, op-erations, marketing, was supplied usually by the various departments of a company. With the development of spe- cialization and the scale of economy, as well as the de-cline of market transactions cost, these services have now been gradually outsourced. Gradually, the service out-sourcing industry is formed. The outsourcing improves the efficiency of resources allocation and the market value of social production. It strengthens the core com-petence of the outsourcing organization. The main objec-tives of the outsourcing company include to reduce oper-ating costs, to improve the core competitiveness, to im-prove the level of international performance, to obtain the external resources, to improve the profit of business restructuring, to divestiture the business in difficulty management and to share the risks with others, etc.
On the research of industrial organization theory, acc- ording to the different theoretical basis and research me- thods and choosing a different focus, scholars proposed numerous ideas in different times. Harvard University advocated the structuralism of antitrust and anti-concen-tration, which is based on monopolistic competition the-ory, by the statistic methodology of empirical study, and focusing on market structure. Chicago University used company performance as a judging criterion. The theory is based on the competitive market and focuses on mar-ket performance of an organization. The new industrial organization theory advocated the behaviorism which objects unfair conducts and is based on the transaction cost theory by the deductive methodology of reason-ing-based. [2] Market structure and market performance are the main fields of the Harvard Theory. It advocates that market structure rests with market conduct and that the market conduct rests with market performance, that is, S→C→P. The SCP paradigm of the Harvard Theory established the basic analytical framework for the early theoretical studies of industrial organization. The Har-vard Theory mainly puts the empirical studies on the relationship of market structure and performance, such as the Bain's concentration, concluding that the entry barri-ers were positively correlated with the profitability. The Chicago Theory focuses on the price conduct. The new industrial organization theory focuses on the company conduct.
The literature research over internet did not find the academic literature based on the industrial organization theory for the software outsourcing. It is perhaps due to the fact that the software service outsourcing is a new industry.
3. Research Methodology and Data Sources
Guided by the industrial organization theory and employ- ing the qualitative and quantitative analytical method, the combination of theoretical research and questionnaire survey, the correlation test of statistical methods and the application of SPSS statistical analysis software, we sur-veyed 200 software service outsourcing companies based in Beijing. Sixty nine (69) questionnaires returned which formed the basis of our data analysis. The research re-vealed the overall status of software service outsourcing industry in Beijing.
The data retrieved from the following files: “the Rep- ort of China Software Industry Development Research 2008”, “the Blue Book of Beijing Software Industry De-velopment 2008”, “the Statistical Communique of Bei-jing National Economic and Social Development in 2007”, and the Statistics data of questionnaire to Bei-jing's service outsourcing firm in 2008.
From the industry organization theory point of view, it is the first time to exercise the methods of combination of the empirical research and the expanded SCP paradigm to
Copyright © 2010 SciRes. JSSM

An Empirical Analysis on Industrial Organization Structure of Chinese Software Service Outsourcing 220
the software service outsourcing industry at present.
4. The Industry Organization State of Software Service Outsourcing in Beijing
It is necessary to describe the industry organization status of software service outsourcing in Beijing before the SCP paradigm analysis of industry organization. Accord- ing to the statistical result of the survey questionnaire and the relevant information, we analyzed the industry state from four aspects: industry overview, firm kinds, firm size, and human resource structure.
4.1 Industry Overview
An upward trend shows that the Beijing software service outsourcing industry contributes to the City’s economy growth year after year. In 2007, the Beijing software in-dustry had 241,000 employee and more than 5000 ser-vice companies. [3] According to the data published by the Beijing statistic bureau, Beijing’s GDP in 2007 was 900.62 billion Yuan, of which 82.48 billion Yuan was contributed by the information transmission, computer services and software industry. In 2007, the total busi-ness income of Beijing software service industry was 125.2 billion Yuan, a 44.3 billion Yuan increase or a 28.8% growth over 2006. Its weight in Beijing’s GDP increased from 2.6% in 2006 to 4.9% in 2007. [4] Ac-cording to the statistics of the Beijing Customs and the Beijing Commerce Bureau, the export value of software by Beijing-based companies reached 459 million U.S. dollars in 2007. The rapid development of software ser-vice outsourcing industry promoted the optimization and upgrading of Beijing economic structure.
4.2 Type of Service Companies
According to the statistics analysis on survey question-naire, the Beijing software services outsourcing industry made up of the wholly owned companies by foreign firms (accounting for 52%), the foreign-controlled joint ventures (accounting for 14%), the joint ventures con-trolled by Chinese (accounting for 12%) and the Chi-nese-founded firms (accounting for 22%).
According to the research results of the Japan Industry Economy Institute, which was also based on a survey conducted in 2007, the sub-contractors of Japanese in-formation service outsourcing companies include the subsidiary of the Japanese companies which accounted for 37%, the subsidiaries of another Japanese firms which accounted for 20% and the subsidiaries of over-seas firms which accounted for 43% [5].
4.3 Firm Scale
According to the survey results, the firms that had 1000~ 5000 employees accounted for 12%; the firms having
300~999 employees accounted for 23%; the firms having 100~299 employees accounted for 26%; and the firms that have no more than 100 employees accounted for 39%. The data shows that the scale of the majority com-panies of Beijing service outsourcing industry was small, and there are not the large firms with global-scale com-petence. At present, Neusoft, which is the largest corpo-ration of service outsourcing in China, has about 13,000 employees. But, there is not the service outsourcing firm that has more than 6000 employees in Beijing. The data from the study shows that the small-sized firms are the main part of the Beijing software service outsourcing industry. Those having 100-1000 employees account for about 49%.
4.4 Human Resource Structure
For the software service outsourcing industry in Beijing, there is a rich reserve of human resource, a dense loca-tion of universities and research institutes in science and technology fields, a high degree of aggregation of indus-tries, a large amount of employees with high quality and full features of stamina. The Beijing software service industry contained 241,000 employees in 2007. It is ex-pected that this employee team will grow to 32 million by 2010. From the aspect of education structure, the em-ployees with undergraduate education accounted for more than 74%, of which Master’s degree or above ac-counted for 15%. From the aspect of age structure, the employees under the age 40 accounted for 90%, of which those under the age 29 accounted for 62%; those between 30-39-year-old accounted for 28%. [4] Based on the analysis of survey questionnaire, we found that the tech-nical staff accounted for 86% in the total number of staff of the Beijing software service outsourcing firms, of which project managers (PM) account for 7%, system engineers (SE) accounted for 26% and programmers (PG) accounted for 53% of the total number of employees.
5. Analysis of the Software Service Outsourcing Industry in Beijing
The “Structure-conduct-performance” analysis paradigm (SCP paradigm) considers that the market structure de-termines the competition in an industry, the conduct of business strategy and the performance. The traditional industrial organization theory utilizes the statistic method of empirical analysis as its primary research methodol-ogy. Based on the presupposition that the industrial stru- cture was given and that the existing differences among firms are the exogenous variable, it determines the Indus- trial competitive state, makes statistic cross-section ob-servation on the actual conduct of both the industry and each individual firm, and then correlate the analysis re-sults with the market performance of the firms. The new industrial organization theory adopts the research meth-
Copyright © 2010 SciRes. JSSM

An Empirical Analysis on Industrial Organization Structure of Chinese Software Service Outsourcing 221
odology of deductive reasoning. It considers that the tra-ditional industrial organization theory over relies on em-pirical statistical analysis and lacks of theoretical basis and formal models on market analysis so that it is only suitable for statistic analysis in short term. It is necessary to penetrate the study of the conduct attributions of par-ticipants in economic activities in order to understand the reasons of the formation and change of industry structure. Our study described in this article is based on the ex-panded SCP paradigm for the empirical analysis of the Beijing software service industry.
5.1 Market Structure Analysis
Market structure is a concept of the relationship between market competition and market monopoly. Here, we studied the four qualitative criteria such as market con-centration, entry and exit barriers, product differentiation and scale economy for quantitative and qualitative analy-sis of market structure of the Beijing software services outsourcing industry.
5.1.1 Market Concentration Market concentration is a quantitative criterion of the market structure to measure the differences in number and related scale of the firms. The market concentration denotes the distribution of firm’s relative size and the competition level of the industry. Following two param- eters are commonly used: the absolute concentration Rate (CRn)
1
/n
i
CRn Xi X
(1)
and Herfindahl Hirschman Index (HHI)
2
1
( / )n
i
HHI Xi X
(2)
( /Xi X , a firm’s market share). CRn indicates the concentration rate of the largest
firms in the industry, but does not indicate the number and the scale proportion of all firms in the industry. Al-though HHI is better than CRn, HHI possesses some shortcomings in that the intuitive is poor, the weight of minor-firms is too small, and the data is difficult to col-lect. Here, we adopt the indicator of CR4 and CR8. The proportion of the four largest firm and the eight largest companies accounted for the total output of the industry.
The turnover of the Beijing software service industry was 125.2 billion Yuan in 2007 [3], of which 459 million U.S. dollars was from the software exports. Analysis of the data from the survey questionnaire revealed the eight largest firms in the Beijing software service outsourcing industry and the results of calculation for the Beijing software service outsourcing industry in 2007 are:
CR4 = 27.6%, CR8 = 38.2%. According to the data, we can draw the conclusion that
the concentration of the Beijing software services out-sourcing industry is at the low level. According to the Bain classification and taking into the account of the number of software exporting firms in Beijing which was more than 200 in 2007, we concluded that the software services outsourcing in Beijing belonged to atom-type markets and was a fully competitive market, of which the scale economy was lower, so that the firms in the indus-try would be difficult to accumulate capital to carry out technology innovation and to form the core competence.
The reasons that resulted in the low concentration of Beijing software service outsourcing industry may lie in the following aspects: Firstly, the Beijing software ser-vice outsourcing industry was still at the stage of low level competition. The market was at the state of lower level equilibrium. The firms could not afford to build strong brands. So the industry concentration was low. Secondly, the Beijing software and service outsourcing industry is an emerging industry which is still in the ini-tial development stage. The small and medium-sized firms are difficult to expand market rapidly at the stage, but easy to form a fully competitive industry structure, thereby affecting the market concentration. Thirdly, the diversification of market segments results in the decrease of the industrial concentration. As a result of the needs for the growing diversity of software service outsourcing industry, the firms providing software services busi-nesses paid more attention to market segments and de-veloped the differentiated products and services. The increase of market segments resulted in the reduction of market concentration.
5.1.2 Analysis of Barriers to Entry and Hurdles to Exit Analysis of barriers to entry Barriers to entry refer to the degree that the existing firms of industry have market dominance in comparison with the firms that are potentially about to enter or have just entered the industry. Entry barrier is an important factor that affects the relationship between market mo-nopoly and market competition in the industry. It is also a direct reflection of the market structure. The reasons for the formation of entry barriers include: economy sc- ale, necessary capital and buried cost, product difference, absolute cost, policies and laws and the deferred reaction of existing firms.
About the entry barriers of Beijing software service outsourcing industry: First, there are no barriers to enter the administrative access control. The investment admin- istration system has the approval power on the macro- control industries such as iron and steel industries; but for the software service outsourcing industry, the Gov-ernment has introduced a number of policies to encour-age the development of service outsourcing industry. Not only are there no policy entry barriers, but there are also many government incentives. Second, overall, technical
Copyright © 2010 SciRes. JSSM

An Empirical Analysis on Industrial Organization Structure of Chinese Software Service Outsourcing 222
barriers are lower to enter. Outsourcing services are know- ledge-intensive industries but there is little difference in the enterprise management and marketing means. It is easy to make up through imitating and introducing talent. The R & D centers and branches of multinational out-sourcing services companies in Beijing have a great mo-nopoly in their market segment. Many software service outsourcing firms, especially those minor-firms, have to be the taskmaster of software blue-collars. They have to face competition from a large number of potential en-trants because they do not grasp the core technology. Third, for cost barriers, the start-up cost for a company is low. It is easy for potential entrants to find the starting point from the entrepreneurial company of tens thou-sands dollars to large-scale integration corporation of billions of dollars. Fourth, the dominant oligopoly firms do not come into being, so there are no androgenic barri-ers to enter the industry. Fifth, there is no ownership of discrimination to enter. When the private capitals and foreign capitals enter industries such as banks, petroleum and petrochemical, power and others, they will face many limits to get approval, but this is not the case for the existing service outsourcing industry. So much more capitals are attracted especially the foreign capital to en-ter the industry. In short, the barriers to enter the Beijing software service outsourcing industry are relatively low. Analysis of barriers for exit Exit barrier refers to the price to be paid or cost to exit
the industry, such as unused asset, exit cost, strategic impact, psychological factors, government restriction and the social obligation. Through the investigation, we dis-covered following issues for the Beijing software service outsourcing industry: First, the offices of most firms were leased. The investment for fixed assets is mainly concentrated in the office equipment such as computers. Therefore, the cost of unused assets is relatively low. Second, the majority of companies used the way of dis-patch staff. So the resettlement cost of personnel is rela-tively low. Third, the strategic impact is medium due to the fact that most firms are wholly-owned or the joint ventures of multinational companies in Beijing. Exit will affect multinational corporations. Fourth, psychological factor play roles. Since the wage level is higher than the average level of the society, employees in the industry do not want to leave the industry. Fifth, the Government actively encourages service outsourcing industry due to its concern of the unemployment rate and the change in the pattern of economic development. There would be some restriction from the Government if it was to exit. In short, the barriers to exit of Beijing software service out-sourcing industry are relatively low. Conclusion Beijing software services outsourcing industry is rela-
tively a low risk and low profit industry. According to the relationship matrix of barriers for entry and barriers
for exit, location of Beijing software service outsourcing industry in the relationship matrix is as Figure 1.
From the company profits point of view, the high bar-riers to entry and low barriers to exit will be beneficial to the development of the Beijing software service out-sourcing industry, which means the low-risk, high-profit, easy to accelerate and scale up of service outsourcing firms. While increasing the entry barriers will lead to the price distortions, it can prevent the small enterprises with low efficiency from entering the market so as to increase the industrial concentration. The whole industry thus gains access to scale economy, resulting in the decrease of cost of resources re-allocation. In addition, more entry barriers and product differentiation will improve the di-versification of products with more heterogeneity and overall effectiveness of the community, thereby resulting in the naissance of many sub-industries.
5.1.3 Product Differentiation Differentiated products or services affect the firms to control the market successfully. The software service outsourcing firms formed different business to meet dif-ferent demands of consumers, which contains differenti-ated products and services. According to the question-naire statistic, we analyzed the three indicators: the core business, customer distribution and the target market. The results are listed as follows:
First, looking from the aspect of the main business types, the firms primarily working on outsourcing of in-formation services (IT0) accounted for 63.16%; the firms working on business process outsourcing (BPO) ac-counted for 5.26%; the firms mainly working on software development and sales accounted for 26.32%; the firms mainly working on embedded product development and sales accounted for 2.63%; and all other firms accounted for 2.63%.
Second, looking from the aspect of customer industry differentiation, the IT industry accounted for 65.57%; the financial industry accounted for 8.11%; the telecommu-nications industry accounted for 8.11%; the commerce industry accounted for 5.41%; the advertising industry accounted for 2.7%; and other industries accounted for 2.7%.
Barriers to entry
Low High
High high risk, low profit
high risk, high profit
Barriers to exit
Low low risk, low profit
low risk, high profit
Figure 1. Relationship matrix of barriers for entry & exit
Copyright © 2010 SciRes. JSSM

An Empirical Analysis on Industrial Organization Structure of Chinese Software Service Outsourcing 223
Third, looking from the aspect of target markets dif-ferentiation, the firms whose outsourcing contracts were mainly from Japanese companies accounted for 52%; the firms whose outsourcing contracts were mainly from US companies accounted for 35%; the firms whose outsou- rcing contracts were from EU companies accounted for 7%; and the firms whose outsourcing contracts were fr- om companies located in Hong Kong accounted for 6%.
Through the comprehensive analysis of the above data, we could find that the software service outsourcing firms in Beijing mainly focused on the ITO business from Ja-pan and USA. The product differentiation was indistinc-tive on a whole.
5.1.4 Scale Economy Scale economy is an economic phenomenon, in which the expansion of production scale of firms conduces to the constant improvement of product production efficie- ncy, therefore achieving the economic goals. Returns to scale is referred to that the output change is proportion-ally related to the change of input factors, including in-creasing returns to scale, constant and decreasing. Gen-erally, the approach to distinguish returns to scale is as follows: Two input factors have increased in λ-fold, out-put will increase in h-fold, that is:
hQ = f (λK, λL) (3)
If h = λ, the constant returns to scale; if h < λ, the scale of diminishing returns; if h > λ, the increase returns to scale. Here we use the correlation test of statistic, the application of statistical analysis software SPSS, to test the correlation between firm scale and firm output of the Beijing software service outsourcing industry. Test method Correlation analysis is a statistical method to examine
the relation between the different variables; whereas the correlation coefficient measures the linear relationship and direction between two variables. The linear correlation analysis is a mathematics tool involved in the correlation coefficient to study the linear of the two variables. Due to the fact that sampling error always exists in sample data, the sample correlation coefficient between two variables, if not zero, must pass the test. The assumption of the test is that the correlation coefficient between the two vari-ables is zero. In general, assuming the probability P is true when the domain value is 5%, if P < 5%, the original hypothesis false, or accept the original hypothesis. Indicators and data source Based on the characteristics of software service out-
sourcing industry, the total number of employees in any firm is generally the main indicators to measure the firm scale. The study takes the number of employees of out-sourcing firms as dependent variable, and takes the turn-over which is the key indicators of a firm’s output as independent variables. Due to the fact that the service outsourcing is an emerging industry, it is difficult to col-
lect its time-series data but the cross-section data is rela-tively easy to obtain. According to the 2008 survey ques-tionnaire, we take the statistic on the number of employ-ees of firms and their turnovers in 2007, through the sta-tistical analysis software SPPS for the correlation test on the data. Descriptive Statistics is shown as Table 1 T Test of single sample is shown as Table 2 From Table 2, the result of T test is as follows, df = 58,
P = 0 < 0.05, so the sample is statistically significant. Result of Correlation test is shown as Table 3 From Table 3, The result of correlation test shows that
the Pearson correlation coefficient is 0.455 and P = 0. Overall, the assumption of zero correlation coefficient between the two variables is rejected. Significant correla-tion occurs on the 0.01 level (bilateral). Therefore, a strong positive linear correlation exists between the firm employee number and the firm turnover.
Table 1. Descriptive Statistics of Employee number and Turnover of firms
Mean Standard N
Employee number 476.9 869.797 58
Turnover 4764.41 7498.641 58
Table 2. T Test of single sample
Test Value = 0
95% Confidence Interval
of the Difference
t dfSig.
(2-tailed)Mean
difference Lower Upper
Employee 4.369 58 0.000 360.78571 195.2981 526.2733
Turnover 4.572 58 0.000 4583.7568 2574.4719 6593.0417
Table 3. Result of Correlation test
Employee
number Turnover
Pearson correlation 1 0.455**
Significant(Bilateral) 0 Employee
number
N 58 58
Pearson correlation 0.455** 1
Significant (Bilateral) 0 Turnover
N 58 58
**. Significant correlation on the 0.01 level (bilateral)
Copyright © 2010 SciRes. JSSM

An Empirical Analysis on Industrial Organization Structure of Chinese Software Service Outsourcing 224
Conclusion Through the above correlation test, it can be judged:
The scale economy of software service outsourcing in-dustry in Beijing was taking on the significant increasing returns to scale, with which the firm earning grows with its production expansion and the increasing of firm earn-ing in turn promotes the firm production expansion. The different scales of production will lead directly to the differences in economic and social benefits. According to the statistic analysis of questionnaire, the result shows that the firms whose turnover in 2007 was more than 100 millions Yuan accounted for 12%; the firms with 10~100 million Yuan turnover accounted for 63%; the firms with less than 10 millions turnover accounted for 25% of the total samples, increasing returns to scale. Through the questionnaire survey on the software service firms in Beijing, we found that the average employee number is 476 persons per firm. Therefore, it should be encouraged that the Beijing software service outsourcing firms carry out mergers, restructuring and integration. To improve scale economy of the industry, it is also important to speed up the formation of large groups and software outsourc-ing service outsourcing industry alliance.
5.2 Analysis of Market Conduct
Market conduct refers to that the firm takes adjustment actions to meet market requirement to achieve its stated objectives. A firm’s market conduct mainly includes mar-ket-competitive conduct and market co-ordination con-duct. Market-competitive conduct includes the pricing conduct with the characteristics of controlling and influ-encing price, mergers and acquisitions conducts with the characteristics of property right change and organization adjustment, sales promotion conducts with the purpose of enhancing competitiveness and expanding market, as well as advertising, research and development, and so on. Market coordination conduct mainly includes cooperate competitive behavior such as firms strategic alliances.
The market-competitive conduct of the Beijing soft-ware service outsourcing industry could be divided into three types: First, R & D centers established in Beijing by multinational outsourcing services corporations whose main businesses are from the parent corporations. They basically do not participate in market-competition. Sec-ond, the branches opened in Beijing by the multinational corporations. They are mainly engaged in the business of the China market. Due to the high entry barriers such as technology, capital, brand, performance, these branches keep the oligopoly in the market segments and have much more competition advantage than domestic firms. Third, the Chinese firms which are engaged in overseas service outsourcing business. Most of them are wholly foreign-owned and joint-venture; some are subsidiary of institutes; and a few of private enterprises. These firms mainly participate in the international market-competi-
tion of service outsourcing by taking the advantage of the large amount of high-quality, inexpensive software tal-ents in Beijing. Due to the considerations of the technical control by the multinational corporations, the internaliza-tion of core technology is becoming clear with character-istics of the processing trade of low-tech and labor-in- tensive, while increasing the outsourcing of labor-inten- sive and low technology content, for example, the out-sourcing projects from Japanese firms are generally the sub-modules which were disassembled basically by the general contractor through systematic design and struc-ture analysis. Due to the lack of core technology, many Beijing’s service outsourcing companies have to be the passive sub-contractors under the general contractor of overseas software service outsourcing, and are in the embarrassment position of taskmasters of the software blue-collar. Therefore, the market competition was so high. The pricing becomes an issue in the throat-cutting competition, which often adopts the head-count method that is based on the quoted labor costs in order to earn the low profit via the salary difference between the domestic market and foreign market.
From the aspect of pricing conduct, the low industrial concentration led to the full competition conduct. The present pricing is primarily controlled by the overseas contractors who generally denominate the market as they are attracted by the low labor costs. At present, the con-duct of Beijing service outsourcing enterprises to im-prove the price competitiveness mainly reflect in high- tech qualification, industry qualification certification and management certification. Based on the statistic of the questionnaire, in the Beijing software service outsourcing industry, the firms that have high-tech certification ac-counted for 83%; the firms that have CMMI certification accounted for 33%; the firms having CMM certification accounted for 43%; the firms having ISO20000 certifica-tion accounted for 8%; the firms having BS7799 certifi-cation accounted for 3%; the firms having ISO27001 certification accounted for 16%; and the firms having 2-soft certification accounted for 8%. According to the statistic data of the Beijing software and information promotion centre, the combined numbers of firms that got the CMM/CMMI certifications were 152 in 2007, accounting for 24.9% and thus becoming No. 1 in the country; the numbers of firms that got the ISO20000 cer-tification were 7 in the same year, accounting for 50% in the country; the firms having obtained the ISO27001 certification added up to 22, accounting for 21.5% in the country. These data shows that the Beijing software ser-vice firms improve the price competitiveness through strengthening enterprise management certification.
Overall, the market conduct of the Beijing software service outsourcing has more, low level price competi-tion, but uses few of non-price competition strategy. Looking from the aspect of mergers acquisitions conduct,
Copyright © 2010 SciRes. JSSM

An Empirical Analysis on Industrial Organization Structure of Chinese Software Service Outsourcing 225
although the Beijing government encourages mergers acquisitions, industry restructuring and the alliances, there have not been any firms or unions formed in the Beijing software service outsourcing industry with international competitiveness until now.
5.3 Analysis of Market Performance
Market performance reflects the ultimate economic suc-cesses such as the price, firm scale, production capacity, cost, profit, production quality, varieties and technology progress, which is the result of the given market conduct in the given market structure. The market performance indicates the market efficiency on resources allocation. The scholars represented by Bain advocated the financial indicators; whereas Lerner and other scholars preferred to the market power indicators. There are analysis indi-cators such as profit ratio, Bain index, the efficiency of resource allocation, Lerner index, rate of return, Tobin's q ratios and so on. Here, we adopt the indicators of the profit ratio and the ratal of firms to quantitatively analyze the market performance of the Beijing software service outsourcing industry.
5.3.1 Analysis of Firm Profit Ratio Based on the survey results obtained from the Beijing software service outsourcing firms, we carried out the statistic analysis on the firm profit ratios in 2005, in 2006, and in 2007, respectively, using the SPSS statistic analy-sis software. The statistical results are described as Table 4.
From Table 4, the analysis result shows that the aver-age profit ratio of the Beijing-based software service outsourcing firms dropped down from 17.05% in 2005 to 6.39% in 2007. It could be explained by the fact that the competition in the industry was becoming fierce year after year, which led to the decline of profit ratio on mar- ket performance. The reasons maybe lie in: Firstly, the market concentration of industries was also dropping year after year, resulting in the change of the pricing con- duct, further leading to the decline of profit ratio. Sec-ondly, due to the appreciation of the RMB exchange rate in recent years, the competitive advantage of the Beijing software service outsourcing industry was weakened, res- ulting in the decrease of the profits of the service out-sourcing firms that take the foreign exchange as their major settlement payment. In addition, according to “the China Statistic Yearbook”, the average cost-profit ratio of all state-owned, large-size companies of the country is 7.43% in 2007. Therefore, the profit ratio of the industry should be improved because the software and informa-tion service outsourcing is an emerging industry. If the profit ratio of the industry was lower than average profit ratio of the society for a long time, it would be detrimen-tal to the effective concentration and configuration of resources.
5.3.2 Analysis of Firm Ratal Still based on the survey results obtained from the soft-ware service outsourcing firms in Beijing, we carried out the statistic analysis on the firm’s ratal in 2005, in 2006, and in 2007, respectively, by SPSS statistic analysis soft- ware. The results are displayed as follows:
From the statistical results in the Table 5, we can see that the average firm ratal of Beijing software and infor-mation services outsourcing industry showed an upward trend year after year. The average ratal was 1,523,700 Yuan every firm in 2005; it became 2,037,100 Yuan every firm in 2006 and 2,491,900 Yuan every firm in 2007. From the calculated data, it could be seen that the ratal growth rate was 33.69% in 2006 and 22.32% in 2007. Therefore, we could draw following conclusions: Although the av-erage profit ratio of the industry was declining, the aver-age ratal of the firms was increasing year after year. The reason is that industry output (turnover) was growing and the industry scale was expanding rapidly.
6. Conclusions Based on the SCP paradigm of the industrial organization theory, the study empirically analyzed the criteria of mar- ket structure, market conduct and market performance of the software service outsourcing industry in Beijing th- rough the field survey, literature search, making use of the SPSS statistic software and its relativity tests. Fol-lowing conclusions can be drawn from the study:
Firstly, on the aspect of market structure, the market concentration of software service outsourcing industry in Beijing is very low at present. The barriers to entry and exit are relatively low and belonging to the industry of lower risk and lower profit. The product differentiation is not high. It mainly focuses on the ITO business from the
Table 4. Descriptive Statistics of profit ratio
N Mean Standard Deviation
Year Statistics Statistics Standard
error Statistics
2005 37 17.05 2.94 17.883
2006 44 6.55 4.564 30.271
2007 48 6.39 6.896 47.78
Table 5. Descriptive Statistics of firm ratal
N Mean Standard Deviation
Year Statistic Statistic Standard
error Statistic
2005 39 152.37 39.642 247.563
2006 44 203.71 46.829 310.629
2007 47 249.19 61.568 422.091
Copyright © 2010 SciRes. JSSM

An Empirical Analysis on Industrial Organization Structure of Chinese Software Service Outsourcing
Copyright © 2010 SciRes. JSSM
226
Japanese and American companies. The industry shows increasing returns to scale, but the scale economy of the industry has still not been incarnated.
Then, on the aspect of market conduct, the low market concentration led to the fierce market competition. Ex-cept for the R & D centers and branches owned by the multinational companies that have strong pricing power, all local software service outsourcing firms are involved in the fierce market competition as demonstrated specifi- cally by the very low industry concentration and the very low average scale of firms. The price competitiveness of the whole industry is still weak and the price-competitive conduct seems to be disordered. The non-price competi-tion strategy is not becoming prevalent. Super powerful companies with internationally recognized competence have still not existed yet at present in the Beijing soft-ware service outsourcing industry.
Finally, on the aspect of the market performance, the firm profit rate of the Beijing software service outsourc-ing had been declining year after year. The average profit rate is low, but the average firm ratal shows upward trend. The reasons of this phenomenon might primarily lie in the low level of price-competition caused by the low in-dustry concentration and the rapid expansion of the in-
dustry scale.
7. Acknowledgements Author would like to thank Prof. Jingfu Bai of University of Science and Technology Beijing, and Dr. Jim Zhang of JZMed Inc of New York in USA for their valuable advices during preparation of the paper.
REFERENCES [1] China Software Association, etc., “The Research Report
of China Software Industry Development in 2008,” China, 2008.
[2] X. F. Niu, “The Evolvement and Development of West- ern Industrial Theory,” Economy Research, Vol. 3, 2004, pp. 116-123.
[3] Beijing Statistics Bureau, “Statistical Bulletin National Economic and Social Development of Beijing in 2007,” Beijing Statistics Bureau, Beijing, 2008.
[4] Beijing Software and Information Services Promotion Centre, etc., “The Blue Book of Beijing Software Industry Development in 2008,” China, 2008.
[5] E. Fukuura, “The International Outsourcing of Japan Companies,” Journal of Industry Economy, Vol. 3, 2008.

J. Service Science & Management, 2010, 3, 227-234 doi:10.4236/jssm.2010.32028 Published Online June 2010 (http://www.SciRP.org/journal/jssm)
Copyright © 2010 SciRes. JSSM
An Importance-Performance Analysis of Primary Health Care Services: Managers vs. Patients Perceptions
Francisco J. Miranda, Antonio Chamorro, Luis R. Murillo, Juan Vega
Economics and Business Management Faculty. University of Extremadura, Badajoz, Spain. Email: [email protected] Received February 10th, 2010; revised March 11th, 2010; accepted April 15th, 2010.
ABSTRACT
Using importance-performance analysis (IPA), this paper examines the perceptions of patients and managers of health centres of several health care quality services attributes. IPA is an approach to the measurement of customer/user sat-isfaction which allows for a simple and functional identification of both the strong and the weak aspects, or improve-ment areas, of a given service. Taking both the importance assigned by users to all relevant aspects of a given service and the perceived performance of the establishment in providing the service, the result is an IPA grid with four quad-rants. To the best of our knowledge, this is the first time this methodology has been used to compare the perceptions of health centre patients and managers. The results showed patients and managers to have very different perceptions of all the quality service attributes. Implications for researchers and health centre managers are discussed. The study illus-trates the usefulness of the IPA model as a managerial tool in identifying areas to which marketing resources should be allocated in order to improve and enhance the quality of the health centre services provided. Keywords: Health Services, Importance-Performance Analysis, Patient Perception, Satisfaction, Service Quality
1. Introduction
Health care providers are increasingly using higher levels of service quality to satisfy patients. Indeed, satisfaction surveys have been used widely as a management tool to address the problems of access and performance. They have also been instrumental in helping government agen-cies identify target groups, clarify objectives, define mea- sures of performance, and develop performance informa-tion systems. In addition, the emerging health care lit-erature suggests that patient satisfaction is a dominant concern that is intertwined with strategic decisions in the health services [1].
The present work attempts to formulate a strategic vi-sion to enable health care centres and the overall health care system to deliver higher levels of patient satisfaction. Although numerous studies have examined patients’ as-sessments, many questions still remain unanswered. Pa-tients’ evaluations of quality remain unclear because, in the absence of medical training, they are less qualified than their providers to determine technical competence. Additionally, the number of distinct concepts upon which patients base their evaluations is questionable.
The relationship between the established variables and the models that deal with satisfaction and quality pro-vides a unique research opportunity to enhance manage-rial understanding. This paper exploits this opportunity by identifying both the importance and the performance of service quality attributes in Spain's health care system using the importance-performance analysis (IPA) model. In particular, the perceptions of health centre patients and managers are compared in terms of the importance and performance of service quality attributes.
To the best of our knowledge, this is the first time that the IPA methodological approach has been used to com-pare the perceptions of health centre users and managers. Our research extends the existing literature in two direc-tions. Firstly, unlike prior studies with similar objectives, we consider a wide range of attributes to reflect the most relevant dimensions in primary health service, and sec-ondly, the method allows a direct comparison to be made between users’ and managers’ perceptions.
The rest of the paper is structured as follows. First, we analyze the IPA technique’s advantages. Next, we de-scribe the method used to measure the gap between the perceptions of users and managers of health care centres.

An Importance-Performance Analysis of Primary Health Care Services: Managers vs. Patients Perceptions 228
Then, we analyze the main results of our study, and fin-ish with the conclusions and final reflections.
2. Methods
Importance-performance analysis conceptually underlies the multi-attribute models that date back to the late 1970s. Martilla and James [2] were the first to apply the IPA technique to analyze the performance of a car dealer’s service department. They declared IPA to be a low-cost, easily understood technique for exploring different aspe- cts of the marketing mix, and enabling managers to real-locate resources according to the four areas identified.
Originally devised with marketing uses in mind, the applications of IPA now extend to a wide range of fields, including health service provision [3-9].
The key objective of IPA is diagnostic in nature. It aims to facilitate identification of attributes for which, given their importance, the product or service underper-forms or overperforms. To this end, the interpretation of the IPA is graphically presented on a grid divided into four quadrants. Figure 1 illustrates the IPA grid. The Y- axis reports the customers’ perceived importance of se-lected attributes, and the X-axis shows the product’s (or service’s) performance in relation to these attributes. The four identifiable quadrants are: Concentrate Here, Keep up the Good Work, Low Priority and Possible Overkill.
Therefore, IPA provides a useful and easily under-standable guide to identifying the most crucial product or service attributes in terms of their need for managerial action, and hence to developing successful marketing programs to achieve competitive advantage.
Attribute importance is generally regarded as a per-son’s general assessment of the significance of an attrib-ute for a product. Many studies have attempted to ana-lyse customer satisfaction in terms of both expectations
Performance
Importance
High
High
Low
Low
Quadrant IConcentrateHereHigh ImportanceLow Performance
Quadrant IIKeepup the GoodWork
High ImportanceHigh Performance
Quadrant IIILowPriority
Low ImportanceLow Performance
Quadrant IVPossible OverkillLow ImportanceHigh Performance
Figure 1. Importance-Performance analysis grid
that relate to certain important attributes and judgements of the performance of those attributes [10,11]. However, there appears to have been some diversity in the conclu-sions drawn about how one should relate attribute im-portance and performance.
There exists a variety of approaches to defining meas-ures of importance. In particular, two quite different kinds of measure are common in IPA applications: 1) direct measures based on Likert scale, k-point scale, or metric ratings obtained in the same way as for performance, and 2) indirect measures obtained from the performance scores, either by multivariate regression of an overall product or service rating on the ratings given to the indi-vidual attributes [4,12-15] or by means of conjoint analysis techniques [12,16,17].
A recent review of these methods [18] supports earlier studies [19] in finding that direct measures capture the importance of attributes better than indirect measures. We therefore used a Likert scale to measure importance.
3. Data and Results
The first step in implementing the IPA analysis was to define a suitable questionnaire. The questionnaire for this study included two main sections. The first section con-sisted of 25 health care centre attributes, for which pa-tients were asked to indicate the perceived importance of each attribute and their perceptions of actual health care centre. These 25 attributes were identified based on a review of the relevant literature [1,5,9]. The question-naire was structured so that each health care centre at-tribute was scored on a 7-point Likert scale, ranging from 1 (least important) to 7 (most important) in the Impor-tance part, and from 1 (strongly disagree) to 7 (strongly agree) in the Performance part.
The second section was designed to elicit socio-dem- ographic information about the respondents. Prior to the main survey, a pilot study was conducted comprising 10 patients, 10 health professionals, and 10 health manage-ment experts. This led to several items being re-worded to improve their comprehensibility and the overall clarity of the instrument. In particular, this pre-test revealed that respondents perceived some of the items included in the scale to be redundant. Because this redundancy led to frustration and low response rates, the researchers agreed to further reduce the number of items.
The final scale consisted of 25 perception items repre-senting all five dimensions of service quality (see Ap-pendix A for the list of items). The preliminary test also indicated that the mixture of negatively and positively worded statements created confusion and frustration on the part of respondents. For this particular population, it was believed that the confusion and inaccurate responses resulting from the use of negatively worded statements would adversely affect the quantity and the quality of the data. Therefore, the negatively worded statements con-
Copyright © 2010 SciRes. JSSM

An Importance-Performance Analysis of Primary Health Care Services: Managers vs. Patients Perceptions 229
tained in the research instrument were converted to posi-tive connotations.
In September 2008, questionnaires were mailed to 20000 patients who had used the health care services of Extremadura (a Region in southwest Spain) within the previous month. Due to its extensive area (41634 km²) and low population density (26.18 inhab/km²), Extre-madura has structured its health care system around two territorial administrative levels of aggregation: Health Areas and Basic Health Zones. There are 8 Health Areas, each consisting of a number of Basic Health Zones. The total population covered is 1081845 inhabitants, and in 2008 the number of operating Basic Health Zones was 105, each organized around a Health Care Centre as the main provider of primary health care services in the zone. There were 2556 returns, for a 12.78% response rate. Questionnaires were also mailed to the 105 Extremadura health centre managers. There were 88 returns, yielding a 4.2 sample error. The study’s technical record is presen- ted in Table 1.
Comparison of the respondents’ gender and age dis-tributions with those of the target population showed no significant differences between the two groups.
The demographic profile of the respondents is present- ed in Table 2. The largest group of respondents (60.15%) was aged > 65 years. The next largest group (28.2%) was aged 30-45 years. Female respondents represented a little more than 60% of the survey population.
Table 1. The study’s technical sheet
USERS MANAGERS
TARGET POPULATION
Users of Extremadura Health Services
Managers of Extre-madura Health Services
GEOGRAPHICAL AREA
Extremadura (Spain)
SAMPLE DIMENSION
2566 questionnaires 88 questionnaires
SAMPLE ERROR
1.9% 4.2%
CONFIDENCE LEVEL
95% z = 1.96 p = q = 0.5
SAMPLE DESIGN
Stratified random sampling (in proportion to the users of each health care centre)
Entire population
PERIOD OF DATA
COLLECTION 10 September 2008 to 15 January 2009
Table 2. Profile of surveyed users
Gender Male: 39.85% Female: 60.15%
Age < 30 years: 9.6% 30-45 years: 28.23%
45-64 years: 24.98% > 65 years: 60.15%
Descriptive statistics including simple frequencies and mean scores were computed for the respondents’ demo-graphics and for the 25 attributes. IPA was then used to compare the patients’ and managers’ perceptions of these attributes. Each attribute was plotted according to the mean score of its perceived importance and performance, with the importance of attributes on the vertical axis from low (bottom) to high (top), and the performance of at-tributes on the horizontal axis from low (left) to high (right). The four quadrants are constructed with cross- hairs set at the average scores of the Importance and Per-formance scores [2,3,8]. For patients (Figure 2), these averages for the pooled data were: importance 4.94, and performance 5.77. For health centre managers (Figure 3), they were: importance 6.26, and performance 5.45.
These figures show that patients and managers have different perceptions of the 25 factors. The following pa- ragraphs describe some of the meaningful insights gath-ered from this “quadrant” presentation.
Table 3 lists the aggregate importance and perform-ance values of each attribute together with the difference between the two for patients and managers. That all the importance scores are higher than the performance scores implies that there is room for improvement in all the ar-eas. To decide, however, which attributes most merit im- provement; one can analyze the discrepancies between the performance and importance scores, so that attributes with greater differences will be given higher priority [20]. In this regard, in order to maintain as far as possible the original structure of the IPA, information from the IPA grid was combined with the differences between the per-formance and importance scores (see Table 3).
The first interesting conclusion to be drawn from Fig-ure 2 is that the data show a clear trend of the most im-portant attributes for the patient also being scored as the best performing, showing that the Region’s health care system appears to have clearly identified the user’s needs and concentrated its effort on the most relevant variables.
The Concentrate Here quadrant captured a single at-tribute for patients: health centre’s timetable (Efic7). This attribute also presents a major discrepancy between importance and performance (see Table 3), so that it calls for especial attention. In Figure 3, the managers include four attributes in this quadrant: cleanliness of facilities (Fac1), equipment at the health centre (Fac2), level of bureaucracy (Efic2), and time to focus on each patient (Efic6).
Patients identified 13 attributes in The Keep up the Good Work quadrant which thus could be considered satisfactory in meeting their needs. In view of the infor-mation in Table 3, managers should focus on improving the “equipment at the health centre” (Fac2), “health staff understands patients’ problems” (HS9), and “health staff’s interest in solving the patients’ problems” (HS8). From the managers’ point of view, 14 attributes are included in
Copyright © 2010 SciRes. JSSM

An Importance-Performance Analysis of Primary Health Care Services: Managers vs. Patients Perceptions
Copyright © 2010 SciRes. JSSM
230
Efic1
Efic3
Efic4
Efic5
Efic2
NoHS5
NoHS4
Efic6NoHS3
Efic7
5,00
5,50
6,00
6,50
3,50 4,00 4,50 5,00 5,50 6,00 6,50
NoHS2
HS4
HS9
Fac 2
HS10
HS8HS7
HS5
HS3
HS6 Fac3
NoHS1
Fac1HS2 HS1
Concentrate here
Keep up the GoodWork
Low priority
Possible Overkill
IMPORTANCE
PERFORMANCE
Figure 2. IPA grid of primary health care service (patients)
Efic1Efic3
Efic4
Efic5
Efic2 Efic6
Efic7
Fac 2
HS10
Fac3
Fac1
HS2
HS1
5,00
5,50
6,00
6,50
7,00
7,50
3,00 3,50 4,00 4,50 5,00 5,50 6,00 6,50 7,00 7,50
Concentrate here Keep up the GoodWork
Low priority Possible Overkill
IMPORTANCE
PERFORMANCE
Figure 3. IPA grid of primary health care service (managers) this quadrant. According to Table 3, the administration should focus on improving the “non-health staff interest in solving the patients’ problems” (NoHS5) as it presents the greatest potential for improvement (0.79). This sends a meaningful message to health centre managers in that
they should concentrate on these aspects from their pa-tients’ point of views. Resources should be directed to improving and maintaining the quality of equipment and the health staff’s motivation to understand and solve pa-tients’ problems.

An Importance-Performance Analysis of Primary Health Care Services: Managers vs. Patients Perceptions 231
The Low Priority quadrant identifies those items whe- re health centres are performing adequately but patients perceive them as less important when compared with other attributes. Nine attributes are perceived as of low importance by the patients, but some of them present the greatest improvement potential (see Table 3). This is the case for some of the efficiency attributes (ease of making an appointment, bureaucracy, waiting times in the health centre before entering the consulting room, speed of complementary tests, and time to focus on each patient). While these attributes are perceived as of lower impor-tance than others, their great improvement potential must be taken into account. Thus, those patients did not per-ceive these attributes as being important does not mean that managers should reduce their effort to improve these services. On the contrary, these service categories are often considered to be the basic attributes for patients who might simply be regarding them as necessary ser-
vice provisions without being aware of their importance. The managers include 4 attributes in this quadrant, but some of them have the highest improvement potential. This is the case for two efficiency attributes―ease of making an appointment (1.28) and speed of complemen-tary tests (0.81)―and for the location for accessibility of the health centre (0.95). While their importance is less than that of other attributes, again their great improve-ment potential must be taken into account in defining policies to improve health centre service quality.
Finally in the Possible Overkill quadrant, our analysis identifies only two attributes (trust in health staff, HS4, and non-health staff professionalism, NoHS2) by patients and three by managers (complaints resolution, Efic5; he- alth centre’s timetable, Efic7; and health staff’s prestige, HS10) as being of low importance with relatively high performance. In all of them the improvement potential is also low, so that they should be given only low priority.
Table 3. Aggregate performance and importance scores of each attribute (patients and managers)
Managers Patients
Importance Performance Difference Importance Performance Difference
Fac1 6.30 5.06 1.24 5.90 5.40 0.50
Fac2 6.48 4.35 2.12 5.94 5.20 0.75
Fac3 5.70 4.74 0.95 5.96 5.16 0.80
HS1 6.34 6.18 0.16 6.27 5.01 1.26
HS2 6.69 6.08 0.61 6.22 5.43 0.79
HS3 6.45 5.85 0.60 6.02 5.35 0.67
HS4 6.35 5.89 0.46 5.72 5.16 0.56
HS5 6.36 5.97 0.39 5.85 5.23 0.62
HS6 6.37 5.84 0.53 5.9 5.4 0.50
HS7 6.47 5.72 0.75 5.94 5.2 0.74
HS8 6.50 5.97 0.53 5.96 5.16 0.80
HS9 6.35 5.52 0.83 5.89 5.01 0.88
HS10 6.14 5.69 0.45 5.88 5.15 0.73
NoHS1 6.33 6.03 0.29 5.96 5.72 0.24
NoHS2 6.43 5.74 0.69 5.75 5.01 0.74
NoHS3 6.47 5.76 0.70 5.71 4.87 0.84
NoHS4 6.38 5.73 0.65 5.49 4.6 0.89
NoHS5 6.42 5.63 0.79 5.46 4.58 0.88
Efic1 5.98 4.70 1.28 5.29 3.53 1.76
Efic2 6.44 3.28 3.16 5.45 4.31 1.14
Efic3 5.95 5.15 0.81 5.17 3.72 1.45
Efic4 5.15 4.93 0.21 5.49 3.99 1.50
Efic5 5.81 5.92 –0.11 5.35 4.19 1.16
Efic6 6.40 4.71 1.69 5.65 4.73 0.92
Efic7 6.16 5.78 0.39 5.84 4.78 1.06
Copyright © 2010 SciRes. JSSM

An Importance-Performance Analysis of Primary Health Care Services: Managers vs. Patients Perceptions 232
In order to analyze the possible discrepancies between
the perceptions of the health centre patients and managers about service quality, we performed a t-test with the fol-lowing hypotheses:
H0: µPatients = µManagers
Ha: µPatients ≠ µManagers
Table 4 presents the results for the difference between the patients’ and the managers’ perceptions. One ob-serves that for 23 of the 25 items the null hypothesis of equal means can be rejected at a 95% confidence level.
Most of the gaps between the patients’ and the manag-ers’ perceptions are negative and statistically significant, indicating that the managers are too optimistic about the service that they provide. The differences are particularly important for efficiency attributes, in particular, the ease of making an appointment (Efic1), waiting times in the health centre before entering the consulting room (Efic3), and complaints resolution (Efic5), for which the patients have a markedly lower perception of quality.
Table 4. Health centres’ perceived service quality (patients vs. managers)
Users Managers Gap
Efic5 4.19 5.92 –1.73**
Efic3 3.72 5.15 –1.43**
Efic1 3.53 4.70 –1.17**
NoHS4 4.6 5.73 –1.13**
NoHS5 4.58 5.63 –1.05**
Efic7 4.78 5.78 –1.00**
Efic4 3.99 4.93 –0.94**
NoHS3 4.87 5.76 –0.89**
HS8 5.16 5.97 –0.81**
HS5 5.23 5.97 –0.74**
NoHS2 5.01 5.74 –0.73**
HS4 5.16 5.89 –0.73**
HS2 5.43 6.08 –0.65**
HS10 5.15 5.69 –0.54**
HS7 5.2 5.72 –0.52**
HS9 5.01 5.52 –0.51*
HS3 5.35 5.85 –0.50**
HS6 5.4 5.84 –0.44*
NoHS1 5.72 6.03 –0.31*
HS1 6.02 6.18 –0.16
Efic6 4.73 4.71 0.02
Fac2 5.00 4.35 0.65**
Fac1 5.73 5.06 0.67**
Fac3 5.52 4.74 0.78**
Efic2 4.31 3.28 1.03**
** 99% significance
* 95% significance
There are also significant differences in several attrib-utes related to attributes of the non-health staff: kind-ness and politeness (NoHS3), attention to patients’ pro- blems (NoHS4), and interest in solving patients’ prob-lems (NoHS5). The case is similar for some of the health staff attributes―personalized service (HS5) and interest in solving the patients’ problems (HS8)―where again the managers are overestimating the patients’ perceived qua- lity of these attributes.
In contrast, the managers undervalue attributes relating to the facilities: cleanliness (+0.65), equipment (+0.68), and location for accessibility (+0.78). They also under-value one efficiency attribute: the level of bureaucracy (Efic2).
In general therefore, one can say that the managers’ perception of the service provided in their health centres is quite distant from the views of patients.
4. Conclusions
Using IPA, this study has compared the importance and performance of 25 service quality attributes as perceived by health centre patients and managers. They were found to have quite different perceptions of the quality of those attributes.
The measurement of patient perceptions provides a valuable dimension of insight into the process by which the quality of health care service is evaluated. In order to identify and correct service quality problems quickly, managers need to understand patients’ perceptions of the quality of service actually delivered. The present results have shown, however, that managers have a quite differ-ent perception of the service provided in their health cen-tres from that of the patients. In particular, they are over-estimating the perceived quality of almost all the service quality attributes that we studied.
The findings have implications for managing primary health care centres. In particular, the perceived quality of a health care centre depends mainly on dimensions that are closely linked to the health personnel who are in touch with the patient, as well as to certain measures of efficiency―the ease of making an appointment, level of bureaucracy, waiting times before entering the consulting room, speed of complementary tests, complaints resolu-tion, time to focus on each patient, and the timetable of the health centre.
In practical terms, the IPA technique objectively cate-gorized the health centre quality attributes into four iden-tifiable quadrants, which will enable health centre man-agers better understand how patients perceive their ser-vices. There are two clear advantages for health centre managers in adding IPA to their tool-kit of management techniques. First, IPA is relatively inexpensive and easily understood. Using a straightforward two-dimensional pre- sentation, the results can be plotted on a simple grid that explicitly displays the strengths and weaknesses of the
Copyright © 2010 SciRes. JSSM

An Importance-Performance Analysis of Primary Health Care Services: Managers vs. Patients Perceptions 233
quality attributes being studied. Second, using the results provided by IPA, managers can tailor their marketing strategies to the patients’ perception of importance and performance revealed in each quadrant. This is a useful and effective way to identify problems and the reasons behind them.
In determining patients’ needs and expectations, health centre managers will be better able to prioritize tasks, allocate resources, and match their marketing strategies to their target segments. Once the patients’ requirements have been clearly identified and understood, a manager will likely be in a better position to anticipate and cater to their desires and needs rather than merely react to their dissatisfaction [21]. Evaluating a health centre’s perform- ance from the patient’s point of view would improve the manager’s understanding of customer satisfaction. Pa-tients who are satisfied with their health centre’s service are more likely to spread favourable word-of-mouth pub-licity [22]. Knowing how patients perceive the quality of services and facilities is the means by which a health centre can achieve a competitive advantage, differentiate itself from competitors, foster customer loyalty, enhance its corporate image, increase business performance, and retain existing customers and attract new ones.
In an academic context, the use of IPA to investigate the differences between how patients perceive the impor-tance of health centre attributes and the centre’s actual performance in relation to those attributes could contrib-ute to broadening the scope of research studies in the area of consumer decision-process theory. In particular, the potential applications of IPA in several areas need to be addressed, including the analysis of the perception of quality in terms of different segments which would help health centre managers formulate and develop marketing strategies to meet the needs of each of those segments.
REFERENCES [1] F. W. Gilbert, J. R. Lumpkin and R. P. Dant, “Adaptation
and Customer Expectation of Health Care Options,” Jour- nal of Health Care Marketing, Vol. 12, No. 3, 1992, pp. 46-55.
[2] J. A. Martilla and J. C. James, “Importance-Performance Analysis,” Journal of Marketing, Vol. 41, No. 1, 1977, pp. 77-79.
[3] J. Abalo, J. Varela and V. Manzano, “Importance Values for Importance-Performance Analysis: A Formula for Spreading out Values Derived from Preference Rankings,” Journal of Business Research, Vol. 60, No. 2, 2007, pp. 115-121.
[4] A. L. Dolinsky, “Considering the Competition in Strategy Development: An Extension of Importance-Performance Analysis,” Journal of Health Care Marketing, Vol. 11, No. 1, 1991, pp. 31-36.
[5] A. L. Dolinsky and R. K. Caputo, “Adding a Competitive Dimension to Importance-Performance Analysis: An Ap-plication to Rraditional Health Care Systems,” Health Care Marketing Quarterly, Vol. 8, No. 3, 1991, pp. 61-79.
[6] J. M. Hawes, G. E. Kiser and C. P. Rao, “Analysing the Market for Planned Retirement Communities in the Southwest,” Baylor Business Studies, Vol. 13, 1982, pp. 39-46.
[7] J. M. Hawes and C. P. Rao, “Using Importance-Per- formance Analysis to Develop Health Care Marketing Strategies,” Journal of Health Care Marketing, Vol. 5, No. 4, 1985, pp. 19-25.
[8] M. Hemmasi, K. C. Strong and S. A. Taylor, “Measuring Service Quality for Strategies Planning and Analysis in Service,” Journal of Applied Business Research, Vol. 10, No. 4, 1994, pp. 24-34.
[9] U. Yavas and D. J. Shemwell, “Modified Importance- Performance Analysis: An Application to Hospitals,” In-ternational Journal of Health Care Quality Assurance, Vol. 14, No. 3, 2001, pp. 104-110.
[10] J. Myers and M. Alpers, “Determining Attributes: Mean-ing and Measurement,” Journal of Marketing, Vol. 32, No. 4, 1968, pp. 1-4.
[11] J. Swan and I. L. Coombs, “Product Performance and Consumer Satisfaction: A New Concept,” Journal of Marketing, Vol. 40, No. 2, 1976, pp. 25-33.
[12] P. J. Danaher and J. Mattsson, “Customer Satisfaction during the Service Delivery Process,” European Journal of Marketing, Vol. 28, No. 5, 1994, pp. 5-16.
[13] S. A. Neslin, “Linking Product Features to Perceptions: Self-Stated Versus Statistically Revealed Importance Wei- ghts,” Journal of Marketing Research, Vol. 18, No. 1, 1981, pp. 80-86.
[14] S. A. Taylor, “Assessing Regression-Based Importance Weights for Quality Perceptions and Satisfaction Judg-ments in the Presence of Higher Order and/or Interaction Effects,” Journal of Retailing, Vol. 73, No. 1, 1997, pp. 135-159.
[15] D. R. Wittink and L. R. Bayer, “The Measurement Im-perative,” Marketing Research, Vol. 6, No. 4, 1994, pp. 14-22.
[16] P. J. Danaher, “Using Conjoint Analysis to Determine de Relative Importance of Service Attributes Measured in Customer Satisfaction Surveys,” Journal of Retailing, Vol. 73, No. 2, 1997, pp. 235-260.
[17] A. Ostrom and D. Iacobucci, “Consumer Trade-Offs and the Evaluation of Services,” Journal of Marketing, Vol. 59, No. 1, 1995, pp. 17-28.
[18] D. R. Bacon, “A Comparison of Approaches to Impor-tance-Performance Analysis,” International Journal of Marketing Research, Vol. 45, No. 1, 2003, pp. 55-71.
[19] R. M. Heeler, C. Okechuku and S. Reid, “Attribute Im-portance: Contrasting Measurements,” Journal of Mar-keting Research, Vol. 16, No. 1, 1979, pp. 60-63.
[20] U. Oberoi and C. Hales, “Assessing the Quality of the Conference Hotel Service Product: Towards an Empiri-cally Based Model,” The Service Industries Journal, Vol. 10, No. 4, 1990, pp. 700-721.
[21] C. Fornell, “A National Customer Satisfaction Barometer: The Swedish Experience,” Journal of Marketing, Vol. 56, No. 1, 1992, pp. 6-21.
[22] E. H. Watson, M. A. McKenna and G. M. McLean, “TQM and Services: Implementing Change in the NHS,” International Journal of Contemporary Hospitality Man-agement, Vol. 4, No. 2, 1992, pp. 17-20.
Copyright © 2010 SciRes. JSSM

An Importance-Performance Analysis of Primary Health Care Services: Managers vs. Patients Perceptions 234
Appendix A
Fac1: Cleanliness of facilities
Fac2: Equipment at the health centre
Fac3: Location for accessibility of the health centre
HS1: Health staff cleanliness
HS2: Health staff professionalism
HS3: Health staff kindness and politeness
HS4: Trust in health staff
HS5: Personalized service
HS6: Communication with health staff
HS7: Health staff’s attention to patients’ problems
HS8: Health staff’s interest in solving the patients’ problems
HS9: Health staff understand patients’ problems
HS10: Medical staff’s prestige
NoHS1: Non-health staff cleanliness
NoHS2: Non-health staff professionalism
NoHS3: Non-health staff kindness and politeness
NoHS4: Non-health staff attention to patients’ problems
NoHS5: Non-health staff interest in solving the patients’ problems
Efic1: Ease of making an appointment
Efic2: Level of bureaucracy
Efic3: Waiting times in the health centre before entering the consulting room
Efic4: Speed of complementary tests
Efic5: Resolution of complaints
Efic6: Time to focus on each patient
Efic7: Health centre’s timetable
Copyright © 2010 SciRes. JSSM

J. Service Science & Management, 2010, 3, 235-240 doi:10.4236/jssm.2010.32029 Published Online June 2010 (http://www.SciRP.org/journal/jssm)
Copyright © 2010 SciRes. JSSM
The Method of Real Options to Encourage the R & D Team
Junfeng Gao1, Lan Jiang2
1School of Management and Economics, University of Electronics Science and Technology of China, Chengdu, China; 2Tian Fu College, Southwestern University of Finance and Economics, Chengdu, China. Email: [email protected] Received February 21st, 2010; revised March 27th, 2010; accepted May 1st, 2010.
ABSTRACT
In some projects, the R & D appears to be a failure, and according to traditional methods of encouragement motivation, it is hard to get any awards for the R & D team. But there is a valuable option implied in it. This article discusses the method of real options to encourage R & D team when the enterprises can not achieve the desired economic benefit in the case of high-risk project or the immature market. The process of method includes: Identify the real option type of high-risk projects, Design the incentive mechanism and Design specific exercise ways. Keywords: The High-Risk R & D Project, Real Option Incentive, R & D Team
1. Introduction
The emphasis of the researchers in the enterprise is to explore or update new products or services, which req- uires high technology and strong innovation and needs inter-disciplinary team work and multi-professionals’ participation. The collaboration of R & D project team requires companies to adopt collective rather than indi-vidual compensation system [1].
But team incentive is more complicated in actual work, especially in high risk R & D project. When enterprises fail to achieve the desired economic benefit in the imm- ature market, it is a big problem to motivate team effec-tively. It is unfair for the R & D team if we deny its con-tribution, because the lessons at least can help us avoid similar risk, and the technology experience accumulated can establish good foundation for the latter project. If there is no reward, no one would do these high-risk pro-jects or they maybe change job with these expensive ex-perience. However, if the reward is paid, what is the cri-terion of incentive and how to evaluate contribution of the project should be considered. And this paper will intro-duce a new incentive method-real option incentive plan.
2. A Brief Overview of Literature
A team incentive system sends a message to employees that their team’s output and performance is valued by the
organization [2]. If team performance is not rewarded, such performance is not likely to be optimal [3,4]. Ex-isted literatures discuss many incentive ways to R & D from a management perspective, which are: 1) team gains sharing or profit-sharing, 2) team goal-based incen-tive systems. 3) team discretionary bonus systems, 4) team skill incentive systems, 5) team member skill in-centive systems, 6) team member goal incentive systems, and 7) team member merit incentive systems [5]. The typical methods include spiritual incentives such as rec-ognition, confer honor, promotion [6], and material in-centives such as compensation incentive [7], stock incen-tive [8], stock option [9] and so on. However, because these incentives are based on different performance indi-cators, such as financial indicator, internal operating tar-get and customer indicator [10], so can not solve the in-centive problem of high-risk R & D project.
As an expansion of financial option theory in real (non-financial) assets option, real option change inves-tors’ view to risk and make them pay more attention to the value of opportunities [11]. In recent years, scholars have put forth real option incentive approaches for the executives [12] and R & D personnel [13]. The former is to balance business investment and strategic investment, focus on guiding operators to develop the future strategic growth opportunities; the latter is based on the com-pounded options and relatively effective for the multi- stage technology projects or successful projects. But both do not come down to the incentive problems of high-risk R & D projects. There is little literature to discuss real
The paper is supported by National Natural Science Foundation of China ( Project No. 70772069).

The Method of Real Options to Encourage the R & D Team 236
option contained in high-risk projects which is more complecatied. For believing experiences in high-risk R & D projects can create development opportunities for fol-low-up technology projects and help enterprises avoid risks, so we focus on how to identify such options cre-ated by these opportunities and to design effective incen-tive ways.
3. The Comparison of Real Option and Other Incentive Ways
There are many team incentive ways and compensation incentive is common. Compensation incentive is divided into two ways. One is fixed pay incentive based on pro-jects’ performance, such as improving all members’ base pay or giving a raise, which has stronger short-term ef-fect. When employees find there is a positive relationship between hard work and reward, the incentive effect is obvious; In addition, some key R & D staff has generally higher level salary in the same industry after giving a raise several times and will not easily change jobs, which is favor of R & D team’s stability. However, this incen-tive is also controversial. One contention focuses on that reward is difficult to cut in the future and no flexibility, which often becomes a major cost burden. Another is it may let some people over-rely on historical performance in long-term and bring negative effect to follow-up re-search.
To avoid the shortcomings of the fixed salary many companies adopt another variable pay incentive, such as project incentive, profit-sharing plan, flexible salary sys-tem etc. The advantage of this incentive approach is that incentive compensation varies with the project perform-ance, which is very flexible. But it belongs to short-term
incentive and the effect does not last for a long time. In addition, the biggest drawback is it can not resolve the incentive problem of high-risk and store project. When a project can not obtain direct economic benefits or face failure, it is hard to find the incentive standard.
Team incentive also includes stock option and other forms, which are long-term incentives. The common pra- ctice is to give project team option that allows them to purchase a certain percentage of enterprise common stock according to pre-set price in a given period. When the price of stock increases, project team can share benefit from stock appreciation. But company’s stock price may not related to a single project directly, and may be ma-nipulated and fluctuate with the whole stock market. So this incentive effect is not direct. In addition, it also can not resolve the incentive standard problem of high-risk and store project.
To solve the above incentives’ shortcoming, this paper design real option approach which can evaluate the high- risk R & D project roundly, especially the value of po-tential risks, and establish a fair standard for incentive. The enterprises can adopt short-term or long-term incen-tive accordingly, such as exchanging the value of real option of the current project as bonus (short-term incen-tives), or allowing R & D team share the profit of latter project (long-term incentives). However this way needs many data and it is some difficult. The above methods of incentive are shown in Table 1.
4. The Design of Real Option Incentive
In order to conduct real option incentive, we must iden-tify the type of real option high-risk projects contained, and then design incentive scheme.
Table 1. The comparison of advantage and disadvantage of team incentive ways
Type of incentives
Advantages Disadvantages
fixed pay incentives
Stronger short-term incentive effect and in favor of R & D team’s stability
Lack of flexibility, often becomes a major cost burden. Make some people over-rely on historical performance in long-term; bring negative effect to follow-up research projects.
variable pay incentives
Incentive compensation varies with the project performance, very flexible; The effect does not last for a long time.
Hard to find the incentive standard; Can not resolve the incentive problem of high-risk and store project
Stock option Income is comparative with performance and risk, Have a long-term incentive effect
Company’s stock price may not relate to a single project directly, and may be manipulated and fluctuate with the whole stock market. Cannot resolve the incentive standard problem of high-risk and store project
Real option
Can evaluate the project roundly, especially the value of potential risks, and establish a fair incentive standard; And enterprises can adopt short-term or long-term incentive accordingly
Needs many data and difficult
Copyright © 2010 SciRes. JSSM
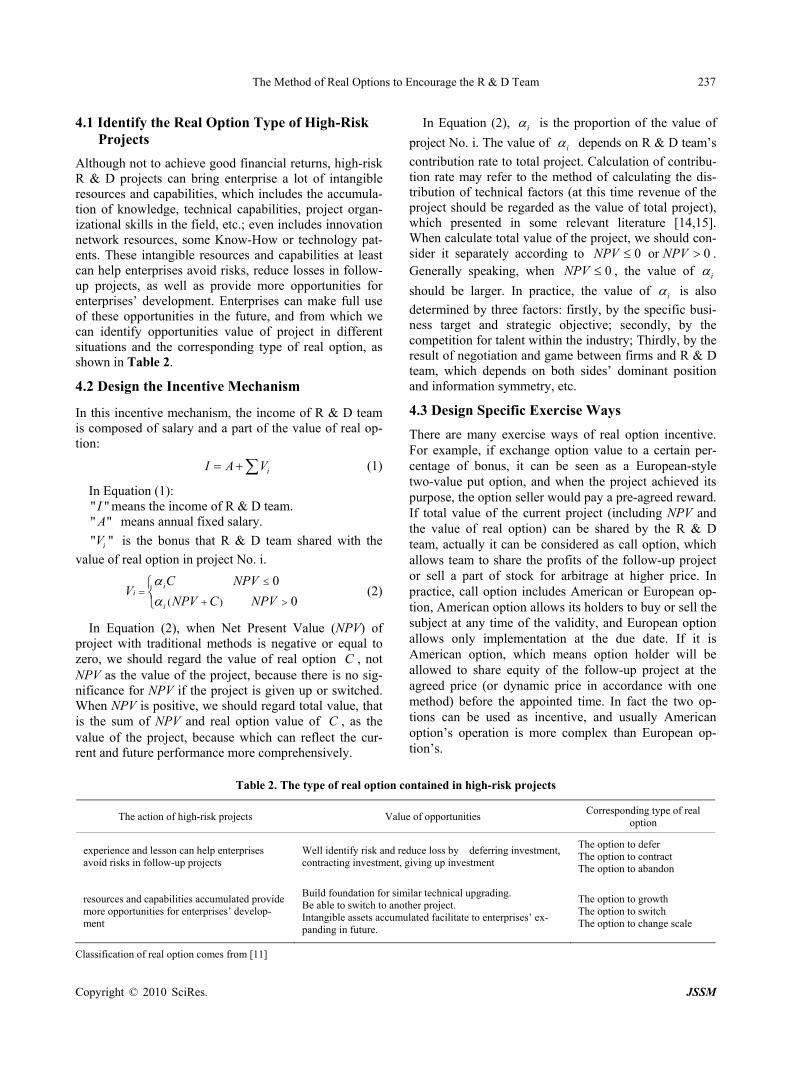
The Method of Real Options to Encourage the R & D Team 237
4.1 Identify the Real Option Type of High-Risk
Projects
Although not to achieve good financial returns, high-risk R & D projects can bring enterprise a lot of intangible resources and capabilities, which includes the accumula-tion of knowledge, technical capabilities, project organ-izational skills in the field, etc.; even includes innovation network resources, some Know-How or technology pat-ents. These intangible resources and capabilities at least can help enterprises avoid risks, reduce losses in follow- up projects, as well as provide more opportunities for enterprises’ development. Enterprises can make full use of these opportunities in the future, and from which we can identify opportunities value of project in different situations and the corresponding type of real option, as shown in Table 2.
4.2 Design the Incentive Mechanism
In this incentive mechanism, the income of R & D team is composed of salary and a part of the value of real op-tion:
iI A V (1)
In Equation (1): " "I means the income of R & D team. " "A means annual fixed salary.
" "iV is the bonus that R & D team shared with the
value of real option in project No. i.
( )
0
0i
i
i
C NPVV
NPV C NPV
(2)
In Equation (2), when Net Present Value (NPV) of project with traditional methods is negative or equal to zero, we should regard the value of real option , not NPV as the value of the project, because there is no sig-nificance for NPV if the project is given up or switched. When NPV is positive, we should regard total value, that is the sum of NPV and real option value of , as the value of the project, because which can reflect the cur-rent and future performance more comprehensively.
C
C
In Equation (2), i is the proportion of the value of
project No. i. The value of i depends on R & D team’s
contribution rate to total project. Calculation of contribu-tion rate may refer to the method of calculating the dis-tribution of technical factors (at this time revenue of the project should be regarded as the value of total project), which presented in some relevant literature [14,15]. When calculate total value of the project, we should con-sider it separately according to . Generally speaking, when , the value of
0 or 0NPV NPV
0 iNPV
should be larger. In practice, the value of i is also
determined by three factors: firstly, by the specific busi-ness target and strategic objective; secondly, by the competition for talent within the industry; Thirdly, by the result of negotiation and game between firms and R & D team, which depends on both sides’ dominant position and information symmetry, etc.
4.3 Design Specific Exercise Ways
There are many exercise ways of real option incentive. For example, if exchange option value to a certain per-centage of bonus, it can be seen as a European-style two-value put option, and when the project achieved its purpose, the option seller would pay a pre-agreed reward. If total value of the current project (including NPV and the value of real option) can be shared by the R & D team, actually it can be considered as call option, which allows team to share the profits of the follow-up project or sell a part of stock for arbitrage at higher price. In practice, call option includes American or European op-tion, American option allows its holders to buy or sell the subject at any time of the validity, and European option allows only implementation at the due date. If it is American option, which means option holder will be allowed to share equity of the follow-up project at the agreed price (or dynamic price in accordance with one method) before the appointed time. In fact the two op-tions can be used as incentive, and usually American option’s operation is more complex than European op-tion’s.
Table 2. The type of real option contained in high-risk projects
The action of high-risk projects Value of opportunities Corresponding type of real
option
experience and lesson can help enterprises avoid risks in follow-up projects
Well identify risk and reduce loss by deferring investment, contracting investment, giving up investment
The option to defer The option to contract The option to abandon
resources and capabilities accumulated provide more opportunities for enterprises’ develop-ment
Build foundation for similar technical upgrading. Be able to switch to another project. Intangible assets accumulated facilitate to enterprises’ ex-panding in future.
The option to growth The option to switch The option to change scale
Classification of real option comes from [11]
Copyright © 2010 SciRes. JSSM

The Method of Real Options to Encourage the R & D Team 238
5. A Case of Real Option Incentive
Take option to switch for an example, we collect the relevant data of a R & D project of a high-technical com-pany to test it. Located in China, this company mainly engaged in developing 3G communication technology. In early 2007 the company conducted 3G-based mobile software, and its R & D developed in three phases. Its original input cost is 60 million. Every year, each phase can be finished with generation , , of product A.Ⅰ Ⅱ Ⅲ And the product can be replicated and sold. This project was influenced greatly by the State’s policy on 3G, and faces a high market risk. Based on past similar project data analysis, the market was forecasted to have a good probability of 40 percent, the probability of a bad market at 60%. After the first year, if the market is good, we can get the profit of 60 million; if the market is not good the profit is 12 million. In the following two years, if the market is good the profit is high and cash flow will dou-ble on the basis of the former year, but in the poor market cash flow is only half of the former year. Let’s select the company’s comprehensive capital-cost as a risk discount rate (20%), and calculate the net cash flow (NPV).
E.g., in the good market condition of the former two years, the expected value of cash flow in the second year:
(240 0.40 60 0.60) (1 20%) 110
Similarly, we can calculate other discounted value of net cash flow in every phase, result shown in Figure 1. The final NPV expected value is 11.68 million:
71.68 60 = 11.68-
So this project is worth to invest with NPV method.
5.1 Traditional Incentive Idea
However, in fact after one year market has changed, and we found some competitors appeared, and the probability of good or poor market would become 20% and 80% in the next year, but the risk probability of market was un-changed in the following 2 years. At the same time the project get one patent that can be grounded for another product and some enterprises will bid 50 million for it. Obviously, when the first phase of R & D was completed, the NPV was negative:
(105.42 60) 0.2 (21.08 12) 0.8
(1 20%) 60 10.38
NPV
That means the project was failed, so R & D team can not get any encouragement according to traditional com-pensation or stock option incentive way.
21.08 22
27.5
60% R&D project
-60
60
12
40% 60%
120
30
40%
60%
24
6
40%
60%
240
60
40%
60%
60
15
40%
60%
48
12
40%
60%
12
3
40%
110
105.42
5.5
71.68
Figure 1. The cash flow of the project
Copyright © 2010 SciRes. JSSM

The Method of Real Options to Encourage the R & D Team 239
5.2 Real Option Incentive Program
Now if we consider real option, the evaluation to the project is entirely different. When R & D in the first phase was completed, cash flow was only 33.08 million in the poor market (that is, cash flow expected value after one year in poor market: ), if we
switched to another product at this time, the value of the previous R & D was 50 million. Obviously, such a con-version opportunity is valuable. Actually it is option to switch: the agreed price is 50 million, maturity period is 1 year, the current price of the subject is 49.62 million (hat is, expected value of current cash flow, [ (
21.08 + 12 = 33.08
105.42 60)
), maybe
rise to 165.42 million (that is, expected value of cash flow after one year in good market: 105 )
or drop to 33.08 million due to date (that is, expected value of cash flow after one year in poor market:
). We can use
0.2 21.08 12 0.8] ( )
21.08 + 12 = 33.08
(1 20%) 49.62
.42 + 60 = 165.42
binomial tree model
[16] and set up the probability of price raise is “P”. With the hypothesis of symmetric information and risk-neutral, we can get the value of this real option at risk-free inter-est rate of 3.87%, which is bank interest rate for one-year.
0.0387165.42 33.08(1 ) 49.62P P e
0.1398P That is to say, the probability of the call option is
13.98% of which value is 55.8 million (165.42 50 ). And the probability equals 1 - P when the
value of the call option is zero, that is 86.02%. 115.42
Expected cash flow of the option to switch is:
115.42 13.98% 0 86.02% 16.13
Discount at the risk rate of 20%, get current value of option to switch:
16.13 / (1 20%) 13.44
Therefore, project team will be able to share a part of this value as an incentive with real option incentive ap-proach when finished the first phase. The firm can de-termine the proportion αi as 10% based on strategic ob-jective and current industry competition. So, R & D team may get 1.344 million as a reward. It is reasonable for the both because this project can build foundation for an-other product’s R & D and contribute to the company’s development. Considering that being start-up period and need more liquidity for more follow-up R & D projects, the company decided not to use bonus but share the value of latter project in the future.
5.3 Comparative Analysis about Advantage of Real Option
The high-risk project is common for any firm. Real op-
tion incentive put forwarded in this paper is one of ways to solve how to encourage R & D team in such project, which advantages include: 1) to avoid short-term goal- oriented, companies can determine benchmarks of team incentive based on the follow-up value of high-risk pro-ject; 2) To design more flexible incentive methods, companies can use different types of real option or de-sign different exercise methods; 3) If we combine real option incentive with other motivation methods, the ef-fect will be more targeted-oriented and more comprehen-sive.
6. Conclusions
This article discusses the method of real options to en-courage R & D team when the enterprises can not achieve the desired economic benefit in the case of high-risk project or the immature market. The steps of method include: identify the real option type of high-risk projects, design the incentive mechanism and design specific exercise ways. In fact, real option presented in this paper can be applied not only to high-risk project, but also to other technical project. In addition, some non-material incentives, such as honor or job promotion, will bring more opportunities for R & D team, which itself can be regarded as one of real options. How to quantify the value of these non-material incentives ap-proach and combine with other materials will be our next research direction and focus.
REFERENCES [1] F. Hu, “Incentive Compensation Study on R & D Team,”
South China Normal University, Guangzhou, 2004.
[2] T. J. Englander, “Casey at the Bank,” Incentive, Vol. 167, No. 2, 1993, p. 20.
[3] R. J. Doyle, “Caution: Self-Directed Work Teams,” Hu-man Resource Magazine, Vol. 37, No. 6, 1992, pp. 153-155.
[4] B. Geber, “The Bugaboo of Team Pay,” Training, Vol. 32, No. 8, 1995, pp. 25-34.
[5] J. R. Hoffman and S. G. Rogelberg, “A Guide to Team Incentive Systems,” Team Performance Management, Vol. 4, No. 1, 1998, pp. 23-32.
[6] S. Y. Chen, X. W. Tang, D. B. Ni et al., “Value Analysis on Non Material Incentive in Combination Incentive to Managers,” Chinese Journal of Management Science, Vol. 13, No. 1, 2005, pp.122-126.
[7] W. J. Zhang and J. F. Li, “Motivation System in Chinese Knowledge-Enterprises,” Science Research Management, Vol. 22, No. 6, 2001, pp. 90-96.
[8] X. Li and G. S. Zhang, “The Effect of Stock Option In-centive for Manager from the Team Theory,” Business Times, Beijing, 2007.
[9] L. Yin, Z. Y. Zhao et al., “The Theory and Practice of Stock and Option Incentive for High-tech Enterprise,”
Copyright © 2010 SciRes. JSSM

The Method of Real Options to Encourage the R & D Team 240
Science Press, Beijing, 2004.
[10] X. W. Yuna, Z. Qin and J. B. Yi, “Interplay Mechanism of Learning and Performance in Organizations,” Science Research Management, Vol. 27, No. 6, 2006, pp. 80-85.
[11] S. F. Bi, D. S. Li and X. Ma, “The Application of Com-pound Option Method to the Project Evaluation,” Science Research Management, Vol. 29, No. 3, 2008, pp. 109-113.
[12] C. Wu and H. H. Hu, “Research on the Long Term Incen-tive Mechanism under Executive’s Management of Com-bined Investment,” Chinese Journal of Management Sci-ence, Vol. 15, No. 6, 2007, pp. 125-131.
[13] Z. G. Zhang, “Study on R & D Staff Incentive Payment Based on Compound option Model,” Science of Science
and Management of S. & T., Vol. 28, No. 8, 2007, pp. 179-183.
[14] H. L. Ding, “The Path Research of Benefit Apportion- ment for Technology Elements,” Journal of Nanjing Party Institute of CPC and Nanjing Administration Institute, Vol. 5, 2004, pp. 26-29.
[15] F. L. Chen and Z. G. Hu, “Research on Quantitative Ap-portionment Involving Technological Factors for Tech- nology-oriented Enterprises,” Science Research Man-agement, Vol. 29, No. 2, 2008, pp. 89-96.
[16] C. P. Yang, “Real Option and its Application,” Fudan University Press, Shanghai, 2003.
Copyright © 2010 SciRes. JSSM

J. Service Science & Management, 2010, 3, 241-249 doi:10.4236/jssm.2010.32030 Published Online June 2010 (http://www.SciRP.org/journal/jssm)
Copyright © 2010 SciRes. JSSM
Principal-Agent Theory Based Risk Allocation Model for Virtual Enterprise
Min Huang1, Guike Chen1*, Wai-Ki Ching2, Tak Kuen Siu3
1College of Information Science and Engineering, Northeastern University, Key Laboratory of Integrated Automation of Process Industry (Northeastern University), Ministry of Education, Shenyang, China; 2Department of Mathematics, The University of Hong Kong, Hong Kong, China; 3Department of Actuarial Studies, Faculty of Business and Economics, Macquarie University, Sydney, Australia. Email: [email protected], [email protected] Received February 3rd, 2010; revised March 19th, 2010; accepted April 29th, 2010.
ABSTRACT
In this paper, we consider a risk analysis model for Virtual Enterprise (VE) by exploring the state of the art of the prin-cipal-agent theory. In particular, we deal with the problem of allocating the cost of risk between two parties in a VE, namely, the owner and the partner(s). We first consider the case of a single partner of VE with symmetric information or asymmetric information and then the case of multiple partners. We also build a model for the optimal contract of the risk allocation based on the principal-agent theory and analyze it through specific example. At last we consider the case of multiple principal with potentially many partners based on common agency. Keywords: Virtual Enterprise, Risk Allocation, Principal-Agent Theory, Risk Aversion, Common Agency
1. Introduction
Virtual Enterprise (VE) is a dynamic alliance composed of independent individual enterprises which locate in different area. It’s designed to adapt to rapidly changing market opportunities, so as to achieve the sharing of skills, core competencies and resources [1,2]. Based on this concept, on one hand, member enterprises in a VE, which are geographically distributed, keep their inde-pendence and autonomy. On the other hand, they provide their own core competencies in different areas such as marketing, engineering and manufacturing to the VE. When new market requirements arise and individual en-terprises do not have all necessary skills and competen-cies to undertake these requirements independently, by combining specific expertise of other enterprises, it is possible to create a VE which is capable of responding to the new requirements. In a certain sense, the essence of VE has its basis in an early and fundamental concept of economics, namely, the division of labor, which has its origin in the classics, namely, the wealth of nations, by Adam Smith first published in 1776.
In spite of substantial advantages of VE, there are lots of risks associated with it, these risks include investment risk [3], operation risk [4], moral hazard [5,6] and market risk, and so on. These incomplete nesses arises from member enterprises not having sufficient background information about the other member enterprises or about
market environment in which the VE has to operate. The investigation of the structure, operations and economic implications of a VE has received much interest among researchers in the field. Much attention has been paid on some aspects of VE, such as partner selection [7,8], op-eration management [9], information exchanges [10] and their scales. However, an important issue, the risk man-agement of VE, has not been well-explored and ad-dressed until recently. Since virtual enterprises (VEs) are profit driven, it is one of the key issues to the successful running of VEs whether they could construct reasonable and efficient risk allocation mechanism in the operation process to prevent some members from gaining profit by harming others. The establishment of a VE can not re-duce or eliminate the risk due to the uncertainty of mar-ket opportunities and production capacities. The risk of the whole enterprise is re-distributed among different members in the VE. There are some ways to mitigate the risk in the cooperation process, such as partner selection [11,12], cooperation contract design [12], and coordina-tion mechanism design [13]. After reviewing the related literature, we found out that researchers have carried out certain publications on VE’s risk.
Based on the research of risk in supply chain [14], it produces partnerships [6] and joint ventures [15]. We consider a risk allocation model for VE by exploring the state of the art of the principal-agent theory. In particular, we deal with the problem of allocating the cost of risk

Principal-Agent Theory Based Risk Allocation Model for Virtual Enterprise 242
between two parties in a VE, namely, the owner and the partners. Our analysis invokes some basic and important concepts for the risk analysis, including utility function, risk-aversion level, principal-agent theory [16] and com-mon agency [17,18]. Here we first deal with the case of a single partner of VE with symmetric information or asymmetric information. Then, the model is extended to deal with the case of multiple partners. We also build a model for the optimal contract of the risk allocation based on the principal-agent theory. At last we extend the principal-agent framework with risk-neutral principals to situations in which several principals simultaneously and independently attempt to influence a common agent. The remainder of this paper is organized as follows. In Sec-tion 2, we give a brief discussion on some basic concepts of risk analysis and related assumptions. In Section 3, we present our risk allocation models. In Section 4, a spe-cific example is given to demonstrate our models in sec-tion 3. In Section 5, we discuss the incentive mechanism on the basis of common agency [18,19] when the rela-tionships between the principals is competition. Finally concluding remarks are given in Section 6.
2. Basic Concepts and Assumptions
In this section, we provide a brief discussion on some basic concepts of risk analysis, namely, the utility func-tion, the risk aversion and the principal-agent theory, in the context of VE which involving an owner and risk-averse member enterprises (partners). These con-cepts also play fundamental and important role in finan-cial economics and corporate finance. Then summarize the major notations to be used in this paper and give the assumptions.
n
First of all, utility can be considered as goods or ser-vices that meet the needs of consumer’s ability or desire. The utility function is defined as a mapping function which maps goods or services to consumer preferences. Let x denote the receipts or earnings of a member enter-prise. Then, the utility function is given by ( )x , which
is interpreted as goods or services that meet the member enterprise’s preference. It is a representation of the mem- ber attitude towards risk.
The degree of risk aversion is an important characteri-zation of a utility function. To measure the degree of risk aversion, Arrow (1970) and Pratt (1964) introduce the celebrated Arrow-Pratt ratio of risk aversion level given as follows.
''
'
( )( )
( )
Principal-agent theory tries to model the following types of questions. One participant (principal) wants to participate in another person (agent) in accordance with the interests of his choice of action, but the principal can
not observe directly the agent’s actions. What can only be observed are some other variables? These variables are decided by the agent’s action and other random fac-tors. The principal’s problem is how to incentives the agents in accordance with the information observed to encourage their agents to choose the most favorable ac-tions. The principal-agent model is built to analyze the optimal contract with asymmetric information. To solve the problem conveniently, we consider the optimal con-tract with symmetric information. The central issue of principal-agent relationship is the alternating between insurance and incentive.
To facilitate our discussion, we define the following notations and impose the following assumptions:
a , partner’s manpower contributing to the project (the productive effort of the partner);
1
r
i ii
t
, the random variables that not be con-
trolled by the alliance, where 1, 2,..., r are independ-
ent risk factors; 2 , the variance of ; ( ), ( )g G , the probability density function and the
distribution function of , respectively; ( , )a , the monetary income (outputs) of the alli-
ance; ( , )f a , the probability density function of ;
( )s x , the incentive contract (a way to repay partner);
( ), ( )v x u x , the owner’s and partner’s utility function
respectively;
u , the reservations utility (the greatest utility that part-ners do not accept the contract);
P , the owner’s risk aversion level;
A , the partner’s risk aversion level;
( )C a , cost function of the effort . a
In this paper, we consider an owner and several mem-ber enterprises (partners) in a VE. Each partner chooses a level of productive effort and a level of risk aver-sion
0a . Both productive effort and risk aversion
level
a
are individually costly to partners and we as-
sume that the two actions are stochastically independent and the cost of actions can be expressed in monetary units.
3. The Risk Allocation Models
In this section, we present the risk allocation model un-der the assumptions in section 2 based on principal-agent theory which involving an owner and one or risk- averse partners. We first deal with the case of a single partner of VE with symmetric information and asymmet-ric information (hidden action) respectively. Then, the
n
Copyright © 2010 SciRes. JSSM

Principal-Agent Theory Based Risk Allocation Model for Virtual Enterprise 243
model is extended to deal with the case of multiple part-ners.
3.1 The Optimal Contract of Risk Allocation with Symmetric Information to a Single Partner
In this subsection, we consider the case that the owner can observe the partner’s action (the productive effort) involving an owner and a risk-averse partner in a VE. As the partner’s action can be observed, the owner can force the partner to choose the ideal productive effort, so the incentive is surplus.
The risk allocation model is given as follows: Give a , the output is a simple random variable; the owner’s
objective is to maximize the utility of its own profit by allocating the total revenue from the VE project includ-ing choosing
a
( )s :
( )
max ( ) ( ) ( , )s
E v s v s f a d
(1)
. .( ) ,s t IR u s f a d C a
E u s C a u
(2)
Equation (2) is the partner’s individual rationality con-straint (IR). We then construct the Lagrange function as below:
( ) ( ) ( , )
( ) ( , ) ( )
L s v s f a d
u s f a d C a u
(3)
The partial derivative of the function with respect to ( )s is given by
' ' 0v s u s (4)
Therefore, we have
'
'
v s
u s
(5)
The Lagrange multiplier is a strictly positive constant in (5) (because (2) strictly satisfied).The corresponding optimal condition shows that the ratio of marginal utility of income of the owner and partner is a constant, no rela-tion with the output and uncertain variables .
The optimal condition of (5) implicitly defined the op-
timal contract s , from implicit function theorem, the
partial derivative with respect to is:
'' ''1 0ds ds
v ud d
(6)
Combining the above equations, we get
p
A p
ds
d
(7)
where ''
'P
v
v and
''
'A
u
u
Let P
A P
ds
d
(8)
Then we have 0
s t dt
(9)
In particular, if P and A are constants (no rela-
tion among their level of income), then the optimal con-tract is linear, i.e.
s (10)
We define RC to be the risk cost of the alliance project. Now, the improved risk programming model is given as follows:
2 21min
2 ARC
Such that
,
u s f a d C a
E u s C a u
RC R
arg max ( )E v s
3.2 The Optimal Contract of Risk Allocation with Asymmetric Information to a Single Partner
In this subsection, we consider the case that the owner can’t observe the partner’s action (the productive effort) involving an owner and a risk-averse partner in a VE. As the partner’s action is hidden, the owner has to incentive the partner to choose the ideal productive effort, i.e., the partner chooses action to maximize the utility of its own profit, where the owner cannot observe the value of
. We seek for maximizing the partner’s expected util-ity:
a
a
max ,a
u s f a d C a (11)
Equation (12) is the incentive compatibility constraints (IC).The partial derivative with respect to is: a
', 0au s f a d C a (12)
i.e., IC constraint can be replaced by the first-order ap-proach of (13). We then consider maximizing the utility of the owner’s profit:
( )
max ( ) ( ) ( , )s
E v s v s f a d
(13)
Copyright © 2010 SciRes. JSSM

Principal-Agent Theory Based Risk Allocation Model for Virtual Enterprise 244
Such that
,
u s f a d C a
E u s C a u
(14)
and (15) ',au s f a d C a Now, we construct the Lagrange function:
'
( ) ( ) ( , )
( ) ( , ) ( )
,a
L s v s f a d
u s f a d C a u
u s f a d C a
(16)
where and are the Lagrange multipliers of par-
ticipation constraint and the incentive constraint, respec-tively. The optimal condition is given as follows:
'
'
,
( , )a
v s f a
f au s
(17)
By comparing with (5), it shows that, if the owner cannot observe , the Pareto efficiency risk allocation is impossible. As
a0 (Holmstrom proved in 1979), in
order to motivate the partner to work hard, it has to bare more risks.
3.3 The Optimal Contract of Risk Allocation with Symmetric Information to Multiple Partners
In this subsection, we discuss the case of symmetric in-formation with multiple partners that the owner can ob-serve the partner’s action (the productive effort) involv-ing an owner and risk-averse partners in a VE. We first define the following notations and assumptions.
n
i , partner ; i ( 1, 2,..., )i n[0, )ia , the productive effort of partner ; i
i iC a , the cost function of partner ; strictly in-
creasing convex differentiable function, and
i
0 0iC ;
1 2, ,..., na a a a , the vector of all partners’ produc-
tive efforts; ( )x a , the common output decided by a, strictly in-
creasing concave differentiable function and (0) 0x ;
( , )a , monetary income (outputs);
1 2, , ,..., n f a a a , the probability density function of
;
iA , the partner i’s risk aversion level;
is , the revenue sharing factor of the partner.
As the owner can observe the partners’ actions, the owner doesn’t need to incentive the partners, its objective
is to maximize the utility of its own profit by allocating the total revenue from the VE project including choosing
is ( 1, 2,..., )i n . Similar to subsection 1, the model
is presented as below:
1 2, ,..., 1
1 21
max
, , ,...,
n
n
is s s i
n
i ni
E v s
v s f a a a
d
(18)
Such that
1 2, , ,...,
( 1, 2,..., )
i i n i i iu s f a a a d C a u
i n
(19)
Again, we construct the Lagrangian function as fol-lows:
1 2
1 21
1 21
, ,...,
, , ,...,
, , ,...,
n
n
i ni
n
i i i n i i ii
L s s s
v s f a a a d
u s f a a a d C a u
(20)
i ( 1, 2,..., )i n are the Lagrange multipliers and are
strictly positive constants in (21). We then consider the first-order condition as follow:
' '
1
''
1
''
'' ''
0( 1,2,..., )
( 1,2,..., )
1 0( 1, 2,..., )
n
i i i iii
n
ii
iii i
i ii i
Lv s u s i
s
v sv
i nuu s
ds dsv u i n
d d
n
(21)
Combining the above equations, we have
, ( 1, 2,..., )i
i P
A P
dsi
d
n (22)
Such that ''
'P
v
v and
''
'i
iA
i
u
u , ( (23) 1,2,..., )i n
We assume that
i
i Pi
A P
ds
d
, (24) ( 1,2,..., )i n
Then 0
i i is t dt
, (25) ( 1, 2,..., )i n
Copyright © 2010 SciRes. JSSM

Principal-Agent Theory Based Risk Allocation Model for Virtual Enterprise 245
We note if P and iA ( 1, 2,..., )i n are constants
(no relation with their levels of income), the optimal contract is linear, i.e.
i is i (26)
Now, the improved risk programming model is given as follows:
1 2
2
, ,..., 1
1min
2n
n
i ii
RC
2
(27)
Such that
1 2, , ,...,
( 1, 2,..., )
i i n i i iu s f a a a d C a u
i n
(28)
'1 2, , ,...,
( 1,2,..., )ii i a n i iu s f a a a d C a
i n
i
(29)
, ( 1, 2,..., )i iRC R i n (30)
1
n
ii
RC R
(31)
1 21
, ,..., arg maxn
ni
E v s
(32)
3.4 The Optimal Contract of Risk Allocation with Asymmetric Information to Multiple Partners
We then discuss the case of risk allocation with asym-metric information involving an owner and n risk-averse partners in a VE. As the partners’ action can’t be ob-served, the owner has to incentive to prevent the partners from free riding. So the incentive constraints are neces-sary. The owner’s objective is to maximize the utility of its own profit by allocating the total revenue from the VE project including choosing is and incentive the
partners . The model is given as follows: ( 1, 2,..., )i n
d
1 2, ,..., 1
maxn
n
is s s i
E v s
1 21
, , ,...,n
i ni
v s f a a a
(33)
Such that
1 2, , ,...,
( 1, 2,..., )
i i n i i iu s f a a a d C a u
i n
(34)
'1 2, , ,...,
( 1,2,..., )ii i a n i iu s f a a a d C a
i n
(35)
We then construct the Lagrangian function:
1 2
1 21
1 21
1 21
'
, ,...,
, , ,...,
, , ,...,
, , ,...,
i
n
n
i ni
n
i i i ni
i i i
n
i i i a ni
i i
L s s s
v s f a a a d
u s f a a a d
C a u
u s f a a a d
C a
(36)
where i and i ( 1, 2,..., )i n are the Lagrangian mul-
tipliers of participation constraints and the incentive con-straints respectively. The optimal conditions are given as below:
'
1 21
'1 2
, , ,...,
, , ,...,i
n
ia ni
i ini i
v sf a a a
f a a au s
(37)
Compared with (21), it shows that, if the owner cannot observe a, the Pareto efficiency risk allocation is impos-sible. The partners have to bare more risks.
4. A Specific Example
In this section, in order to have a better understanding of our models in section 3, we process example analyses to make further investigation. To simplify the analysis, we employ Linear sharing rules, Exponential utility, and normally distributed random variables in this paper, i.e., adopt agency model developed by Holmstrom and Mil-grom [20] which has been proved to be much more trac-table in addressing multi-action and multi-period models. This assumption does not affect the core issue, and the total output of the VE is assumed to be a linear function of the partners’ productive efforts, which is extended from the simple model Holmstrom and Milgrom (1987) proposed. The total output of the VE is:
1
n
ii
a
, and subjects to normal distribution
2(0, )N .
Therefore 1
n
ii
E a
, 2Var
Then i is i , ( 1, 2,..., )i n
And 1 1
n n
i ii i i
s s1
n
i
The owner’s expected utility is given by
1 1
1n n
i ii i
E v s1
n
ii
Copyright © 2010 SciRes. JSSM

Principal-Agent Theory Based Risk Allocation Model for Virtual Enterprise 246
It is assumed that the marginal cost is increasing in the level of effort and the cost function takes the quadratic form [21], to simplify the analysis, we assume that the cost function is continuously differentiable and strictly convex and take the form:
21
2i i i iC a b a
And is the coefficient (marginal cost). Partner i’s
actual revenue is ib
2
1
1
2
n
i i i i i i i i ii
s C a a b a
As the owner and every partner have constant absolute risk aversion, which implies its utility function is of the negative exponential form. Then, we make the usual transformation of expected utility into mean-variance terms as follows [22]:
2 2
2 2 2
1
1
21 1
2 2
i i i
n
i i i i i ii
E
a b
ia (38)
And 2 21
2 i i is partner ’s risk cost. If i a
can be observed, the owner can decide
. The model is given as follows:
1 2, ,..., na a a
, ,i i ia
, , 1 1
max 1i i i
n n
i ia i i
E v
Such that
2 2 2
1
1 1
2 2
( 1, 2,..., )
n
i i i i i i ii
a b
i n
ia
i is the reservation utility. The maximization problem
can be formulated as:
2 2 2
, 1 1 1
1 1max
2 2i i
n n n
i i i i ia i i i
f a b a
The optimality conditions are
2 0, 1 0
( 1, 2,..., )
i i i ii i
f fb a
a
i n
(39)
i.e., 1
ii
ab
, and 0i
1
2i iib
(40)
The Pareto efficiency risk allocation requires the part-
ners to bear no risk . If can-
not be observed, the owner can decide
( 0i )
1 2, ,..., na a a a
,i i .The part-
ners choose the action a to maximize their expected util-ity:
1 2
1 2, ,...,max , , ,...,
ni i i i
a a au s f a a a na d C
The partial derivative with respect to is
1 2, , ,...,
( 1, 2,..., )ii i a n iu s f a a a a
i n
'
id C
Since i ib ai , ii
i
ab
the problem
can be transformed into the following form
( 1,2,i ..., )n
1 1i i
,max 1
i i
n n
i i
f a
Such that
2 2
1
( 1, 2,..., )
( 1,2,..., )
n
i i i i i ii
ii
i
a
i n
a ib
21 1
2 2 i ia b
n
The problem can then be further transformed to the following problem:
22 2
1 1 1
2
1 1max
2 2
10 ( 1,2,..., )
i
n n n ni i
i i ii i i ii i
ii i
i i i
fb b
fi n
b b
1
Here we note that
2
10
1ii ib
, ( 1, 2,..., )i n
This also means that the partners must bear certain risk. While we can see i is a deceasing function in i ,
and
ib2 . In other words, the risks the partners bear are
negatively correlated to their risk aversion levels and the output variances. Now partner i’s risk costs is given by
2
2 222
10
2 2 1
( 1,2,..., )
ii i i
i i
RCb
i n
5. Multi-principal Models
In this section, we extend the principal-agent framework with risk-neutral principals to situations in which several principals simultaneously and independently attempt to influence a common agent that is considering the case of
Copyright © 2010 SciRes. JSSM

Principal-Agent Theory Based Risk Allocation Model for Virtual Enterprise 247
n
multi principal agency relationships of the members in VE which involving risk-neutral principals and a risk-aversion agent. We analyze the moral hazard and give optimal contract. To facilitate our discussion, we define the following notations and impose the following assumptions.
n
{1, 2,..., }N , the set of principals;
ia , the productive effort of the agent to the principal ; i
M , the upper bound productive effort of the agent to the principals; , the uncertain variance the agent can’t control, and
it subjects to normal distribution 2(0, )N ;
( , )i i ia
ia
, the monetary income (outputs) of the
effort ;
( )i i is s , the incentive contract (a way to repay the
agent with respect to ); ia
( )iC a , the cost function of efforts ; ia
( ) ( ( ))i i iv x v s i , the principal ’s utility function i
1
( ) ( ( ) ( ))n
i i i ii
u x u s C a
, the agent’s utility function
respectively;
i , the actual profit from principal ; i
0i , the opportunities income (reservation income)
of that the principal guarantees; iIn the multi-principal model, we assume that the total
productive effort of the agent has a limited M , which means the resources are limited and guarantees the boundedness of the solution. Because there are multiple principals, the model becomes more complex. As the relationship between the principals may affect the results of the model, we consider the competition relationships (non-cooperative). The model is given as follows: Every principal give a ( )i is non-cooperatively, the agent’s
objective is to maximize the utility of its own total profit by allocating the total revenue from the VE project in-cluding choosing every , ia ( 1,2,..., )i n :
max ( ( )
ii i i
sE v s
. .( ) ( ( ( ))) ( )
( 1, 2,..., )i i i i is t IR u E u s C a
i ni
1
( ) maxn
ii
IC u
u
1
n
ii
a M
In order to have a better understanding of the multi- principal models in this section, we process example analyses to make further investigation. To simplify the
analysis, we employ Linear sharing rules, Exponential utility, i.e., adopt agency model developed by Holmstrom and Milgrom [20] which has been proved to be much more tractable in addressing multi-action and multi-pe-riod models, and consider the case of two principals. This assumption does not affect the core issue. We add the following assumptions:
0ik , the agent to principal i’s effort level to the im-
pact factor of the marginal output; ( , )i i i i ia k a i
, the output of the agent to
principal ;
i , the fixed remuneration of member enterprise ; i
0i i
, the revenue sharing factor of member enter-
prise ; , the agent’s risk aversion level;
21( )
2iC a ba i
i
, the cost of ; ia
( )i is , linear sharing rules;
21
2i i i ib a i .
For principal 1,
1, 1
1 1 1 1 1 1 1 1
2 2 21 1 1 1 1 1 1 1
1 2
1 2
max ( ( )) (1 )
1 1. .( )
2 2
( ) max
v E v s k a
s t IR u k a ba
IC u u u
a a M
1
For principal 2,
2, 2
2 2 2 2 2 2 2 2
2 2 22 2 2 2 2 2 2 2
1 2
1 2
max ( ( )) (1 )
1 1. .( )
2 2
( ) max
v E v s k a
s t IR u k a ba
IC u u u
a a M
2
To solve the above models, we construct the Lagran-gian function as follows:
1 2 1 2
2 2 21 1 1 1 1 1
2 22 2 2 2 2 2
1 2
( )
1 1
2 2
1 1
2 2
( )
L u u a a M
k a ba
k a ba
a a M
2
is the Lagrange multiplier. We then consider the first-order condition as follow:
Copyright © 2010 SciRes. JSSM

Principal-Agent Theory Based Risk Allocation Model for Virtual Enterprise 248
1 1 11
2 2 22
1 2
0
0
0
Lk ba
a
Lk ba
a
La a M
So the optimal productive effort is
1 1 2 21
2 2 1 12
2 2
2 2
k kMa
bk kM
ab
Substituting , into the principal 1’s object
function, the optimal problem is: 1a
2a
1
2 2 21 1 1 1 1 1
21 1 2 2 1 1 2 21
2 21 1
1 1max
2 2
1( ) (
2 2 2 2 21
2
v k a ba
k k k kM Mk b
b
)b
The first-order condition on the 1 :
1
1
0v
Then the optimal solution is 2
1 1 1 2 21 2 2
1
2 2 21 1 1 1 1 1
2
4
1 1
2 2
k k bM k k
k b
k a ba
1
Similarly, we can solve the optimal solution to the principal 2:
22 2 1 2 1
2 2 22
2 2 22 2 2 2 2 2
2
4
1 1
2 2
k k bM k k
k b
k a ba
2
From the above , , 1a2a
1 and 2
, we can analy-
sis their mutual relationships and conclude that. The de-cision-making influences each other, when the other conditions had been given; the efforts of the agent de-pend on the strength of incentives of all principals. And the intensity of incentives weakens each other. These hypothesizes are also supported by many realistic cases.
6. Conclusions Virtual enterprise is the main form of cooperation be-tween enterprises today. Researching on the risk alloca-
tion in VE has both theoretical and practical importance. On the basis of the introduction of the concepts of risk analysis, this paper mainly describes the risk allocation of VE based on the principal-agent theory and draws the following conclusions: if the owner cannot observe the partners’ efforts level, the Pareto efficiency risk alloca-tion is impossible to achieve. In other words, the partners must bear certain risks, and the risks the partners bearing are negatively correlated to his risk aversion level and the output variance. For the perfection of the problem, we consider the case of multiple principal based on common agency in Section 5. To simplify the analysis and explore the implications of the risk allocation mechanism, we have made some restrictions to the example in section 4, such as linear/quadratic forms, independence, normal distribution, etc. In the future research, we will relax these restrictions to investigate the allocation mechanism under much more general environment, and consider the incentive mechanism when the relationship between the principals is cooperative.
7. Acknowledgements The authors wish to thank the support of the National Natural Science Foundation of China under Grant No. 70671020, No. 70721001, No. 70931001 and No. 60673159, Specialized Research Fund for the Doctoral Program of Higher Education under Grant No. 20070145017, the Fundamental Research Funds for the Central Universities under Grant No. N090504006 and No. N090504003, Science and Technology Research Fund of Bureau of Education of Liaoning Province, and the RGC Grant 7017/07P, HKU CRCG Grants, Hung Hing Ying Physi-cal Sciences Research Fund and HKU Strategic Research Theme Fund on Computational Sciences.
REFERENCES [1] M. T. Martinez, P. Fouletier, K. H. Park and J. Favrel,
“Virtual Enterprise-Organization, Evolution and Control,” International Journal of Production Economics, Vol. 74, No. 3, 2001, pp. 225-238.
[2] A. Mowshowitz, “Virtual Organization,” Communication of the ACM, Vol. 40, No. 9, 1997, pp. 30-37.
[3] M. Ojala and J. Hallikas, “Investment Decision-Making in Supplier Networks: Management of Risk,” Interna- tional Journal of Production Economics, Vol. 104, No. 1, 2006, pp. 201-213.
[4] Q. L. Gao and G. P. Cheng, “Virtual Enterprise’s Ope- ration Risk,” Value Engineering, Vol. 104, No. 9, 2006, pp. 104-105.
[5] M. Thomas and E. Norman, “Moral Hazards on the Road to the ‘Virtual’ Corporation,” Business Ethics Quarterly, Vol. 8, No. 2, 1998, pp. 273-292.
[6] M. Gaynor and P. Gertle, “Moral Hazard and Risk Spreading in Partnerships,” Journal of Economics, Vol. 26, No. 4, 1995, pp. 591-613.
Copyright © 2010 SciRes. JSSM

Principal-Agent Theory Based Risk Allocation Model for Virtual Enterprise
Copyright © 2010 SciRes. JSSM
249
[7] F. Ye and Y. N. Li, “Group Multi-Attribute Decision Model to Partner Selection in the Formation of Virtual Enterprise under Incomplete Information,” Expert Systems with Applications, Vol. 36, No. 5, 2009, pp. 9350-9357.
[8] A. H. Yannis and C. G. Andreas, “A Goal Programming Model for Partner Selection Decisions in International Joint Ventures,” Journal of Operations Management, Vol. 138, No. 3, 2002, pp. 649-662.
[9] H. M. Gou, B. H. Huang, W. H. Liu and X. Li, “A Framework for Virtual Enterprise Operation Manage- ment,” Computers in Industry, Vol. 50, No. 3, 2003, pp. 333-352.
[10] A. F. Cutting-Decelle, R. I. M. Young and B. P. Das, “Information Exchanges in a Cross Disciplinary Supply Chain: Formal Strategy and Application,” INCOM’06 Conference, Saint-Etienne, 2006.
[11] W. Ip, M. Huang, K. Yung and D. Wang, “Genetic Algorithm Solution for a Risk-Based Partner Selection Problem in a Virtual Enterprise,” Computers and Opera tions Research, Vol. 30, No. 2, 2003, pp. 213-231.
[12] H. Lars, “Managing Cooperative Research and Deve- lopment: Partner Selection and Contract Design,” R & D Management, Vol. 23, No. 4, 2007, pp. 273-285.
[13] L. M. Camarinha-Matos and C. Lima, “Cooperation Coordination in Virtual Enterprises,” Journal of Intelli- gent Manufacturing, Vol. 12, No. 2, 2001, pp. 133-150.
[14] R. Narasimhan and T. P. Srinivas, “Perspectives on Risk
Management in Supply Chains,” Journal of Operations Management, Vol. 27, No. 21, 2009, pp. 114-118.
[15] L. H. Sung, H. P. Yeng, M. R. Yan and J. R. Lee, “On-Line Multi-Criterion Risk Assessment Model for Construction Joint Ventures in China,” Automation in Construction, Vol. 16, No. 5, 2007, pp. 607-619.
[16] B. Holmstrom, “Moral Hazard and Observability,” Bell journal of Economics, Vol. 10, No. 1, 1979, pp. 74-91.
[17] G. Esther, “Multi Principal Agency Relationships as Implied by Product Market Competition,” Journal of Economic & Management Strategy, Vol. 6, No. 1, 2004, pp. 235-256.
[18] B. D. Bernheim and M. D. Whinston, “Common Agency,” Econometrica, Vol. 54, No. 4, 1986, pp. 923-942.
[19] A. Attar, E. Campioni, G. Piaser and U. Rajan, “On Multiple-Principal Multiple-Agent Models of Moral Ha- zard,” Games and Economic Behavior, Vol. 68, No. 1, 2010, pp. 376-380.
[20] L. M. Camarinha-Matos and C. Lima, “Aggregation and Linearity in the Provision of Intertemporal Incentives,” Econometrica, Vol. 55, No. 5, 1987, pp. 303-328.
[21] G. Feltham and J. Xie, “Performance Measure Congruity and Diversity in Multi-Task Principal-Agent Relations,” The Accounting Review, Vol. 69, No. 3, 1994, pp. 429-453.
[22] R. A. Lambert, “Contracting Theory and Accounting,” Journal of Accounting and Economics, Vol. 32, No. 1-3, 2001, pp. 3-87.

J. Service Science & Management, 2010, 3, 250-256 doi:10.4236/jssm.2010.32031 Published Online June 2010 (http://www.SciRP.org/journal/jssm)
Copyright © 2010 SciRes. JSSM
Sustainable Tourism and Management for Coral Reefs: Preserving Diversity and Plurality in a Time of Climate Change
M. James C. Crabbe
LIRANS Institute of Research in the Applied Natural Sciences, Faculty of Creative Arts, Technologies and Science, University of Bedfordshire, Luton, United Kingdom. Email: [email protected] Received November 18th, 2009; revised March 1st, 2010; accepted April 18th, 2010.
ABSTRACT
Coral reefs throughout the world are under severe challenges from a variety of anthropogenic and environmental fac-tors. In a period of climate change, where mobility and tourism are under threat, it is useful to demonstrate the value of eco- and research-tourism to individuals and to cultures, and how diversity and pluralism in sustainable environments may be preserved. Here we identify the ways in which organisations use research tourism to benefit ecosystem diversity and conservation, show how an Earthwatch project has produced scientific information on the fringing reefs of North Jamaica, and how a capacity-building programme in Belize developed specific action plans for ecotourism. We discuss how implementation of those plans can help research tourism and preserve ecosystem diversity in times of climate change. Keywords: Fisheries Policy, Belize, Global Warming, Jamaica, Ecosystems
1. Introduction
1.1 Coral Reefs
Coral reefs throughout the world are under severe chal-lenges from a variety of anthropogenic and environmental factors including overfishing, destructive fishing practices, coral bleaching, ocean acidification, sea-level rise, algal blooms, agricultural run-off, coastal and resort develop-ment, marine pollution, increasing coral diseases, inva-sive species, and hurricane/cyclone damage [1,2]. Most reefs are thought of as open non-equilibium systems, [3] with diversity maintained by disturbance and recruitment, as well as by predation, competition and evolutionary his-tory [4]. Interspecific competition [5,6] is pervasive among coral communities, and is important in maintaining their viability [7,8]. Heterospecific competition of corals with algae reduces coral growth and survivorship [9,10]. In corals, spatial arrangement, orientation and aggregation may be a key mechanism contributing to species coexis-tence on coral reefs [11,12]. Maintaining coral reef popu- lations in the face of large scale degradation and phase- shifts on reefs depends critically on recruitment [13,14], maintenance of grazing fish and urchin populations [15],
clade of symbiotic zooxanthellae [16] and management of human activities related to agricultural land use and coastal development [17]. It is the generation of scientific information and capacity-building with the help of eco- and research-tourism that we wish to address here, par-ticularly as such non-governmental oganisations come un-der threat in a period of climate change.
1.2 Climate Change and the End of Tourism?
Tourism is a vital economic driver for many countries; not least some of the poorest countries in the world. The literature on climate change and sustainable tourism is somewhat fragmented, largely consisting of individual case-studies [18-20], although all agree on the cross- border nature of tourism. Burns and Bibbings [21] in their paper on socio-cultural aspects of tourism, discuss the changes in demand that climate change brings to the tourism agenda. They take a series of research questions based around ethical consumption, sustainability, policies, actions and communication, and indicate that social ben- eficial behaviour for all concerned is the way forward; simply sticking to adaptation as the default response to climate change will hasten the ‘end of tourism’.

Sustainable Tourism and Management for Coral Reefs: Preserving Diversity and Plurality in a Time of Climate Change 251
1.3 Ecotourism and Research Tourism
The ‘compulsive’ appetite for increasing mobility [22,23] allied to a social desire for extraordinary ‘peak experie- nces’ [24] has led to the modern ‘ethical consumer’ for tourism services [22,25] derived from the ‘experiential’ and ‘existential’ tourist of the 1970s [26]. The model un- derlying sustainability tourism is complex with contra-dictory elements [27]―for example irrefutable evidence about the consequences of climate change yet a lack of information on how to respond at a community level. Se- veral organisations have taken the concept of ecotourism further to research tourism, whereby the tourist gets to work on research projects under the supervision of rec-ognised researchers. Two organisations that have devel-oped research tourism are Operation Wallacea, based in the UK, and the Earthwatch Institute, based in the USA but with global coverage and offices in several countries.
Here we identify the ways in which both organisations use research tourism to benefit ecosystem diversity and conservation. We then show how an Earthwatch progr- amme on coral reefs generated scientific information to inform management strategies in Jamica. This is followed by a description of a capacity-building programme in Belize, which developed specific action plans for tourism. We discuss how implementation of those plans can help preserve coral reef ecosystems in times of climate change.
1.4 Operation Wallacea
Operation Wallacea (OpWall; http://www.opwall.com) is a series of biological and conservation management re-search programmes that operate in remote locations across the world. These expeditions are designed with specific sustainable conservation aims in mind―from identifying areas needing protection, through to implementing and assessing conservation management programmes. Uni-versity academics, who are specialists in various aspects of biodiversity or social and economic studies are con-centrated at the target study sites giving volunteers the opportunity of working on a range of research projects. The research has resulted in several publications in peer- reviewed journals (e.g., 14 papers published on coral reefs in the Wakatobi Marine National Park, Indonesia, from 2003-2009―details at: http://www.opwall.com/Library/ Indonesia/coral%20reefs.shtml), the discovery of 30 ver- tebrate species new to science, 4 ‘extinct’ species being re-discovered and $ 2 million levered from funding agen-cies to set up best practice management examples at the study sites.
A research and conservation strategy has been devel-oped and is applied in 4 stages at each of the sites. This includes an initial assessment of the biological value of the site (stage 1). If the site is accepted into the OpWall programme then an ecosystem monitoring programme is established to determine the direction of change (stage 2).
If this reveals a continuing decline then a programme for monitoring socio-economic change in adjacent communi-ties is established to determine how these communities interact with the study site (stage 3). Once these stage 2 and stage 3 data are obtained funding applications are submitted to establish a best practice example of conser-vation management and the success of these programmes are then monitored (stage 4). There is obviously some considerable overlap between these stages and stage 1 projects can still be running in addition to a stage 4 pro-gramme in order to add data to understanding the eco-system requirements of target species or adding to the overall species lists for previously un-worked taxa.
Throughout these 4 stages of development, an addi-tional objective of the programmes is to develop financial benefits to local communities from protecting the studied areas. Wherever possible the expeditions are organised in close co-operation with the local communities and sub-stantial benefits accrue to those communities through providing accommodation, food, transport, manpower etc. In addition to the direct economic input from the expedi-tions though, emphasis is placed on the development of businesses that can provide alternative incomes to local communities (e.g., coral growing for the aquarists market in Kaledupa, Wildlife Conservation Product prices for cashews, chocolate and coffee in Indonesia and Honduras etc.) in the additional funding applications made.
1.5 Earthwatch Institute
Earthwatch (http://www.earthwatch.org/) is an interna-tional environmental charity which is committed to con-serving the diversity and integrity of life on earth to meet the needs of current and future generations. They work with a wide range of partners, from individuals who work as conservation volunteers on research teams through to corporate partners (such as HSBC), governments and institutions. Earthwatch has a global reach, with offices in Oxford (UK), Boston (USA), Melbourne (Australia) and Tokyo (Japan). Earthwatch engages people world-wide in scientific field research and education to promote the understanding and action necessary for a sustainable environment. Research volunteers work with scientists and social scientists around the world to help gather data needed to address environmental and social issues. By directly supporting field research and educating and en-gaging thousands of people, Earthwatch has made a sig-nificant contribution to achieving a sustainable environ-ment over the past 35 years. Apart from many papers in peer-reviewed journals, Earthwatch has had other suc-cesses in sustainable ecosystems. These include securing Ramsar status (see: http://www.ramsar.org/index_about_ ramsar.htm) for Lake Elmenteita in Kenya and diverting shipping lanes to help dolphin conservation in the waters around Spain. In 2008, Earthwatch Australia won an En-vironment Award for supporting a research project on
Copyright © 2010 SciRes. JSSM

Sustainable Tourism and Management for Coral Reefs: Preserving Diversity and Plurality in a Time of Climate Change
Copyright © 2010 SciRes. JSSM
252
Forest Marsupials (see: http://www.earthwatch.org/about- us/results/)
These individuals were chosen because they had direct contact with both NGOs (Non-governmental organisa-tions) and CBOs (Community-based organisations), and the government Fisheries Department, thus maximising exposure of capacity-building while keeping the numbers of participants within workable limits [29]. Discussions, led by the Facilitator employed a modified nominal group technique [30] to identify priorities related to personal action plans. Four rounds were employed; round one was based on the Delphi technique and further rounds on the nominal group technique approach [31]. Those rounds resulted in a number of management proposals [32], and an action plan for ecotourism.
Both these organisations have well evidenced strateg- ies and outputs regarding community and ecosystem sus-tainability. It is the long-term strategies of both organisa-tions that underpin their successes in this area; they are in for the long haul, and can effect conservation in a differ-ent way to a standard 3 year research grant.
2. Methods
2.1 Jamaican Coral Reef Sites and Sampling
Studies were conducted using SCUBA at five sites [Rio Bueno (18° 28.805' N; 77° 27.625' W), Dancing Ladies (18° 28.369' N; 77° 24.802' W), M1 (18° 28.337' N; 77° 24.525' W), Dairy Bull (18° 28.083' N; 77° 23.302' W), and Pear Tree Bottom (18° 27.829' N; 77° 21.403' W)] over a seven year period (2002-2009) along the fringing reefs surrounding Discovery Bay, Jamaica. GPS coordinates were determined using a hand-held GPS receiver (Garmin Ltd.). For all sites, four haphazardly located transects, each 15 m long and separated by at least 5 m, were laid at be-tween 5-8.5 m depth, to minimise variation in growth rates due to depth. Corals 2 m either side of the transect lines were photographed and surface areas measured with flexible tape as described previously using SCUBA [see 28]. To increase accuracy, surface areas rather than di-ameters of live non-branching corals were measured.
3. Results
3.1 Corals on the Fringing Reefs of Jamaica
As the viability of small coral colonies over time can indicate reef resilience [see 28], as part of an Earthwatch project on coral reefs of Jamaica, Figure 1 shows the annual changes in the colony numbers of the smallest size class (0-250 mm2 surface area) each year from 2002-2008 for one massive species of coral, Diploria strigosa. There was a reduction in the smallest size class at all the sites in 2006, with subsequent increases at all sites in 2007 and 2008. This behaviour was similar to that observed with other coral species [28].
The only bleaching event that significantly impacted the reef sites during the study period was the mass Car-ibbean bleaching event of 2005. Analysis of satellite data showed that there were 6 degree heating weeks (dhw) for sea surface temperatures in September and October 2005 near Discovery Bay, data which was mirrored by data loggers on the reefs [see 28]. Six dhw are equivalent to six weeks of sea surface temperatures (SSTs) one degree Celsius greater than the expected summer maximum.
This work was conducted at Discovery Bay during March 26-April 19 in 2002, March 18-April 10 in 2003, July 23-August 21 in 2004, July 18-August 13 in 2005, April 11-18 in 2006, December 30 in 2006-January 6 in 2007, and July 30-August 16 in 2008.
2.2 Capacity Building Exercise in Belize for Coral Reefs
Interestingly, in 2005, the year after hurricane Ivan, the most severe storm to impact the reef sites over the study period, there was a slight reduction in the numbers of the smallest size classes, particularly notable at Dairy Bull.
The capacity building team consisted of one officer from the Belize Fisheries Department, three senior officers from NGOs involved in managing Belize MPAs (TIDE, TASTE and Friends of Nature), and myself from the UK.
Figure 1. Graphs of annual changes in the colony numbers of the smallest size class (0-250 mm2 surface area) from 2002-2008 for Diploria strigosa at Rio Bueno (RB), M1 (M1), Dancing Ladies (DL), Dairy Bull (DB), and Pear Tree Bottom (PTB)

Sustainable Tourism and Management for Coral Reefs: Preserving Diversity and Plurality in a Time of Climate Change 253
Figures 2(a)-2(b) show total colony numbers of me-
dium-large surface area corals (i.e., > 250 mm2 surface area) during the same period, for the massive corals Dip-loria strigosa and Colpophyllia natans.
These data show that while recruitment of small corals is returning after the major bleaching event of 2005, lar-ger corals are not necessarily so resilient, and so need careful management if the reefs are to survive such major extreme events.
3.2 Action Plan to Foster Ecotourism for Coastal Zone Management of Coral Reefs
Table 1 illustrates a summary action plan developed for ecotourism and coastal zone management. Implementa-tion of that plan requires a series of tactics revolving
around a number of themes: organisation and managem- ent, education, resources, and policy development. It is important to have clear and disinterested leadership and a decision-making process that links local stakeholders with ecotourism organisations, and is widely respected to reduce the possibility that differences do not deteriorate into conflict. Surveys need to be conducted to evaluate level of success and failure. Too often, programmes have been formed and implemented but end results have not been evaluated. Surveys should be carried back to stake-holders for a presentation to establish further steps, and communication is an essential feature of maintenance of ecotourism and conservation. The capacity-building ex-ercise helped in continuing the link between the Earth-watch Institute and the Fisheries Department in the Be-lize Government [29,32].
Year
Co
lon
y nu
mbe
rs
(a)
Year
Co
lony
num
bers
(b)
Figure 2. Graphs of annual changes in the total colony numbers of medium-large size corals (> 250 mm2 surface area) from 2002-2008 for: Diploria strigosa (a) and Colpophyllia natans (b) at Rio Bueno (RB), M1 (M1), Dancing Ladies (DL), Dairy Bull (DB), and Pear Tree Bottom (PTB)
Copyright © 2010 SciRes. JSSM

Sustainable Tourism and Management for Coral Reefs: Preserving Diversity and Plurality in a Time of Climate Change 254
Table 1. Action plan for ecotourism and management of coral reefs from the capacity building exercise conducted in Belize
Objective Activity Output Outcome Impact
To improve networking between local stakeholders and ecotourism partners. To improve awareness of climate change issues for local stakeholders
Organise meetings with partners and share infor-mation. Hold meetings between ecotourism partners and distribute climate change information among part-ners and stakeholders
Distributing research papers and informa-tion among other researchers and part-ners and local stake-holders.
Development of projects linking ecotourism part-ners with NGOs, CBOs and local stakeholders
Improved conservation of coastal zone species
Will create better awareness and will assist in deci-sion-making at local and national levels.
4. Plurality and Communication
Research ecotourisism organisations such as those men-tioned above are important in that they provide first hand experience of living and working in pluralistic cultures, and are a complement to the information available via broadcasting and over the internet. In a digital age, where anyone can gain access to opinions through the internet, there is a worry that loss of plurality might be a problem [15]. In order to foster the virtues of plurality and differ-ence inherent in civil societies our cultures need at the same time points of connection and mutual recognition, where differences can be asserted, acknowledged and accommodated. Can that public space for the common recognition of difference be created in the internet age? Must plurality be remodelled anew? Debate on these questions is important, if we are to preserve diversity in all its aspects.
Diversity and pluralism―a problem or an answer for policy development?
Isaiah Berlin defined negative liberty as the absence of constraints on, or interference with, agents’ possible ac-tion [33]. Greater “negative freedom” meant fewer re-strictions on possible action. Berlin associated positive liberty with the idea of self-mastery, or the capacity to determine oneself, to be in control of one’s destiny. While Berlin granted that both concepts of liberty represent valid human ideals, as a matter of history the positive concept of liberty has proved particularly susceptible to political abuse [34].
Intimately connected with this pluralist thesis is a be-lief in freedom from interference, especially by those who think they know better, that they can choose for us in a more enlightened way than we can choose for our-selves. This is relevant to sustainability and tourism, as under neoliberalism, everything can become commodi-fied, from products and services to the environment. De-velopment of policy by ‘participation’ is often far from participatory and representative [35-36]. Instead of a spl- endid synthesis there must be a permanent, at times painful, piecemeal process of untidy trade-offs and care-ful balancing of contradictory claims [e.g., 32,37].
New global rights discourses and international law poi- nt towards sustainable relationships between different cultural groups and the environment. The results from research tourism can help to transform the development of resources, for example in Jamaica and elsewhere in the Caribbean [28,38-39] to the preservation of resources [40]. Research being conducted by the Opwall and Ear- thwatch research tourists can not only help immeasurably in obtaining important scientific information, such as that described in this paper for the coral reefs of Jamaica, but also build bridges between stakeholder communities and organisations. Examples of where this has been success-ful, using protocols similar to those mentioned in Table 1, are in Belize [32] and in Cayos Cochinos in Honduras [41]. Ecotourism can help conserve both biological and social diversity. As the political reality of climate change becomes more evident, the valuable tools from research tourism need to be preserved in the face of increasing pressures. As Lois MacNiece wrote [42]: World is suddener than we fancy it. World is crazier and more of it than we think. Incorrigibly plural.
5. Acknowledgements
I thank the Earthwatch Institute and the Oak Foundation (USA) for funding, Mr. Anthony Downes, Mr. Peter Gayle, and the staff of the Discovery Bay Marine Labo-ratory, Jamaica, for their invaluable help and assistance, and to volunteers for their help underwater measuring corals.
REFERENCES [1] T. A. Gardner, I. M. Côté, J. A. Gill, A. Grant and A. R.
Watkinson, “Long-Term Region-Wide Declines in Car-ibbean Corals,” Science, Vol. 301, No. 5635, 2003, pp. 958-960.
[2] D. R. Bellwood, T. P. Hughes, C. Folke and M. Nyström, “Confronting the Coral Reef Crisis,” Nature, Vol. 429, No. 6994, 2004, pp. 827-833.
[3] J. H. Connell, “Diversity in Tropical Rain Forests and
Copyright © 2010 SciRes. JSSM

Sustainable Tourism and Management for Coral Reefs: Preserving Diversity and Plurality in a Time of Climate Change 255
Coral Reefs,” Science, Vol. 199, No. 4335, 1978, pp. 1302-1310.
[4] C. S. Rogers, “Hurricanes and Coral Reefs: The In-ter-mediate Disturbance Hypothesis Revisited,” Coral Reefs, Vol. 12, No. 3-4, 1993, pp. 127-137.
[5] P. Stoll and D. Prati, “Intraspecific Aggregation Alters Competitive Interactions in Experimental Plant Commu-nities,” Ecology, Vol. 82, No. 2, 2001, pp. 319-327.
[6] S. Hartley and B. Shorrocks, “A General Framework for the Aggregation Model of Coexistence,” Journal of Ani-mal Ecology, Vol. 71, No. 4, 2002, pp. 651-662.
[7] R. H. Karlson, “Dynamics of Coral Communities,” Klu-wer Academic Publishers, Dordrecht, The Netherlands, 1999.
[8] R. H. Karlson, H. V. Cornell and T. P. Hughes, “Aggre-gation Influences Coral Species Richness at Multiple Spa-tial Scales,” Ecology, Vol. 88, No. 1, 2007, pp. 170-177.
[9] D. Lirman, “Competition between Macroalgae and Corals: Effects of Herbivore Exclusion and Increased Algal Bio-mass on Coral Survivorship and Growth,” Coral Reefs, Vol. 19, No. 4, 2001, pp. 392-399.
[10] S. J. Box and P. J. Mumby, “Effect of Macroalgal Com-petition on Growth and Survival of Juvenile Caribbean Corals,” Marine Ecology Progress Series, Vol. 342, 2007, pp. 139-149.
[11] J. A. Idjadi and R. H. Karlson, “Spatial Arrangement of Competitors Influences Coexistence of Reef-Building Corals,” Ecology, Vol. 88, No. 10, 2007, pp. 2449-2454.
[12] M. J. C. Crabbe, “Topography and Spatial Arrangement of Reef-Building Corals on the Fringing Reefs of North Jamaica May Influence their Response to Disturbance from Bleaching,” Marine Environmental Research, Vol. 69, No. 3, 2010, pp. 158-162.
[13] T. P. Hughes and J. E. Tanner, “Recruitment Failure, Life Histories and Long-Term Decline of Caribbean Corals,” Ecology, Vol. 81, No. 8, 2000, pp. 2250-2263.
[14] S. L. Coles and E. K. Brown, “Twenty-Five Years of Change in Coral Coverage on a Hurricane Impacted Reef in Hawai’i: The Importance of Recruitment,” Coral Reefs, Vol. 26, No. 3, 2007, pp. 705-717.
[15] P. J. Mumby, A. Hastings and H. J. Edwards, “Th- resholds and the Resilience of Caribbean Coral Reefs,” Nature, Vol. 450, No. 7166, 2007, pp. 98-101.
[16] M. Stat, E. Morris and R. D. Gates, “Functional Diversity in Coral-Dinoflagellate Symbiosis,” Proceedings of the National Academy of Sciences USA, Vol. 105, No. 27, 2008, pp. 9256-9261.
[17] C. Mora, “A Clear Human Footprint in the Coral Reefs of the Caribbean,” Proceedings of the Royal Society B-Bio-logical Sciences, Vol. 275, No. 1636, 2008, pp. 767-773.
[18] E. Tompkins, S. Nicholson-Cole, L. Hurlston, E. Emily Boyd, G. Brooks Hodge, J. Clarke, G. Gray, N. Trotz and L. Varlack, “Surviving Climate Change in Small Is-lands―a Guidebook,” Tyndall Centre for Climate Change Research, Norwich, 2005.
[19] A. Perry, “The Mediterranean: How Can the World’s
Most Popular and Successful Tourist Destination Adapt to a Changing Climate?” In: Hall, C. M. and Higham, J. Eds., Tourism, Recreation and Climate Change, Channel View, Clevedon, 2005, pp. 86-96.
[20] J. Higham and M. Hall, “Making Tourism Sustainable: The Real Challenge of Climate Change?” In: Hall, C. M. and Higham, J. Eds., Tourism, recreation and climate change, Channel View, Clevedon, 2005, pp. 301-307.
[21] P. Burns and L. Bibbings, “The End of Tourism? Climate Change and Societal Challenges,” 21st Century Society, Vol. 4, No. 1, 2009, pp. 31-51.
[22] P. Burns, “Tribal Tourism-Cannibal Tours: Tribal Tour-ism to Hidden Places,” In: Novelli and Marina, Eds., Niche Tourism: Contemporary Issues, Trends, Cases, El-sevier, Oxford, 2005, pp. 101-110.
[23] J. Urrey, “Cars, Climates and Complex Futures,” Depart-ment of Sociology, Lancaster, 2006.
[24] A. Holden, “Environment and Tourism,” 2nd Edition, Routledge, London, 2008.
[25] D. Fennell, “Ethical Tourism,” Routledge, London, 2006.
[26] E. Cohen, “A Phenomenology of Tourist Experiences,” Sociology, Vol. 13, No. 2, 1979, pp. 179-201.
[27] T. Patterson, S. Bastianoni and M. Simpson, “Tourism and Climate Change: Two Way Street, or Vicious/Virtuous Circle?” Journal of Sustainable Tourism, Vol. 14, No. 4, 2006, pp. 339-348.
[28] M. J. C. Crabbe, “Scleractinian Coral Population Size Structures and Growth Rates Indicate Coral Resilience on the Fringing Reefs of North Jamaica,” Marine Environ-mental Research, Vol. 67, No. 4-5, 2009, pp. 189-198.
[29] M. J. C. Crabbe, E. Martinez, C. Garcia, J. Chub, L. Cas-tro and J. Guy, “Is Capacity Building Important in Policy Development for Sustainability? A Case Study Using Ac-tion Plans for Sustainable Marine Protected Areas in Be-lize,” Society and Natural Resources, Vol. 23, No. 2, 2010, pp. 181-190.
[30] J. A. Sample, “Nominal Group Technique: An Alterna-tive to Brainstorming,” The Journal of Extension, Vol. 22, No. 2, 1984. http://joe.org /joe/1984march/iw2.html
[31] T. V. McCance, D. Fitzsimons, S. Keeney, F. Hasson and H. P. McKenna, “Capacity Building in Nursing and Mid-wifery Research and Development: An Old Priority with a New Perspective,” Journal of Advanced Nursing, Vol. 59, No. 1, 2007, pp. 57-67.
[32] M. J. C. Crabbe, E. Martinez, C. Garcia, J. Chub, L. Cas-tro and J. Guy, “Identifying Management Needs for Sus-tainable Coral-Reef Ecosystems,” Sustainability: Science, Practice & Policy, Vol. 5, No.1, 2009, pp. 42-47.
[33] T. Gardam, “The Purpose of Plurality,” In: Gardam, T. and Levy, D. A. Eds., The Price of Plurality, The Reuters Institute for the Study of Journalism, Oxford, 2008, pp. 11-21.
[34] I. Berlin, “Liberty,” Oxford University Press, Oxford, 2002.
[35] G. Crowder, “Isaiah Berlin: Liberty and Pluralism,” Polity, Key Contemporary Thinkers Series, Cambridge, 2004.
Copyright © 2010 SciRes. JSSM

Sustainable Tourism and Management for Coral Reefs: Preserving Diversity and Plurality in a Time of Climate Change
Copyright © 2010 SciRes. JSSM
256
[36] R. Chambers, “Paradigm Shifts and the Practice of Par-ticipatory Research and Development,” In: Nelson, N. and Wright, S. Eds., Power and Participatory Development: Theory and Practice, Intermediate Technology Publica-tions, London, UK, 2000, pp. 30-42.
[37] B. Cooke and U. Kothari, “Participation: The New Tyr-anny?” Zed Books, New York, 2001.
[38] M. J. C. Crabbe, “Challenges for Sustainability in Cul-tures Where Regard for the Future May not be Present,” Sustainability: Science, Practice & Policy, Vol. 2, No. 2, 2006, pp. 57-61.
[39] L. M. Carr and W. D. Heyman, “Jamaica Bound? Marine Resources and Management at a Crossroads in Antigua
and Barbuda,” Geographical Journal, Vol. 175, No. 1, 2009, pp. 17-38.
[40] P. West, “Conservation Is our Government now: The Politics of Ecology in Papua New Guinea,” Duke Univer-sity Press, Durham and London, 2006.
[41] K. V. Brondo and L. Woods, “Garifuna Land Rights and Ecotourism as Economic Development in Honduras’ Cayos Cochinos Marine Protected Area,” Ecological and Environmental Anthropology, Vol. 3, No. 1, 2007, pp. 2-18.
[42] L. MacNiece, “Collected Poems,” Faber & Faber, London, 1966.

J. Service Science & Management, 2010, 3, 257-264 doi:10.4236/jssm.2010.32032 Published Online June 2010 (http://www.SciRP.org/journal/jssm)
Copyright © 2010 SciRes. JSSM
Perceived Organizational Support, Job Satisfaction and Employee Performance: An Chinese Empirical Study
Rentao Miao1, Heung-Gil Kim2
1School of Business Administration, University of Science & Technology Liaoning, Anshan, China; 2Department of Business Ad-ministration, Gyeongsang National University, Jinju, Korea. Email: [email protected], [email protected] Received December 15th, 2009; revised February 9th, 2010; accepted March 10th, 2010.
ABSTRACT
The study investigated the generalizability of perceived organizational support and job satisfaction as positive correla-tions of employee performance in China. In a study conducted, 130 matched cases of 130 employees and their 34 im-mediate supervisors from two large-scale state-owned enterprises (SOE) were selected as participants. Well-established psychological scales measuring perceived organizational support (POS), job satisfaction, and four facets of organiza-tional citizenship behavior (OCB) were administered. Data analyzed using zero-order correlation and hierarchical regression analysis showed positive correlations of POS and job satisfaction with work performance, and also showed independent and joint positive associations of POS and job satisfaction with OCB and each of its four dimensions. Keywords: Perceived Organizational Support, Job Satisfaction, Work Performance, Organizational Citizenship Behavior,
China
1. Introduction
In recent decades, a major concern of organizational the- orists and practitioners is organizational effectiveness. Quite essential for achieving this is the willingness of employees to go beyond the formal specifications of job roles, termed extra-role behaviors [1,2]. Among these behaviors, organizational citizenship behavior is the most widely studied form [3]. It has been defined as “individ-ual behavior that is discretionary, not directly or explic-itly recognized by the formal reward system and that in aggregate promotes the effective functioning of the or-ganization” (Organ 1988, p.4). Only a few studies have examined organizational citizenship behavior in different cultural contexts [4-7]. Nonetheless, researchers have found that the motivational basis of organizational citi-zenship behavior differs in the West and China [5,7]. From a Chinese perspective, OCB is not simply a conse-quence of job satisfaction or organizational commitment [8], but rather a kind of service that is typically attributed to personal loyalty and attachment to specific others rather than as an impersonal form of commitment [4].
Because [9] suggested that China is a relational society, in that a strong relationship may be sufficient for induc-ing employee reciprocity. Personal relationships, par-ticularly between subordinates with immediate supervi-sors, therefore may play a larger role in motivating or-ganizational citizenship behavior and performance in China than they do in the West. Therefore, there is a need for providing insights on some of the predictions of ex-patriates’ work attitudes and outcomes in the Chinese context [10].
To verify the contentions of Chinese academics about Chinese workers, that low structural stability results from transitional societies and economic changes, especially the reform of state-owned enterprises, some hypotheses are drawn along the combinations of the Chinese and western literature. The purpose of this study was to ex-amine the relationships between perceived organizational supports, job satisfaction and employee performance in China. This replication was needed so that previous find-ings could be generalized beyond the United States. First, we examined the extent to which job satisfaction is asso-ciated with OCB and in-role performance. Second, we investigated the relationships between perceived organ-izational support and OCB and in-role performance.
This work was supported by the University of Science & Technology Liaoning, P. R. China.

Perceived Organizational Support, Job Satisfaction and Employee Performance: An Chinese Empirical Study 258
2. Theoretical Background
2.1 Employee Performance
Unlike many Western countries, the concept of employee performance (called Biaoxian) in the PRC goes beyond the actual work of the employees and includes many non-work related aspects. So employee performance has been classified into two dimensions [11,12], such as: work performance and OCB. Work performance is one of the most important concerns for any organization and has received much attention [13], and it is typically viewed as fundamental or in-role responsibilities that em- ployees are hired to perform in exchange for their com-pensation packages [14].
OCB is constructive behavior, not included in an em-ployee’s formal job description. Research on OCB has benefited greatly from Organ’s (1988) conceptualization of OCB as consists of five distinct factors of altruism (e.g., helping behaviors directed at specific individuals), cour-tesy (e.g., informing others to prevent the occurrence of work-related problems), sportsmanship (e.g., tolerating the inevitable inconveniences of work without com-plaining), conscien-tiousness (e.g., going beyond mini-mally required levels of attendance), and civic virtue (e.g., participating in and being concerned about the life of the company). Reference [15] first operationalized Organ’s five-dimension model of OCB. More recent conceptuali-zations of OCB offer slightly different categorizations. For example, [16] combined aspects of altruism and courtesy termed it helping. Reference [17] found support for a three-factor model of OCB. In this conceptualiza-tion, conscientiousness is removed and altruism and courtesy are combined with cheerleading to form a single helping dimension, resulting in three factors (i.e., helping behavior, civic virtue, and sportsmanship). And in a thorough review of the OCB literature and other related constructs, [12] proposed seven themes according to the type of behavior: helping behaviors, sportsmanship, or-ganizational loyalty, organizational compliance, individ-ual initiative, civic virtue, and self-development.
Reference [5] developed a version of the OCB meas-ure for the Chinese culture and translated it into the Mandarin language. The Chinese version included the dimensions of altruism, conscientiousness, and civic vir-tue, but replaced sportsmanship and courtesy with two dimensions of interpersonal harmony and protecting co- mpany resources more closely related to the Chinese culture. Reference [6] proposed a concentric model to classify OCB in China, and divided them into four do-mains based on the focus or context of action: self-con-tributions that in principle could be rendered anony-mously, privately, and purely as a matter of one’s own volition, such as self-training, taking initiative, and keep- ing the workplace clean; group-contributions that cannot be meaningfully or practically divorced from a context of
interaction with peers, such as interpersonal harmony and helping coworkers; organization-contributions that must engage some organizationally relevant attribute, such as protecting and saving company resources, voice and gro- up activity participation; and society-contributions that can be enacted only across the boundary of the organiza-tion or in its external environment with outside stake-holders, such as social welfare participation and protect-ing company image.
In the present study, we examine a wide array of ante-cedent variables for their potential effect on OCB, which is comprised of the following behaviors: (a) Helping be-haviors, (b) Courtesy, (c) Conscientiousness, and (d) Civic virtue.
2.2 Antecedents of Employee Performance
Given the interest and apparent utility to organizations regarding organizational citizenship and work perform-ance, it is useful to identify the antecedents of such per-formance. Perceptions of leader supportiveness and fol-lower job satisfaction have been found to be positively related to behavior [18].
Perceived organizational support refers to “the extent to which the organization values [employees’] contribu-tions and cares about their well-being” [19]. A supportive organization is committed to its workers [20]. According to organizational support theorists, high POS tends to improve work attitudes and engender effective work be-havior for two reasons. First, these beneficial effects re-sult from a process of social exchange. Research by [21] suggests that workers examine the discretionary actions of discretion to have done, otherwise, and then workers infer that they are being supported. They then seek to repay this favorable treatment. Like that, employees be-come more committed and harder-working [19]. In addi-tion, it seems that if an organization is given adequate training, resources, and support from management, it is more likely that members would both want their organi-zation to succeed and be more capable of helping their organization succeed. Therefore, it appears likely that the extent which the organization perceives that it is sup-ported will be positively associated with the display of OCB directed toward the organization [22,23]. Thus, we hypothesize that the extent to which an organization per-ceives that management provides it with support will affect the citizenship behaviors:
Hypothesis 1: Perceived organizational support will independently and jointly be positively associated with OCB. These include (a) helping behaviors, (b) courtesy, (c) conscientiousness, and (d) civic virtue.
An important component of this study is to examine the source of the support associated with work perform-ance. The same as mentioned above, research on social exchange theory has shown that employees who feel they receive high levels of support from their organizations
Copyright © 2010 SciRes. JSSM

Perceived Organizational Support, Job Satisfaction and Employee Performance: An Chinese Empirical Study 259
are more likely to perform better than those who do not [24]. On the other hand, [25] and [26] tested the rela-tionship between POS and work performance using structural equation modeling. In both of these studies the path coefficient from POS and work performance was not significant. However, [27] reported a modest rela-tionship between POS and work performance. We reason that the existence of collectivism in Chinese context may have a significant influence on the dynamic that links support in the workplace with performance. Because [5] suggested that collectivist cultures have stronger bonds within a larger in-group, where helping behavior occurs for the good of the group. [28] suggested that collectivist cultures would demonstrate more work behavior. Thus, we hypothesize POS will be related positively to per-formance that:
Hypothesis 2: Perceived organizational support will be positively associated with work performance.
Job satisfaction refers to an employee’s overall sense of well-being at work. It is an internal state based on as-sessing the job and job-related experiences with some degree of favor or disfavor [29]. There is substantial support for the relationship between job satisfaction and OCB. Reference [11] and [30] has argued for and pro-vided empirical evidence supporting a relationship be-tween satisfaction and OCB, as did [31]. [32] found support for the relative importance of cognitive job sat-isfaction over affective job satisfaction in predicting OCB. Reference [33] found that overall job satisfaction yielded a significant increment in the altruism dimension of OCB, but not in the compliance dimension of OCB. In a sample of human-service professionals, [34] found that job satisfaction is positively correlated with OCB to a degree that indicates a medium to strong relationship. Therefore, consistent with the results of prior research, we hypothesize that:
Hypothesis 3: Job satisfaction will independently and jointly be positively associated with OCB. These include (a) helping behaviors, (b) courtesy, (c) conscientiousness, and (d) civic virtue.
Since the 1970s job satisfaction is often conceptual-ized as a determinant of general work performance al-though the empirical relationship is of weak to moderate strength with meta-analytic estimates of the relationship ranging from 0.18 [35] to 0.30 [36]. References [13] and [29] also showed no strong relationship between these two variables. The relative weakness of this relationship may be due to the fact that much of this research has adopted an overly narrow view of work performance by focusing primarily on the task performance subset of the work performance space. Thus, the satisfaction-perfor- mance research has still failed to produce strong and unambiguous findings. This necessitates further investi-gation of relationship between these two variables. Based on the previous literature, we hypothesize that:
Hypothesis 4: Job satisfaction will be positively asso-ciated with work performance.
3. Methods
3.1 Sample
Initially, employees were systematically selected from various departments in Chinese steel corporations-An- shan Iron & Steel Corporation and Benxi Iron & Steel Corporation, and then we distributed 159 pairs of ques-tionnaires to these employees and their 34 immediate supervisors and collected, among which 29 pairs con-tained multiple missing items and were thus excluded, only 130 matched cases of supervisor-subordinate dyads (81.8%) were obtained. An average age of the partici-pants was 36.79 years (SD = 13.08); 61.8% were male and 38.2% were female. Their average of tenure in their respective departments was 9.05 years.
3.2 Procedure
We used two questionnaires: one for the subordinate em-ployees and the other for their immediate supervisors. The subordinate questionnaire measured perceived or-ganizational support, job satisfaction, along with control variables. The supervisor questionnaire assessed each subordinate’s job performance and organizational citi-zenship behavior. Questionnaires were sent to potential respondents by the company internal e-mail system with the help of our friends. We asked the respondents to send the completed questionnaires directly to the researcher by e-mail. We explained to the respondents that the identi-fication number on the survey was for data matching purpose only. Participant responses were anonymous to the researchers and responses from individual employees were kept confidential from management.
3.3 Measures
Unless otherwise noted, all of the scales described below were responded to on a five-point Likert type scale (1 = strong disagreement, 5 = strong agreement).
Control Variables. Past research has demonstrated that gender, age, and organizational tenure can influence Chi- nese employee work perceptions (POS), attitudes, and behaviors [37,38], and so I included these as controls in my analysis: gender (0 = female, 1 = male), age (four ordered categories), and tenure (years).
Perceived Organizational Support. We measured per-ceived organizational support with 4-item (Cronbach’s alpha = 0.89) taking from [19] to assess how well the organization thought that management supported it. Ex-ample items are ‘The organization does its best to take care of different needs of colleagues’, and ‘The organiza-tion appreciates the contribution of every colleague.’
Job Satisfaction. We measured job satisfaction with 5-item (α = 0.80) using the short form of [39] job satis-
Copyright © 2010 SciRes. JSSM

Perceived Organizational Support, Job Satisfaction and Employee Performance: An Chinese Empirical Study
Copyright © 2010 SciRes. JSSM
260
faction questionnaire. This scale consisted of the follow-ing facets: job interest, feedback from agents, co-workers, fair treatment, and supervision.
Employee Performance. It was operationalized as the performance of the members on their assigned tasks, and as OCB of the members’ extra-role performance.
Work Performance. We measured work performance by 3-item (α = 0.69) based on prior measures [40,41], such as ‘This employee almost always perform better than what can be characterized as acceptable performance’, and ‘This employee often perform better than what can be expected.’
OCB. We measured OCB by an adaptation of the scale developed by [11] and [6]. Four dimensions of OCB (α = 0.86) were used in the present study: 1) Helping behav-iors―discretionary behaviors that have the effect of helping a specific other person with work-related matters as well as nonwork matters, it’s broader in scope of Chi-na than its Western counter-parts (α = 0.81); 2) Cour-tesy―discretionary behaviors aimed at preventing work- related problems from occurring (α = 0.73); 3) Conscien-tiousness―discretionary behaviors on the part of the employee in the areas of attendance, obeying rules and regulations, taking breaks, and so forth (α = 0.75); and 4) Civic virtue―behavior on the part of individuals indi-cating that they responsibly participate in, are involved in, or are concerned about the life of the organization (α = 0.71). Sample items are: Helping behaviors ‘willing gives of his/her time to help others who have work-re-lated problems’; Courtesy ‘tries to avoid creating prob-lems for co-workers’; Conscientiousness ‘always punc-tual at work’; Civic virtue ‘attend formal and informal organization meetings.’
4. Results
Before testing our hypotheses, principal factor analyses were performed on the items to which the subordinates and their immediate supervisors responded. Seven factors emerged with eigenvalues greater than 1.0, explaining 64.60% of the variance.
Supervisors responded to a total 15-item measuring OCB (helping behaviors, courtesy, conscientiousness, and civic virtue) and work performance. Subordinates responded to a total 9-item measuring POS and job satisfaction.
Table 1 shows the mean, standard deviations, zero- order correlations, and reliability coefficients of the study variables. Zero-order correlations provide an initial ex-amination of the hypotheses linking POS, job satisfaction, and OCBs, work performance (Table 1). The hypothesis stating positive relationship between POS and OCB is supported (r = 0.50, p < 0.001). POS was also correlated positively with helping behaviors (r = 0.39, p < 0.001), courtesy (r = 0.30, p < 0.001), conscientiousness (r = 0.23, p < 0.01), and civic virtue (r = 0.42, p < 0.001). Positive correlation was also obtained between job satis-faction and OCB (r = 0.34, p < 0.001), helping behavior (r = 0.20, p < 0.05), courtesy (r = 0.16, p > 0.05), con-scientiousness (r = 0.31, p < 0.001), and civic virtue (r = 0.22, p < 0.05). In addition, consistent with hypothesis 2, POS also correlated positively with work performance (r = 0.20, p < 0.05), and consistent with hypothesis 4, job satisfaction correlated positively with work performance (r = 0.34, p < 0.001). It appears that POS and job satis-faction had differential effects on OCB and work per-formance.
Table 1. Mean, standard deviations and zero-order correlations
Variables Mean SD 1 2 3 4 5 6 7 8 9 10 11
1. POS 3.68 0.72 (0.89)
2. JS 4.02 0.47 0.18* (0.80)
3. OCB 3.84 0.40 0.50*** 0.34*** (0.86)
4. HB 3.99 0.56 0.39*** 0.20* 0.64*** (0.81)
5. Courtesy 3.81 0.64 0.30*** 0.16 0.68*** 0.37*** (0.73)
6. Consci 3.47 0.75 0.23** 0.31*** 0.62*** 0.43*** 0.34*** (0.75)
7. CV 4.09 0.51 0.42*** 0.22* 0.64*** 0.35*** 0.26** 0.19* (0.71)
8. WP 3.59 0.59 0.20* 0.34*** 0.28** 0.14 0.17 0.18* 0.24** (0.69)
9. Gender 1.40 0.51 -0.14 -0.13 -0.12 -0.11 0.04 -0.08 -0.18* -0.23** -
10. Age 36.79 13.08 -0.24** -0.08 -0.23** -0.14 -0.25** -0.13 -0.05 -0.16 -0.10 -
11. Tenure 9.05 3.40 -0.18* 0.18* -0.13 0.05 -0.17* -0.02 -0.20* -0.02 -0.10 0.35*** -
Notes: *P < 0.05;**P < 0.01;***P < 0.001. Cronbach’s alphas for applicable scales are shown on the diagonal. POS: perceived organizational support; JS: job satisfaction; OCB: organizational citizenship behavior; HB: helping behaviors; Consci: conscien-tiousness; CV: civic virtue; WP: work performance.

Perceived Organizational Support, Job Satisfaction and Employee Performance: An Chinese Empirical Study 261
To test the hypotheses more thoroughly, we used hier-
archical multiple regression. In step 1, we entered the demographic variables of gender, age, and tenure for control; and in step 2, we entered perceived organiza-tional support and job satisfaction. Results of the hierar-chical regressions are shown in Table 2. The control variables jointly accounted for 9% of the variance in OCB, F(4,126) = 3.13, p < 0.05, with only gender (β = –0.18, p < 0.05) and age (β = –0.23, p < 0.01) contribut-ing significantly. But the inclusion of the antecedents (POS and job satisfaction) resulted in 35% variation in OCB, F(6,124) = 11.09, p < 0.001, with only POS (β = 0.42, p < 0.001) and job satisfaction (β = 0.27, p < 0.01) contributing significantly. The inclusion of the antece-dents resulted in 26% change (∆R2) in variance in OCB. For helping behavior, the 5% variance accounted by the control variables was not significant but the inclusion of the antecedents resulted significant 19% variance, F(6,124) = 4.71, p < 0.001; only POS (β = 0.37, p < 0.001) and job satisfaction (β = 0.19, p < 0.05) contrib-uted significantly. On courtesy, the control variables ac-counted for 8% variance, F(4,126) = 2.77, p < 0.05; with only age (β = –0.22, p < 0.05) contributing significantly. The inclusion of the antecedents yielded 15% variation (∆R2 = 7%), F(6,124) = 3.67, p < 0.01, with only POS (β = 0.23, p < 0.01) contributing significantly. For consci-entiousness, the 4% variance accounted by the control variables was not significant but the inclusion of the an-tecedents resulted significant 15% variance, F(6,124) = 3.71, p < 0.01; only POS (β = 0.18, p < 0.05) and job
satisfaction (β = 0.27, p < 0.01) contributed significantly. Finally, the inclusion of the control variables in the re-gression on civic virtue yielded 8% variance, F(4,126) = 2.86, p < 0.05; with only gender (β = –0.19, p < 0.05) and tenure (β = –0.22, p < 0.05) contributing signifi-cantly. The inclusion of the antecedents yielded 26% variance (∆R2 = 18%), F(6,124) = 7.31, p < 0.001, with only POS (β = 0.36, p < 0.001) and job satisfaction (β = 0.21, p < 0.05) contributing significantly. The joint asso-ciation of POS with OCB and its dimensions were corre-lated significantly. Thus, Hypotheses 1(a), 1(b), 1(c) and 1(d) were supported. Hypotheses 1 was supported. How- ever, despite no relationship between job satisfaction and courtesy, the joint association of job satisfaction with OCB was correlated significantly. Thus, Hypotheses 3(a), 3(c) and 3(d) were supported, while 3(b) was not. Hy-potheses 3 was partial supported.
The control variables accounted for 8% of the variance in work performance, F(4,126) = 2.83, p < 0.05, with only gender (β = –0.23, p < 0.01) and age (β = –0.19, p < 0.05) contributing significantly. But the inclusion of the antecedents (POS and job satisfaction) resulted in 19% variation in work performance, F(6,124) = 4.70, p < 0.01, with only POS (β = 0.18, p < 0.05), job satisfaction (β = 0.31, p < 0.001) and gender (β = –0.19, p < 0.05) con-tributing significantly. The inclusion of the antecedents resulted in 11% change (∆R2) in variance in work per-formance. The associations of POS and job satisfaction with work performance were correlated significantly. Thus, Hypotheses 2 and 4 were supported.
Table 2. Hierarchical regression analysis predicting the effectss of POS and job satisfaction on employee performance
Helping behaviors Courtesy Conscientiousness Civic virtue OCB Workperformance
Variables M 1 M 2 M 1 M 2 M 1 M 2 M 1 M 2 M 1 M 2 M 1 M 2
β β β β β β β β β β β β
1.Controls
Gender -0.14 -0.07 -0.07 -0.02 -0.08 -0.03 -0.19* -0.11 -0.18* -0.08 -0.23** -0.19*
Age -0.19* -0.10 -0.22* -0.15 -0.15 -0.07 0.01 0.12 -0.23** -0.09 -0.19* -0.12
Tenure 0.09 0.12 -0.11 -0.11 0.01 -0.03 -0.22* -0.22* -0.08 -0.09 0.01 -0.09
2.Antece-dent
POS 0.37*** 0.23** 0.18* 0.36*** 0.42*** 0.18*
JS 0.19* 0.12 0.27** 0.21* 0.27** 0.31***
R2 0.05 0.19*** 0.08* 0.15** 0.04 0.15** 0.08* 0.26*** 0.09* 0.35*** 0.08* 0.19**
Adj-R2 0.02 0.15*** 0.05* 0.11** 0.01 0.11** 0.05* 0.23*** 0.06* 0.32*** 0.05* 0.15**
F 1.67 4.71*** 2.77* 3.67** 1.40 3.71** 2.86* 7.31*** 3.13* 11.09*** 2.83* 4.70**
∆R2 0.14*** 0.07** 0.11** 0.18*** 0.26*** 0.11**
df 4/126 6/124 4/126 6/124 4/126 6/124 4/126 6/124 4/126 6/124 4/126 4/124
Notes: *P < 0.05;**P < 0.01;***P < 0.001. POS: perceived organizational support; JS: job satisfaction; OCB: organizational citizenship behavior.
Copyright © 2010 SciRes. JSSM

Perceived Organizational Support, Job Satisfaction and Employee Performance: An Chinese Empirical Study 262
5. Discussion
Factor analysis supported the existence of four separate factors representing the POS, job satisfaction, OCB, and work performance. Among them employee performance consist of OCB (extra-role behaviors) and work per-formance (in-role behaviors) in this study. Prior studies [22,23] and [25,26] suggested the relationships between POS and OCB, POS and work performance are signifi-cant respectively. And prior studies [11,30] and [35,36] found job satisfaction has significant effect on OCB and work performance respectively. According to the princi-ple of compatibility, we expect that, for Chinese workers, perceived organizational support relates to organizational citizenship behavior and work performance (Hypothesis 1, 2). Furthermore, job satisfaction also relates to organ-izational citizenship behavior and work performance (Hypothesis 3, 4).
Interestingly, this principle generalizes to the effects of both perceived organizational support and job satisfac-tion. That is to say, findings from the present study sup-port existing findings in the Western literature that OCBs and work performance increase with more favorable perception of organizational support and job satisfaction. The Chinese respond to job satisfaction in a manner sim-ilar to Westerners. There is no difference about the ef-fects of job satisfaction on performance between Chinese and Westerners. That is to say, they become more com-mitted to the organization and hard-working. However, they respond to organizational support more strongly than do Westerners, with greater citizenship behavior and work performance. It is different from prior western stud-ies [25-27] report mixed findings with regards to the re-lationship between POS and work performance. The im-portance of personal relationship (called Guanxi) in Chi-nese business dealings has been well documented [42,43]. The salience of interpersonal relationship in Chinese daily life suggests POS in Chinese cultural context improve work performance more strongly than do in Western con- text. This study offers additional insight into the sup-port-performance relationship in China.
Both organizational citizenship behavior and work performance can be construed as a form of reciprocity to a specific person. By the empathy concern behavior hy-pothesis an employee who perceives favorable organiza-tional support and job satisfaction at workplace, shows empathic concern for the organization by engaging in citizenship behaviors. The norm of reciprocity also posits that people who give should be paid back. Employees evaluate their work situations by cognitively in return. Thus, employees empathize and reciprocate organiza-tional support and job satisfaction with work behaviors (extra-role behaviors and in-role behaviors). This is be-cause study [44] suggested that people are most satisfied with a relationship when the ratio between benefits and
contributions is similar for both partners; and also studies [45,46] showed that OCB is positively related to work performance. Worker’s relationship with a supervisor takes on paramount importance to Chinese employees and is an essential component of Chinese social structure. The relationship with one’s supervisor, therefore, may anchor the relationship with the organization and one’s willing-ness to contribute to it.
In addition, interestingly, an important finding from the present study is contrary to the existing findings in the Western literature that the satisfaction-work perfor mance relationship does significantly exceed the satisfac-tion-OCB relationship [47]. In other words, Chinese em-ployees with more job satisfaction may promote employ-ees to show more citizenship behaviors, while more job satisfaction can not improve job performance relatively.
The findings reported may have some interesting im-plications for managers. First, organizational support is important for enhancing employee performance, making employees’ perceptions of organizational support an area that managers cannot ignore. For the Chinese workforce to drive towards employee performance, management of organizations need to enhance organizational support by implementing organization policies, attitudes, procedures, and decisions that support and value employees’ contri-butions, and cares about their well-being. In addition, job satisfaction can also enhance employee performance. So how to make employees to satisfy their work lives? By aiming at improving employee job satisfaction thus ma- nagers need to simultaneously address as many of di-verse variables (e.g., provide employee well-deserved gains, resolve their concerns, job enrichment and reduc-tion in workplace discrimination) as possible in order to ensure performance.
5.1 Limitations
Limitations to this study include it cross-sectional design that precludes us from drawing conclusions concerning the causal relationships among the study variables. In addition, the sample was small, compared to other stud-ies on citizenship behavior; thus our power for detecting between several relationships effects was relatively low. Finally, our sample was limited to the heavy industry of two large-scale state-owned enterprises which may limit the generalizability of the results.
5.2 Future Research
Under circumstances of China’s transformation, Chinese workers appear to be increasingly attracted to joining foreign rather than SOE. Therefore, we must raise the question of how workers in SOE conglomerates compare with workers in foreign firms. Future research should examine the foreign-invested enterprises and sino-foreign joint ventures with the reform and modernization. On the other hand, it would be of value to examine further vari-
Copyright © 2010 SciRes. JSSM

Perceived Organizational Support, Job Satisfaction and Employee Performance: An Chinese Empirical Study 263
ables (e.g., organizational justice, commitment, interper-sonal trust, and psychological contract) of antecedents, broaden the domain of outcomes to include more objec-tive data.
REFERENCES [1] D. W. Organ, “The Motivational Basis of Organziational
Citizenship Behavior,” JAI Press, Greenwich, CT, 1990.
[2] B. J. Tepper, D. Lockhart and J. Hoobler, “Justice, Citizenship, and Role Definition Effects,” Journal of Applied Psychology, Vol. 86, No. 4, 2001, pp. 789-796.
[3] V. Dyne, L. L. Cummings and J. M. Parks, “Extra-Role Behaviors: In Pursuit of a Construct and Definitional Clarity (a Bridge over Mudded Waters),” JAI Press, Greenwich, CT, 1995.
[4] Z. X. Chen, A. S. Tsui and J. L. Farh, “Loyalty to Supervisor Versus Organizational Commitment: Relati- onships to Employee Performance in China,” Journal of Occupational Organization, Vol. 75, 2002, pp. 339-356.
[5] J. L. Farh, S. C. Earley and S. C. Lin, “Impetus for Action: A Cultural Analysis of Justice and Organizational Citi- zenship Behavior in Chinese Society,” Administrative Science Quarterly, Vol. 42, No. 3, 1997, pp. 421-444.
[6] J. L. Farh, C. B. Zhong and D. W. Organ, “Organi- zational Citizenship Behavior in the People’s Republic of China,” Organization Science, Vol. 15, No. 2, 2004, pp. 241-253.
[7] C. Hui, K. S. Law and Z. X. Chen, “A Structural Equa- tion Model of the Effects of Negative Affectivity, Leader- Member Exchange, and Perceived Job Mobility on In- Role and Extra-Role Performance: A Chinese Case,” Organizational Behavior and Human Decision Processes, Vol. 77, No. 1, 1999, pp. 3-21.
[8] D. W. Organ and K. Ryan, “A Meta-Analytic Review of Attitudinal and Dispositional Predictors of Organizational Citizenship Behavior,” Personnel Psychology, Vol. 48, No. 4, 1995, pp. 775-802.
[9] C. Hui, C. Lee and D. M. Rousseau, “Employment Rela- tionships in China: Do Workers Relate to the Organi- zation or the People?” Organization Science, Vol. 15, No. 2, 2004, pp. 232-240.
[10] Y. W. Liu, “Perceived Organizational Support and Expa- triate Organizational Citizenship Behavior,” Personnel Review, Vol. 38, No. 3, 2009, pp. 307-319.
[11] D. W. Organ, “Organizational Citizenship Behavior: The Good Soldier Syndrome,” Lexington Books, Lexington, MA, 1988.
[12] P. M. Podsakoff, S. B. MacKenzie, J. B. Paine and D. G. Bachrach, “Organizational Citizenship Behaviors: A Critical Review of the Theoretical and Empirical Lite- rature and Suggestions for Future Research,” Journal of Management, Vol. 26, No. 3, 2000, pp. 513-563.
[13] S. P. Brown and R. A. Peterson, “Antecedents and Consequences of Salesperson Job Satisfaction: A Meta- analysis and Assessment of Causal Effects,” Journal of Marketing, Vol. 30, No. 1, 1993, pp. 63-77.
[14] D. M. Rousseau and J. McLean Parks, “The Contracts of Individuals and Organizations (Research in Organiza- tional Behavior,” JAI Press, Greenwich, CT, 1993.
[15] P. M. Podsakoff, S. B. macKenzie, R. H. Moorman and R. Fetter, “Transformational Leader Behaviors and their Effects on Followers’ Trust in Leader, Satisfaction, and Organizational Citizenship Behaviors,” Leadership Quar- terly, Vol. 1, No. 2, 1990, pp. 107-142.
[16] P. M. Podsakoff and S. B. MacKenzie, “Organizational Citizenship Behaviors and Sales Unit Effectiveness,” Jou- rnal of Marketing Research, Vol. 31, No. 3, 1994, pp. 351-363.
[17] P. M. Podsakoff, M. Ahearne and S. B. MacKenzie, “Organizational Citizenship Behavior and the Quantity and Quality of Work Group Performance,” Journal of Applied Psychology, Vol. 82, No. 2, 1997, pp. 262-270.
[18] C. A. Smith, D. W. Organ and J. P. Near, “Organ- izational Citizenship Behavior: its Nature and Ante- cedents,” Journal of Applied Psychology, Vol. 68, No. 4, 1983, pp. 653-663.
[19] R. Eisenberger, R. Huntington, S. Hutchison and D. Sowa, “Perceived Organizational Support,” Journal of Applied Psychology, Vol. 71, No. 3, 1986, pp. 500-507.
[20] R. M. Malatesta and L. E. Tetrick, “Understanding the Dynamics of Organizational and Supervisory Commitm- ent,” Presented at the Annual Meeting of the Society for Industrial and Organizational Society, San Diego, CA, 1996.
[21] R. Eisenberger, J. Cummings, S. Armeli and P. Lynch, “Perceived Organizational Support, Discretionary Treat- ment, and Job Satisfaction,” Journal of Applied Psy- chology, Vol. 82, No. 5, 1997, pp. 812-820.
[22] R. Eisenberger, S. Armeli, B. Rexwinkel, P. D. Lynch and L. Rhoades, “Reciprocation of Perceived Organiza- tional Support,” Journal of Applied Psychology, Vol. 86, No. 1, 2001, pp. 42-51.
[23] S. J. Wayne, L. M. Shore, W. H. Bommer and L. E. Tetrick, “The Role of Fair Treatment and Rewards in Perceptions of Organizational Support Member Exchange,” Journal of Applied Psychology, Vol. 87, No. 3, 2002, pp. 590-598.
[24] R. Eisenberger, P. Fasolo and V. Davis-LaMastro, “Per- ceived Organizational Support and Employee Diligence, Commitment, and Innovation,” Journal of Applied Psych- ology, Vol. 75, No. 1, 1990, pp. 51-59.
[25] R. P. Settoon, N. Bennett and R. C. Liden, “Social Exchange in Organizations: Perceived Organizational Support, Leader-Member Exchange, and Employee Reci- procity,” Journal of Applied Psychology, Vol. 81, No. 3, 1996, pp. 219-227.
[26] S. J. Wayne, L. M. Shore and R. C. Liden, “Perceived Organizational Support and Leader-Member Exchange: A Social Exchange Perspective,” Academy of Management Journal, Vol. 40, No. 1, 1997, pp. 82-111.
[27] Z. S. Byrne and W. A. Hochwarter, “Perceived Organi- zational Support and Performance: Relationships across Levels of Organizational Cynicism,” Journal of Mana-
Copyright © 2010 SciRes. JSSM

Perceived Organizational Support, Job Satisfaction and Employee Performance: An Chinese Empirical Study
Copyright © 2010 SciRes. JSSM
264
gerial Psychology, Vol. 23, No. 1, 2008, pp. 54-72.
[28] J. B. Paine and D. W. Organ, “The Cultural Matrix of Organizational Citizenship Behavior: Some Preliminary Conceptual and Empirical Observations,” Human Re- source Management Review, Vol. 10, No. 1, 2000, pp. 45-59.
[29] E. A. Locke, “The Nature and Cause of Job Satisfaction,” Rand McNally, Chicago, IL, 1976.
[30] D. W. Organ and M. Konovsky, “Cognitive Versus Affe- ctive Determinants of Organizational Citizenship Behavi- or,” Journal of Applied Psychology, Vol. 74, No. 1, 1989, pp. 157-164.
[31] L. J. Williams and S. E. Anderson, “Job Satisfaction and Organizational Commitment as Predictors of Organizatio- nal Citizenship and In-Role Behaviors,” Journal of Mana- gement, Vol. 17, No. 3, 1991, pp. 601-617.
[32] R. H. Moorman, “The Influence of Cognitive and Affective Based Job Satisfaction on the Relationship between Satis- faction and Organization Citizenship Behavior,” Human Relations, Vol. 46, No. 6, 1993, pp. 759-776.
[33] D. W. Organ and A. Lingl, “Personality, Satisfaction, and Organizational Citizenship Behavior,” Journal of Social Psychology, Vol. 135, No. 3, 1995, pp. 339-350.
[34] G. Murphy, J. Athanasou and N. King, “Job Satisfaction and Organizational Citizenship Behavior: A Study of Australian Human-Service Professionals,” Jounal of Mana- gerial Psychology, Vol. 17, No. 4, 2002, pp. 287-297.
[35] M. T. Iaffaldano and P. M. Muchinsky, “Job Satisfaction and Job Performance: A Meta-Analysis,” Psychological Bulletin, Vol. 97, No. 2, 1985, pp. 251-273.
[36] T. A. Judge, C. J. Thoresen, J. E. Bono and G. K. Patton, “The Job Satisfaction-Job Performance Relationship: A Qualitative and Quantitative Review,” Psychological Bulletin, Vol. 127, No. 3, 2001, pp. 376-407.
[37] C. H. Hui and C. K. Tan, “Employee Motivation and Attitudes in the Chinese Workforce,”. In: M. H. Bond Ed., Handbook of Chinese psychology, Oxford University Press, New York, 1996, pp. 364-378.
[38] E. W. Morrison, “Role Definitions and Organizational
Citizenship Behavior: The Importance of Employee’s Perspective,” Academy of Management, Vol. 37, No. 6, 1994, pp. 1543-1567.
[39] E. S. Mason, “Gender Differences in Job Satisfaction,” Journal of Social Psychology, Vol. 135, No. 2, 1995, pp. 143-151.
[40] J. Brockner, T. R. Tyler and R. Cooper-Schneider, “The Influence of Prior Commitment to an Institution on Reac- tions to Perceived Fairness: The Higher they Are, the Harder they Fall,” Administrative Science Quarterly, Vol. 37, No. 2, 1992, pp. 241-261.
[41] T. Y. May, M. Korczynski and S. J. Frenkel, “Organ- izational and Occupational Commitment: Knowledge Workers in Large Corporations,” Journal of Management Studies, Vol. 39, No. 6, 2002, pp. 775-801.
[42] J. L. Farh, A. S. Tsui, K. Xin and B. S. Cheng, “The Influene of Relational Demography and Guanxi: The Chi- nese Case,” Organization Science, Vol. 9, No. 4, 1998, pp. 471-488.
[43] A. S. Tsui and J. L. Farh, “Where Guanxi Matters: Relational Demography and Guanxi in the Chinese Context,” Work and Occupations, Vol. 24, No. 1, 1997, pp. 56-79.
[44] C. L. Haworth and P. E. Levy, “The Importance of Instrumentality Beliefs in the Prediction of Organi- zational Citizenship Behaviors,” Journal of Vocational Behavior, Vol. 59, No. 1, 2001, pp. 64-75.
[45] D. J. Koys, “The Effects of Employee Satisfaction, Organizational Citizenship Behavior, and Turnover on Organizational Effectiveness: A Unit-Level, Longitudinal Study,” Personnel Psychology, Vol. 54, 2001, pp. 101-114.
[46] H. R. Yen and B. P. Niehoff, “Relationship between Organizational Citizenship Behaviors, Efficiency, and Customer Service Perceptions in Taiwanese Banks,” Journal of Applied Social Psychology, Vol. 34, No. 8, 2002, pp. 1617-1637.
[47] J. A. LePine, A. Erez and D. E. Johnson, “The Nature and Dimensionality of Organizational Citizenship Behavior: A Critical Review and Meta-Analysis,” Journal of Ap-plied Psychology, Vol. 87, No. 1, 2002, pp. 52-65.

J. Service Science & Management, 2010, 3, 265-271 doi:10.4236/jssm.2010.32033 Published Online June 2010 (http://www.SciRP.org/journal/jssm)
Copyright © 2010 SciRes. JSSM
Exploring the Nature of Information Systems Development Methodology: A Synthesized View Based on a Literature Review
Daniela Mihailescu1, Marius Mihailescu2
1Jönköping International Business School, Jönköping, Sweden; 2School of Economics and Management, Lund University, Lund, Sweden. Email: {daniela.mihailescu, marius.mihailescu}@ihh.hj.se Received July 18th, 2009; revised February 25th, 2010; accepted April 16th, 2010.
ABSTRACT
New Information Systems Development Methodologies (ISDMs) are suggested in the belief that their deployment would be beneficial to consultants in their work. A large number of ISDMs already exist but their value has been questioned and at the same time new methodologies continue to be introduced in an attempt to support and improve the practice of information systems development work. What is not always clear from current studies is that ISDM is a multi-perspec-tive and cross-discipline phenomenon. Although a large amount of knowledge of ISDM is available, different discipli-nary interests have resulted in fragmented assessments of it. This paper intends to identify theoretical perspectives ap-plied in the conceptualization of ISDM. A review of the literature on ISDM was conducted and four different theoretical perspectives were identified: 1) system, 2) structure, 3) innovation, and 4) knowledge. While each perspective provides various overarching depictions of ISDM, the synthesized view of ISDM provided in this study reveals the complexities and ambiguities of a multifaceted phenomenon such as ISDM. Suggestions for an alternative conceptualization of ISDM are provided in an attempt to facilitate the investigation of ISDM. Keywords: Information Systems Development Methodology, CASE Tools, Software Process Innovation, Literature Review
1. Introduction
In response to the pressure for more efficiency and effec-tiveness as well as flexibility and quality in Information Systems Development (ISD), new development models and methods, such as rapid product development, agile software development, and component-based develop-ment, have been suggested and are considered to be beneficial to consultants in their work. Yet, the quality of IS continues to be problematic, resulting in various out-comes and, once again, calling into question the value of the new information Systems Development Methodolo-gies (ISDM). What is not always clear from current IS studies is the fact that ISDM represents a multi-perspec-tive and cross-level phenomenon of study. In line with other authors [1,2], it is these authors’ contention as well that ISDM have a central role in implementing or de-signing IS and educating tomorrow’s professionals. At the same time, the opinion of these authors is that exist-ing descriptive and fragmented approaches to studying ISDM provide contradictory results, on the one hand reducing the likelihood of understanding and hence of
supporting the design of constantly evolving systems, on the other hand limiting the relevance and value of our theories and educational programs.
2. Challenging Issues Related to ISDM
The history of ISDM goes back to the 1960s and to the use of computers by businesses and the emergence of business applications, which represented a novel area of interest registering a rapid expansion [3]. Since then, the study of ISDM has attracted researchers across a range of research fields offering a rich set of descriptions and ex-planations of the ISDM phenomenon. Considerable at-tention from practitioners and several research streams has contributed to an impressive knowledge base for ef-ficient and effective ways of developing information systems (IS) which over the years have been formalized and incorporated in a vast number of generic ISDM. De-spite divergent opinions regarding the terminology and related semantic aspects, ISDM is considered to repre-sent a collection of interrelated components aimed to support and improve the ISD practice [4,5]. In spite of these efforts, the ISD continues to be problematic and

Exploring the Nature of Information Systems Development Methodology: 266 A Synthesized View Based on a Literature Review
hence the significance of the methodological assump-tions and, implicitly, ISDM is questioned as well.
The understanding of ISDM and its value has changed over the years from being a panacea for ISD, if used in a prescriptive and consistent way, to being a necessary but insufficient means in the development of IS [6,7]. More-over, some of them are considered unsuitable for analyz-ing, designing and managing unpredictable situations characterized by complexity and uncertainty [8,9]. Addi-tionally, ISDMs are often considered unsuitable for some individuals and settings, and similar ISDMs in similar settings apparently yield distinctly different results [3,9]. While some authors are critical to the exaggerated em-phasis placed on ISDM and suggest the introduction of improvisation [10] or amethodical thinking [9], others offer a word of warning against returning to an era char-acterized by an ad-hoc, trial-and-error, and person-de- pendent ISD [11].
This body of literature provides a rich description of the challenging issues related to ISDM and, in spite of potential value, apparently the lack of it. In addition, al-though a sizable body of literature in the IS field that addresses various ISDM issues, the conceptualization and assessment of ISDM appears to be fragmented re-flecting different disciplinary interests and perspectives. The purpose of this paper is to identify theoretical per-spectives applied in the conceptualization of ISDM and to present a synthesized view of ISDM that reveals the complexities and ambiguities of a multifaceted phe-nomenon such as ISDM. The method for selecting and categorizing the literature is briefly described in the fol-lowing section.
3. Method
We took ISDM as unit of analysis and used Google Scholar beta to search through web databases by com-bining following terms: systems development method or methodology, CASE tools and software process innova-tion. A type of snowball sampling technique was used as a next step in the data collection process in order to iden-tify additional studies by consulting the references listed by the collected studies. Our exploratory search resulted into a collection of 547 sources. From the sizable and heterogeneous body of literature on ISDM we retained the studies that stated a theoretical perspective or pre-sented a definition of ISDM. The remaining papers were analyzed and categorized based on the theoretical per-spective on ISDM applied in the study. From the entire set of articles we identified four different theoretical perspectives on ISDM: 1) system, 2) structure, 3) inno-vation, and 3) knowledge. Since the conceptualization of ISDM was depicted differently within each perspective, we analyzed each conceptualization with regard to its scope in terms of content and features, and focus. The
next section presents the results of our literature review.
4. Theoretical Perspectives on ISDM
One of the conceptualizations of ISDM follows from General System Theory [12], which helps to conceptual-ize and explain complex and abstract concepts by con-ceiving them as systems. A system is regarded as a col-lection of complementary and interacting components characterized by properties, capabilities, behavior and a boundary which separates it from its environment, de-signed to provide particular functionalities.
4.1 ISDM as System
The interpretation of ISDM as a system has been used by several authors. For instance an interpretation of Systems Methodology (SM) is epitomized as a:
“meta-system in its own right, incorporating skilled people, organization, tools, methods, techniques, etc. The SM is for individuals, teams and teams of teams, and can address problems from the small to the global, from the technological to the social and international.” [5]
This starting point emphasizes the importance of un-derstanding ISDM as an indivisible whole consisting of interacting but different types of components or subsys-tems. In the realm of engineering research the efforts have been directed toward providing procedural guidance and ISDM components like methods, techniques, and tools, in order to ensure efficiency and to:
transform the software development from an ad hoc craft activity into a controlled and consis-tent production process [13]
reduce software complexity, improve compre-hensibility, promote reuse, and facilitate evolu-tion [14]
Rather than considering human and societal compo-nents, the focus of the engineering view is on the devel-opment of generic artifacts. The field of method engi-neering has particularly focused on the development and composition of meta-methods [15].
In the area of IS the efforts have been concentrated on the interaction between artifacts and human and social components, as well as their properties. One field of re-search which has focused on both development and use of ISDM, or parts of it, by individual developers or groups of stakeholders, is the field of ISD research. An alternative way to define ISDM is as:
“an organized collection of concepts, methods (or techniques), beliefs, values, and normative principles supported by material resources … and a codified set of goal-oriented ‘procedures’ which are intended to guide the work and cooperation of the various parties (stake-holders) involved in the building of an information sys-tems application.” [4]
Copyright © 2010 SciRes. JSSM

Exploring the Nature of Information Systems Development Methodology: 267A Synthesized View Based on a Literature Review
Despite ongoing issues and diverse interpretations, ISDM seems to include a collection of interrelated com-ponents such as
Paradigms―a fundamental set of assumptions about knowledge, how to acquire it and about the physical and social world, that provide a way of thinking adopted by a professional community and allow its members to share similar perceptions and engage in commonly shared practices [11,16]
Approaches―a set of goals, fundamental con-cepts and principles describing desirable fea-tures of a product and the development process model which represents the sequences of stages through which a system evolves. They influ-ence the interpretations and actions in systems development and related methods, techniques, and tools [17]
Methods―defines the tasks and activities to perform at least one complete phase of systems development being based typically on a par-ticular approach and associated with a set of techniques, tools, and documentation [17,18]
Techniques―procedure with a prescribed nota-tion to perform and guide a development activ-ity or a well-defined sequence of elementary operations that more or less guarantee the achievements of certain outcomes if executed correctly [15,17]
Development tools―embody a particular me- thodology [19] and provide support in ISD processes [15,20], enforcing a particular set of steps and restricting developers’ choices [19]
This perspective provides a description of the structure of ISDM and reveals the relation among ISDM compo-nents and its role, i.e., to support potential stakeholders in achieving their purposes, e.g., to develop an IS, to man-age the development, or solve a problem. Alternative conceptualizations of ISDM have been suggested by ap-plying or integrating various theories including structura-tion [21,22], innovation diffusion and adoption [23,24], knowledge diffusion and assimilation [18,25,26], and learning [3,8,27].
4.2 ISDM as Structure
ISDM is framed as a structure by Orlikowski [21,22], who argues that technology in general and ISDM in par-ticular represent “a kind of structural properties of or-ganizations developing and/or using technology. That is, technology embodies and hence is an instantiation of some of the rules and resources constituting the structure of an organization” [21]. Although the characteristics of ISDM are not explicitly discussed by the author, she makes a distinction between ISDM and CASE tools
categorizing the first as a radical innovation and the latter as an incremental innovation. Hence, the implementation of an ISDM is considered to result in a radical change or reorientation of the organization, while the implementa-tion of one of its components, e.g., the CASE tool com-ponent, is considered to result in an incremental change or variation. A product or process reorientation implies radical changes and might lead to resistance or even re-jection [22].
Based on ISD empirical literature, is suggested that structures like ISDM might be invoked in the ISD con-text by stakeholders in learning or knowledge acquisition, conflict, negotiation, communication, influence, control, coordination, and persuasion. Although the structuration perspective does not insist on the content or properties of ISDM like the previous strand of research, it provides the view of ISDM as a means of change. [19]
4.3 ISDM as Innovation
Based on IS implementation model [28], which inte-grates IS implementation research and Diffusion of In-novation theory (DOI) [29], Huisman and Iivari found that along with other individaual, organizational, task, and environmental factors, the characteristics of ISDM perceived by systems developers to influence deploy-ment of ISDM are:
relative advantage―the degree to which an innovation is perceived as better than the idea it supersedes
compatibility―the degree to which an innova-tion is perceived as consistent with existing values, past experience and needs of potential adopters
trialability―the degree to which an innovation may be experimented with on a limited basis [24]
In a similar vein, but by combining DOI and Technol-ogy Acceptance Model, it is founded that, besides social pressure and organizational mandate, the characteristics of ISDM in terms of usefulness and compatibility are significant predictors for software developers’ intention to use ISDM [23]. As showed by Venkatesh et al., who reviewed the user acceptance literature and formulated a Unified Theory of Acceptance and Use of Technology, the two constructs relative advantage and usefulness are similar and highlight individuals’ performance expec-tancy [30]. In other words, at an individual unit of adop-tion, ISDM is perceived as a potential means, which, if used, enables gains in job performance. Moreover, the deployment of ISDM is perceived to improve communi-cation and the career of individual developers [31]. The other two characteristics of ISDM, compatibility and trialability, are perceived to remove barriers and are therefore considered significant to facilitate intention
Copyright © 2010 SciRes. JSSM

Exploring the Nature of Information Systems Development Methodology: 268 A Synthesized View Based on a Literature Review
formation and use. An emphasis on individual developer perceptions is
considered to be suitable to inform suppliers and manag-ers about developers’ beliefs about ISDM [23]. Yet, it is also considered too narrow to be of much use for organi-zations which adopt ISDM, because of its broadcaster- receiver perspective on communication, which under- emphasizes the challenges and the role of adopters [32]. Therefore, researchers drawing on a knowledge dif- fu-sion perspective have centered their attention on analyz-ing the barriers that can impede the transfer or the inte-gration of knowledge within or across organizations and communities.
4.4 ISDM as Knowledge
Drawing on a knowledge diffusion perspective, ISDM has been conceptualized as a source of knowledge which embodies “best practice” in ISD within an organization or IS community [2,18]. Accordingly, ISDM is regarded as an object that can be transferred through some form of communication from a supplier side [18], and assimilated through learning on the adopter side [25]. While these sides have two distinct roles in relation to the ISDM, in both cases the aim of the ISDM is to support or change the knowledge base and hence the practice within an or-ganization or IS community. Based on a knowledge transfer perspective, it is argued that an external ISDM has to be adapted and incorporated into the specific knowledge base of an organization, forming in this way a new and organization-specific knowledge which repre-sents an important core capability of a software devel-opment organization [1]. Focusing on the assimilation of software process innovations, which represent a class of complex innovation technologies, it is claimed that in-novations of this type produce significant changes to a group’s process for developing software applications. [33] Additionally, such innovations have the potential to in-crease returns on adoption having a high network poten-tial but, when first introduced, generate high knowledge barriers and low performance relative to current best practices. According to the author, software process in-novations impose a substantial knowledge burden on adopters impeding their deployment due to characteris-tics such as being:
abstract―have an abstract and demanding sci-entific base, are eventually not physically ob-servable, are more difficult to explain requiring a more active and prolonged learning period on the part of adopters in order to grasp and de-ploy them
fragile―in the sense that they do not always operate as expected, have core features that must be replicated exactly to get expected re-sults, create uncertainty for users, and require
more resources and “hand holding” during de-ployment; performance in the laboratory repre-sents a poor predictor of performance in prac-tice
trialable―are difficult to trial in a meaningful way, are difficult to introduce and install in stages, and in order to obtain benefits require that organizations compress all learning about them into a pre-implementation phase
unpackaged―in the sense that adopters cannot treat the technology as a “black box”, but must acquire broad tacit knowledge and procedural know-how to use it effectively, since the sub-components of a technology cannot be tightly bundled into a turnkey product that can be in-troduced into organizations unchanged; users are confronted with learning the operational details of all components and their potential in-teraction
Regarded from a short-time perspective, it seems that ISDM creates problems for potential adopters who, as suggested by Beynon-Davies and Williams, need to un-bundle the simplified and “black-boxed” solutions pro-vided by the supply side, and integrate them with locally situated knowledge [18]. ISDM is considered as abstract, simplified knowledge detached from practice [3,8]. Ac-cording to the authors, ISDM represents a means of for-malization and an instrument that can be used by indi-viduals for setting goals and making decisions [8], a means of transferring knowledge between experienced and novice developers, and templates to guide the de-velopment practice of new recruits [3]. The authors sug-gest that formalized ISDMs are rarely applied in their entirety and exactly as originally intended, but are uni- quely enacted by developers in work practice, i.e., they are adapted or tailored differently in any development project.
ISDM has also been interpreted from a learning per-spective [27]. Yet, according to the authors, ISDM is not a holder of knowledge but an evolving artifact which becomes understandable and meaningful as it is used. Accordingly, ISDM has been interpreted as a boundary object needed to mediate knowledge communication within as well as between communities [27]. The sig-nificant features of a boundary object, and hence of ISDM, that facilitate communication, coordination and collaboration are, according to Wenger:
modularity―the object represents a combina-tion of interrelated components which can be attended by the users
abstraction―the object provides a common ground simultaneously allowing features spe-cific to each user perspective
adaptation―the product lends itself to different
Copyright © 2010 SciRes. JSSM

Exploring the Nature of Information Systems Development Methodology: 269A Synthesized View Based on a Literature Review
activities standardization―the resources in the product
are formalized indicating how to be used in a particular context [34]
From this perspective, ISDM is not simply acquired but must be created and communicated through the in-teraction of members of a group who try to solve a par-ticular work problem in practice [27]. Since ISDM repre-sents the outcome of knowledge creation and learning, which are situated, the perception of, and interest in ISDM will therefore differ with regard to the position of the participants. This position is different from the one provided by the knowledge diffusion perspective, ac-cording to which the relationship between participants is based on a notion of control and formalization which provides a way of exchanging information, i.e., the ISDM is created by a supplier and communicated to po-tential adopters. Underpinned by a learning perspective, the studies frame ISDM as reminder that trigger knowl-edge and as guides to interpretation and action in IS de-velopment projects, thus representing a means of com-munication, coordination, control, and production.
Each perspective on ISDM identified in this literature review provides a different view on ISDM and its poten-tial roles in different contexts. Table 1 summarizes the
Table 1.
Conception Scope: contents
(1) & features (2) Focus Sources
System
1) paradigm, approach, methods, techniques, tools 2) generic, formalized, structured, reusable
Development and deployment of ISDM components in ISD projects
[4,5,11,15, 16,20,35,36]
Structure 1) methodology and CASE tools 2) –
Deployment of ISDM within organization
[19,21,22]
Innovation
1) – 2) relative advantage, com-patibility and trialability
Individuals’ deployment of ISDM
[23,24,31]
Knowledge
1) – 2) abstract, fragile, trialable, unpackaged; modularity, abstraction, adaptation, standardization
Deployment of ISDM between individuals as well as within or between collectives (e.g., groups, organizations, communities)
[1,2,8,18, 25-27]
four theoretical perspectives applied in the conceptuali-zation of ISDM along with their scope and focus and, due to space constraints, a limited example of sources.
5. Discussions
Although the literature review presented in this paper is not exhaustive, it highlights different ways in which ISDM has been conceptualized and addressed with re-gard to particular disciplinary concerns. The literature offers potential explanations for the dissension that con-tinues to exist with regard to the nature and potential value of ISDM. Firstly, it reveals a shifted focus from the content of ISDM and its potential to support and guide the development of IS and management of the develop-ment process towards its characteristics and potential to change, i.e., innovation, learning, and structuration. Sec-ondly, the assessment of ISDM deployment in isolation at individual [24], project [3], organization [21], or com-munity [18] level, appears to be beneficial and to extend human capabilities by providing support for e.g., produc-tion, coordination, and collaboration. But, since these levels are related in a nested hierarchy, ISDM deploy-ment might have not only intended but also unintended and, as indicated in the literature, unfortunately detri-mental consequences, e.g., resistance, rejection, and knowledge barriers. For instance, efficiency gains ex-pected to be achieved in the development of IS as a result of the introduction of ISDM within an organization might be lost because of a lack of compatibility with us-ers’ activities, values, or knowledge. Hence, a broad conceptualization of ISDM seems to be an appropriate point of departure in order to make sense of seemingly contradictory findings.
Such a conceptualization would suggest that the main purpose of ISDM, at least in general terms, is to extend human capabilities which would allow human agents to perform valuable functionings, i.e., those functionings that one has reason to value [37]. A capability, as con-ceived by Smith and Seward, who draw on realist social theory and critical realism, represents a configuration of three components, namely structure, agency, and cultural system, which are considered necessary for the achieve-ment of associated functionings [37]. However, a capa-bility set delineated by the interaction of these compo-nents embodies only potential functionings, while the outcomes of actual functionings are considered to be contingent on ambient conditions existent in the context where the capabilities are instantiated. By regarding ISDM as an intervention, the capabilities that such an intervention should aim to ensure are those that develop agential capacity and facilitate structural and cultural opportunities. Thus, we may assume that lack of atten-tion to all these three components, i.e., structure, agency, and cultural system, will reduce the success of an ISDM
Copyright © 2010 SciRes. JSSM

Exploring the Nature of Information Systems Development Methodology: 270 A Synthesized View Based on a Literature Review
intervention. In other words, in such an intervention it will not be enough to develop and provide sophisticated ISDM components or communicate and accumulate in-formation and knowledge, but it will also be necessary to facilitate their deployment and learning.
6. Conclusions
The synthesis of the fairly large and heterogeneous lit-erature on ISDM presented in this study reveals the com-plexities and ambiguities of a multifaceted phenomenon such as ISDM. Based on the literature review, four theo-retical perspectives on ISDM were identified: 1) system, 2) structure, 3) innovation, and 4) knowledge. While each perspective regarded in isolation provides different overarching depictions of ISDM, together they provide a more nuanced picture of ISDM and its potential value in different contexts. Our literature review of ISDM is lim-ited by our selective and incomplete use of prior litera-ture. For instance, an additional theoretical perspective applied by Atkinson in order to explain the deployment of ISDM, i.e., the actor-network theory, emerged late in our work and we could not include it in our review [38]. Definitely, this should be examined in future research since it may reveal additional valuable insights into the role of ISDM within networks. We hope that our analysis will inspire other scholars and help guide conceptually sound investigations in order to reveal the scope, poten-tial roles, and impact of ISDM.
REFERENCES [1] P. Backlund, C. Hallenborg and G. Hallgrimsson, “Transfer
of Development Process Knowledge through Method Adaptation and Implementation,” Proceedings of the Eleventh European Conference in Information Systems, Naples, Italy, June 18-21, 2003, pp. 122-125.
[2] J. Iivari, R. Hirschheim and H. K. Klein, “Towards a Distinctive Body of Knowledge for Information Systems Experts: Coding ISD Process Knowledge in Two IS Jour-nals,” Information Systems Journal, Vol. 14, No. 4, 2004, pp. 313-342.
[3] B. Fitzgerald, N. L. Russo and E. Stolterman, “Informa-tion Systems Development: Methods in Action,” McGraw- Hill Education, London, 2002.
[4] J. Iivari, R. Hirschheim and H. K. Klein, “A Dynamic Framework for Classifying Information Systems Devel-opment Methodologies and Approaches,” Journal of Management Information Systems, Vol. 17, No. 3, 2000, pp. 179-218.
[5] D. K. Hitchins, “Systems Methodology,” 2007. http:// www.hitchins.net/SysMethodology.html
[6] L. D. Introna and E. A. Whitley, “Against Method-Ism: Exploring the Limits of Method,” Information Technol-ogy & People, Vol. 10, No. 1, 1997, pp. 31-45.
[7] K. Lyytinen and D. Robey, “Learning Failure in Informa-
tion Systems Development,” Information Systems Jour-nal, Vol. 9, No. 2, 1999, pp. 85-101.
[8] L. Mathiassen, “Reflective Systems Development,” Scan- dinavian Journal of Information Systems, Vol. 10, No. 1-2, 1998, pp. 67-117.
[9] D. Truex, R. A. Baskerville and J. Travis, “Amethodical Systems Development: The Deferred Meaning of Sys-tems Development Methods,” Accounting, Management and Information Technology, Vol. 10, No. 1, 2000, pp. 53-79.
[10] C. Ciborra, “The Labyrinth of Information: Challenging the Wisdom of Systems,” Oxford University Press, Ox-ford, 2007.
[11] D. Avison and G. Fitzgerald, “Information System De-velopment. Methodologies, Techniques and Tools,” 4th Edition, McGraw-Hill, New York, 2006.
[12] Von L. Bertalanffy, “General System Theory: Founda-tions, Development, Applications,” George Braziller, New York, 1968.
[13] D. Kafura, “A Survey of Software Metrics,” Proceedings of the 1985 ACM Annual Conference on the Range of Computing: Mid-80’s Perspective, Denver, Colorado, 1985, pp. 502-506.
[14] P. Tarr, H. Ossher, W. Harrison and Jr. S. M. Sutton, “Degrees of Separation: Multi-Dimensional Separation of Concerns,” Proceedings of the 21st International Confer-ence on Software Engineering, Los Angeles, CA, USA, May 1999, pp. 107-119.
[15] S. Brinkkemper, “Method Engineering: Engineering of Information Systems Development Methods and Tools,” Information and Software Technology, Vol. 38, No. 4, 1996, pp. 275-280.
[16] R. Hirschheim and H. K. Klein, “Four Paradigms of In-formation Systems Development,” Communications of the ACM, Vol. 32, No.10, 1989, pp. 1199-1216.
[17] M. Huisman and J. Iivari, “Deployment of Systems De-velopment Methodologies: Perceptual Congruence be-tween IS Managers and Systems Developers,” Informa-tion & Management, Vol. 43, No. 1, 2006, pp. 29-49.
[18] P. Beynon-Davies and M. D. Williams, “The Diffusion of Information Systems Development Methods,” Journal of Strategic Information Systems, Vol. 12, No. 1, 2003, pp. 29-46.
[19] V. Sambamurthy and L. J. Kirsch, “An Integrative Framework of the Information Systems Development Process,” Decision Sciences, Vol. 31, No. 2, 2000, pp. 391-411.
[20] P. Beynon-Davies, “Information Systems: An Introduc-tion to Informatics in Organizations,” Palgrave, Basing-stoke, 2002.
[21] W. J. Orlikowski, “The Duality of Technology: Rethink-ing the Concept of the Technology in Organizations,” Organization Science, Vol. 3, No. 3, 1992, pp. 398-427.
[22] W. J. Orlikowski, “CASE Tools as Organizational Change: Investigating Increment,” MIS Quarterly, Vol. 17, No. 3,
Copyright © 2010 SciRes. JSSM

Exploring the Nature of Information Systems Development Methodology: A Synthesized View Based on a Literature Review
Copyright © 2010 SciRes. JSSM
271
1993, pp. 309-340.
[23] B. C. Hardgrave, F. D. Davis and C. K. Riemenschneider, “Investigating Determinants of Software Developers’ In-tentions to Follow Methodologies,” Journal of Manage-ment Information Systems, Vol. 20, No. 1, 2003, pp. 123-151.
[24] M. Huisman and J. Iivari, “The Individual Deployment of Systems Development Methodologies,” Lecture Notes in Computer Science, Vol. 2348, 2002, pp. 134-150.
[25] R. G. Fichman and C. F. Kemerer, “The Assimilation of Software Process Innovations: An Organizational Learn-ing Perspective,” Management Science, Vol. 43, No. 10, 1997, pp. 1345-1363.
[26] E. Mustonen-Ollila and K. Lyytinen, “How Organizations Adopt Information Systems Process Innovations: A Lon-gitudinal Analysis,” European Journal of Information Systems, Vol. 13, No. 1, 2004, pp. 35-51.
[27] G. Fischer and J. Ostwald, “Knowledge Communication in Design Communities,” In: R. Bromme, F. Hesse and H. Spada, Eds., Barriers and Biases in Computer-Medi- ated Knowledge Communication, Kluwer Academic Pub-lishers, Netherlands, 2003, pp. 1-32.
[28] T. H. Kwon and R. W. Zmud, “Unifying the Fragmented Models of Information Systems Implementation,” In: Boland, R. J. and Hirschheim, R. A. Eds., Critical Issues in Information Systems Research, John Wiley & Sons, New York, 1987, pp. 227-251.
[29] E. M. Rogers, “Diffusion of Innovations,” The Free Press, New York, 1995.
[30] V. Venkatesh, M. G. Morris, G. B. Davis and F. D. Davis, “User Acceptance of Information Technology: Toward a Unified View,” MIS Quarterly, Vol. 27, No. 3, 2003, pp. 425-478.
[31] R. A. Johnson, B. C. Hardgrave and E. R. Doke, “An Industry Analysis of Developer Beliefs About Object- Oriented Systems Development,” The DATA BASE for Advances in Information Systems, Vol. 30, No. 1, 1999, pp. 47-64.
[32] S. Newell, J. A. Swan and R. D. Galliers, “A Knowl-edge-Focused Perspective on the Diffusion and Adoption of Complex Information Technologies: The BPR Exam-ple,” Information Systems Journal, Vol. 10, No. 3, 2000, pp. 239-259.
[33] R. G. Fichman, “The Assimilation and Diffusion of Software Process Innovations, Unpublished,” Ph. D. Dis-sertation, MIT Sloan School of Management, 1995.
[34] E. Wenger, “Communities of Practice: Learning, Mean-ing, and Identity,” Cambridge University Press, Cam-bridge, UK, 1998.
[35] C. Ghezzi, M. Jazayeri and D. Mandrioli, “Fundamentals of Software Engineering,” 2nd Edition, Prentice Hall, UK, 2003.
[36] K. Kumar and R. Welke, “Methodology Engineering: A Proposal for Situation-Specific Methodology Construc-tion,” In: W. Cotterman and J. Senn, Eds., Challenges and Strategies for Research in Systems Development, John Wiley & Sons, New York, US, 1992, pp. 257-269.
[37] M. L. Smith and C. Seward, “Causal Theories and Citi-zenship: Bridging the Theory-Data Gap in Sen’s Capabil-ity Approach,” The 5th International Conference on the Capability Approach: Knowledge and Public Action, Paris, France, September 11-14, 2005.
[38] C. J. Atkinson, “The Soft Information Systems and Tech-nologies Methodology: An Actor Network Contingency Approach to Integrated Development,” European Journal of Information Systems, Vol. 9, No. 2, 2000, pp. 104-123.

J. Service Science & Management, 2010, 3, 272-280 doi:10.4236/jssm.2010.32034 Published Online June 2010 (http://www.SciRP.org/journal/jssm)
Copyright © 2010 SciRes. JSSM
Pricing Traditional Travel Agency Services: A Theatre-Based Experimental Study
Giuseppe Catenazzo1, Emmanuel Fragnière2
1Haute École De Gestion De Genève, Carouge Ge, Switzerland; 2Cia, The University Of Bath, Haute École De Gestion De Genève, Carouge Ge, Switzerland. Email: {giuseppe.catenazzo, emmanuel.fragniere}@hesge.ch Received January 1st, 2010; revised February 16th, 2010; accepted March 22nd, 2010.
ABSTRACT
Airline commissions’ cuts and the use of Internet for bookings have severely affected traditional (physical) travel agen-cies. To survive, travel agents are redesigning their job as to become travel consultants. However, customers seem not to be willing to pay for the service provided and current fees are not representative of its perceived value. We have de-signed a theatre-based experiment to discover the Willingness-To-Pay for a travel agency service experience. Results show that individuals are not willing to pay anything for an unpleasant experience. By contrast, only 1/3 of the sample would pay enough for an outstanding service experience to make such a business sustainable. Keywords: Experimental Study, Theatre, Service Design, Travel Agent, Human Simulation, Service Pricing
1. Introduction
Travel agencies are retail intermediaries that represent a wide range of leisure and journey services [1]; the role of the travel agent is to provide travellers with information, travel documents administration and advices [2]. This type of business is remunerated through commissions collected on the wholesales [1].
In the last decade, the overall travel demand has in-creased (on average +4.1% per year since 1995, source: World Tourism Organisation, http://www.unwto.org), but not the traditional travel agencies income: the industry has been hit by changes that heavily affected their busi-ness.
First of all, traditional commission schemes to travel agencies have totally changed. Up to 1997, about one fourth of traditional travel agencies revenue was raised through airline tickets sales commissions, 67% through other sources such as vacation and other packages sales [3]; in the following years this takings model experi-enced a complete transformation. This is due to the at-tempt of disintermediation by many travel providers and travel agencies’ operational costs growth over time [2].
More precisely, airline ticket sales commissions aboli-tion has put in danger the survival of traditional travel agencies. This policy started in the late 90s with the in-troduction of commissions’ cuts and the introduction of flat fares to agents [4], few years later, in 2002, most world leading carriers have introduced a 0% commis-
sion’s policy towards their agents. This happened first in the US in March 2002 at 8 major American airlines, fol-lowed by Air Canada on April 23rd 2002, and then by all other international airlines around the world [5,6]. Worldwide, this revenue change in the traditional travel agencies business lead traditional travel agencies either to close or consolidate [2]. For example, in the USA, 2,707 traditional travel agencies close between 1995 and 2002 [7].
To fill up such missed income, traditional travel agen-cies have been diversifying their activities to alternative more profitable travel products such as cruises and tours [2,7]. Also, they transferred the commissions’ revenue straight to their customers by introducing a booking or service fee [2,8,9]. However, to save such charge, most travellers have quickly turned to the Internet and to phone booking centres [2] where they can make reserva-tions at their convenience using their own debit or credit card.
In addition to fees’ schemes altering, the traditional travel agency industry has suffered because of a fast growing use of information communication (ICT) de-vices in the industry. The shape of the whole travel in-dustry rapidly changed since ICT allowed tourism ser-vice providers a more easily disintermediation. Also, Internet-based agencies have entered the market and tighten competition in an industry characterised by sev-eral small independent retailers, low entry barriers, and low return businesses. Since use of the Internet for users

Pricing Traditional Travel Agency Services: A Theatre-Based Experimental Study 273
has spread and become more comfortable to people, tra-ditional agencies have been facing a more challenging competitor [10].
To survive, travel agencies need to redesign their job: at present time, they are slowly transforming themselves into travel consulting bureaus rather than booking centres [7,11]. This can happen since in the travel industry, in-formation and knowledge play a strategic role [12], espe-cially when devising composite organising and intricate travel packages [7]. Thus, according to Bennett and Lai [11], traditional travel agencies strategies need to focus on personal service to provide the customers’ profes-sional advice and added-value services. Also, they should treat Internet and other ICS as an opportunity, not as a threat.
The travel agent’s job then becomes a knowledge- based service of high added value [2]. A knowledge- based service can be described as a service delivered by highly trained providers that offer a high quality service designed to meet the customers’ needs [13]. This defini-tion seems to fit well to the job of the traditional travel agent work that deals with understanding the customers’ requirements and providing them with high-added value services [10]. This innovation in the industry has been advocated by Morgan & Trivedi [14] who point out that the travel agents value relies on the customers’ need of understanding, not in the booking process.
In operational terms, this means that customers trans-fer to the travel agent the care to find the package that best fits with his/her expectations. This is a high inform- ation and fares selection process necessary to design the best self-tailored package [4].
The relevancy of service quality and expertise sharing in the service provided by traditional travel agencies has been proved in an empirical study conducted in Hong Kong by Lam & Zhang [15]. The two authors have con-ducted a survey research among 209 travel agents in Hong Kong in which they evidence a large breach be-tween customer expectations and perceptions. Moreover, they outline that corporate image is not a factor that in-fluences the perceived service quality. So, yet in 1998, the two authors suggested travel agencies to focus on the human capital and make investments on it. In practise, the implementation of a long-term plan of training and management of employees was supposed to be the right direction to improve the quality of the service provided and guarantee the survival of agencies.
The gap between travel agencies and customers’ ex-pectations has also been studied through game-theoretic tests. A sample of 198 hotel customers who booked a hotel room through a travel agent in the six months be-fore their stay have been tested: results show that the higher the room rate, the less the value perceived by the consumer and vice-versa [14].
Expertise and know how (i.e., tacit knowledge) repre-
sent the added value provided by travel agencies. This is confirmed by an international online survey conducted upon 132 individuals. The research has pointed out that travel agents are perceived as more effective than the Internet in terms of providing a more comprehensive idea of the destination as well as of the whole journey. Also, the quality and the choice of the information offered are better than those provided by Internet [16].
But the role of ICT is also important for travel agen-cies to survive and being competitive. This is the main finding of a survey research conducted among random sample of 84 Canadian and 83 New Zealander travel agents designed to assess the relevancy of ICT systems among the travel industry [12]. Again, as put above, the Internet and other ICT tools need to be seen as an oppor-tunity, not necessarily a threat [17]. Lewis et al. [2] iden-tify the upcoming challenges of the traditional travel agency industry need facing the following list: providing added-value services, making ICT use successful and developing customers’ loyalty. The latter needs to be improved: only few traditional travel agencies have and use customers’ databases to build effective marketing and sales strategies [10].
In Switzerland, travel agents are professionals in cha- rge of informing, counselling, organising travels as well as providing accommodation, transportation and some-times tour guide services to the travellers (source: Swiss Federal Office of Statistics http://www.bfs.admin.ch). In this country, the major airline “Swiss International Air Lines Ltd” cut commissions to its agents in 2005 (source: http://www.swiss.com).
According to IATA, the International Air Transporta-tion Association (source: http://www.iata.org), the Swiss demand for flying is estimated at around CHF 3 billion per year. This means that, assuming an airline ticket duty of 7%, which was the most common charge to flying carriers between 1998 and 2002 [6,7], the whole Swiss travel agency industry has lost approximately CHF 210 million per year.
In addition to these losses, 2005 data highlight that only one third of overall travel bookings were made through traditional travel agencies [13,18]. This trend has been confirmed in 2006, with “more than one fourth of Swiss making reservations for their holidays through the Internet that equals the traditional travel agencies” [19].
We learn from service science theory that it is not easy to price a service. This happens because of the character-istics of services that are, by definition, intangible, het-erogeneous, instantaneous and perishable. Services are intangible goods: their production results in the creation of immaterial value. Such goods are invisible for the customers; the lack of standards to judge them objec-tively makes the production of services a pure individual experience. Also, the service experience is encountered by individuals: it is unique since non-replicable and then
Copyright © 2010 SciRes. JSSM

Pricing Traditional Travel Agency Services: A Theatre-Based Experimental Study 274
instantaneous. Indeed, most of the time, the production of a service results from an individual-to-individual transac-tion. Finally, services are perishable as it is impossible to stock, re-sale or give them back [20-22]). The pricing of a service relies upon three pillars: internal organisational costs, the competitors’ prices and the perceived value by the customers [20].
However, customers do not always perceive such value: making individuals aware of the worth of intangi-bles is not easy, not all individuals acknowledge it and perceptions may differ a lot. In the case of the travel agencies, a survey research conducted in the Geneva area in 2006 has evidenced that clients are aware of the value of the service provided but they are not ready to pay for it [23]. Further analysis on Geneva customers has high-lighted the importance of the travel agents’ expertise: this knowledge is considered as very useful but, again, indi-viduals are not willing to pay to benefit of it [13].
In this research, we attempt to explore the perceived value of a service experienced by a customer between the travel agency walls. Thus, we aim to discover individu-als’ Willingness-To-Pay (WTP, see for example [24,25]) for a travel agency service experience. Therefore, would like to know whether travel agencies provide sufficient perceived value to their customers to be profitable [24].
To attempt to provide an answer to this concern, we have designed a theatre-based experimental study to identify some key patterns associated to this issue: ex-perimentation is widely used in many environmental, psychological and service science studies to attempt to detect WTP for services or non-marketed goods [26-28].
This paper is organised as follows: in the next section, we present the methodology employed in our experi-mental study. We also outline the importance of using human simulation in making visible the value of such service experience. Then, we present the main results of our experiment and hypotheses have been validated through non-parametric statistical tests.
2. Methodology
To attempt understand individuals’ WTP for the travel agent’s service, we have made a theatre-based experi-ment. Tests were held at two separate groups of subjects (mainly adult professionals working in the public or pri-vate sector) who attended the Geneva Haute École de Gestion annual Symposium, on November 28th 2007.
To make visible the travel agent service experience, we have designed a short theatre libretto played before our subjects. The choice of a theatre experience relies upon a well-established tradition of these techniques in business. Theatre for business and organisations has also been recognised to have didactic qualities: it is consid-ered as extremely useful for teaching communication, improving the oral expression, ameliorate employees’ sales techniques, languages teaching and learning. Also,
it is acknowledged to have pedagogic merits such as making individuals feel part of a group, being a manager and making communication easier, [29].
Furthermore, a survey on business students and execu-tives who have followed a theatre-based training agree by underlying the importance of the theatres’ development [30]. Finally, theatre-based techniques allow overseeing individuals in their completeness: this means that indi-viduals’ intellectual, physical and emotional dimensions are explored [31].
Thanks to this acknowledged usefulness of theatre in solving management and organisational issues, we have designed a theatre-based experiment representative of the service production and consumption in a Swiss travel agency. We have used theatre-based techniques in order to price the perceived added value of a typical travel agent service in Switzerland.
We call by “theatre-based experiments” tests held in a theatre-like space, in which there are two parties: actors and spectators. We plotted two hypothetical Swiss travel agency services and customer experiences and made them visible to two independent groups of individuals. Two professional actors (a man and a woman) on stage had to play two scripts showing two travel agents’ consu- lting service experiences and spectators were asked to price them through the customer’s side. More in detail, actors played two scripts: a very low quality travel ag- ent’s service experience followed by a high standard one.
In the very low quality service experience, the custom- er, Mrs Pittet, an upper-class Geneva woman goes to a travel agency to organise a tour in Andalusia for a group of friends and herself. She regularly goes to that agency and she is always satisfied by the services provided by Mr Paul, one of the employees working there. However, that day Mr Paul is absent and another agent (man) is at her service. Mrs Pittet asks him for a personally designed tour in that region of Spain. She expects an outstanding travel, regardless of the total price of the journey. The agent doesn’t show a customer-oriented behaviour: he suddenly answers a personal phone-call and then at-tempts to propose Mrs Pittet a catalogue-based tour. He is not an expert of Spain, he neither speaks Spanish but according to him, going to Spain is “an ordinary trip, everybody knows where to go and what to see”. So, he insists on the quality/price of the packages on the cata-logue that he continues to show her. Again, Mrs Pittet makes clear that the budget is not a priority and she wishes a personally designed and unforgettable adven-ture: the travel agent still continues to show his confi-dence towards the tour operator he has got several cata-logues on hand and on his table. After a few minutes, the customer, nervous and unsatisfied by the agent’s attitude, leaves the agency.
The second play shows a very high-quality travel agent service. The customer is a direction secretary
Copyright © 2010 SciRes. JSSM

Pricing Traditional Travel Agency Services: A Theatre-Based Experimental Study 275
(woman) who is tired, sad and anxious as the directors of the company she works for have decided to fly from Ge-neva to New York a few days later. This travel must be planned in a hurry and the directors always have high expectations. They will go to the American city for busi-ness and for shopping for a few days. The travel agent (man) starts by welcoming his customer and then listens to her requests. He attempts to reassure the customer, offers her a glass of water and when his mobile phone is ringing, he turns it off. He is a very professional man; he attempts to make his customer at ease and answers to all of her requests. Finally, he promises the customer to send her a bid the day after, gives her a business card and, again reassures her that everything will be fine. The cus-tomer leaves the agency reassured, relieved and thankful to the travel agent.
The two scripts were played in front of a group of spectators: we repeated the test twice, with two inde-pendent groups of adults who could not communicate with each other. So, on the public side, a group of spec-tators (35) assisted to both plays (5-8 minutes each). They were then asked to freely state their Willing-ness-To-Pay (WTP) [23-25,32]: each had to price the service experience as if she/he were experiencing it from the customer’s side. WTP had to be elicited for both scenarios. The spectators were provided with a sheet of paper for both experience and were asked to write down their WTP in Swiss Francs.
The same experiment was replied with a second group of subjects (42) that could not interact with the first one. Each individual of the second group assisted to both plays and then was asked to elicit her/his WTP. For this second experiment, the spectators were asked to state their WTP by choosing among the following possible answers: CHF 0, CHF 50, CHF 100, CHF 150 and CHF 200. Each individual of this second group was asked to elicit her/his WTP for both scenarios.
3. Operational Definition
This experiment has been conducted in the occasion of the Geneva Haute École de Gestion Symposium entitled “Draw-me a service! Private and public administrations: new techniques to conceive and appraise your services” which took place on November 28th 2007 in the buildings of the school. During all day, participants were intro-duced to the underlying service science issues together with a selection of best practises relating to both the pri-vate and the public sectors. Each participant, mainly adults active in the locally-based private and public or-ganisations paid CHF 170 for the whole day: among oth-ers, this gave us the opportunity to funding our tests made with the help of professional actors.
Thus, the experiment was held during the afternoon when participants had already been introduced to the main basic concepts of service management, that is to
say, the IHIP paradigm (Intangibility, Heterogeneity, Instantaneity and Perishability, see [20-22]) and its prac-tical applications.
Several participants (77 subjects in total) chose the two parallel sessions called “Service Design Workshop” without being informed in advance about the experiment running.
Two scripts were written by Mr Gaëtan Derache, a Lecturer in Communications at HEG, and attempted to show in a humoristic way two opposite service experi-ences: a low quality or unpleasant experience and a high standing one in which it was possible to outline the ex-pertise and quality of the service provided. This clear-cut difference among the two service experiences was de-signed with the aim to make obvious the huge gap occur-ring between them.
The choice of using professional actors was driven by two main factors: first of all, their expertise in playing different roles in front of a wide public was judged as a condition sine qua non to make the representations credible towards a group of adult spectators paying to assist and participate to the experiment. Secondly, pro-fessional actors are able to replicate the plays several times in an identical manner. These conditions allowed us to replicate the experiment twice in front of two sepa-rate groups of adults.
We can mention a few issues related to the experiment: first, because the two groups are independent our ex-periment falls in the category of independent measure design which is also known as between subjects design. Second, in terms of factors, the dependent variable cor-responds to the WTP stated by the respondents and the independent variable is represented by the individuals’ perception produced by the two scenes played by the professional actors.
The physical environment in which the professional actors played the scripts, i.e., the School annual event, the classroom, the day of the week, the stage of the plays… that might have influenced the individuals’ per-ceptions have not been changed along the experiments. Thus, the environmental variables could be as much as possible kept under control since, in the same day, time and place individuals have participated to an identical test.
The experimenter asked the participants to the experi-ment to sit in the classroom and to watch the coming short play to be presented in front of them. After the end of the demonstration, the experimenter asked the partici-pants to state their WTP for this service experience by writing it on a provided document. Participants were not allowed to communicate with each other during and after the experience. (see Figure 1)
This document was then collected to all participants; afterwards, the second play followed. Again, after the end of the play, the experimenter asked the tested adults
Copyright © 2010 SciRes. JSSM

Pricing Traditional Travel Agency Services: A Theatre-Based Experimental Study 276
to state their WTP for the service experience they have just observed by writing it on a provided document. (see Figure 2)
After collecting this second document, an explanation of the experiment followed together with participants’ questions and suggestions.
Immediately after that the first group of tested indi-viduals left the classroom, a second group entered into the classroom without any contact with the previous one. The same experience was replicated with the same tech-nique as described above. The only change that was made concerns the documents on which the participant had to state their WTP. For this second round, the fol-lowing document model (Figure 3) was provided.
This means that individuals were not free to elicit their WTP at their convenience but had to choose among the four possible provided answers, i.e., CHF 0, CHF 50, CHF 100 and CHF 200. The choice of this scale is moti-vated by what we have learnt by a first attempt on how to price the service of the travel agent. CHF 0, CHF 50, CHF 100 and CHF 200 correspond to the fixed fee scheme that we have observed in Geneva main streets agencies. We have chosen a maximum choice of CHF 200 as this represents the acknowledged fee enabling the travel agency to be profitable when packaging a full journey. Thus, we assume that people selecting CHF 200 might have a higher or equal WTP to this amount. The
PLAY 1 How much would you be willing to pay for this service? CHF .-
Figure 1. Play 1, 1st round
PLAY 2 How much would you be willing to pay for this service? CHF .-
Figure 2. Play 2, 1st round
PLAY 1 How much would you be willing to pay for this service? CHF 0.- CHF 50.- CHF 100.- CHF 200.-
Figure 3. Play 1, 2nd round
consistency of this scale is then verified when comparing the experiments associated with the overall free scale.
The above document was submitted to assess the WTP for the first play, i.e., the unpleasant service experience. Again, the participants to the test could not interact with each other. Then, the filled forms were collected, and the second script was played. Spectators were asked to state their WTP for this second play on the following docu-ment (Figure 4).
At the end of the plays, this second document col-lected, an explanation of the experiment followed to-gether with participants’ questions and suggestions.
4. Results & Hypothesis Testing
We collected all papers and coded data with SPSS 15 for Windows software. Here follow the main findings issued by the analysis of the data collected.
For the first service experience, i.e., the low quality and unpleasant service experience, the stated WTP for both rounds is CHF 0 as collected in our sample. This means that in both cases, the elicitation tool (free WTP elicitation document and the multiple choice one) has no influence on the results. All adults who participated to the test agree not to be willing to pay anything for the service experience they had just observed.
The second service experience, that is to say the high quality service experience leads us with different WTP. First of all, participants who assisted to the first round and were free to elicit their WTP show a mean WTP of CHF 220.29 with a standard deviation of CHF 276.20. The median WTP is CHF 100 and the mode is CHF 100, on a range spanning from CHF 0 to CHF 1000.
For the second round, where individuals were asked to state their WTP according to a provided scale (CHF 0, CHF 50, CHF 100 and CHF 200), the mean of the elic-ited WTP is CHF 117.85. The median WTP is CHF 100, the mode CHF 100 and the standard deviation CHF 66.09. In this second sample, the stated WTP spans from a minimum of CHF 0 and a maximum of CHF 200.
Thus, we can affirm that most spectators are willing to pay for the second service experience. Although the stated WTP does not assure that individuals would accept to pay the elicited amount [26,28], we can affirm that indi-viduals perceive a value in the second service experience
PLAY 2 How much would you be willing to pay for this service? CHF 0.- CHF 50.- CHF 100.- CHF 200.-
Figure 4. Play 2, 2nd round
Copyright © 2010 SciRes. JSSM
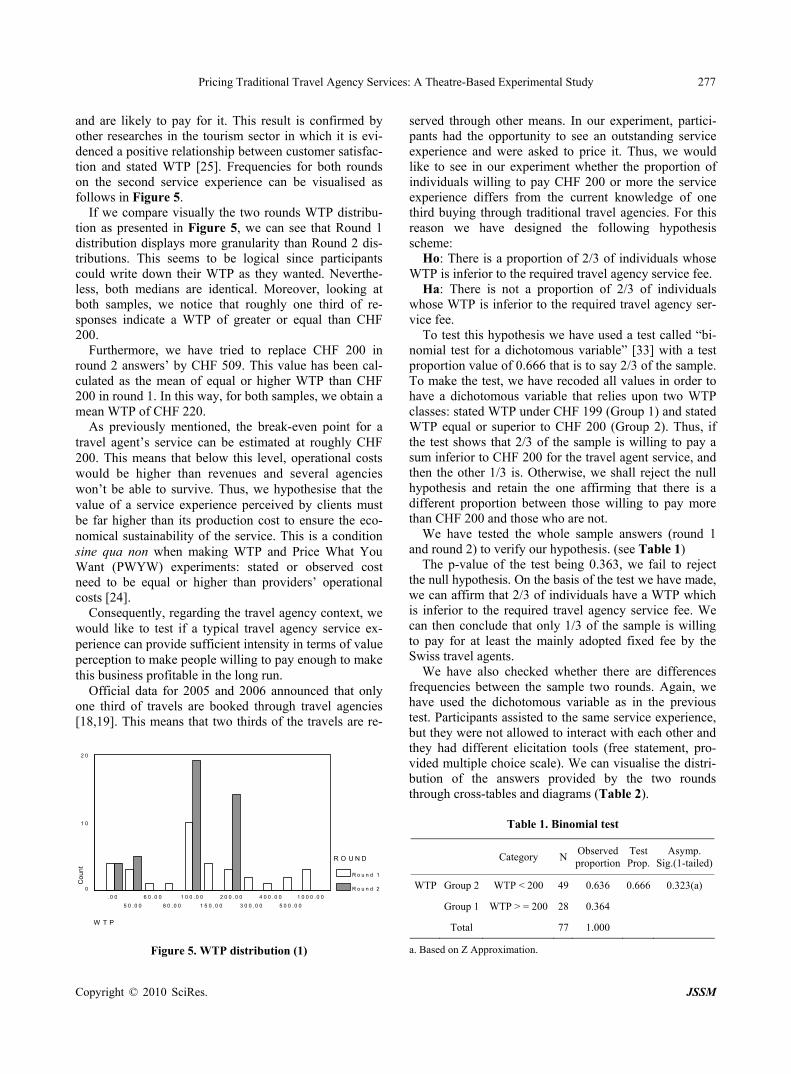
Pricing Traditional Travel Agency Services: A Theatre-Based Experimental Study 277
and are likely to pay for it. This result is confirmed by other researches in the tourism sector in which it is evi-denced a positive relationship between customer satisfac-tion and stated WTP [25]. Frequencies for both rounds on the second service experience can be visualised as follows in Figure 5.
If we compare visually the two rounds WTP distribu-tion as presented in Figure 5, we can see that Round 1 distribution displays more granularity than Round 2 dis-tributions. This seems to be logical since participants could write down their WTP as they wanted. Neverthe-less, both medians are identical. Moreover, looking at both samples, we notice that roughly one third of re-sponses indicate a WTP of greater or equal than CHF 200.
Furthermore, we have tried to replace CHF 200 in round 2 answers’ by CHF 509. This value has been cal-culated as the mean of equal or higher WTP than CHF 200 in round 1. In this way, for both samples, we obtain a mean WTP of CHF 220.
As previously mentioned, the break-even point for a travel agent’s service can be estimated at roughly CHF 200. This means that below this level, operational costs would be higher than revenues and several agencies won’t be able to survive. Thus, we hypothesise that the value of a service experience perceived by clients must be far higher than its production cost to ensure the eco-nomical sustainability of the service. This is a condition sine qua non when making WTP and Price What You Want (PWYW) experiments: stated or observed cost need to be equal or higher than providers’ operational costs [24].
Consequently, regarding the travel agency context, we would like to test if a typical travel agency service ex-perience can provide sufficient intensity in terms of value perception to make people willing to pay enough to make this business profitable in the long run.
Official data for 2005 and 2006 announced that only one third of travels are booked through travel agencies [18,19]. This means that two thirds of the travels are re-
W T P
1 0 0 0 .0 0
5 0 0 .0 0
4 0 0 .0 0
3 0 0 .0 0
2 0 0 .0 0
1 5 0 .0 0
1 0 0 .0 0
8 0 .0 0
6 0 .0 0
5 0 .0 0
.0 0
Cou
nt
2 0
1 0
0
R O U N D
R o u n d 1
R o u n d 2
Figure 5. WTP distribution (1)
served through other means. In our experiment, partici-pants had the opportunity to see an outstanding service experience and were asked to price it. Thus, we would like to see in our experiment whether the proportion of individuals willing to pay CHF 200 or more the service experience differs from the current knowledge of one third buying through traditional travel agencies. For this reason we have designed the following hypothesis scheme:
Ho: There is a proportion of 2/3 of individuals whose WTP is inferior to the required travel agency service fee.
Ha: There is not a proportion of 2/3 of individuals whose WTP is inferior to the required travel agency ser-vice fee.
To test this hypothesis we have used a test called “bi-nomial test for a dichotomous variable” [33] with a test proportion value of 0.666 that is to say 2/3 of the sample. To make the test, we have recoded all values in order to have a dichotomous variable that relies upon two WTP classes: stated WTP under CHF 199 (Group 1) and stated WTP equal or superior to CHF 200 (Group 2). Thus, if the test shows that 2/3 of the sample is willing to pay a sum inferior to CHF 200 for the travel agent service, and then the other 1/3 is. Otherwise, we shall reject the null hypothesis and retain the one affirming that there is a different proportion between those willing to pay more than CHF 200 and those who are not.
We have tested the whole sample answers (round 1 and round 2) to verify our hypothesis. (see Table 1)
The p-value of the test being 0.363, we fail to reject the null hypothesis. On the basis of the test we have made, we can affirm that 2/3 of individuals have a WTP which is inferior to the required travel agency service fee. We can then conclude that only 1/3 of the sample is willing to pay for at least the mainly adopted fixed fee by the Swiss travel agents.
We have also checked whether there are differences frequencies between the sample two rounds. Again, we have used the dichotomous variable as in the previous test. Participants assisted to the same service experience, but they were not allowed to interact with each other and they had different elicitation tools (free statement, pro-vided multiple choice scale). We can visualise the distri-bution of the answers provided by the two rounds through cross-tables and diagrams (Table 2).
Table 1. Binomial test
Category N Observed proportion
Test Prop.
Asymp. Sig.(1-tailed)
WTP Group 2 WTP < 200 49 0.636 0.666 0.323(a)
Group 1 WTP > = 200 28 0.364
Total 77 1.000
a. Based on Z Approximation.
Copyright © 2010 SciRes. JSSM

Pricing Traditional Travel Agency Services: A Theatre-Based Experimental Study 278
Finally, we have made an additional to verify whether significant statistical differences exist between the two rounds we have made a test called “Chi-square for two unrelated samples”. This test has been designed with the aim to check whether the elicitation tool used to measure subjects’ WTP for the second plot makes statements sig-nificantly differ between round 1 and round 2. For this reason we have designed the following hypothesis scheme:
Ho: There are no significant differences between WTP stated between the two rounds
Ha: There are significant differences between WTP stated between the two rounds
Table 2. Cross table: round 1 * round 2
Rounds
Round 1 Round 2 Total
WTP < 200 21 28 49 WTP
WTP >= 200 13 15 28
Total 34 43 77
30
20
10
0
Fre
qu
enc
ies
WTP WTP > = 200 WTP < 200
Round 1Round 2
Round
Figure 6. WTP distribution (2)
Table 3. Chi-Square tests
Value df Asymp.Sig. (2-sided)
Exact Sig.(2-sided)
Exact Sig.(1-sided)
Pearson Chi-square 0.092(b) 1 0.761
Continuity Correc-tion(a)
0.004 1 0.948
Likelihood ratio 0.092 1 0.762
Fisher’s Exact Test 0.814 0.473
Linear-by-Linear Association
0.091 1 0.763
N of valid cases 77
a. Computed only for a 2 × 2 table b. 0 cells (0.0%) have expected count less than 5. The minimum ex-pected count is 12.36.
The p-value of 0.761 for this test show lets us to fail-to-reject the hypothesis of differences between the rounds. We can then affirm that there are no statistical difference in the dichotomous variable provided by the spectators of the first and the second round.
5. Conclusions
Traditional (physical) travel agencies are suffering the current changes in the tourism industry. This is caused mainly by the cut of airline commissions and the use of Internet that offers customers direct booking to travel service providers as well as web travel agencies. Both factors have severely affected the travel agency industry that should redesign itself. Thus, travel agents shall be-come travel “consultants” or travel “experts” instead of booking employees.
Therefore, we assist to a change in the job of the travel agent, which becomes more and more a high added-value service. Customer service associated with technical knowledge and the agent’s expertise become crucial in the production of the travel agency service experience. The value of the service provided must be well ac-knowledged by customers who should accept to pay the agencies an adequate sum to make this kind of business profitable. So, the overall customers’ willingness to pay (WTP) for travel agency services experience should be sufficient to cover the agencies’ operational costs and to make profits.
To deal with this service pricing issue, we have de-signed a theatre-based experiment that has been run on 77 subjects participating to a Geneva Haute École de Gestion annual event presenting service management issues for both private and public organisations. Two professional actors have played two scripts in which they showed the spectators two opposite travel agents service experiences: a low quality and an outstanding one. At the end of each play, participants were asked to state their WTP for this service experience. The same service ex-periences were showed to two different groups of adults that could not interact with each other but had different WTP elicitation tools. Participants of the first group were free to state their WTP for both service experiences on a provided document while those of the second group should choose their WTP on the basis of a provided scale (CHF 0, CHF 50, CHF 100 and CHF 200).
Since the travel agencies operational costs for a travel package can be estimated at about CHF 200, we have gathered together the two rounds data and divided them into two sets: values below CHF 200 and those equal or above this sum. This has allowed us to have a data set in which it was possible to identify the individuals willing to pay a sufficient travel agency fee to make their busi-ness sustainable and those who are not, and would rather use alternative tools to organise their travels.
Official data show that in Switzerland, in 2005 and
Copyright © 2010 SciRes. JSSM

Pricing Traditional Travel Agency Services: A Theatre-Based Experimental Study 279
2006 only one third of travels were booked through travel agencies. We have conducted a non-parametric statistical test to verify whether the same proportions apply to our small sample that assisted to a human simu-lation of an outstanding travel agent service experience. Our test evidenced that the same proportion apply to our participants: 2/3 are not willing to pay a sufficient sum for the travel agent service to cover its operational costs and being profitable. Also, a further test has evidenced that no significant statistical difference exists between the stated WTP of participants to the first round and to the second one.
Finally, we can conclude that only one third of cus-tomers are willing to pay a sufficient fee for a travel agency service experience. The perceived value of the service provided expressed in monetary terms is in a general manner not sufficient to cover the agencies operational costs. In fact, people are not ready to properly assess the value provided by the travel agent. We have observed this attitude in real context since in the past years agen-cies services were provided for free. Consequently, their worth might not have been fully acknowledged.
6. Acknowledgements
An earlier version of this paper was presented at the 4th International Conference on Services Management “Mana- ging Services across Continents”, Oxford Brookes Uni-versity, UK, May 8-9, 2009. Thus, we would like to thank these participants as well as an anonymous referee for their valuable feedback.
REFERENCES [1] P. C. Alexander, “Travel Agency Bankruptcies: A Primer,”
Commercial Law Journal, Vol. 106, No. 4, 2002, pp. 443-453.
[2] I. Lewis, J. Semeijn and A. Talalayevsky, “The Impact of Information Technology on Travel Agents,” Transporta-tion Journal, Vol. 37, No. 4, 1998, pp. 20-25.
[3] R. Dumazel and I. Humphreys, “Travel Agent Monitoring and Management,” Journal of Air Transport Management, Vol. 5, No. 2, 1999, pp. 63-72.
[4] I. Lewis and A. Talalayevsky, “Travel Agents: Thre- atened Intermediaries?” Transportation Journal, Vol. 36, No. 3, 1996, pp. 26-30.
[5] Knowledge@Warton, “Will Commission Cuts Kill the Small Travel Agent?” May 8, 2002.
[6] Amadeus, “Service Fees and Commission Cuts―Oppor-tunities and Best Practises for Travel Agencies,” 2007.
[7] F. Alamdari, “Regional Development in Airlines and Travel Agents Relationship,” Journal of Air Transportation Mana- gement, Vol. 8, No. 5, 2002, pp. 339-348.
[8] S. Dolnicar and C. Laesser, “Travel Agency Marketing Strategy: Insights from Switzerland,” Journal of Travel Research, Vol. 46, No. 2, 2007, pp. 133-146.
[9] J. Levere, “Changing Roles,” Airline Business, October 2000.
[10] J. Dilts and G. Prough, “Travel Agencies: A Service In-dustry in Transition in the Networked Economy,” Mar-keting Management Journal, Vol. 13, No. 2, 2002, pp. 96-106.
[11] M. M. Bennett and C.-W. K. Lai, “The Impact of the Internet on Travel Agencies in Taiwan,” Tourism and Hospitality Research, Vol. 6, No. 1, 2005, pp. 8-23.
[12] S. Deng, R. Lawson and L. Moutinho, “Travel Agents’ Attitudes towards Automation and the Delivery of a Ser-vice,” Asia Pacific Journal of Marketing and Logistics, Vol. 4, No. 12, 2000, pp. 60-72.
[13] J. Debély, M. Dubosson and E. Fragnière, “The Travel Agent: Delivering More Value by Becoming an Opera-tional Risk Management,” Proceedings of the 9th Interna-tional Research Seminar in Service Management, La Londe, IAE Aix-en-Provence, France, May 30-31 & June 1-2, 2006, pp. 178-203.
[14] M. S. Morgan and M. Trivedi, “Service Intermediaries: A Theoretical Modeling Framework with an Application to Travel Agents,” Journal of Modelling in Management, Vol. 2, No. 2, 2007, pp. 143-156.
[15] T. Lam and H. Q. Zhang, “Service Quality of the Travel Agents: The Case of Travel Agents in Hong Kong,” Tourism Management, Vol. 20, No. 3, 1998, pp. 341-349.
[16] A. Bodganovych, H. Berger, S. Simoff and C. Sierra, “Travel Agents vs. Online Booking: Tackling the Short-comings of Nowadays Online Tourism Portals,” Pro-ceedings of the ENTER’06 Conference, Lausanne, Swit-zerland, 2006, pp. 418-428.
[17] L. Suárez Álvarez, A. M. Diáz Martín and R. Vázquez Caselles, “Relationship Marketing and Information and Communication Technologies: Analysis of Retail Travel Agencies,” Journal of Travel Research, Vol. 45, No. 4, 2007, pp. 453-463.
[18] Credit Suisse, “Swiss Issues―Le Marché des Voyages: Entre Globalisation et Pression des Coûts,” 2005.
[19] Credit Suisse, “Dynamisme de la Branche des Agences de Voyage Malgré la Concurrence d’Internet―Marché Suisse des Voyages: Offre, Demande et Perspectives,” 2007.
[20] G. Catenazzo and E. Fragnière, “La Gestion des Services [Services Management],” Economica, Paris, France, 2008.
[21] C. Hsu, “Service Science: Design for Scaling and Trans-formation,” World Scientific, Singapore, 2009.
[22] T. Laine, J. Paranko and P. Suomala, “The Nature of Ser-vices in the Business-To-Business Context,” In: Mendibil, K. and Shamsuddin, A. Eds., Moving up the Value Chain, University of Strathclyde, Glasgow, Scotland, 2006, pp. 887-896.
[23] J. Debély, M. Dubosson and E. Fragnière, “The Pricing of Knowledge-Based Services: Insights from the Environ-mental Sciences,” Journal of Services Research, Special Issue (February 2008), 2008, pp. 167-181.
[24] J.-Y. Kim, M. Natter and M. Spann, “Pay What You Want: A New Participative Pricing Mechanism,” Journal of
Copyright © 2010 SciRes. JSSM

Pricing Traditional Travel Agency Services: A Theatre-Based Experimental Study
Copyright © 2010 SciRes. JSSM
280
Marketing, Vol. 73, No. 1, 2009, pp. 44-58.
[25] C. Homburg, N. Koschate and W. D. Hoyer, “Do Satisfied Customers Really Pay More? A Study of the Relationship between Customer Satisfaction and Willingness to Pay,” Journal of Marketing, Vol. 69, No. 2, 2005, pp. 84-96.
[26] G. Garrods and K. G. Willis, “Economic Valuation of the Environment, Methods and Case Studies,” Edward Elgar, Cheltenham, UK, 1999.
[27] A. Hansla, A. Gamble, A. Juliusson and T. Gärling, “Psy-chological Determinants of Attitude towards and Will-ingness to Pay for Green Electricity,” Energy Policy, Vol. 36, No. 2, 2008, pp. 768-774.
[28] R. Hoevenagel, “An Assessment of the Contingent Valua-tion Method,” In: Pethig, R. Ed., Valuing the Environ-ment: Methodological and Measurement Issues, Kluwer Academic Publishers, Dordrecht, The Netherlands, 1994, pp. 195-227.
[29] M. Salgado, “Utiliser le Théâtre “Dans” et “Pour” L’En-
treprise,” Proceedings of the XIVth International Confer-ence of the International Association of Strategic Man-agement (AIMS), Angers, France, June 6-9, 2005, pp. 1-28.
[30] M. Salgado, “Formation au Management: Les Vertus du Théâtre en Formation Continue et en Formation Initiale,” 14th Colloque National de la Recherche en IUT, Lyon- Villeurbanne, France, May 29-30, 2008a, pp. 1-8.
[31] M. Salgado, “Le Théâtre, un Outil de Formation au Man-agement,” Revue Française de Gestion, Vol. 34, No. 181, 2008b, pp. 77-96.
[32] N. Nomura and M. Akai, “Willingness to Pay for Green Electricity in Japan as Estimated through Contingent Valuation Method,” Applied Energy, Vol. 78, No. 4, 2004, pp. 453-463.
[33] A. Bryman and D. Cramer, “Quantitative Data Analysis for the Social Scientist with SPSS 15 & 16,” Routledge, London, 2006.

J. Service Science & Management, 2010, 3, 281-286 doi:10.4236/jssm.2010.32035 Published Online June 2010 (http://www.SciRP.org/journal/jssm)
Copyright © 2010 SciRes. JSSM
How Employees See Their Roles: The Effect of Interactional Justice and Gender
Naoki Ando1, Satoshi Matsuda2
1Faculty of Business Administration, Hosei University, Tokyo, Japan; 2Faculty of Foreign Studies, The University of Kitakyusyu, Kitakyusyu, Japan. Email: [email protected], [email protected] Received January 18th, 2010; revised February 20th, 2010; accepted April 2nd, 2010.
ABSTRACT
This study examines whether the perceived boundary between in-role and extra-role behaviors varies depending on workplace conditions, emphasizing how interactional justice influences an employee’s role definitions. We collect data through a questionnaire survey and adopt Tobit regressions for hypothesis testing. The study results indicate that per-ceived interactional justice enlarges the breadth of an employee’s role definitions. In addition, the positive impact of interactional justice on an employee’s role definition is strong when a supervisor-subordinate dyad comprises different genders. Keywords: Organizational Citizenship Behavior, Role Definition, Interactional Justice, Gender
1. Introduction
Human resource management is especially important for developing and sustaining competitive advantages in un- certain and volatile environments. Firms seeking to im-prove their efficiency and effectiveness need employees who are willing to exceed their formal job requirements [1]. An argument leads to the research stream of organ-izational citizenship behaviors (OCBs). In the growing body of research on OCBs, researchers assume that every dimension of OCB is an extra-role behavior for all em-ployees and that the boundary between extra-role and in-role behaviors does not depend on workplace condi-tions. However, some studies question whether or not a clear conceptual boundary exists between extra-role and in-role behaviors [1]. In response to this criticism, other researchers have examined whether a clear boundary between extra-role and in-role behaviors really exists or whether the boundary varies across employees [2-4]. They found evidence that a boundary between in-role and extra-role behaviors varies depending on workplace conditions and that extra-role behaviors and OCBs are distinctive constructs [4,5].
In line with the argument that a boundary between in-role and extra-role behaviors is not stable, this study contributes to the literature on OCBs through investigat-ing determinants of employees’ role definitions, empha-sizing how interactional justice affects employees’ per-ceptions of in-role/extra-role behaviors. We also examine
how the gender difference in a supervisor-subordinate dyad works as a moderator of the relationship between interactional justice and employees’ role definitions. Previous studies found that procedural justice has a posi-tive effect on the breadth of employees’ role definitions [3,6]. In comparison, the path through which interac-tional justice influences the breadth of employees’ role definitions has not received much attention from re-searchers. Thus, this study aims to explore a path through which interactional justice influences employees’ role definitions. By providing evidence that employees’ defi-nitions of their in-role behaviors are influenced by work-place conditions, this study contributes to the literature on OCBs.
The following sections briefly review the literature on the role definitions and then present hypotheses regard-ing factors that affect the breadth of role definitions. The subsequent sections explain the analytical method and present the results, concluding with implications of this study and suggestions for future research.
2. Literature Review
Previous studies assume that OCBs are extra-role behav-iors for all employees. Extra-role behaviors are neither specified in advance by role prescriptions nor sources of punitive consequences when not performed [7]. Re-searchers assume that every employee differentiates in-role from extra-role behaviors in the same manner and

How Employees See Their Roles: The Effect of Interactional Justice and Gender 282
performs OCBs as extra-role behaviors. But recent stud-ies report that a perceived boundary between in-role and extra-role behaviors can vary not only from one em-ployee to another but also between employees and super-visors [1,3,6]. For example, Morrison (1994) finds varia-tions in job definitions not only among employees but also between employees and supervisors [1]. Further, she observes that job satisfaction as well as emotional at-tachment and a sense of loyalty to an organization serve to enlarge employees’ job definitions. Her results indi-cate that when employees define their jobs broadly, they are more likely to engage in behaviors that many studies consider as extra-role [1]. Similarly, Coyle-Shapiro et al. (2004) confirm that employees who define their job re-sponsibilities broadly are more likely to engage in OCBs [6]. They also find that perceived procedural justice af-fects mutual commitment, which in turn, influences em-ployee-defined job breadth. Kamdar et al. (2006) exam-ine the moderating effect of employees’ personality on the relationship between procedural justice and role defi-nitions, finding that employees tend to define their jobs broadly when they perceive procedural justice [3]. Indi-vidual differences in personality expand or contract their role definitions. The authors further show that reciproca-tion wariness and perspective-taking moderate the rela-tionship between procedural justice and role definitions. Similarly to Morrison (1994) and Coyle-Shapiro et al. (2004), Kamdar et al. (2006) observe that job breadth positively affects employees’ OCBs and that employees’ perception of procedural justice influences their OCBs more strongly when their role definitions are narrow rather than broad.
These studies suggest that job definitions vary among employees and the boundary between in-role and ex-tra-role behaviors is neither clearly defined nor stable [1]. Employees may engage in behaviors that the literature views as extra-role because they consider them to be in-role [1,2]. In that case, identifying an employee’s boundary between in-role and extra-role behaviors is essential, along with enlarging an employee’s role defini-tions to elicit OCBs and improve organizational effi-ciency and effectiveness. However, frameworks for un-derstanding factors that affect the breadth of role defini-tions are yet to be substantially explored [3]. Researchers need to investigate how employees themselves define the breadth of their job responsibilities [1].
3. Hypotheses
The OCB literature proposes social exchange theory as theoretical ground to explain employees’ OCBs [8,9]. Social exchange generates an expectation of some future return for contributions, as in the case of economic ex-change; however, unlike an economic exchange, the ex-act nature of the return is unspecified in social exchange [10,11]. While economic exchange occurs on a quid pro
quo basis, social exchange is based on an individual’s belief that the other party to the exchange will fairly dis-charge its obligations in the long run [11,12]. Social ex-change also emphasizes the norms of reciprocity where the inducement that a party provides engenders a sense of obligation on the part of the other party [13]. This prompts reciprocal behaviors that help the first party attain his goals and the reciprocation maintains and sustains the exchange relationship [10,14].
The literature argues that organizational justice is a key determinant of employees’ OCBs [11,15,16]. Justice theory contends that employees’ work attitudes and be-haviors depend on the perceived justice of an organiza-tion’s procedures or a supervisor’s treatment [8,17,18]. While procedural justice pertains to the processes that lead to decision outcomes [19,20], interactional justice concerns how an individual is treated while a procedure is being carried out [19,21-23]. When employees think they are being treated fairly by their supervisors, they believe that the supervisor values and respects them as an organizational member and cares about their well-being [9,18,23]. They then seek to maintain a cordial relation-ship with the supervisor or the organization itself and feel obliged to reciprocate in some fashion. They may recip-rocate the supervisor or the organization with greater productivity and higher morale [8]. An alternative man-ner to reciprocate the supervisor’s fairness might be for employees to expand their role definitions beyond the normal requirements [2]. Previous studies showed that interactional justice is positively related to employees’ OCBs [16]. Employees may engage in OCBs as a result of their extended definition of in-role behaviors. These arguments lead to the prediction that employees extend their role definitions when they receive fair treatment from their supervisors. Accordingly, we hypothesize:
Hypothesis 1: Interactional justice is positively asso-ciated with the breadth of an employee’s role definitions.
Gender role theory suggests that employees in an or-ganization are embedded in culturally rooted expecta-tions about their gender role [24,25]. Gender may affect employees’ perception of what they should do in an or-ganization. External social pressure favors behavior con-sistent with culturally prescribed gender roles [24,25]. To obtain legitimacy in an organization embedded in social pressure, employees may define their in-role behavior in line with culturally- and socially-expected gender role. This argument suggests that when a gender difference exists between a supervisor and a subordinate, the super-visor’s expectation of the subordinate’s job definition might be different from the subordinate’s. The inconsis-tent expectation of job responsibilities may negatively affect the relationship between a supervisor and a subor-dinate [26]. In addition, demographic similarity in a su-pervisor-subordinate dyad relates to cognitive similarity [26,27]. This suggests that a supervisor-subordinate dyad
Copyright © 2010 SciRes. JSSM

How Employees See Their Roles: The Effect of Interactional Justice and Gender 283
of the same sex creates a common frame of reference, resulting in increased interpersonal attraction and com-munication [26]. Thus, same sex supervisor-subordinate dyads could enhance the quality of the relationship com-pared with different sex dyads.
When employees have a good relationship with their supervisors, they may want to extend their role defini-tions beyond the requirements formally assigned by their supervisor as an expression of positive feeling, regardless of their supervisor’s fair treatment. Their role definitions will depend less on the supervisor’s fair treatment when a subordinate and a supervisor are the same gender. In contrast, when the relationship between a supervisor and a subordinate is poor due to the difference in gender, the subordinate’s role definitions may be narrower. In this case, the supervisor’s actions may have a greater influ-ence on the subordinate’s decisions on the breadth of role definitions. Therefore, we hypothesize:
Hypothesis 2: The positive relationship between inter-actional justice and the breadth of an employee’s role definitions is stronger when the supervisor and subordi-nate are different genders.
4. Method
4.1 Data Collection
Participants in this study are undergraduate students at two public universities in Western Japan. We use a ques-tionnaire to collect the data for hypothesis testing which participants completed during class. All the questions refer to the participants’ current part-time jobs. Those without part-time jobs are excluded. Three hundred and seven undergraduate students participated in this study. The participants’ average age is 20.7 (s.d. = 2.6) and they have been at their current jobs 11.7 months (s.d. = 10.5). Among the participants, 118 are male and 189 are female. T-tests are conducted for several items to examine whether a significant difference exists between the two universi-ties; no significant differences were found between the two groups of participants.
The questionnaire was developed based on a literature review of related work. To ensure content validity, meas- urements used in previous studies were adopted and re-vised where necessary. The questionnaire was written first in English and then translated into Japanese. To en-sure construct equivalence and data comparability, a back-translation procedure was conducted. Pilot studies were carried out at the two universities, which formed the basis for modifying the wording of the questionnaire.
4.2 Measures
The dependent variable of this study is the breadth of an employee’s role definitions. This variable was operation-alized using the seven items developed by Pearce and Gregersen (1991) to measure extra-role behavior [28].
Their tool consisted of 10 items but since the participants in our study are undergraduates with part-time jobs, only seven items were used. The other three items are related with tasks not usually required for part-time employees. Following Coyle-Shapiro et al. (2004), we asked partici-pants to classify the seven items into two categories [6]: 1) I feel this is part of my work duty and 2) I feel this is something extra. A proxy for the breadth of role defini-tions are calculated as a ratio of items classified as 1) to the total items.
The independent variable of interest is interactional justice—the way an employee is treated during a proce-dure [19,21-23]. Interactional justice pertains to whether supervisors responsible for making a decision treat their subordinates with respect and dignity [19,21,29]. In this research, interactional justice is measured by using a six-item scale adopted from Moorman (1991) [16]. A five-point Likert scale that ranges from “strongly dis-agree” (1) to “strongly agree” (5) was used.
Gender difference in a supervisor-subordinate dyad is a moderator in this study. Participants reported their gender and their supervisor’s in the questionnaire. Dif-ferent sex supervisor-subordinate dyads are coded one and same sex dyads are coded zero.
In addition to the independent variable and the mod-erator, we control for participants’ length of work at their current part-time jobs. The log of work duration are cal-culated and used for this study. Gender of participants is not controlled for because it is highly correlated with the dummy variable that represents gender difference in a supervisor-subordinate dyad.
5. Results Table 1 shows descriptive statistics and a correlation matrix. Correlation coefficients in Table 1 are low over-all. It does not appear that any severe problem of multi-collinearity is present. To further detect potential multi-collinearity problem, variance inflation factors (VIF) are calculated. All VIF scores are much less than 10. Cron-bach’s alpha for interactional justice shows an acceptable level of internal consistency [30]. To check for common method variance derived from the same source in col-lecting all the data, Harman’s one-factor test is conducted, whereby all the items in the questionnaire are included in factor analysis. The result shows that neither a single factor nor a general factor accounts for the majority of the covariance of the variables. This result indicates the absence of a severe common method variance problem.
A Tobit model is used to test the hypotheses because the dependent variable is a proportion. A Tobit model is preferred to an ordinary least squares regression (OLS) analysis when a dependent variable is censored at some value on the left- and/or right side; OLS can lead to bi-ased coefficient estimates in such a case [31]. A dou-ble-censored Tobit model is employed for this empirical
Copyright © 2010 SciRes. JSSM

How Employees See Their Roles: The Effect of Interactional Justice and Gender
Copyright © 2010 SciRes. JSSM
284
study. Table 2 shows the results of Tobit regressions. Model
1 includes an independent variable, a moderator, and a control variable. As predicted in H1, interactional justice is positively and significantly associated with employees’ job breadth (p < 0.001). This result supports H1, indicat-ing that when employees perceive that they receive fair treatment from their supervisor, they tend to broadly de-fine their job responsibilities. The result of Model 1 in-dicates that gender difference in a supervisor-subordinate dyad itself does not significantly influence employees’ in-role/extra-role boundary. Model 2 adds an interaction term of interactional justice and gender difference in a supervisor-subordinate dyad. The result shows that the interaction term is positively and significantly associated with employees’ role breadth (p < 0.05). This result sup-ports H2, implying that when gender of a supervisor and a subordinate differs, the positive impact of interactional justice on a subordinate’s role definitions becomes stronger.
6. Discussion This study explores how employees form a perceived boundary between in-role and extra-role behaviors. Pre-vious studies argue that some activities viewed as ex-tra-role behaviors are likely to be in-role behaviors for certain groups of employees. The study result supported our contention that the manner in which a boundary be-tween in-role and extra-role behaviors is defined is not
common to all employees but varies depending on work-place conditions. We found that perceived interactional justice extends the breadth of an employee’s role defini-tions. In addition to the main effect of this factor, this study identified a more complex path through which in-teractional justice influences employees’ role definitions. The effect of interactional justice is likely to be moder-ated by gender difference between a supervisor and a subordinate. When the supervisor-subordinate dyad has two genders, interactional justice more extends a subor-dinate’s role definitions compared with a dyad comprised of the same gender.
Previous studies on determinants of an employee’s role definitions show that procedural justice enlarges the breadth of an employee’s job responsibilities [3,32]. As the results indicate, another component of organizational justice—interactional justice—is also likely to affect an employee’s perception of the boundary between in-role and extra-role behaviors. Along with procedural justice, it seems that interactional justice is one of the key deter-minants of the breadth of employees’ role definitions. Specifically, the effect of perceived interactional justice increases or decreases depending on gender differences in a supervisor-subordinate dyad. A supervisor’s actions play a more important role in enlarging employees’ role definitions when the relationship between a supervisor and a subordinate is expected to be poor. When dissimi-larity in demographic characteristics such as gender is
Table 1. Correlation matrix
Mean S.D. 1 2 3 4
1 Job breadth 0.666 0.231 1
2 Interactional justice 3.416 0.890 0.224 * 1
3 Gender difference 0.547 0.499 0.105 0.052 1
4 Work duration 2.035 1.047 0.007 –0.012 0.045 1
*p < 0.05
Table 2. Result of Tobit regressions
Model 1 Model 2
b S.E. b S.E.
Interactional justice 0.062 0.017 *** 0.024 0.024
Gender difference 0.047 0.030 –0.198 0.118 † Interactional justice *Gender difference
0.072 0.034 *
Work duration 0.003 0.014 0.004 0.014
Constant 0.440 0.067 *** 0.565 0.089 ***
Log likelihood –70.877 –68.602
Chi square 16.17 *** 20.72 ***
n 307 307
***p < 0.001 *p < 0.05 †p < 0.10
How Employees See Their Roles: The Effect of Interactional Justice and Gender 285
present, a subordinate may have difficulty communicat-ing with his/her supervisor or may not feel personal at-traction toward the supervisor, resulting in a poor rela-tionship. But even in this situation, supervisors can broaden employees’ role definitions by treating them fairly and appropriately. When a relationship between a supervisor and a subordinate is poor, the supervisor’s interactional justice has a greater effect on enlarging em-ployees’ role definitions.
Future research may engage in cross-cultural com-parisons. Using Japanese participants, this study exam-ines whether the approach to a boundary between in-role and extra-role behavior as proposed by social exchange theory is applicable to cultures that are not individualistic. Although a substantial part of the literature on OCBs is grounded in social exchange theory, researchers question the universality of explanations provided by social ex-change theory for employee attitudes and behaviors [13]. The degree of importance that people place on social exchanges might vary across cultures; people who see themselves as connected to others might assign greater importance to social exchanges than those who see themselves as distinct from others [8]. Therefore, deter-minants of role definitions in some cultures probably do not operate in other cultures. The increasingly global nature of firms makes it necessary for managers to un-derstand how determinants of role definitions differ across cultures.
The results presented here have some limitations. The use of student participants has, in some cases, been ques-tioned on grounds of external validity [33,34]. However, all the participants in this study have experience as part-time employees and are therefore capable of under-standing and answering the questionnaire. Moreover, sev-eral questionnaire items were modified to ensure that the participants could easily understand them. Future re-search needs to replicate this study at actual workplaces by using full-time employees as participants. In addition, the questionnaire does not verify whether respondents actually performed tasks they defined as in-role. Previous studies provide empirical evidence that employees who broadly defined their job responsibilities tend to engage in OCBs [1,2]. Therefore, future research should explore the conditions under which employees who defined broader job responsibilities actually engage in OCBs.
REFERENCES [1] E. W. Morrison, “Role Definitions and Organizational
Citizenship Behavior: The Importance of the Employee’s Perspective,” Academy of Management Journal, Vol. 37, No. 6, 1994, pp. 1543-1567.
[2] D. A. Hofmann, F. P. Morgeson and S. J. Gerras, “Cli-mate as a Moderator of the Relationship between Leader- member Exchange and Content Specific Citizenship: Safety Climate as an Exemplar,” Journal of Applied Psy-
chology, Vol. 88, No. 1, 2003, pp. 170-178.
[3] D. Kamdar, D. J. McAllister and D. B. Turban, “All in a Day’s Work: How Follower Individual Differences and Justice Perceptions Predict OCB Role Definitions and Behavior,” Journal of Applied Psychology, Vol. 91, No. 4, 2006, pp. 841-855.
[4] M. A. Vey and J. P. Campbell, “In-Role or Extra-Role Organizational Citizenship Behavior: Which Are we Measuring?” Human Performance, Vol. 17, No. 1, 2004, pp. 119-135.
[5] L. J. Williams and S. E. Anderson, “Job Satisfaction and Organizational Commitment as Predictors of Organiza-tional Citizenship and In-Role Behaviors,” Journal of Management, Vol. 17, No. 3, 1991, pp. 601-617.
[6] J. A. M. Coyle-Shapiro, I. Kessler and J. Purcell, “Ex-ploring Organizationally Directed Citizenship Behavior: Reciprocity or ‘It’s my Job?” Journal of Management Studies, Vol. 41, No. 1, 2004, pp. 85-106.
[7] L. Van Dyne and J. A. LePine, “Helping and Voice Ex-tra-Role Behaviors: Evidence of Construct and Predictive Validity,” Academy of Management Journal, Vol. 41, No. 1, 1998, pp. 108-119.
[8] J. Brockner, Y. R. Chen, E. A. Mannix, K. Leung and D. R. Skarlicki, “Culture and Procedural Fairness: When the Effects of What you Do Depend on How you Do it,” Ad-ministrative Science Quarterly, Vol. 45, No. 1, 2000, pp. 138-159.
[9] R. H. Moorman, G. L. Blakely and B. P. Niehoff, “Does Perceived Organizational Support Mediate the Relation-ship between Procedural Justice and Organizational Citi-zenship Behavior?” Academy of Management Journal, Vol. 41, No. 3, 1998, pp. 351-357.
[10] P. Blau, “Exchange and Power in Social Life,” Wiley, NY, 1964.
[11] M. A. Konovsky and S. D. Pugh, “Citizenship Behavior and Social Exchange,” Academy of Management Journal, Vol. 37, No. 3, 1994, pp. 656-669.
[12] J. G. Holmes, “The Exchange Process in Close Relation-ships: Microbehavior and Macromotives,” In: M. J. Lerner and S. C. Lerner, Eds., The Justice Motive in So-cial Behavior, Plenum, NY, 1981, pp. 261-284.
[13] J. L. Farh, R. D. Hackett and L. Liang, “Individual-Level Cultural Values as Moderators of Perceived Organiza-tional Support-Employee Outcome Relationships in China: Comparing the Effects of Power Distance and Tradition-ality,” Academy of Management Journal, Vol. 50, No. 3, 2007, pp. 715-729.
[14] L. Y. Sun, S. Aryee and K. S. Law, “High-Performance Human Resource Practices, Citizenship Behavior, and Organizational Performance: A Relational Perspective,” Academy of Management Journal, Vol. 50, No. 3, 2007, pp. 558-577.
[15] J. L. Farh, P. C. Earley and S. C. Lin, “Impetus for Action: A Cultural Analysis of Justice and Organizational Citi-zenship Behavior in Chinese Society,” Administrative Science Quarterly, Vol. 42, No. 3, 1997, pp. 421-444.
Copyright © 2010 SciRes. JSSM

How Employees See Their Roles: The Effect of Interactional Justice and Gender 286
[16] R. H. Moorman, “Relationship between Organizational Justice and Organizational Citizenship Behaviors: Do Fair- ness Perceptions Influence Employee Citizenship?” Jour-nal of Applied Psychology, Vol. 76, No. 6, 1991, pp. 845-855.
[17] R. Folger and M. A. Konovsky, “Effects of Procedural and Distributive Justice on Reactions to Pay Raise Deci-sions,” Academy of Management Journal, Vol. 32, No. 1, 1989, pp. 115-130.
[18] E. A. Lind and T. R. Tyler, “The Social Psychology of Procedural Justice,” Plenum, NY, 1988.
[19] J. Kickul, L. K. Gundry and M. Posig, “Does Trust Mat-ter? The Relationship between Equity Sensitivity and Per-ceived Organizational Justice,” Journal of Business Eth-ics, Vol. 56, No. 3, 2005, pp. 205-218.
[20] R. Pillai, T. A. Scandura and E. A. Williams, “Leadership and Organizational Justice: Similarities and Differences across Cultures,” Journal of International Business Stud-ies, Vol. 30, No. 4, 1999, pp. 763-779.
[21] R. J. Bies and J. S. Moag, “Interactional Justice: Commu-nication Criteria of Fairness,” Research on Negotiation in Organization, Vol. 1, 1986, pp. 43-55.
[22] S. S. Masterson, K. Lewis, B. M. Goldman and M. S. Taylor, “Integrating Justice and Social Exchange: The Differing Effects of Fair Procedures and Treatment on Work Relationships,” Academy of Management Journal, Vol. 43, No. 4, 2000, pp. 738-748.
[23] B. P. Niehoff and R. H. Moorman, “Justice as a Mediator of the Relationship between Methods of Monitoring and Organizational Citizenship Behavior,” Academy of Man-agement Journal, Vol. 36, No. 3, 1993, pp. 527-556.
[24] D. L. Kidder, “The Influence of Gender on the Perform-ance of Organizational Citizenship Behaviors,” Journal of Management, Vol. 28, No. 5, 2002, pp. 629-648.
[25] A. Eagly, S. J. Karau and M. G. Makajhani, “Gender and the Effectiveness of Leaders: A Meta-Analysis,” Psycho-
logical Bulletin, Vol. 117, No. 1, 1995, pp. 125-145.
[26] M. M. Suazo, W. H. Turnley and R. R. Mai-Dalton, “Characteristics of the Supervisor-Subordinate Relation-ship as Predictors of Psychological Contract Breach,” Journal of Managerial Issues, Vol. 20, No. 3, 2008, pp. 295-312.
[27] C. W. Allinson, S. J. Armstrong and J. Hayes, “The Ef-fects of Cognitive Style on Leader-Member Exchange: A Study of Manager-Subordinate Dyads,” Journal of Oc-cupational and Organizational Psychology, Vol. 74, No. 2, 2001, pp. 201-220.
[28] J. L. Pearce and H. B. Gregersen, “Task Interdependence and Extrarole Behavior: A Test of the Mediating Effects of Felt Responsibility,” Journal of Applied Psychology, Vol. 76, No. 6, 1991, pp. 838-844.
[29] D. L. Shapiro, E. H. Buttner and B. Barry, “Explanations: What Factors Enhance their Perceived Adequacy?” Or-ganizational Behavior and Human Decision Processes, Vol. 58, No. 3, 1994, pp. 346-368.
[30] J. Nunnally, “Psychometric Theory,” 2nd Edition, McGraw- Hill, NY, 1978.
[31] A. Delios and W. J. Henisz, “Japanese Firms’ Investment Strategies in Emerging Economies,” Academy of Man-agement Journal, Vol. 43, No. 3, 2000, pp. 305-323.
[32] B. J. Tepper, D. Lockhart and J. Hoobler, “Justice, Citi-zenship, and Role Definition Effects,” Journal of Applied Psychology, Vol. 86, No. 4, 2001, pp. 789-796.
[33] M. E. Gordon, L. A. Slade and N. Schmitt, “The ‘Science of the Sophomore’ Revisited: From Conjecture to Em-piricism,” Academy of Management Review, Vol. 11, No. 1, 1986, pp. 191-207.
[34] D. H. McKnight, V. Choudhury and C. Kacmar, “Devel-oping and Validating Trust Measures for E-Commerce: An Integrative Typology,” Information Systems Research, Vol. 13, No. 3, 2002, pp. 334-359.
Copyright © 2010 SciRes. JSSM