
Service Quality Regulation in Electricity Distribution
24
Service Quality Regulation in Electricity Distribution Necmiddin BAĞDADİOĞLU Orçun SENYÜCEL
-
Upload
fitzgerald-goodman -
Category
Documents
-
view
29 -
download
1
description
Service Quality Regulation in Electricity Distribution. Necmiddin BAĞDADİOĞLU Orçun SENYÜCEL. Objectives. Incorporate service quality measure into electricity regulation. New in literature : Growitsch et al (2008), Coelli et al (2008-Draft) - PowerPoint PPT Presentation
Transcript of Service Quality Regulation in Electricity Distribution

Service Quality Regulation in Electricity Distribution
Necmiddin BAĞDADİOĞLU
Orçun SENYÜCEL

Objectives
Incorporate service quality measure into electricity regulation. New in literature : Growitsch et al (2008), Coelli et al (2008-Draft)
Determine technical efficiency of Turkish electricity distribution utilities
Focus on exogeneous determinants of inefficiency Analyze effects of electricity losses and illegal usage
on TE.

Turkish Electricity Reform
Electricity Sector Reform and Privatization Strategy Paper (2004): TEDAS 2012
Transitory period: 20 utilites through mergers of 79 distribution utilities.
ESRPSP: mergers determined by operational problems, technical & financial features.
Turkey accession country. EU Energy Acquis EMRA has not announced regulatory
framework
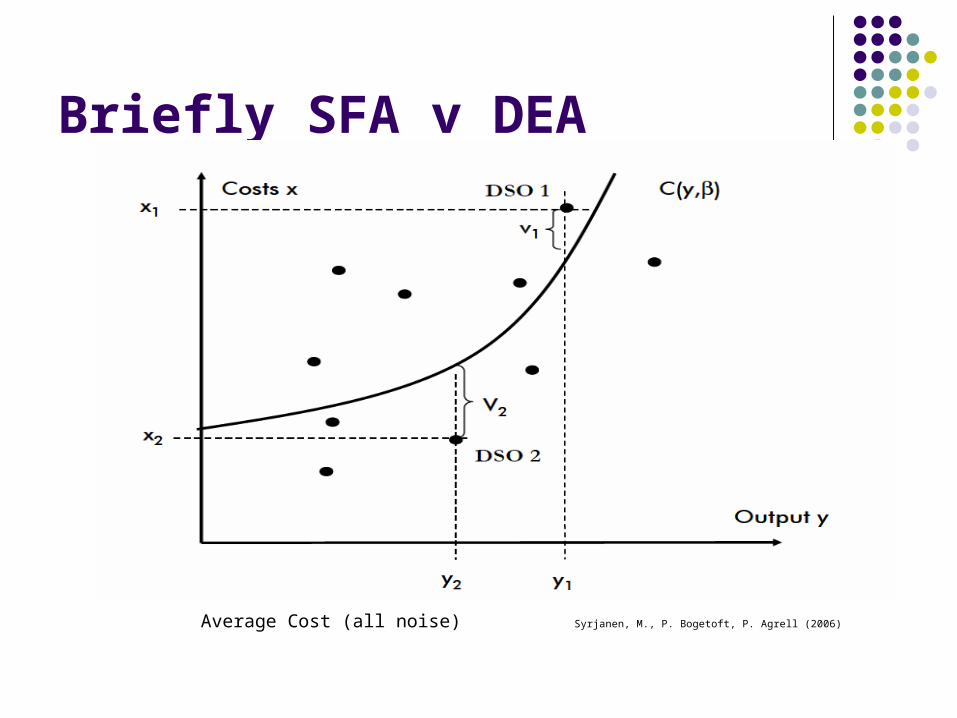
Briefly SFA v DEA
Average Cost (all noise) Syrjanen, M., P. Bogetoft, P. Agrell
(2006)

Briefly SFA v DEA
Deterministic frontier (all ineff u) Syrjanen, M., P. Bogetoft, P. Agrell (2006)

Briefly SFA v DEA
Stochastic frontier (both noise v and ineff u) Syrjanen, M., P. Bogetoft, P. Agrell (2006)

Briefly SFA
Two component error terms, first captures statistical noise
Second captures effects of TE.
Half normal, exponential, truncated dist.
2,0~ vNv
0u
Distance Functions
DF: Distance of the prod to PPB Two different types: input & output DF Input DF: How much input vector can be
contracted (output constant) Output: Vice versa.
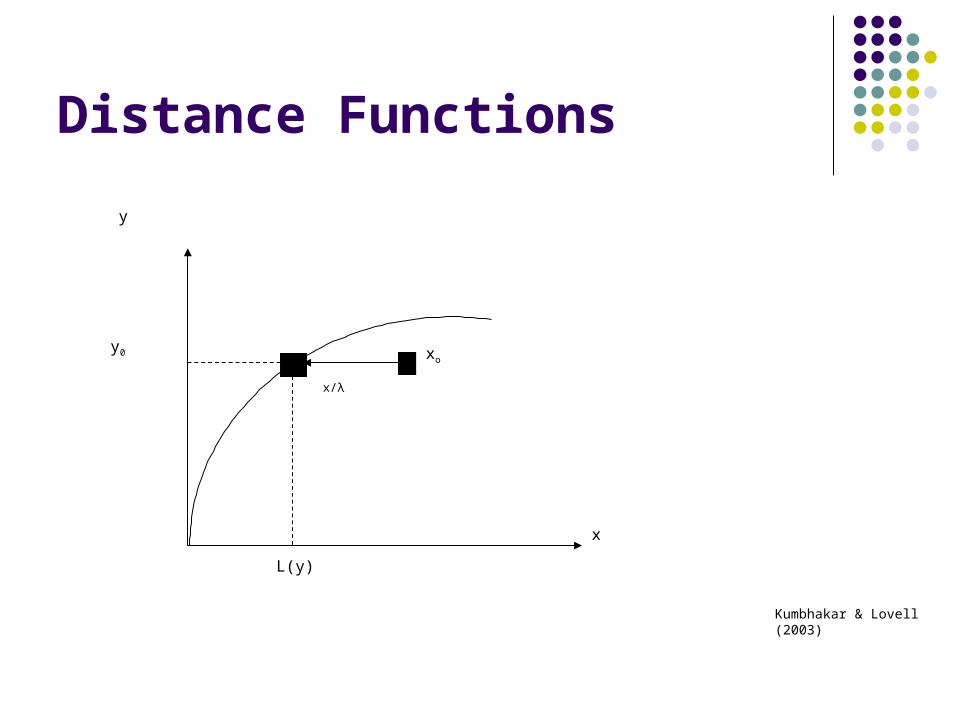
Distance Functions
x
y
L(y)
xo
x/λ
y0
Kumbhakar & Lovell (2003)
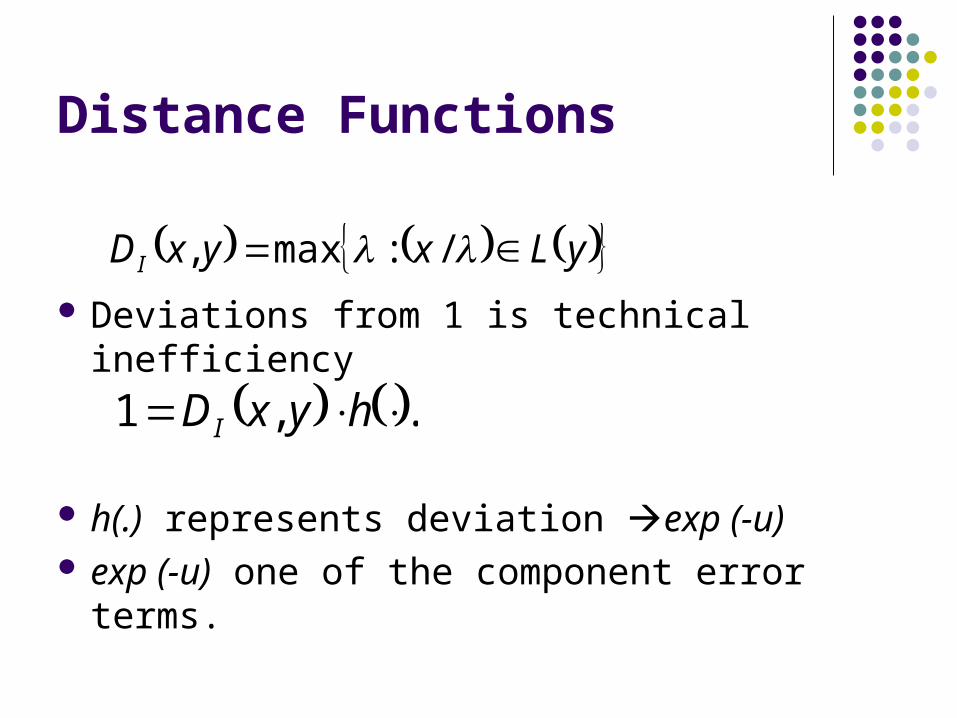
Distance Functions
Deviations from 1 is technical inefficiency
h(.) represents deviation exp (-u) exp (-u) one of the component error terms.
yLxyxDI /:max,
.,1 hyxDI
Distance Functions
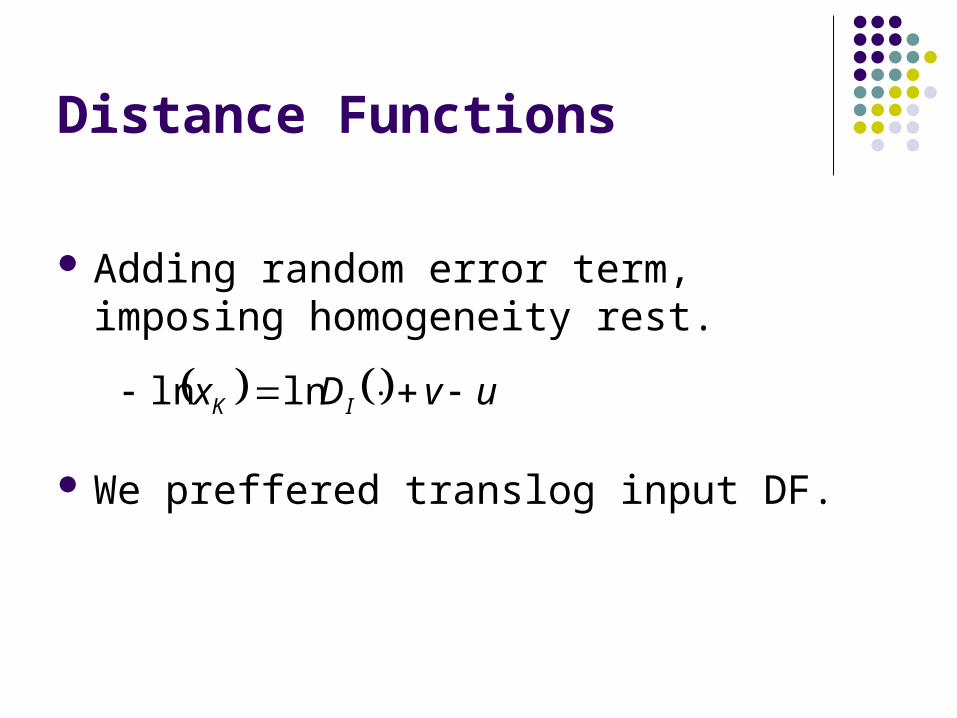
Adding random error term, imposing homogeneity rest.
We preffered translog input DF.
uvDx IK lnln

Methodology
Following Coelli, (M outputs K inputs)
ititmitkit
K
k
M
mkmlitkit
K
k
K
lkl
M
m
M
m
N
n
K
kkitknitmitmnmitmKit
uvyxxx
xyyyx
lnln2
1ln
2
1
lnlnln2
1lnln
*1
1 1
**1
1
1
1
1 1 1
1
1
*0
Kitkitkit xxx /* Kitlitlit xxx /*

Methodology
Following Coelli and Battese,
Two environmental variables
),( 2~ uitNu
it
itit z 0
Models
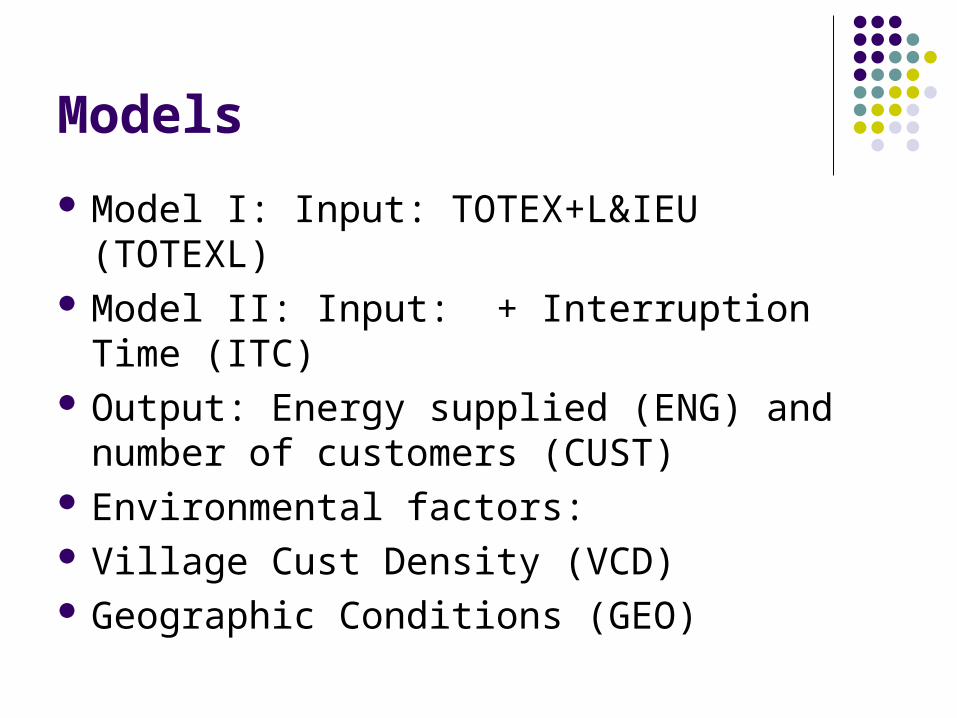
Model I: Input: TOTEX+L&IEU (TOTEXL) Model II: Input: + Interruption Time (ITC) Output: Energy supplied (ENG) and number
of customers (CUST) Environmental factors: Village Cust Density (VCD) Geographic Conditions (GEO)

Model I
ititititit
itititit
uvCUSTENGCUST
ENGCUSTENGTOTEXL
lnlnln2
1
ln2
1lnln
1ln
122
22
211210
iitit GEOVCD 210
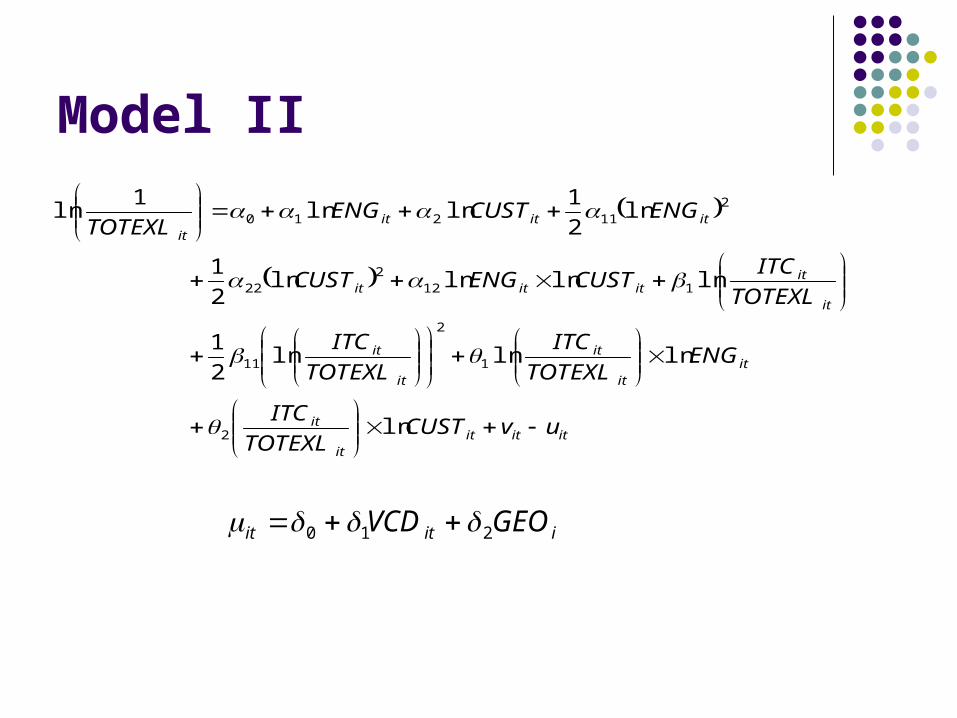
Model II
itititit
it
itit
it
it
it
it
itititit
itititit
uvCUSTTOTEXL
ITC
ENGTOTEXL
ITC
TOTEXL
ITC
TOTEXL
ITCCUSTENGCUST
ENGCUSTENGTOTEXL
ln
lnlnln2
1
lnlnlnln2
1
ln2
1lnln
1ln
2
1
2
11
1122
22
211210
iitit GEOVCD 210
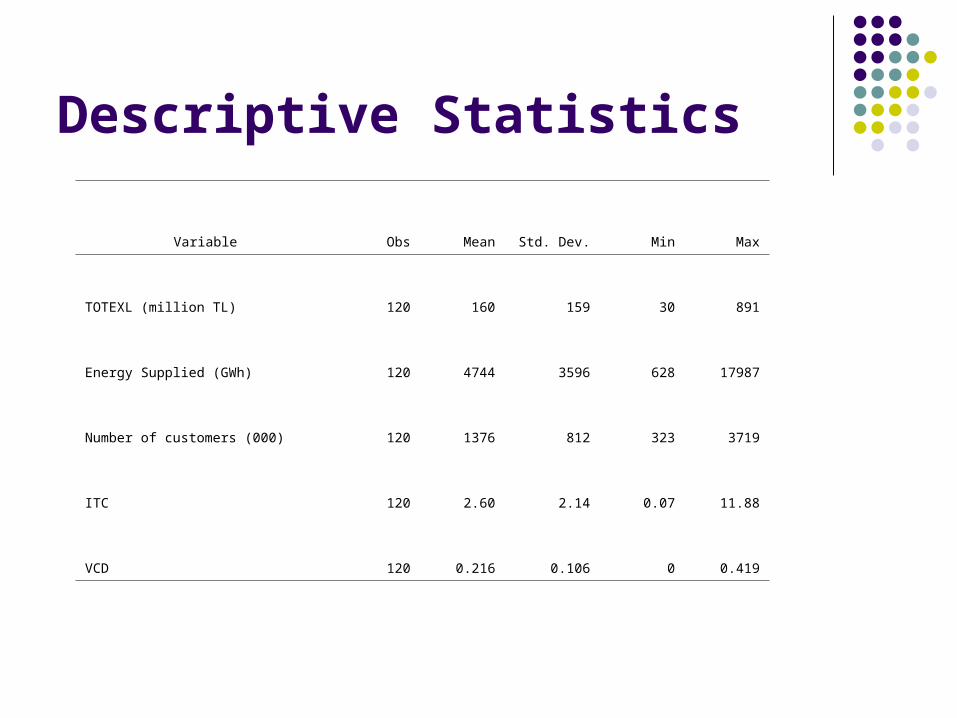
Descriptive Statistics
Variable Obs Mean Std. Dev. Min Max
TOTEXL (million TL) 120 160 159 30 891
Energy Supplied (GWh) 120 4744 3596 628 17987
Number of customers (000) 120 1376 812 323 3719
ITC 120 2.60 2.14 0.07 11.88
VCD 120 0.216 0.106 0 0.419

Model I
2
Variables Coefficient t-ratio
Constant 0.5223 0.7
ln ENG (y1) -0.3429*** -2.8
ln CUST (y2) -0.7294** -4.8
y12 -0.1342 -0.3
y22 -1.0085 -1.5
y1y2 0.3645 0.7
VCD 3.8507** 2.0
GEO 6.4172* 1.7
0.6373*** 2.8
0.9023*** 23.5
LLF -36.0925Note: ***, ** and * denotes significance at the 1, 5 and 10 % levels.
)/( 222vuu
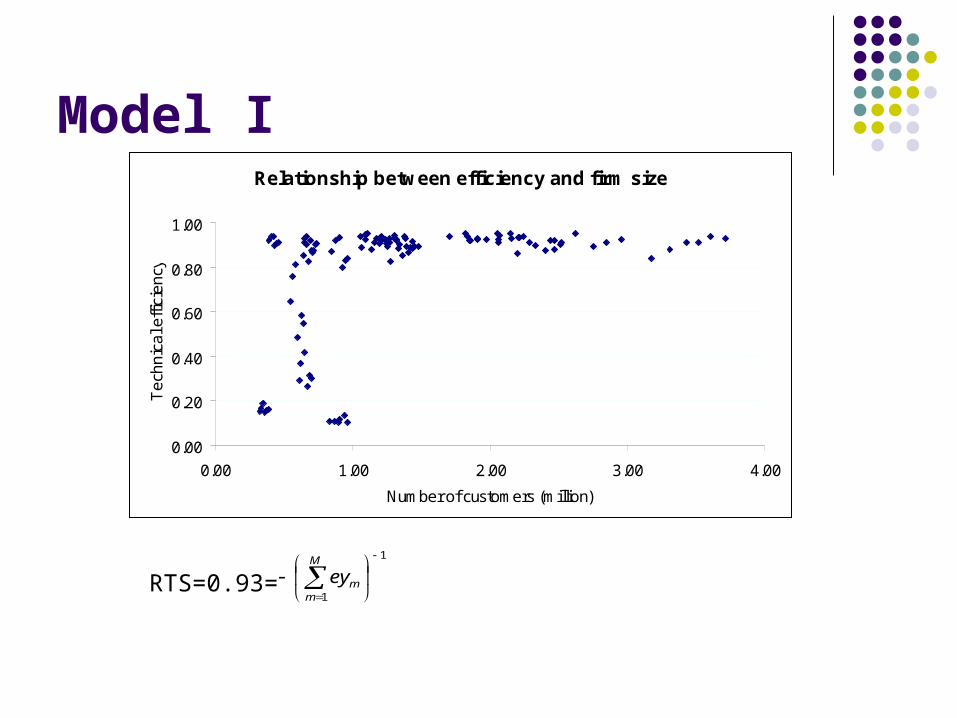
Model IRelationship between efficiency and firm size
0.00
0.20
0.40
0.60
0.80
1.00
0.00 1.00 2.00 3.00 4.00
Number of customers (million)
Te
chn
ica
l effi
cie
ncy
1
1
M
mmeyRTS=0.93=
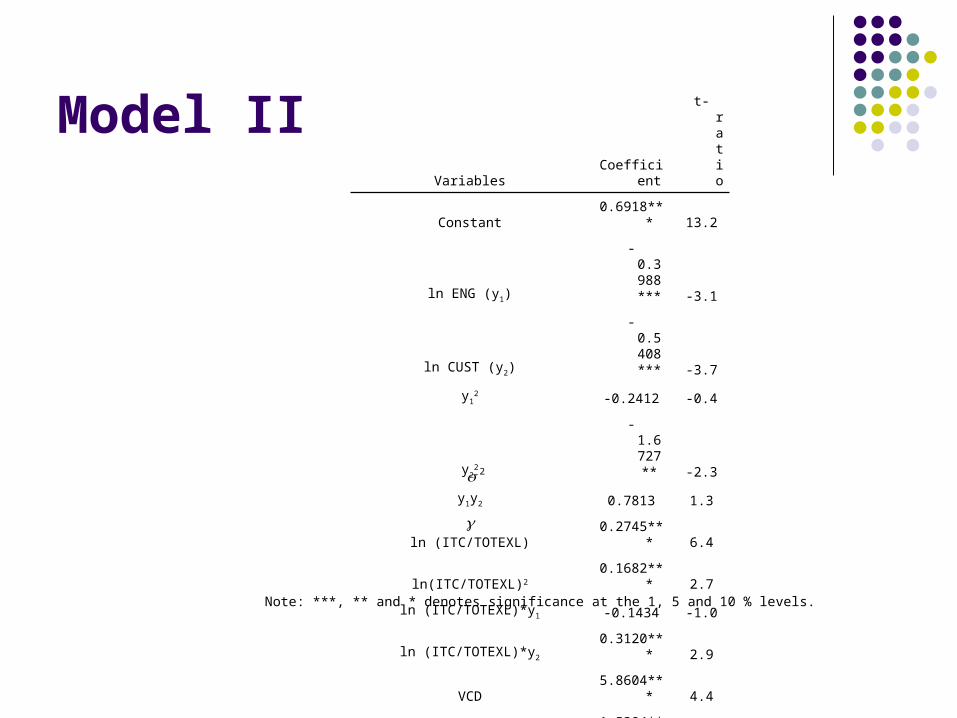
Model II
2
Variables Coefficient t-ratio
Constant 0.6918*** 13.2
ln ENG (y1) -0.3988*** -3.1
ln CUST (y2) -0.5408*** -3.7
y12 -0.2412 -0.4
y22 -1.6727** -2.3
y1y2 0.7813 1.3
ln (ITC/TOTEXL) 0.2745*** 6.4
ln(ITC/TOTEXL)2 0.1682*** 2.7
ln (ITC/TOTEXL)*y1 -0.1434 -1.0
ln (ITC/TOTEXL)*y2 0.3120*** 2.9
VCD 5.8604*** 4.4
GEO 1.5384*** 6.3
0.2293*** 3.3
0.9129*** 19.8
LLF 12.7273Note: ***, ** and * denotes significance at the 1, 5 and 10 % levels.
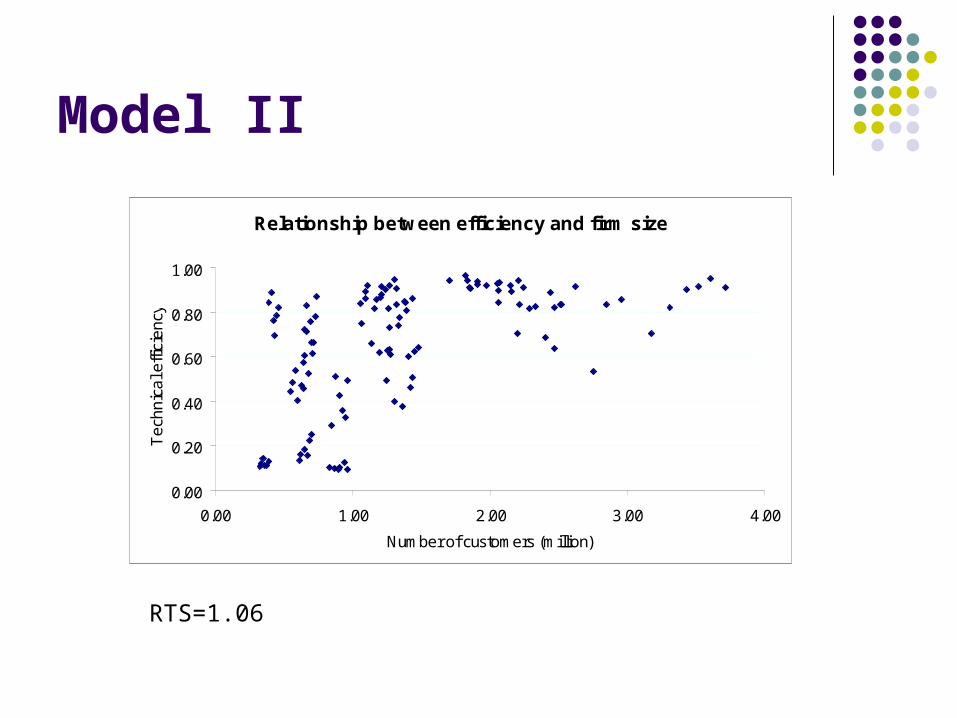
Model II
Relationship between efficiency and firm size
0.00
0.20
0.40
0.60
0.80
1.00
0.00 1.00 2.00 3.00 4.00
Number of customers (million)
Te
chn
ica
l effi
cie
ncy
RTS=1.06

Average efficiency scores
Quality excluded model Quality included model
Small utilities 0.60 0.43
Medium utilities 0.91 0.77
Large utilities 0.91 0.84
Total 0.79 0.65
QoS has significant effect: TE decreased by 16.5%
LLR test also states QoS important
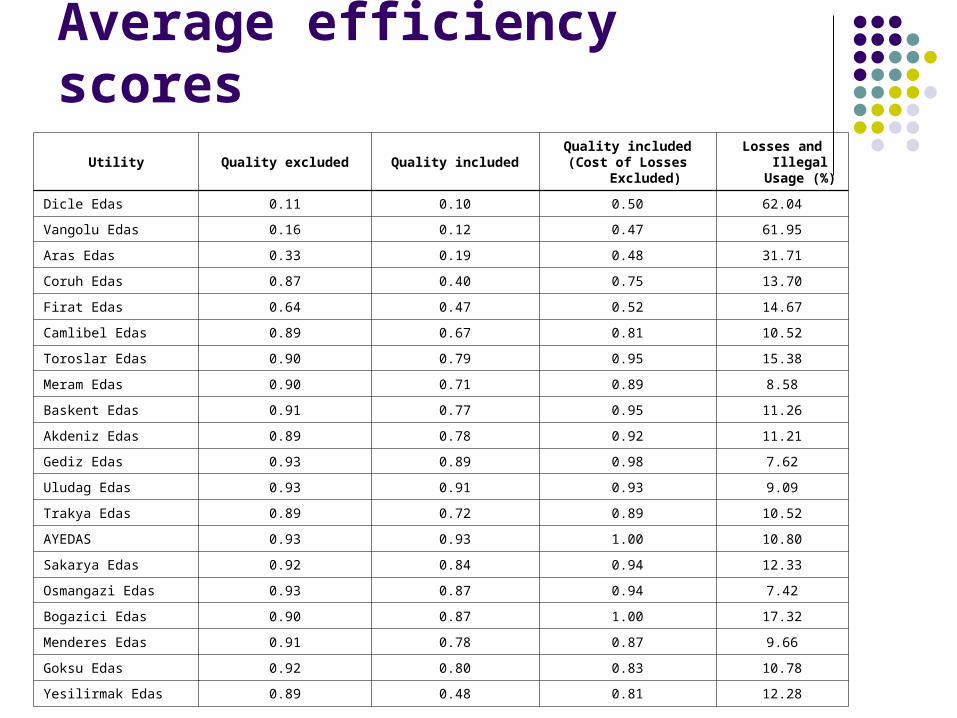
Utility Quality excluded Quality includedQuality included(Cost of Losses
Excluded)
Losses and Illegal
Usage (%)
Dicle Edas 0.11 0.10 0.50 62.04
Vangolu Edas 0.16 0.12 0.47 61.95
Aras Edas 0.33 0.19 0.48 31.71
Coruh Edas 0.87 0.40 0.75 13.70
Firat Edas 0.64 0.47 0.52 14.67
Camlibel Edas 0.89 0.67 0.81 10.52
Toroslar Edas 0.90 0.79 0.95 15.38
Meram Edas 0.90 0.71 0.89 8.58
Baskent Edas 0.91 0.77 0.95 11.26
Akdeniz Edas 0.89 0.78 0.92 11.21
Gediz Edas 0.93 0.89 0.98 7.62
Uludag Edas 0.93 0.91 0.93 9.09
Trakya Edas 0.89 0.72 0.89 10.52
AYEDAS 0.93 0.93 1.00 10.80
Sakarya Edas 0.92 0.84 0.94 12.33
Osmangazi Edas 0.93 0.87 0.94 7.42
Bogazici Edas 0.90 0.87 1.00 17.32
Menderes Edas 0.91 0.78 0.87 9.66
Goksu Edas 0.92 0.80 0.83 10.78
Yesilirmak Edas 0.89 0.48 0.81 12.28
Average efficiency scores
Conclusion
QoS impact on TE. GEO & VCD are crucial environmental variables.
Excl. losses and illegal electricity usage overestimates TE.
Privatization: Eight utilities are established far from the optimal size and have low average efficiency scores (0.43). TPA may merge other six utilities.