The Economic Significance of the Pharmaceutical Wholesaler in South Africa's Health Care

Service quality of a pharmaceutical wholesaler in South Africa
H Barnard
orcid.org 0000-0002-8731-0532
Mini-dissertation submitted in partial fulfilment of the requirements for the degree Master of Business Administration
at the North-West University
Supervisor: Prof CA Bisschoff
Graduation ceremony: May 2019
Student number: 21184283

ii
ABSTRACT
The study investigates the measurement of service quality at a pharmaceutical
wholesaler in South Africa. A number of pharmaceutical wholesalers distribute
medical supplies throughout South Africa in a very regulated and competitive market
where high service quality levels are expected. In this undifferentiated market,
service quality can have a significant impact on the competitiveness a
pharmaceutical wholesaler. As a result, a study with the primary objective to
determine the current service quality levels of a large pharmaceutical wholesaler was
therefore needed. The literature study compiled an industry profile of the South
African Pharmaceutical market, analysed service quality and then proposed an
adapted SERVQUAL model to measure the service quality. A review of the literature
also highlighted the general structure of the pharmaceutical industry and the
regulatory framework in the supply of pharmaceutical products. The literature also
focuses specifically on the role and function of the pharmaceutical wholesaler in the
supply chain. Data was collected from clients of a pharmaceutical wholesaler using
an electronic platform (GoogleForms) to record service expectations and perceptions
on a 7-point Likert scale. Some 4468 industry-adapted SERVQUAL survey
questionnaires were emailed to clients of which 385 were completed and returned
(signifying an 8.6% response rate). The analysed data returned a Cronbach alpha
coefficient larger than 0.80 and therefore deemed reliable. Gap 5 of the SERVQUAL
model was specifically scrutinised. The results show that in all five dimensions,
expectations exceeded perceived service. The service dimension Assurance showed
the biggest gap while Tangibility had the smallest gap. Further analysis using
exploratory factor analysis identified three underlying service quality variables,
namely Positive employee actions, Business process management and Marketing
channels. These factors explained a favourable cumulative variance of 67.7%. The
study also proposes a model to measure service quality in the pharmaceutical
wholesale industry.
Keywords: Service quality, pharmaceutical wholesaler, SERVQUAL model,
customer satisfaction, loyalty, antecedents

iii
ACKNOWLEDGEMENTS
I want to express my gratitude to the following people for their assistance during the
MBA degree and the completion of this mini-dissertation.
My wife Linel, for her sustained and loving support, motivation, assistance,
sacrifices, understanding and late-night coffees during my MBA studies. Without
you this degree would not have been possible at all.
Prof. Christo Bisschoff and his family for their expert advice, assistance and
guidance during the completion of this study. Also, for the language editing for
this mini-dissertation done by his wife, Antoinette Bisschoff.
God, our father, who gave me the capacity and the opportunities to further my
talents.
My parents, for their love and support, and also the foundation they laid and
good upbringing full of valuable life lessons.
Annalize Lombaard and the rest of my colleagues, for their support and inputs.
My friends and fellow students who assisted me during the studies, your
contributions will never be forgotten.

iv
TABLE OF CONTENTS
ABSTRACT.............................................................................................................................. ii
ACKNOWLEDGEMENTS .................................................................................................... iii
TABLE OF FIGURES ........................................................................................................... vii
LIST OF TABLES ................................................................................................................ viii
CHAPTER 1: NATURE AND SCOPE OF THE STUDY .................................................. 1
1.1 INTRODUCTION ....................................................................................................... 1
1.2 PROBLEM STATEMENT ........................................................................................ 4
1.3 OBJECTIVES ............................................................................................................ 5
1.4 RESEARCH METHODOLOGY .............................................................................. 6
1.4.1 Literature ................................................................................................................... 6
1.4.2 Questionnaire .......................................................................................................... 7
1.4.3 Study population ..................................................................................................... 7
1.4.4 Location of a unit of analysis .............................................................................. 7
1.4.5 Accessibility of unit of analysis .......................................................................... 7
1.4.6 Suitability of unit of analysis ............................................................................... 8
1.4.7 Statistical analysis and decision criteria.......................................................... 8
1.4.8 Ethical considerations ........................................................................................... 8
1.5 PROBLEMS ENCOUNTERED ............................................................................... 8
1.6 DELIMITATIONS AND ASSUMPTIONS .............................................................. 8
1.6.1 Delimitations (Scope) ............................................................................................ 8
1.6.2 Assumptions ............................................................................................................ 9
1.7 LAYOUT OF THE STUDY .................................................................................... 10
1.8 SUMMARY ............................................................................................................... 10
CHAPTER 2: LITERATURE REVIEW .............................................................................. 11
2.1 INTRODUCTION ..................................................................................................... 11
2.2 SOUTH AFRICAN PHARMACEUTICAL WHOLESALE CONTEXT ............ 11
2.2.1 Features of South African pharmaceutical markets.................................... 11
2.2.1.1 Manufacturer level ........................................................................................................... 12
2.2.1.2 Wholesaler/distributor level ........................................................................................... 12

v
2.2.1.3 Retail level .......................................................................................................................... 12
2.2.2 Licensing and the Supply Chain ....................................................................... 13
2.2.3 Pricing Regulations: Single Exit Price ............................................................ 13
2.2.4 The Logistics fee ................................................................................................... 14
2.2.5 Pharmaceutical wholesaler’s functions in South Africa ............................ 15
2.3 SERVICE QUALITY ............................................................................................... 17
2.3.1 Definition of services ........................................................................................... 17
2.3.2 Characteristics of services ................................................................................ 18
2.3.2.1 Intangibility ......................................................................................................................... 18
2.3.2.2 Inseparability ..................................................................................................................... 19
2.3.2.3 Heterogeneity .................................................................................................................... 19
2.3.2.4 Perishability ........................................................................................................................ 20
2.3.2.5 Lack of ownership ............................................................................................................ 20
2.3.4 Quality Service ...................................................................................................... 20
2.4 The SERVQUAL model ........................................................................................ 23
2.4.1 Historical overview of the SERVQUAL model ............................................... 23
2.4.2 The SERVQUAL model ........................................................................................ 25
2.4.4 Strengths and shortcomings of the SERVQUAL model ............................. 28
2.4.3 Application of the SERVQUAL MODEL in the health industry ................. 29
2.5 SUMMARY ............................................................................................................... 30
CHAPTER 3: RESEARCH METHODOLOGY AND RESULTS.................................... 31
3.1 INTRODUCTION ..................................................................................................... 31
3.2 RESEARCH METHODOLOGY ............................................................................ 31
3.2.1 Questionnaire design .......................................................................................... 31
3.2.2 Study population ................................................................................................... 33
3.2.3 Location of a unit of analysis ............................................................................ 33
3.2.4 Accessibility of unit of analysis ........................................................................ 34
3.2.5 Suitability of unit of analysis ............................................................................. 34
3.2.6 Data collection ....................................................................................................... 35
3.2.7 Statistical analysis and decision criteria........................................................ 35
3.2.8 Ethical considerations ......................................................................................... 37
3.3 RESULTS ................................................................................................................. 38

vi
3.3.1 Demographic analysis ......................................................................................... 38
3.3.2 SERVQUAL GAP 5 analysis ............................................................................. 439
3.3.3 Influence of demographics on the perceived service quality ................... 48
3.3.3.1 Delivery method .................................................................................................... 48
3.3.3.2 Type of customer .................................................................................................. 49
3.3.3 Exploratory factor analysis ................................................................................ 50
3.3.4.1 Kaiser-Meyer-Olkin and Bartlett‟s test ....................................................................... 50
3.3.4.2 Exploratory factor analysis ............................................................................................ 51
3.4 AN INTEGRATED MODEL TO MEASURE CUSTOMER SERVICE AT A
PHARMACEUTICAL WHOLESALER ................................................................ 54
3.5 SUMMARY ............................................................................................................... 56
CHAPTER 4: CONCLUSIONS AND RECOMMENDATIONS ...................................... 58
4.1 INTRODUCTION ..................................................................................................... 58
4.2 CONCLUSIONS ...................................................................................................... 58
4.3 RECOMMENDATIONS.......................................................................................... 60
4.4 AREAS FOR FUTURE RESEARCH ................................................................... 61
4.5 SUMMARY ............................................................................................................... 62
REFERENCE LIST ............................................................................................................... 65
APPENDIX A: CUSTOMER SERVICE SURVEY .......................................................... 71
APPENDIX B: EDITOR’S CERTIFICATE ....................................................................... 75

vii
TABLE OF FIGURES
Figure 1.1: The pharmaceutical supply chain ............................................................. 2
Figure 1.2: The number of pharmaceutical wholesalers per province, 2018 .............. 3
Figure 1.3: The number of community pharmacies per province, 2018 ..................... 3
Figure 2.1: SERVQUAL model dimensions .............................................................. 26
Figure 3.1: Data analyses decision-tree .................................................................. 37
Figure 3.2: Expectation and Perception .................................................................. 40
Figure 3.3: Average expected and perceived service per dimension ...................... 41
Figure 3.4: Assurance ............................................................................................. 44
Figure 3.5: Empathy ................................................................................................ 45
Figure 3.6: Responsiveness .................................................................................... 46
Figure 3.7: Reliability ............................................................................................... 46
Figure 3.8: Tangibles ............................................................................................... 47
Figure 3.9: Courier and Local customers ................................................................ 49
Figure 3.10: Pharmacies, Doctors and Other .......................................................... 50
Figure 3.11: An integrated model to measure customer service at a pharmaceutical wholesaler ....................................................................................................... 50

viii
LIST OF TABLES
Table 3.1: Statistical techniques employed and decision criteria ............................ 36
Table 3.2: SERVQUAL GAP 5 results ...................................................................... 39
Table 3.3: Average expected and perceived service per dimension ........................ 41
Table 3.4: Standard deviation and effect size ......................................................... 42
Table 3.5: Effect size per dimension ........................................................................ 43
Table 3.6: Reliability coefficient ................................................................................ 48
Table 3.7: Courier and Local customers ................................................................... 49
Table 3.8: Pharmacies, Doctors and Other .............................................................. 50
Table 3.9: Barlett test and Kaiser-Meyer-Olikin measure ......................................... 51
Table 3.110: Factor Analysis .................................................................................... 52

1
CHAPTER 1: NATURE AND SCOPE OF THE STUDY
1.1 INTRODUCTION
The South African pharmaceutical wholesaler forms part of the supply chain of
pharmaceutical products. Its customers are all healthcare-providing institutions
focusing on public and private healthcare providers. Some pharmaceutical
wholesalers distribute medical supplies throughout South Africa, and similarly to any
other business, they need to remain competitive; here typical strategic competitive
thrusts like customer service and satisfaction are employed to compete actively in
the health market (Antonie et al., 2018). Pharmaceutical wholesalers and its
customers operate in a very regulated and competitive market where a high quality
of service is expected; making the interaction and service received from the
wholesaler all the more critical (Bangalee & Suleman, 2015:522:). The quality of
service received from the wholesaler could strongly affect the service a patient
receives from the wholesaler‟s customer and as such the wholesaler can directly
affect the business performance, profitability, customer loyalty, and customer
satisfaction of its customers (Mehralian et al., 2016:973).
It is common practice that most of a wholesaler‟s customers have accounts with
some pharmaceutical wholesalers to prevent shortages and to compare product
prices. This business practice makes the principle of being the supplier of choice and
resultant customer loyalty all the more difficult to achieve for pharmaceutical
wholesalers (Ball, 2011). The customers expect to receive pharmaceutical quality
products at a competitive price on time. Any errors from the wholesaler are
unacceptable because of the direct impact it can have on the service quality
provided by the health service providers to their customers and also on their patients‟
health and safety. Furthermore, the severe competition in the wholesale health
industry and the resultant low-price margins of medicine, most pharmacies and
doctors are forced to keep smaller quantities of stock on hand and ordering more
frequently, thus making quick deliveries a highly competitive advantage for
pharmaceutical wholesalers.
According to the South African Pharmacy Council (2018) there are 216
pharmaceutical wholesalers registered in South Africa. Pharmaceutical wholesalers
are in intense competition with each other, trying to grow their market share by
taking business from their rivals, thus making service satisfaction of customers

2
critical for pharmaceutical wholesalers (Mehralian et al., 2016:973). Figure 1.1 is a
diagram from ImpactRX that shows how fragmented and complex the
pharmaceutical supply chain is and shows where the pharmaceutical wholesaler and
its customers fit in the supply chain of pharmaceutical products.
Figure 1.1: The pharmaceutical supply chain
Source: ImpactRx (2017)(ImpactRx, 2016)
Figure 1.2 illustrates the distribution of pharmaceutical wholesalers in South Africa
and figure 1.3 shows the distribution of pharmacies, which are the main customers of
pharmaceutical wholesalers. The number of wholesalers per province is about the
number of pharmacies and population per province. Pharmaceutical wholesalers
compete with service quality and reducing the time-to-market period of
pharmaceutical products. The biggest number of pharmaceutical wholesalers is
found in Gauteng (120), followed by the Western Cape (33) pharmaceutical
wholesalers. The Eastern Cape has the third most pharmaceutical wholesalers (23).

3
Figure 1.2: The number of pharmaceutical wholesalers per province, 2018
Source: South African Pharmacy Council (2018)
Figure 1.3: The number of community pharmacies per province, 2018
Source: South African Pharmacy Council (2018)
According to the Helen Suzman Foundation‟s report on the supply of
pharmaceuticals in South Africa the top 15 pharmaceutical wholesalers in South
Africa accounts for over 95% of wholesale turnover (Antonie et al., 2018). These top
0
20
40
60
80
100
120
140
EC FS GP KZN LP MP NW NC WC
Nu
mb
er
Provinces
0
200
400
600
800
1000
1200
1400
EC FS GP KZN LP MP NW NC WC
Nu
mb
er
Provinces

4
pharmaceutical wholesalers all focus on service quality and promote the following
service qualities:
Availability of a wide range of products
Competitive prices
Quick, free deliveries
Professional and high-quality service
Simple invoicing / financial relationship
Overall customer relationships
1.2 PROBLEM STATEMENT
Pharmaceutical wholesalers compete with each other by providing the same
pharmaceutical products and services mainly to private healthcare institutions, and
its customer base can include independent and retail pharmacies, doctors, other
wholesalers, hospitals, clinics, veterinary facilities, health shops, homeopaths and
export customers.
The current regulations on the price of medicine in South Africa that implies a single
exit price entail that pharmaceutical wholesalers can no longer compete or use lower
prices as a commercial strategic business advantage. The single exit price on
medicine makes it almost impossible for customers to differentiate pharmaceutical
wholesalers on the cost of products and customers moved their focus to the overall
quality of service received from pharmaceutical wholesalers, for example, delivery
times, ordering errors and consistency. This change in customer focus forces the
pharmaceutical wholesalers to shift their core focus from buying in bulk, towards get
better deals and promote products at lower prices to overall high-quality service to
differentiate itself from other pharmaceutical wholesalers. At this moment they can
gain a competitive advantage as the marketing literature is in general agreement that
superior service quality is a critical success factor where there is intense competition.
Service quality‟s empirical link to customer satisfaction has turned service quality into
a core marketing instrument (Niaz et al., 2009:26).
Previous studies indicate that understanding how the customers define service
quality and adapting the service rendered to what fulfil the customers‟ expectations,
can have a positive impact on the market share, profit and cost savings of an
organisation (Ramamoorthy et al., 2018:834).

5
In the current economic and competitive environment, it has become more critical for
pharmaceutical wholesalers to understand the perceived service provided to its
customers to differentiate itself from its competitors.
As service quality can have a significant impact on the financial performance of the
pharmaceutical wholesaler, a study is needed to determine the current perceived
service quality. It is further a necessity to evaluate the impact of high service quality
on customer satisfaction. This study aims to gain knowledge in how customers of the
pharmaceutical wholesaler judge service quality and determine what gaps the
pharmaceutical wholesaler should address to provide a higher quality service and
meet customers‟ expectations.
1.3 OBJECTIVES
The primary objective of this study is to measure the service quality at a
pharmaceutical wholesaler.
The secondary objectives are to:
Determine the perceived level of customer service the retail customers
receive from the pharmaceutical wholesaler
Determine the perceived level of customer service the retail customers expect
from the pharmaceutical wholesaler
Determine the difference (Gap 5) between the service levels
Identify possible correlations between the general business and demographic
variables and the service gaps
Determine the factors that influence the quality of service provided by a
pharmaceutical wholesaler
Formulate managerial interventions to improve service levels to customers
These objectives are serviced using data from a survey distributed to a specific
pharmaceutical wholesaler‟s customers. In accordance to the Parasuraman model of
customer service (Parasuraman et al., 1985:41; 1988:14) and applied in the health
industry by various researchers (Niaz et al., 2009:26; Bisschoff & Kadé, 2010;
Ramamoorthy et al., 2018:841; Appalayya & Paul, 2018:261) and the perceived
quality of service provided by the pharmaceutical wholesaler will then be compared

6
to what service levels the customers expect to receive from the pharmaceutical
wholesaler. The potential positive and negative gaps will later be identified as per
“Gap 5” of the SERVQUAL model to address service quality management issues in
the company. Possible correlations between business and demographic variables
will also be investigated to determine if these correlations influence buying behaviour
and service perceptions of the customers.
1.4 RESEARCH METHODOLOGY
The research methodology is discussed in full in Chapter 3.
1.4.1 Literature
The study followed a quantitative approach that consists of a literature review and an
empirical investigation.
Firstly, a deductive approach was followed by looking at previous research
conducted to examine and explore interests, and problematic issues. The
North-West University‟s electronic database, articles, Google Scholar and
other publications were used to provide a sound theoretical base for this
service quality study.
Secondly, the selection of a research design followed. A quantitative
research design was chosen based on the success of various other quality
service studies aiming to also address similar identified problems and
research objectives in this study. Mehralian et al. (2016:978) developed a
service quality measurement for the services rendered to retail pharmacies
from a pharmaceutical wholesaler in Iran. Fatima et al. (2017:1198) explained
the patients‟ views towards private healthcare service providers by measuring
hospital service quality and analysing the relative significance of quality
measurements in anticipating the patients‟ satisfaction and loyalty. Appalayya
and Paul (2018:268) conducted a study that identified the most critical factors
in hospitals related to service quality that will ensure survival and success in
the future (Appalayya & Paul, 2018:269; Fatima et al., 2017:1199; Mehralian
et al., 2016:980).
Thirdly, the SERVQUAL model was chosen to measure differences between
the perceived service quality and the actual received service quality (also
referred to as Gap 5). (Brady & Cronin, 2001:39; Parasuraman et al.
1985:44). The model was selected as an analytical tool because:

7
o The SERVQUAL model measures service quality and can determine
the differences in the perceived and expected quality of service.
o The model also classifies the service quality data into the five service
quality antecedents (tangibility, reliability, responsiveness, assurance
and empathy).
o The model has been widely used in a wide variety of industries and has
proven to be valid since inception.
o The model has also been re-validated by Kade and Bisschoff (2010) for
use in the South African health industry, more specifically in customer
service of ophthalmology measurement.
1.4.2 Questionnaire
The questionnaire used in this study will be based on the SERVQUAL principles, but
its questions will be adapted to be more specific for pharmaceutical wholesalers in
South Africa. Although this might lower the validity of the questionnaire, the validity
of the modified questionnaire and the reliability of the data will be scrutinised
statistically.
1.4.3 Study population
The study population consists of all customers of the specific wholesaler. The
company‟s customer list comprises independent and retail pharmacies, doctors,
hospitals, clinics and veterinarians; all of them formed part of the study population.
This study targeted the population. No sample was drawn. All the customers on the
address list received the adapted and structured SERVQUAL questionnaire via
email.
1.4.4 Location of a unit of analysis
The population used consists of the customers of the pharmaceutical wholesaler that
distributes pharmaceutical products nationally. The population is thus geographically
located all over South Africa.
1.4.5 Accessibility of unit of analysis
Permission was granted at a managerial meeting held by the pharmaceutical
wholesaler to gain access to the contact details of all customers of the
pharmaceutical wholesaler for research purposes only and that personal information
will not be used otherwise.

8
1.4.6 Suitability of unit of analysis
The study‟s primary objective was to measure the perceived and expected service
quality of a selected pharmaceutical wholesaler in South Africa. Customers of the
pharmaceutical wholesaler place orders with the pharmaceutical wholesaler regularly
and receive a service from the pharmaceutical wholesaler on a regular basis, making
the customers of the pharmaceutical wholesaler the most suitable and appropriate to
answer a SERVQUAL questionnaire regarding perceived and expected level of
service quality received from the pharmaceutical wholesaler.
1.4.7 Statistical analysis and decision criteria
The data was analysed by the software IBM Statistical Package for Social Sciences
software (Version 25). The data and their respective decision-criteria were analysed
by several quantitative statistical techniques as shown in table 3.1.
1.4.8 Ethical considerations
This study was evaluated for compliance to the ethical standards, practices and
requirements of the North-West University‟s Ethical Committee (Faculty Economic
and Management Sciences). The committee approved the study and classified it as
a low-risk study; a study-specific ethics number NWU-00271-18-A4 was issued.
1.5 PROBLEMS ENCOUNTERED
The response rate could have been negatively affected by the fact that the survey
was emailed to the account holder and did not necessarily reach the individuals
receiving the service from the pharmaceutical wholesaler. The call centre had to
follow-up frequently throughout the two weeks of questionnaire distribution, to ensure
that all willing customers received the questionnaire.
1.6 DELIMITATIONS AND ASSUMPTIONS
1.6.1 Delimitations (Scope)
This study gave feedback on the quality of service expected from and delivered by
the pharmaceutical wholesaler to their customers. Possible other research designs
could have been used that would also have yielded handsome information on
service quality in the pharmaceutical industry. These alternative possibilities are:
The study could also have been conducted on one (or more groups selected)
of the types of customers by measuring the quality of service, for example,

9
received by community pharmacies, providing similar data as the chosen unit
of analysis. This would have had a shortcoming though of not providing a
holistic customer service delivery view of the wholesaler.
A study could also have been conducted by gathering data from a random
combination of customers of pharmaceutical wholesalers in South Africa.
Such a study will measure service quality of all wholesalers to their customers
and not that of a specific wholesaler. The results will then reflect service
quality levels present in the pharmaceutical wholesale environment and will be
of value to all wholesalers, and not only a specific one. The shortcoming
would be that the generalised approach will not be able to provide accurate
managerial information to any particular wholesaler.
Comparative analysis in both the cases above could have been a third avenue
of research. Here the level of service quality delivered to the different groups
of customers could be compared to determine if some groups receive better
service quality, and if so why? This could render management to deliver a
differentiated service quality strategy to serve best each of the four diverse
groups of customers a wholesaler has.
Although these alternatives are, in their own right interesting and valuable research
avenues, all of them would have, however, changed the primary research question
and objectives of the study. Hence the study would then not have given a holistic
view on the quality of service provided to all types of customers of the selected
pharmaceutical wholesaler anymore if they are included in the study.
1.6.2 Assumptions
The assumptions underlying this study include that:
This study will apply to the pharmaceutical wholesaler that will be evaluated in
this study.
There will be a relationship between the different variables evaluated in this
study.
The adapted SERVQUAL research instrument is of relevance to the
pharmaceutical industry and customers that will be taking part in this study.
Customers will be able to assess the service offered by the pharmaceutical
wholesaler as a whole.

10
1.7 LAYOUT OF THE STUDY
The study consists of four chapters. These chapters are:
Chapter 1 sets the introductory background, problem statement, objectives
and research propositions of the study. The primary aim of this study was to
measure the service quality at a pharmaceutical wholesaler in South Africa.
Chapter 2 provides the background on the pharmaceutical wholesalers‟
sector in South Africa focusing on perceptions and expectations of customers
regarding services received. Attention is given to the definition of service
quality and the dimensions of the SERVQUAL model that was used in this
study.
Chapter 3 sets out the empirical research results and research methodology.
The chapter outlines and describes the research design and methods used to
gathered the data. The chapter also explains how the data were analysed and
presents the results of the empirical research of this study.
Chapter 4 is the final chapter of the study. This chapter aims to conclude the
study, to formulate recommendations and to postulate possible areas for
further research. The study also presents a summary of the findings on the
customer service investigation and ultimately a summary to the study.
1.8 SUMMARY
This chapter introduces the study by providing the pharmaceutical wholesale
industry, discusses the business environment and its competitive thrusts, formulates
the problem statement, set the objectives and then described the research
methodology followed. Chapter 1 also outlined the scope of the study and the
problems encountered.
Chapter 2 includes the literature used and the research that was done for this study.
The SERVQUAL model, that was used to structure the questionnaire for this study,
is also explained and researched in Chapter 2.

11
CHAPTER 2: LITERATURE REVIEW
2.1 INTRODUCTION
The theoretical background and research done on service quality and South Africa‟s
pharmaceutical wholesale industry are discussed in this chapter. The pharmaceutical
wholesale sector will be addressed where after the importance of service quality will
be illustrated and the SERVQUAL model is explained.
2.2 SOUTH AFRICAN PHARMACEUTICAL WHOLESALE CONTEXT
2.2.1 Features of South African pharmaceutical markets
The South African pharmaceutical sector has been through many changes in the last
few decades especially in the regulatory framework and price control of medicine.
Van den Heever (2003), fifteen years ago, in support of Bangalee and Suleman,
(2015:526), more recently, state that these changes can mainly be attributed to the
systemic cost increases in the private healthcare market of SA in the recorded
history. The pharmaceutical sector is regulated by the Medical and Related
Substances Act 101 of 1965 (MARSA) (SA 1965). The act authorises the South
African Health Products Regulatory Agency (SAHPRA) to set up a framework for the
registration of medicines, the classification thereof into schedules, and regulates the
purchase and sale of medicines by manufacturers, distributors, wholesalers,
pharmacists and persons licensed to dispense medicines. MARSA and the General
Regulations demarcate a specific supply chain regarding the sale of pharmaceuticals
in the private sector. All entities in the supply chain of pharmaceutical products must
be licensed with the Department of Health (DoH). The following entities are
recognised as part of that supply chain:
Manufacturers
Importers
Distributors
Wholesalers
Retailers
Value to pharmaceutical products is added in three distinct levels, namely:
1. The manufacturer level, where the manufacturer‟s price is added
2. The wholesaler/distributor level, where the logistics fees are added
3. The retailer level, where the dispensing fee is added.

12
2.2.1.1 Manufacturer level
Manufacturers manufacture medicine and set prices in the private sector in their
applications for registration of a medicine. They are subject to ceilings in periodic
adjustment of prices set by the Department of Health. The manufacturers can submit
applications to temporarily or permanently reduce costs of their medicine. They are
also allowed to apply for price increases if required to keep the medicine available on
the South African market. Antonie et al. (2018) also state that most manufacturers
are importers.
2.2.1.2 Wholesaler/distributor level
There are no clear definitions for “distributor” or “wholesaler” provided by MARSA. If
one uses the terms‟ ordinary meaning, a distributor is defined as an agent of the
manufacturer, and a wholesaler is a person who buys in bulk for his or her own
account. Manufacturers may either make use of distributors that act as the
manufacturer‟s agent, and thus deals with either retailers or wholesalers, or through
wholesalers who buy in bulk and sells to retailers in smaller quantities.
The South African Health Products Regulatory Agency (SAHPRA) has licenced 216
pharmaceutical wholesalers up to October 2018 and according to Antonie et al.
(2018), 15 wholesalers account for nearly all pharmaceutical products passing
through wholesalers, while the rest are small regional wholesalers. They also state
that four distributors account for most pharmaceutical products passing through
distributor channels and also indicate that the median logistics fee paid to
pharmaceutical wholesalers or distributors is 10.0% of the SEP, with half their
observations falling between 7.4% and 12.5%. Section 22H of MARSA states that a
pharmaceutical wholesaler may only purchase medicine from the “original
manufacturer” or the “primary importer” and may only sell to the retail sector.
2.2.1.3 Retail level
A retail pharmacy or any other business that is allowed to purchase and sell
medicine may obtain it in the following ways:
Directly from a manufacturer
From a distributor
From a wholesaler

13
These options are not all available for every medicine but in all cases, the retail
pharmacy will pay the SEP. Independent retail pharmacies may prefer to obtain their
medicine from wholesalers other than UPD, CJ Distributors or Transpharm that are
each integrated with corporate retail pharmacies such as Clicks, DisChem and
MediRite. They may do so to avoid supporting their competitors. The corporate
retailers can obtain their medicines from the distributor or wholesaler with which they
are integrated, or from independent wholesalers or distributors or directly from
manufacturers.
2.2.2 Licensing and the Supply Chain
It is illegal to handle the sale and distribution of any medicines or scheduled
substances without a valid licence to do so from the South African Pharmaceutical
Council (SAPC, 2018) and SAPHRA (SA, 1965). The governing of licences for all
entities that form part of the pharmaceutical supply chain is done by a licencing
system implemented by MARSA along with the General Regulations.
2.2.3 Pricing Regulations: Single Exit Price
Consumers in the past often had to pay higher prices on doctors‟ preferred
medicines and services because incentives were given to the doctors and other
healthcare professionals by medicinal manufacturers. This increase in medicine
prices by manufacturers to be able to cover incentives to doctors and other
healthcare professionals together with the country‟s history of a high percentage of
poverty and previously disadvantaged groups led Government and the Department
of Health to step in. The Department of Health‟s vision is to create an accessible,
caring and high-quality health system, and their primary focuses are access, equity,
efficiency, quality, and sustainability. The Medicines and Related Substances Act
(Act 101 of 1965) (SA, 1965) governs the manufacturing, distribution, sales, and
marketing of medicines. The Act was amended in 1997 adding sections about the
banning of “bonus” stock and the creation of a pricing committee that aimed to
enforce a transparent pricing system that includes a single exit price (SEP) for
medicines. The single exit price came to effect in 2004, and it is the only price at
which a manufacturer may sell medicines to any person.
The Transparent Pricing System for medicines and substances (GN R1102 of 2005)
defines SEP as follows: "single exit price means the price set by the manufacturer or

14
importer of a medicine or scheduled substance in terms of these Regulations
combined with the logistics fee and VAT and is the price of the lowest unit of the
medicine or scheduled substance within a pack multiplied by the number of units in
the pack”. Regulation 5 deals with the calculation of the SEP”. The SEP can be
broken down into the following three elements based on this definition (Pretorius,
2011):
The manufacturer price – The manufacturer/importer of medicine
determined this price. Any changes to this price need to be approved annually
for the medicine to be entered on the South African Medicines Pricing
Registry Database of Medicine Prices.
The logistics fee – The logistics fee is a fee charged by the
distributor/wholesaler. The fee is negotiated between the distributor and the
manufacturer. The fee needs to be made public as separate from the core
price; it is in no way distinct from the SEP. The logistics fee is combined with
the manufacturer price and VAT to reach the SEP.
Value Added Tax (VAT)
Section 22G (3) (a) of MARSA prescribes that the SEP is the price at which
medicine must be sold to all persons other than the State and include 15
percent VAT. All medicine sold in South Africa must have a set SEP as it is a
mandatory price control measure that must be given effect to in the
Regulations. Section 22G (3) (b) also requires that all persons licensed to sell
medicines, may not sell medicine at any other price than the SEP. The SEP is
thus established as a fixed price at which the product must be sold at every
level of the supply chain.
Wholesalers and distributors are entitled to the negotiated logistics fee for
their services and pharmacists may add an “appropriate” dispensing fee for
their services regarding the regulations.
2.2.4 The Logistics fee
When it comes to wholesalers and distributors, the SEP must now be viewed in the
calculation of the logistics fee. The SEP now comprises three components which
are: the manufacturer‟s price, the logistics fee, and VAT.
The regulations provide for the determination of a logistics fee in the following way:
Subject to regulation 5(2) (g),” the logistics fee must be determined by agreement

15
between the provider of logistical services and the manufacturer or importer. The
Minister, on the recommendation of the Pricing Committee, must determine a
maximum logistics fee where, in the opinion of the Minister, such a determination is
necessary to promote or protect the interests of the public in:
i. Ensuring reasonable access to affordable medicines;
ii. The realisation of the constitutional right of access to healthcare services
contemplated in section 27 of the Constitution;
iii. The efficient and effective distribution of medicines and scheduled
substances throughout the Republic.
Section 22G (2) (c) of MARSA authorises the Minister on the recommendation of the
Pricing Committee to make regulations “on an appropriate fee to be charged by
wholesalers or distributors”. This is given effect to by Regulations36 5(2)(f) and
5(2)(g) which make provision for a logistics fee to be charged by distributors or
wholesalers.”
The “logistics fee” is defined in the regulations as follows: ”3.1. "Logistics fee" means
the fee, inclusive of VAT, that is payable in respect of logistical services; 3.2.
"logistical services" means those services provided by distributors and wholesalers
in relation to a medicine or scheduled substance including but not limited to
warehousing, inventory or stock control management, order and batch order
processing, delivery, batch tracking and tracing, cold chain storage and distribution.
According to the regulation, the logistics fee is to be determined in advance (by
agreement) and built into the SEP. It is therefore not permissible for a manufacturer
to fix different logistics fees for different wholesalers and distributors. If a
manufacturer uses more than one distributor or wholesaler, services must be
provided by the logistics fee published in respect of that year. If wholesalers and
distributors who were not a party to the original agreement are subsequently used to
market the medicine, they must agree to do so on the basis of the existing logistics
fee.”
2.2.5 Pharmaceutical wholesaler’s functions in South Africa
Pharmaceutical wholesalers‟ function in South Africa is to provide logistical services
that the proposed amendment stipulates to be the following:
receiving of medicines or scheduled substances

16
warehousing of medicines or scheduled substances
proper inventory control and rotation
taking orders from end dispensers
delivery of orders to end dispensers
provision of emergency deliveries to end dispensers where required
proper record keeping
batch tracking and tracing
ability to maintain cold chain storage and distribution where necessary
returning products to manufacturers when needed
having and operating a debtors‟ control system which conforms to accepted
accounting norms
These logistical services may only be provided by logistics service providers who, in
turn, must be licensed to provide such services regarding section 22C of Medicines
and Related Substances Act (MARSA). These regulations would affect the
profitability of the pharmaceutical industry, as operating costs within the industry
would be difficult to recoup, due to limits set on the prices of products sold.
Before the implementation of SEP, wholesalers could add the logistics fee to their
selling price (Bangalee & Suleman, 2015:528). Currently, the logistics fee, which
covers the distribution cost of pharmaceuticals, is negotiated privately between the
manufacturer and the wholesaler. The logistics fee generally ranges between 10%
and 15% of the single exit price (Ball, 2011). Pharmaceutical wholesalers face cost
control in that a single flat professional fee or logistic fee is negotiated with each
supplier causing margins in the wholesaling of pharmaceuticals to be very low.
Bangalee and Suleiman (2015:527), argue that there could be an adverse impact on
the pharmaceutical distribution chain due to the application of the proposed
maximum logistics fee (Bangalee & Suleman, 2015:523). Pharmaceutical
wholesalers will try to reduce overheads and their overall business costs as it is a
direct reaction to the price cap regulations. Currier (2006:481), states that the price
cap regulations can create an incentive for pharmaceutical wholesalers to reduce
their service quality, which will be the opposite of the objectives of the National Drug
Policy of South Africa (Currier, 2006:485).

17
Due to the medicine price regulations in South Africa, the pharmaceutical
wholesalers cannot compete with prices of medicine nor can they compete with the
differentiation of medicine sold to retailers. Pharmaceutical wholesale customers
focus on the overall quality of service received from the pharmaceutical wholesaler,
making service quality all the more important to stay competitive. Pharmaceutical
wholesalers consistently try to differentiate themselves from their competitors by
increasing the levels of service quality they provide. Knowing what kind of services
customers expect and find more critical can be of great value to a pharmaceutical
wholesaler.
2.3 SERVICE QUALITY
2.3.1 Definition of services
A service can be defined as an economic activity that typically produces an
intangible product (Heizer et al., 2017). Zeithaml et al. (1990) define service broadly
as experiences, performances, and deeds produced or provided by one person or
entity for another person or entity. Constantinides (2006:407) agrees with Heizer et
al. by stating that service is an act or a benefit to the customer, but does not result in
the ownership of anything tangible, making it a peculiar characteristic of service
compared to goods. One should not, however, ignore the fact that products also
supply intangible benefits. Marketing and its essence are based on the fact that
customers do not buy and want goods for their own sake, but for the benefits they
provide. This consequently implies that such things as real goods, or real service
rarely exist as most offers are a combination of tangible and intangible elements.
Wilson et al. (2012) are of the opinion that it is more difficult to evaluate services
than goods because of its intangibility. This unique characteristic of services and
their marketing implications are presented and discussed in the following section.
The customer‟s experience of the service received is defined as the subjective and
internal responses the customer has after direct or indirect contact with the provider
of the service. Direct contact is generally initiated by the customer, where a voluntary
purchase, use or service occurs. Indirect contact can include media and word of
mouth criticism and recommendations (Meyer & Schwager, 2007:116). The
customer experience varies from person to person due to it being influenced by their
views, interactions, and lifestyle behaviours. It is for these reasons that failure or

18
success of a service provided can be determined by certain variables that have an
impact on the interaction, cultivation, and attraction between the service provider and
its customers.
2.3.2 Characteristics of services
The unique characteristics of services that differentiate it from good or manufactured
products have frequently and widely been argued and studied with growing
consensus. Wirtz and Bateson (1999:55) state the following regarding service:
service cannot be stored
service is dependent on time
service is dependent on the place
the customer plays a fundamental role in the service delivery process
The customer‟s perception of service quality is influenced by everyone and
everything they come into contact.
Fahy and Jobber (2012), Putit et al. (2011) and McDonald et al. (2011) agree with
Wirtz and Bateson (1999:58) that services have specific essential characteristics,
namely intangibility, inseparability, heterogeneity/variability, perishability and lack of
ownership. Wilson et al. (2012) take it further by arguing that services and the
characteristics thereof, holds important implications for marketing practitioners in
organisations.
2.3.2.1 Intangibility
Zeithaml et al. (1990), and later Wilson et al. (2012), state that intangibility is the
most distinguishing characteristic of services. The intangibility of services can be
derived from the fact that it cannot be seen, tasted, heard or felt before a customer
buys it, and only then evaluates it. This can increase uncertainty for the buyer as it
lacks the tangible properties that the buyer can investigate and evaluate before
purchase. The buyer can however find it easier to assess the service after the
purchase as it is usually high in experience qualities. Experience qualities such as
efficiency, quality, and courtesy are properties of service that can be evaluated after
the purchase. Because of the intangibility of service consumers can feel more at risk
in their purchase and they then often seek tangible clues that can enable them to
judge the quality of service. The appearance of a website, the staff, the facility, and
the prices charged are all tangible clues consumers will use to evaluate the service
quality.

19
2.3.2.2 Inseparability
The service quality experienced by a customer can be derived from the service
quality attributes and physical evidence of the service production process, thus
making it possible for customers to evaluate the service only during the delivery of
the service, hence the inseparability and the variability of service. Unlike goods that
are first produced then sold and then consumed, services are normally provided and
consumed simultaneously in the same place.
This characteristic of service creates some marketing implications that Wilson et al.
(2012) highlighted:
The mass production and gaining of significant economies of scale through
centralisation is difficult because services are mostly produced and
consumed at the same time.
The „real-time‟ nature of services creates opportunities to customise
offerings for individual customers that can result in an advantage.
The customer is involved in the production process and can thus affect the
outcome of the service transaction positively or negatively.
The customer satisfaction and quality of service are highly dependent on the
actions and interactions between the employee and customer in „real time‟.
2.3.2.3 Heterogeneity
This characteristic has the potential to impact consistency and the variability in the
quality of a service rendered (Redda, 2015). This arises due to people being
involved in the production and the consumption of service and the quality of the
result will depend on the individual employee providing the service, the individual
customer receiving the service and the time at which it is performed. Heterogeneity
implies that service is always unique as it is never the same when repeated; different
circumstances require minor adaptations in delivering similar services on separate
occasions. These complicating factors make it difficult for a service manager to
ensure that the service rendered to the customers is the same as what was
promised and planned.

20
2.3.2.4 Perishability
The perishability of service derives from the fact that it cannot be stored and if it is
not delivered, it is lost or does not exist (Wilson et al., 2012). It is vital for managers
to pay attention to this characteristic of services especially during times where
demands are unusually high or low. Decision areas managers should focus on to
prevent this characteristic to influence the service rendered negatively include
demand forecasting and capacity utilisation. Zeithaml et al. (1990) also state that the
perishability of services implies that companies need robust recovery strategies
should things go wrong.
2.3.2.5 Lack of ownership
The intangible nature of service means that it cannot be physically possessed
because the product involves a performance, act, or effort that is offered and bought
on the basis that it might cause potential satisfaction (Clapton, 2013). On purchasing
a product, the buyer gains the full use of it with the benefits it provides. The buyer
can store it, consume it or sell it. In the case of a service, however, a customer may
only have personal access to it. To overcome the problem of ownership Doyle (2006)
suggests that service managers employ strategies such as creating membership
associations, stressing the advantages of non-ownership, for example, less risk of
capital loss, and providing incentives for frequent use.
2.3.4 Quality Service
Quality is defined differently by many experts. Wicks and Roethlein (2009:85) state
that the term quality is defined differently for different products, services, and
industries (Wicks & Roethlein, 2009:85). Each expert also has their own orientations
and perspectives that can influence their definition of quality.
The International Organisation for Standards‟ (ISO) definition of quality that states
that quality is “the degree to which a set of inherent characteristics fulfils
requirement” is the most used and accepted definition. The ISO definition for quality
relates to that of the American Institute for quality (ASQ) that defines quality as “The
totality of features and characteristics of a product or service that bears on its ability
to satisfy stated or implied needs”. Wicks and Roethlein (2009:87) agree with the
ISO and ASQ definitions and also state that for any particular industry the contextual

21
factors, the purpose of the organisation and the customer base will give more clarity
to their specific definition of quality.
According to Heizer et al. (2017), the many different definitions of quality can be
disseminated into three different categories namely user-based, manufacturing-
based, and product based (Heizer et al., 2017). The user-based definitions of quality
propose that quality lies in the eyes of the beholder (the customer), manufacturing-
based definitions focus on conforming with standards, and product focused
descriptions of quality focus on precise and measurable variables. By measuring the
customers‟ satisfaction with services rendered, the quality of service can be
determined, and an organisation will be able to highlight their strengths and areas of
improvement. Customers compare their perceptions of a service received with the
expectations they had before receiving the service. This comparison between
perception and expectation means that the customers‟ satisfaction with service
received and the service quality can be measured.
Heizer et al. (2017), state that quality can have significant implications for companies
on the following fronts (Heizer et al., 2017):
Company Reputation;
Product and Service liability; and
Global Implications.
Heizer et al. (2017) also illustrate in a figure how managing quality can help an
organisation build practical and successful strategies that will differentiate them,
lower costs and increase sales, thus improving profitability. Putit et al. (2011) agree
with Heizer et al. (2017) in stating that delivering high-quality service is a key to
sustainable competitive advantage and will result in satisfied customers. As
customers continue to upgrade their service expectations, service providers are
forced to better their levels of courtesy and assistance. Hence, Mehralian et al.
(2016:981) state that it is of high importance for companies to differentiate
themselves and continuously upgrade their services quality to compete in a modern
competitive environment. According to Niaz et al. (2009:26) service quality have a
significant impact on customers‟ repurchase intentions, loyalty and recommendations
to others. These factors in turn lead to the company‟s future revenue and profits. The
authors further state that many companies in different industries adopt existing

22
service quality models to attract new customers and retain existing customers as
there is enough research stating the linkages of service quality and customer
satisfaction with profits. It is vital for pharmaceutical wholesalers to retain their
customers and to create favourable behavioural intentions. Hence, the importance of
a study that investigates the relationship and impact of service quality and customer
satisfaction in the pharmaceutical wholesale industry (Putit et al., 2011).
Parasuraman et al. (1985:48) were one of the first to study service quality and
defined it as the difference between the expected and the perceived service
received. Since then numerous studies have been conducted on service quality
because of the impact of service quality on the performance of organisations. Due to
the rapid growth of the service sector over the last few decades around the world,
organisations have to focus more on delivering a service that meets the customer
needs to make customers happy.
This is no different in the healthcare sector where, according to Mehralian et al.
(2016:979) service quality management is the key to survival and success in the
current competitive market (Mehralian et al., 2016:979). Because of the increase of
overall success of the healthcare sector companies that focus on the improvement of
service quality, it has become the focus of many topics and studies. Service quality
can have a substantial effect on patient satisfaction, and an increase in satisfaction
will inevitably increase customer loyalty and customers‟ purchase intentions
(Kandampully, 1988:438).
Many healthcare professionals and researchers study service quality and are
interested in delivering a higher service quality because it has a direct impact on
business performance. Pharmaceutical wholesalers need to do their best to improve
the service quality they provide and satisfy their customers by delivering their
products promptly and accurately. Most research on service quality in the healthcare
sector focuses on the patient that is the end user. Although the Pharmaceutical
Supply Chain forms an integral part of healthcare services, studies on the
interactions between the different components of the supply chain have rarely been
studied (Mehralian et al., 2016:981). One such study, done by Putit et al. (2011)
showed that there are positive correlations between the five dimensions of the

23
SERVQUAL model that measures service quality and customer satisfaction (Putit et
al., 2011).
The services that patients receive are strongly influenced by the quality of service
received from the Supply Chain, making these interactions very important. The
pharmaceutical wholesaler is part of the path through which essential
pharmaceutical products are distributed to reach the customer at the right time, in
sound quality and at the right place. This Supply Chain process is very complex and
although the pharmaceutical wholesaler sells tangible goods, the service rendered is
of the utmost importance not only for the competitiveness of the pharmaceutical
wholesaler but also for the safety of patients. Mehralian et al. (2016:977), state that
even minor errors at a pharmaceutical wholesaler are unacceptable due to the many
challenges and the sensitivity of the Pharmaceutical Supply Chain that can have a
direct impact on the health and safety of patients (Mehralian et al., 2016:977).
2.4 The SERVQUAL model
2.4.1 Historical overview of the SERVQUAL model
Three American academics, Parasuraman, Berry and Zeithmal, developed the
SERVQUAL model in the late 1980s to measure customers‟ perception of service
quality (Parasuraman et al., 1985:41). The model assumes that service quality is
measured by determining the difference between the customers‟ perceptions and
expectations of service received. Thus, if the expectation scores are subtracted from
the perception scores, the service quality is measured. The higher a positive
difference is, the higher the level of service quality is and the lower the positive
difference or the higher the negative difference, the lower the level of service quality
is (Parasuraman et al., 1985:41). The perceived importance of the service attributes
is also considered by the SERVQUAL model, making it possible for companies to
prioritise the most critical characteristics that are identified by the customers as
lacking in quality.
However, since the development of the service quality measurement scale of
Parasuraman et al. (1988:19), it has not been without criticism. Salvador-Ferrer
(2010:168) argues that the critique mainly focuses on the situational instability that is
shown by the dimensions of the SERVQUAL scale in some instances (Salvador-
Ferrer, 2010:168). He further argues that the distribution of weights assigned to each

24
dimension, or rather the lack thereof, as it was first hypothesised that all the
dimensions carry the same weight, leads to further criticism. Putit et al.(2011) agree
that the five dimensions of Parasuraman et al. (1988:22)‟s service quality
measurement scale are not so generic that researchers should not add dimensions
they believe to be important in a specific industry. Further, should a dimension be of
great significance to customers in a particular industry, it can be decomposed into
more sub-dimensions and vice versa. Devi et al. (2016:258), found that the
dimensions; assurance, reliability, responsiveness, and communication to be the
critical dimensions affecting a company‟s service quality in the pharmaceutical
supply chain industry (Devi et al., 2016:258).
Wilson et al. (2012) explain that some factors can influence the expectations of the
customers before having received any service from an organisation; these factors
can potentially influence how customers assess the service quality (Wilson et al.,
2012).
These factors include:
Word of mouth communication: This communication can either be between
a customer and someone that has received a service from the organisation or
someone that has never used the service of an organisation. One customer
that is unsatisfied with the quality of service can potentially affect numerous
other customers negatively, just as a customer that received excellent service
quality can influence other customers positively.
Personal needs: Every individual or customer is different. This creates a
significant ferity of needs, which if not met, can lead to poor service quality.
This ferity of needs of customers makes it difficult for organisations to satisfy
all customers. If the needs of a customer are met, the perceived service
quality will be assessed as competent.
Experience: If customers previously experienced excellent quality service
from an organisation they are more likely to return and use the service again
(Chahal & Kumari, 2010:232).
External communication: This includes what the marketing organisations do
in promoting their service quality. Promotion creates a certain expectation of
the service that should be received. Promoting and communicating high
standards that cannot be met will have a negative influence on the perceived

25
service quality. The pharmaceutical industry is highly regulated and prohibits
the advertising of medicine on social media and blogs to the public.
Parasuraman et al. (1985:45) first identified ten categories, also known as
“determinants of service quality”, that customers use to evaluate service, regardless
of the type of service. Overlapping occurred between the ten determinants and after
further research the ten determinants was narrowed down and combined to form the
five dimensions as it is known today:
Assurance: Measuring the knowledge and courtesy of the employees of the
organisations that convey trust and confidence.
Empathy: Measuring how individualised and caring attention is provided to
customers.
Reliability: Measuring how accurately the promised service is performed.
Responsiveness: Measuring the timeliness of service, providing prompt
service.
Tangibles: Measuring the physical representation of the services including
physical facilities, the appearance of personnel, equipment and
communication material.
Contributions by several other researchers led to the identification of as many as
fifteen dimensions. In practice, however, these dimensions did not meet
expectations, and the main dimensions in the original SERVQUAL model are mostly
used by researchers, primarily because of the ability of the model to analyse not only
the dimensions, but also can do a gap analysis.
2.4.2 The SERVQUAL model
The SERVQUAL model, as operationalised by the developers, appears in the figure
below; the different gaps are explained thereafter.
26
Gap 5
Source: Zeithaml et al. (1990)
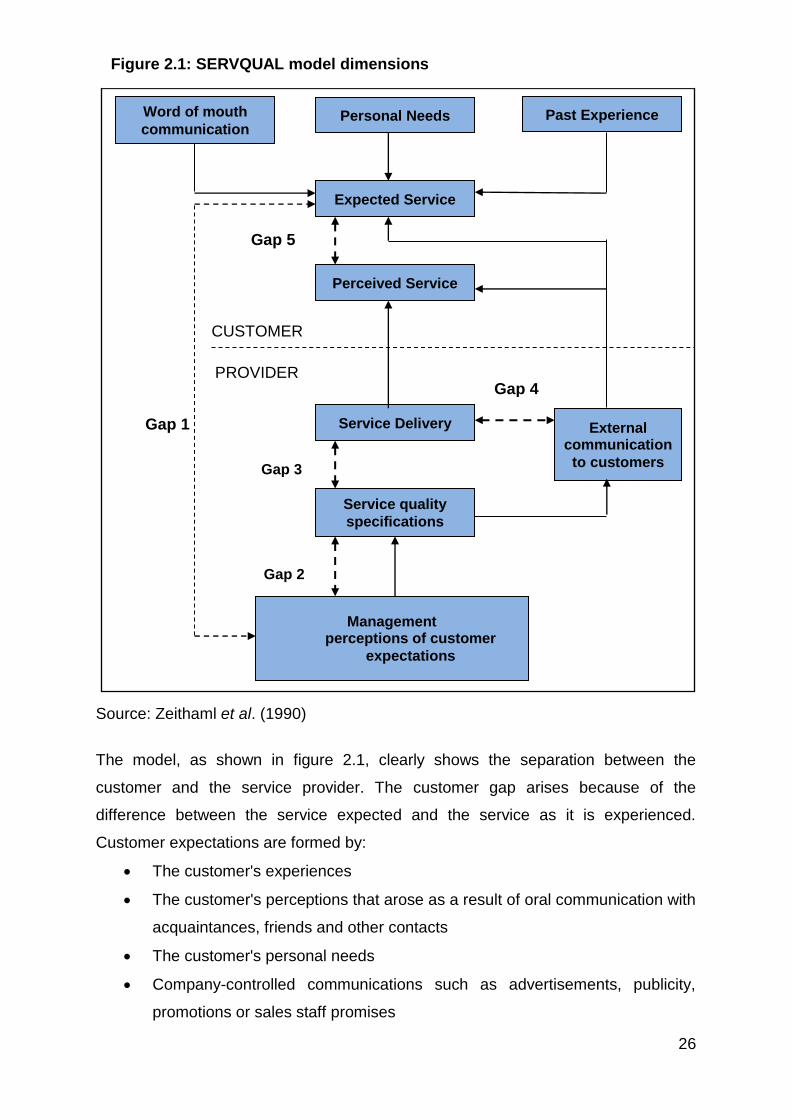
The model, as shown in figure 2.1, clearly shows the separation between the
customer and the service provider. The customer gap arises because of the
difference between the service expected and the service as it is experienced.
Customer expectations are formed by:
The customer's experiences
The customer's perceptions that arose as a result of oral communication with
acquaintances, friends and other contacts
The customer's personal needs
Company-controlled communications such as advertisements, publicity,
promotions or sales staff promises
Gap 3
Gap 2
Word of mouth
communication Personal Needs
Service quality
specifications
Service Delivery
Perceived Service
Expected Service
Past Experience
Management perceptions of customer
expectations
External communication
to customers
CUSTOMER
PROVIDER Gap 4
Gap 1
4Figure 2.1: SERVQUAL model dimensions

27
In addition to the customer gap, the service provider gaps also exist. These gaps are
shown in figure 2.1 as Gaps 1-4. These four gaps arise as a result of actions by the
service provider. The gaps are:
Gap 1: This gap is known as the consumer expectation-management
perception gap. Discrepancies can exist between what management think the
customers‟ service expectations are, and what the actual expectations of the
customers are. This gap can lead to managers making uninformed decisions
that can lower the level of service quality (Van Heerden, 2010). Factors that
can cause this gap can include poor market research or the use of market
research, lack of communication and interaction between the customers and
management, or lack of communication between the managers and
employees in contact with customers(Kleynhans, 2008).
Gap 2: The specification gap that entails that management‟s perceived high
standards of service are not evaluated frequently and might cause service
quality to lack due to insufficient training of employees or a lack of
standardised tasks. Factors that can cause this gap include management that
are not committed to service quality or tasks and processes that are not
standardised.
Gap 3: The performance gap occurs when there is a difference between the
specified service quality and the actual service quality delivered. According to
Kleynhans (2008), the set standards should be used to evaluate the
employees, thus ensuring that the real service provided by the employees
corresponds with the managements‟ expectations. Factors that can cause this
gap include a lack of teamwork, inadequate compensation systems and
employees or technology that is not fit for the job.
Gap 4: This gap exists when there is a difference between the actual service
level and the service that is being externally communicated by the
organisation. Management has to make sure that the externally
communicated service levels are met. This gap is usually caused by a
tendency of organisations to promise more than what they can deliver. A lack
of communication between different departments of an organisation can also
cause this gap.

28
A high percentage of companies would agree that a thorough understanding
of the service needs of their customers and service quality perceived would be
of high value and help immensely to improve their service quality. The
SERVQUAL model offers just this by providing information regarding the
customers‟ perception of the service and performance of service received,
with suggestions from the customers. The results can be used to adapt the
quality standards to fit the customers‟ priorities and show which processes
need to be changed or fixed.
Gap 5: The customer gap that identifies the overall difference between
expected service quality and perceived service quality. Customers determine
the service quality that is provided by an organisation and not all customers
perceive service quality the same. Kleynhans (2008) also states that there are
several ways that service quality can be met and include either meeting or
exceeding the customers‟ expectations, or by changing the customers‟
expectations (Kleynhans, 2008). This customer gap has only three outcomes:
o Situation 1: No gap exists as service delivery equals the expectations
created.
o Situation 2: A negative gap arises where the service received is worse
than the expectations created. This gap (or rather its prevention) is the
focus of customer-oriented businesses.
o Situation 3: A positive gap arises where service delivery exceeds
expectations and leads to satisfaction and happiness. Enterprises are
striving to function in this gap.
Companies that are customer-oriented focus on positive customer gaps. Positive
customer gaps lead to long-term commitments from customers as well as the
improved profitability of organisations (Mehralian et al., 2016:976).
2.4.4 Strengths and shortcomings of the SERVQUAL model
The strength of the model, according to Bisschoff and Lotriet (2009:266) is that it
identifies service dimensions that are underperforming as well as the analysis of the
origin that causes the service failure (located in the gap analysis) (Bisschoff and
Lotriet, 2009:267). Furthermore, the popular measurement, namely Gap 5, is also a
fast measure to determine the service levels without necessarily applying the entire
model. The SERVQUAL model provides for two overhead sets of gaps, namely the

29
gaps which occur on the customer's side, and then the gaps that occur on the
service provider's side.
2.4.3 Application of the SERVQUAL MODEL in the health industry
Several researchers like Mehralian, Devi, Adebisi and Lawal have used the
SERVQUAL model to measure the service quality of businesses in the healthcare
sector and found it to be a reliable model that shows how organisations can improve
their service quality.
Mehralian et al. (2016:980) used this model to measure the service quality of a
pharmaceutical distributor in Iran, where the customers completed a survey that
measured and compared the perceived and expected service needs of the
customers. Identified gaps between the perceived and expected service their
customers received were then analysed and used to improve the distributor‟s service
quality.
Adebisi and Lawal (2017:4) recently conducted a study on what the impact of service
quality of pharmacies will have on customer loyalty by using the SERVQUAL model.
The findings of the study revealed that all five service quality dimensions have a
significant positive effect on customer loyalty and that health service providers
should improve their quality of service for their customers to stay loyal (Adebisi &
Lawal, 2017:5).
Another study that used the SERVQUAL model in the healthcare sector was that of
Devi et al. (2016:259), where they evaluated the service quality from a distributor‟s
perspective in the supply chain. The results showed that all five service quality
dimensions significantly affect customer satisfaction (Devi et al., 2016:260).
The abovementioned studies that used the SERVQUAL model in the healthcare
industry where excellent service quality is expected have been revalidated by this
study that measures the service quality of a pharmaceutical wholesaler in South
Africa.
Pharmaceutical companies can use this model to measure the quality of service their
employees provide to their customers. Shortcomings or gaps can be identified that

30
can be analysed to find solutions and close the gaps between the perceived and
expected quality of service.
2.5 SUMMARY
Chapter 2 focused on the literature study of the pharmaceutical industry, service
quality and its elements. The SERVQUAL model and its dimensions, and the
dimensions of service quality were also discussed. The difference between
customers‟ perception and expectations was explained with the gaps that can be
identified in the service industry.
Chapter 3 includes the research methodology and the results of the study.

31
CHAPTER 3: RESEARCH METHODOLOGY AND RESULTS
3.1 INTRODUCTION
In the preceding chapters, a background was created against which the empirical
research of this study can be considered. In this chapter the research methodology
applied and the results of the empirical research that investigates the service quality
of a pharmaceutical wholesaler in the South African setting is described. The
description includes the questionnaire design, population, data collection process,
the statistical techniques used to process the data, and the results of the study
according to the SERVQUAL model used.
As previously mentioned, this study aimed to measure customer satisfaction with the
service received from the selected pharmaceutical wholesaler. Van Heerden (2010)
states that the SERVQUAL model has been used numerous times for measuring
service quality in different industries and Clapton (2013) affirm that the SERVQUAL
model has been used in various health institutions. The study conducted by
Mehralian et al. (2016:975), where they developed a service quality measurement
scale for measuring the service quality received by pharmaceutical retailers from
pharmaceutical distributors, can be adapted and used to measure the service quality
of a pharmaceutical wholesaler in South Africa.
3.2 RESEARCH METHODOLOGY
3.2.1 Questionnaire design
A survey method, with the help of a structured questionnaire, was used to collect the
primary data on a 7-point Likert scale. From the literature review a questionnaire was
developed based on the SERVQUAL model that is seen as one of the most
acceptable service quality models.
The existing questionnaire used by Mehralian et al. (2016:976) will be adjusted and
used in this study. The original questionnaire was adapted to fit the pharmaceutical
industry better (see Appendix A) so that service levels delivered by a pharmaceutical
wholesaler can be evaluated. The validity of the original SERVQUAL questionnaire
has repeatedly been tested by numerous researchers like Kade and Bisschoff
(2010), Carrillat et al. (2007:475) and Adebisi and Lawal (2017:4), where they found
the validity to be high. The SERVQUAL model‟s strength lies in the fact that it was

32
designed to be not industry specific. Therefore, the questionnaire used in this study
will be based on the SERVQUAL principles, but its questions will be adapted to be
more specific for pharmaceutical wholesalers in South Africa. Although this might
lower the validity of the questionnaire, the validity of the modified questionnaire and
the reliability of the data was scrutinised statistically.
The face- and content validity of the questionnaire was ensured by presenting it to a
group of experts in the field of pharmaceutical supply chain. This included
pharmacists, quality assurance pharmacists, pharmaceutical wholesale managers,
sales and marketing managers, logistics managers, financial managers and supply
chain managers as well as personnel knowledgeable in the field of customer service
to evaluate and scrutinise both the question formulations and the layout of the
modified service quality measurement scale. They were also instructed to suggest
any missing service quality concepts they deem essential in such a service quality
study. These suggestions and changes were made to the questionnaire to finalise it.
It is also important to note that the five dimensions of quality of service namely the
reliability, tangibles, assurance, empathy, and responsiveness (as measured by
SERVQUAL) will be used to evaluate the service quality levels.
The questionnaire was designed in Google Forms in such a way that all relevant
questions had to be answered, ensuring completeness. Confidentiality was secured
for each participant. The questionnaire consists of three sections. Section A captures
the classifying variables. Classifying variables will typically include if the wholesaler
is the customer‟s first choice pharmaceutical wholesaler, will the customer refer this
pharmaceutical wholesaler to other healthcare professionals, and what type of
customers.
In Section B of the questionnaire will be the 29 statements where customers rate the
perceived and expected service with a 7-point Likert scale. The answers to these 29
statements will be indicated in two columns next to the statements, where the levels
of perceived and expected quality of service will be indicated by using a 7-point
Likert scale with a scale range from 1 (strongly disagree) to 7 (strongly agree). The
statements in the questionnaire (see Appendix A) can be categorised under the
following antecedents according to Mehralian et al. (2016:977):
Reliability: Statements 1-9

33
Tangibility: Statements 10-15
Assurance: Statements 16-21
Empathy: Statements 22-26
Responsiveness: Statements 27-29
Section C is an open-ended questions section where respondents can add their
views on service quality should they wish to elaborate on their service quality
experiences.
3.2.2 Study population
The study population consists of all customers of the specific wholesaler. The
company‟s customer list comprises independent and retail pharmacies, doctors,
hospitals, clinics and veterinarians; all of them formed part of the study population.
This study targeted the population. No sample was drawn. All the customers on the
address list received the adapted and structured SERVQUAL questionnaire via
email. Based on Saunder‟s (2009) findings that a low percentage of response rates
between 10 and 50 for surveys and questionnaires that are sent via email can be
expected, the questionnaire was sent to the whole population to prevent a shortage
of data.
The questionnaire was designed in GoogleForms in such a way that all relevant
questions had to be answered, ensuring completeness. Confidentiality was ensured
for each participant. Over the two-week period a total of 4468 questionnaires were
distributed via email and a total of 385 were received back. This signifies a response
rate of 8.6%.
Data analysis identified key drivers of customer service, the differences, and
relationships of variables and antecedents. Lastly, the data were then summarised
and results presented, which enabled the researcher to investigate the results and
conclude them.
3.2.3 Location of a unit of analysis
The population that was used consisted of the customers of the pharmaceutical
wholesaler that distributes pharmaceutical products nationally. The population is thus

34
geographically located all over South Africa. Communication details were made
available at the pharmaceutical wholesaler, and the call centre of the pharmaceutical
wholesaler helped in the process of contacting all customers to make them aware of
the survey and sent out an email with a link to Google Forms where the survey in the
form of a SERVQUAL questionnaire could be completed.
3.2.4 Accessibility of unit of analysis
Permission was granted at a managerial meeting held by the pharmaceutical
wholesaler to gain access to the contact details of all customers of the
pharmaceutical wholesaler for research purposes only and that personal information
will not be used otherwise. Formal communication with customers already takes
place at the pharmaceutical wholesaler as financial statements, invoices, and
marketing materials are sent to customers on a regular basis, making all
communication details accurate and up to date. The call centre came in contact with
the specific professional customers that have been identified in the pharmaceutical
wholesaler‟s database to inform them regarding the questionnaire. Customers were
made to understand that this study will give the management of the pharmaceutical
wholesaler a more explicit indication where they should put their focus more to
improve service quality and that the customers would benefit from answering the
questionnaire. High service quality is of the utmost importance for the
pharmaceutical wholesaler and thus the reason for the management of the
pharmaceutical wholesaler agreeing on conducting the survey, giving access to
customer details and sending out all communication to customers.
3.2.5 Suitability of unit of analysis
The study‟s primary objective was to measure the perceived and expected service
quality of a selected pharmaceutical wholesaler in South Africa. Customers of the
pharmaceutical wholesaler place orders with the pharmaceutical wholesaler regularly
and receive a service from the pharmaceutical wholesaler on a regular basis, making
the customers of the pharmaceutical wholesaler the most suitable and appropriate to
answer a SERVQUAL questionnaire regarding perceived and expected levels of
service quality received from the pharmaceutical wholesaler. This study was
conducted on the assumption that the customers‟ satisfaction with the services
received by the pharmaceutical wholesaler would possibly affect future use of the
pharmaceutical wholesaler as most customers have accounts with multiple

35
pharmaceutical wholesalers. The questionnaire sent via email was not only a fast
and easy way to communicate to the customers but also the most convenient for the
customers.
3.2.6 Data collection
The data collection process can be divided into the following steps:
Step 1: Permission - The study has been approved in a managerial meeting by
the Operational Manager of the pharmaceutical wholesaler, as well as the
Responsible Pharmacist.
Step 2: Awareness - A formal letter per email was sent from the pharmaceutical
wholesaler, and the call centre helped to sensitise and explain the
purpose of the study.
Step 3: Distribution - The formal letter that was sent by the pharmaceutical
wholesaler had a link to Google Forms that opened the questionnaire to
all customers of the pharmaceutical wholesaler. The questionnaires were
distributed on a specific date, and the deadline was communicated to all
personnel and customers to maximise the response rate quantity of
completed questionnaires.
Step 4: Collection - The call centre of the pharmaceutical wholesaler assisted in
the sending of the questionnaires. After the agreed time frame, the
questionnaires and data were collected from Google Forms by the
researcher for processing and analysis.
3.2.7 Statistical analysis and decision criteria
The data was analysed by the software IBM Statistical Package for Social Sciences
software (Version 25). The data and their respective decision-criteria were analysed
by several quantitative statistical techniques as shown in Table 3.1.

36
Table 3.1: Statistical techniques employed and decision criteria
Statistical technique Decision criteria Substantiating source
Descriptive statistics *** Field (2009)
Kaiser-Meyer-Olkin
(KMO) measure of
sampling adequacy
KMO ≥ 0.9 (Excellent)
KMO ≥ 0.8 (Very good)
KMO ≥ 0.7 (Good)
KMO ≥ 0.6 (Acceptable)
KMO ≤ 0.6 (Unsatisfactory)
Field (2009)
Fields & Bisschoff (2013b)
Imandin (2015)
Golafshani (2003)
Bartlett‟s test of
sphericity
p < 0.05 Field (2009)
UCLA (2017a)
Cronbach Alpha
reliability coefficients
α ≥ 0.70 (Reliable)
0.57 ≤ α ≤ 0.70 (Acceptable)
α ≤ 0.57 (Not reliable)
Salkind (2000)
Cortina (1993)
Field (2009)
Exploratory factor
analysis (Orthogonal
Varimax rotation)
Factor loading ≥ 0.40
Variance ≥ 50% (Acceptable)
Variance ≥ 60% (Desirable)
Eigenvalue ≥ 1
Costello & Osborne (2005)
Field (2009)
Arbuckle (2012)
UCLA (2017a; 2017b)
Pearson correlation
coefficient
-0.30≥ p ≥ 0.30
p ≥ 0.05; 0.10
Tang et al. (2003)
Du Plessis (2010).
Zikmund (2008)
Source: Original sources retained as cited by Shaikh (2017)
To illustrate the inter-relationships between the different techniques and their
chronological order of use, the statistical analysis decision tree in Figure 3.1
(originally developed by Naidoo, 2011) was used as a guide.

37
Figure 3.1: Data analyses decision-tree
Source: Adapted from Arbuckle (2012), Naidoo (2011:19), and Field (2009)
3.2.8 Ethical considerations
This study applied the following ethical principles:
Participation in the survey was voluntary
Personal data of the customers that participated voluntarily was processed
lawfully and fairly and used only for the study
Personal responses from customers were not ascribed to any individual

38
The questionnaire did not contain the names or any other personal
information of customers and the anonymity of customers was maintained
throughout the study
The interpretation of the survey finding was upheld with independent
objectivity.
This study was evaluated for compliance to the ethical standards, practices and
requirements of the North-West University‟s Ethical Committee (Faculty Economic
and Management Sciences). The committee approved the study and classified it as
a low-risk study; a study-specific ethics number NWU-00271-18-A4 was issued.
3.3 RESULTS
The data was captured on Microsoft Excel and imported into the Statistical Package
for Social Science (IBM SPSS v25) where data analysis was performed. Microsoft
Excel was used to determine the effect size or practical significance on the
information received. The specialised statistical software was used for the more
advanced statistics, that included the reliability of the data, exploratory factor
analysis to identify underlying factors within the quality of service dimensions. The
Bartlett Test of sphericity and the Kaiser, Meyer and Olkin Measure of Sampling
Adequacy measure were also performed to determine if the data was suitable to be
subjected to factor analysis (see also Table 3.1).
3.3.1 Demographic analysis
In this study customers were classified into three customer categories. These
categories are pharmacies, doctors and others (others represent wholesalers,
hospitals, clinics, veterinary facilities, health shops, homeopaths and export
customers). The demographic profile of customers of the pharmaceutical wholesaler
is fairly represented in the sample in this regard. In the sample pharmacies account
for 39.5% of customers, doctors 38.2% of customers and the other category of
customers that include other wholesalers, hospitals, clinics, veterinary facilities,
health shops, homeopaths and export accounts for 22.3%.
The customers were further sub-divided into two categories of delivery methods:
they receive their stock delivered from the pharmaceutical wholesaler; the delivery
methods are couriered or the wholesaler‟s own delivery vehicles and drivers were

39
used. Customers receiving inventory with the use of the wholesaler‟s delivery
vehicles account for 75.6% of customers, whereas customers receiving stock that is
delivered to them by courier from the pharmaceutical wholesaler, accounts 24.4% of
customers.
The percentage of customers that indicated that they are satisfied with the overall
service from the pharmaceutical wholesaler was 97.7%, in comparison with 2.3%
who said they were not satisfied. This represents an excellent satisfaction
percentage and the wholesaler should strive to maintain these service levels.
3.3.2 SERVQUAL GAP 5 analysis
The data received about the different dimensions of service delivery that was
addressed by the questionnaire will now be analysed and discussed. The level of
actual or perceived service delivery is compared with the expected level of service
delivery and the gap between the two levels was determined.
The results are presented in Table 3.2. The criteria in the tables represent the
summary index values per statement. The average expected service and perceived
service per statement is followed by the difference between them, and also the
overall difference between expected and perceived service. The average difference
per dimension between expected and perceived service is also shown in Table 3.2.
Table 3.2: SERVQUAL GAP 5 results
DIMENSION STATEMENT
AVERAGE SCORES
E - P AVERAGE FOR
DIMENSION E P
Assurance
15. Order placing are accurate 6,252 5,839 0,413
0,484
16. Stock delivered on time 6,488 5,919 0,569
17. Deliveries incorporate specific business needs
6,294 5,938 0,356
18. Call centre agents are professional 6,384 5,956 0,429
19. Ability to resolve queries 6,283 5,608 0,675
20. aims to provide excellent service 6,439 5,977 0,462
Empathy
1. Interest in solving any product related problems
5,919 5,327 0,592
0,437 21. Sincere interest in solving problems 6,312 5,743 0,569
22. Call centre is easy to reach 6,343 5,951 0,392
23. Payment methods are convenient 6,395 6,216 0,179
24. Fulfil specific business requirements 6,325 5,873 0,452

40
DIMENSION STATEMENT
AVERAGE SCORES
E - P AVERAGE FOR
DIMENSION E P
Responsive-ness
25. Responds effectively to account enquiries 6,351 5,966 0,384
0,544 26. Responds effectively to complaints 6,304 5,740 0,564
27. Inform on when order will be delivered 6,195 5,574 0,621
28. Delivers in time and in full 6,408 5,800 0,608
Reliability
2. Deliveries contain correct products 6,509 6,195 0,314
0,483
3. Deliveries contain correct quantities 6,447 6,088 0,358
4. Competitive pricing on non-SEP products 6,177 5,644 0,532
5. Promotions communicated effectively 6,135 5,771 0,364
6. Relevant promotions 5,953 5,525 0,429
7. Stock all relevant items required in business
6,075 5,174 0,901
Tangible
8. Packaging material of good quality 6,470 6,153 0,317
0,281
9. Modern online website 6,042 5,486 0,556
10. Marketing materials visually appealing 6,481 6,325 0,156
11. Vehicles well branded 6,145 6,026 0,119
12. Drivers act professionally 6,353 6,029 0,325
13. Drivers are professional in appearance 6,244 5,860 0,384
14. Cold chain is maintained for fridge parcels 6,517 6,405 0,112
TOTAL 6,294 5,861 0,433
The analysis shows that the customers‟ expected service from the wholesaler was
not met. From the table above (Table 3.2) and in Figure 3.2 below the scores are
visible and show that the services rendered to customers did not exceed their
expectations.
The mean scores for the 28 statements are 5.861 (perceptions) and 6.294
(expectations), with a mean of the gap of 0.433.
Figure 3.2: Expectation and Perception
5,00 5,50 6,00 6,50
Difference is 0,433
Expectation Perception

41
The average expected and perceived service per dimension and the difference is
shown in table 3.3.
Table 3.3: Average expected and perceived service per dimension
DIMENSION Expectation Perception GAP Average
Assurance 6,357 5,873 0,484
Empathy 6,259 5,822 0,437
Responsiveness 6,314 5,770 0,544
Reliability 6,216 5,733 0,483
Tangibility 6,322 6,040 0,281
Figure 3.3: Average expected and perceived service per dimension
It appears that customer expectation for the assurance dimension is the highest with
an average of 6.357, followed closely by the tangible and responsiveness
dimensions with averages of 6.322 and 6.314. The dimension with the lowest
average customer expectation is that of reliability, with an average of 6.219. The
most significant gap between customer expectations and perceptions is that of the
responsiveness dimension with a difference of 0.544.
3.3.2.1 Effect size
The effect size or practical significance (d) was used as a measure to determine if
significant differences exist between the perceptions and the expectation of the
customers. The effect size d-value range between 0 and 1.0. A d-value of 0.8 and
higher implies that there is a large practical significance. Values between 0.5 and 0.8
suggest medium practical significance, where a d-value of more than 0.2 but less
5,00 5,20 5,40 5,60 5,80 6,00 6,20 6,40
Assurance
Empathy
Responsiveness
Reliability
Tangible
Perception Expectation

42
than 0.5 signifies a small or moderate significance (Ellis, 2010). For this study, d-
values of 0.2 and above (thus indicating low or high levels of practical significance)
are considered significant differences between the perceptions and the expectation
of the customers. The results of the effect size of each item appear in table 3.4 while
the effect sizes regarding the service dimensions are shown in table 3.5.
Table 3.4: Standard deviation and effect size
ITEM DIFFERENCE IN AVERAGE
STANDARD DEVIATION
EFFECT SIZE
1. Interest in solving any product related problems 0,592 1,550 0,382*
2. Deliveries contain correct quantities 0,358 1,276 0,281*
3. Deliveries contain correct products 0,314 1,186 0,265*
4. Competitive pricing on non-SEP products 0,532 1,463 0,364*
5. Promotions communicated effectively 0,364 1,549 0,235*
6. Relevant promotions 0,429 1,534 0,279*
7. Stock all relevant items required in business 0,901 1,539 0,586**
8. Packaging material of good quality 0,317 1,344 0,236*
9. Modern online website 0,556 1,643 0,338*
10. Marketing materials visually appealing 0,156 1,146 0,136
11. Vehicles well branded 0,119 1,468 0,081
12. Drivers act professional 0,325 1,322 0,246*
13. Drivers professional in appearance 0,384 1,409 0,273*
14. Cold chain is maintained for fridge parcels 0,112 1,185 0,094
15. Order placing are accurate 0,413 1,443 0,286*
16. Stock delivered on time 0,569 1,547 0,368*
17. Deliveries incorporate specific business needs 0,356 1,486 0,239*
18. Call centre agents are professional 0,429 1,449 0,296*
19. Ability to resolve queries 0,675 1,539 0,439*
20. aims to provide excellent service 0,462 1,316 0,351*
21. Sincere interest in solving problems 0,569 1,486 0,383*
22. Call centre is easy to reach 0,392 1,399 0,280*
23. Payment methods are convenient 0,179 1,351 0,133
24. Fulfil specific business requirements 0,452 1,415 0,319*
25. Responds effectively to account enquiries 0,384 1,391 0,276*
26. Responds effectively to complaints 0,564 1,548 0,364*
27. Inform on when order will be delivered 0,621 1,688 0,368*
28. Delivers in time and in full 0,608 1,513 0,402*
* Moderate practical significance
** Medium practical significance
No significant practical significance was found between the perceptions and
expectations with regards to the individual items. All d-values are below 0.8 (large
significance) and values mostly are between 0.2 and 0.5 (signifying moderate

43
practical significance). Item 7 shows a medium level of practical significance with the
effect size value between 0.5 and 0.8.
The practical significance of the five service dimensions is shown in Table 3.5.
Table 3.5: Effect size per dimension
ITEM E P DIFFERENCE IN AVERAGE
STANDARD DEVIATION
EFFECT SIZE
Assurance 6,357 5,873 0,484 1,463 0,331
Empathy 6,259 5,822 0,437 1,440 0,303
Responsiveness 6,314 5,770 0,544 1,535 0,355
Reliability 6,216 5,733 0,483 1,425 0,339
Tangible 6,322 6,040 0,281 1,359 0,207
The practical significance between the perceptions and expectations in all five
dimensions of service quality are moderate with d-values between 0.2 and 0.5. This
means that there are no large discrepancies in service quality levels between what
the customers expect, and what they received.
3.3.2.2 SERVQUAL antecedents
3.3.2.2.1 Assurance
The gap scores and the effect size for the assurance dimension are the third largest
of the five dimensions (see Table 3.4). Assurance will let customers feel safe and
instil confidence and trust in the ability of the wholesaler to perform expected
services. This is achieved by employees being courteous and knowledgeable to
answer customers‟ questions. Through good knowledge about the pharmaceutical
products and services and at the same time acting courteously, will usually take
away the uncertainty that customers might have.

44
Figure 3.4: Assurance
Employees, who are well trained in all the products and services rendered by the
wholesaler, should be able to act calmly and focused. The effect would make the
customer feel safe during their interaction with employees, but in this instance, it
seemed to be untrue. The statement that states „Call centre agents can resolve my
queries‟, had a gap of 0.675, that is the second most significant gap of all statements
in the questionnaire and also the second biggest effect size of 0.439 (see table 3.4).
Employees were not questioned about their qualifications or work-related knowledge
of products and services rendered, but according to customers‟ perceptions, they do
not know to answer some of their questions.
3.3.2.2.2 Empathy
Excellent communication skills and explicit listening skills are required to show
empathy. One technique is to let the customer do most of the talking. This ensures
that the employee understands the customer‟s problems better, making it possible to
optimally understand and attend to the customer‟s service needs. The employees do
not exceed the customers‟ expectation in this dimension of service quality with an
average gap of 0.437. (See also figure 3.5).
5,00 5,20 5,40 5,60 5,80 6,00 6,20 6,40 6,60
15. Order placing are accurate
16. Stock delivered on time
17. Deliveries incorporate specific business needs
18. Call centre agents are professional
19. Ability to resolve queries
20. Aims to provide excellent service
Perception Expectation

45
Figure 3.5: Empathy
The statements regarding interest in solving product related problems showed the
biggest gap in the empathy dimension with a gap of 0.592.
Customers find the ability and willingness of the employees to understand their
customer specific needs lower than what is expected. Customers want personal and
individual attention at times convenient to them. This can be difficult to achieve
should employees be pressed by time and have set targets to make. It is difficult for
employees to please everybody as customers do not all have the same
personalities.
3.3.2.2.3 Responsiveness
The wholesalers‟ responsiveness to customers‟ requests, delivering prompt service
and at the same time giving informed information can be seen in figure 3.6. It is
notable from figure 3.6 and in table 3.4, this dimension has the most substantial gap
of 0.544. This is a clear indication that customers perceive a lack of timeliness and
prompt service from the pharmaceutical wholesaler which might put the wholesaler
at a disadvantage.
5,00 5,20 5,40 5,60 5,80 6,00 6,20 6,40 6,60
1. Interest in solving any product related problems
21. Sincere interest in solving problems
22. Call centre is easy to reach
23. Payment methods are convenient
24. Fulfil specific business requirements
Perception Expectation

46
Figure 3.6: Responsiveness
The statements regarding delivering on time and in full showed the second biggest
gap in the responsiveness dimension with a gap of 0.608, but at the biggest effect
size in this dimension with a value of 0.402 (see Table 3.4). With the price regulation
on medicine causing low-profit margins, customers of the wholesaler tend to keep
low levels of medicine. This can cause the customers to run out of medicine at a
critical time, and wanting the wholesaler to deliver the medicine promptly.
3.3.2.2.4 Reliability
From figure 3.7 it is notable that all the actions related to reliability are below
customers‟ expectations.
Figure 3.7: Reliability
5,00 5,20 5,40 5,60 5,80 6,00 6,20 6,40 6,60
25. Responds effectively to account enquiries
26. Responds effectively to complaints
27. Inform on when order will be delivered
28. Delivers in time and in full
Perception Expectation
5,00 5,20 5,40 5,60 5,80 6,00 6,20 6,40 6,60
3. Deliveries contain correct products
2. Deliveries contain correct quantities
4. Competitive pricing on non-SEP products
5. Promotions communicated effectively
6. Relevant promotions
7. Stock all relevant items required in business
Perception Expectation

47
The statements regarding the wholesaler stocking all relevant items required in my
business showed the most significant gap of all the statements in the questionnaire
with a gap of 0.901. It also has the biggest effect size of all statements with a value
of 0.586. The statement regarding the competitiveness of non-SEP prices also
raised concerns with a gap of 0.532.
For the pharmaceutical wholesaler to be competitive it is imperative that they provide
customers with the customers‟ whole basket of product needs, at the best price and
prompt deliveries. This will prevent competitors from finding gaps that they can use
to lure customers away.
3.3.2.2.5 Tangibles
In general, the perceived appearance of packaging materials, marketing materials,
equipment and employees have the smallest gap between the customers‟
expectations and perceptions with an overall gap of 0.281 (see Figure 3.8).
Figure 3.8: Tangibles
The packaging of the cold chain parcels had the smallest gap with a value of 0.112.
The visual appearance of the vehicles, branding materials and drivers all had smaller
gaps between customers‟ perception and expectation than most other statements in
the questionnaire indicating that this has been a focus of the pharmaceutical
wholesaler that paid off. It also confirms the fact that the wholesaler‟s tangible
involvement with customers is of significant influence. Customers are known to have
5,00 5,20 5,40 5,60 5,80 6,00 6,20 6,40 6,60
8. Packaging material of good quality
9. Modern online website
10. Marketing materials visually appealing
11. Vehicles well branded
12. Drivers act professional
13. Drivers professional in appearance
14. Cold chain is maintained for fridge parcels
Perception Expectation

48
accounts with multiple pharmaceutical wholesalers and it is not known if it may affect
their perception and expectation of tangibles.
3.3.2.3 Reliability of antecedents
The Cronbach Alpha (α) coefficient was statistically calculated to determine the
reliability of the data about all the dimensions of service quality in the SERVQUAL
model. Cronbach's alpha determines the internal consistency or average correlation
of items in a survey instrument to gauge its reliability (Bryman & Bell, 2014). An
acceptable level of reliability is usually implied by a result of 0.8 and above, although
most researchers accept an alpha coefficient of 0.7 as acceptably (Bryman & Bell,
2014). The minimum Alpha coefficient for this research was thus set at α ≥ 0.70.
Table 3.6 below shows the reliability coefficients for all the antecedents of service
quality. All the antecedents have returned very satisfactory reliability coefficients of
more than 0.8. This exceeds the minimum coefficient of 0.7 by far and shows
excellent reliability and internal consistency of data about each dimension.
Table 3.6: Reliability coefficient
Antecedents Cronbach Alpha (α)
Reliability 0.884
Tangible 0.894
Assurance 0.920
Empathy 0.897
Responsiveness 0.890
TOTAL 0.986
3.3.3 Influence of demographics on the perceived service quality
3.3.3.1 Delivery method
On dividing the customers according to the delivery method, it is evident that the
customers receiving stock via courier have lower expectations of overall service than
those receiving their inventory with the wholesaler‟s delivery vehicle and driver. The
perceived services from the wholesaler to both customer types are lower than what
they expected. The expectations of local customers and courier customers are
respectively 6.354 and 6.108 (see table 3.7). Although courier customers‟
expectations are lower, it is also evident that their perception of service received is

49
much lower than that of local customers with a gap of 0.622 between expected
service and perceived service compared to a gap of 0.372 of local customers.
Table 3.7: Courier and Local customers
EXPECTATION PERCEPTION DIFFERENCE
Courier customers 6,108 5,487 0,622
Local customers 6,354 5,982 0,372
Figure 3.9: Courier and Local customers
3.3.3.2 Type of customer
In this study customers were divided into three categories which include pharmacies,
doctors and other (other wholesalers, hospitals, clinics, veterinary facilities, health
shops, homeopaths and export customers).
The result as seen in table 3.8 and figure 3.10 indicate that pharmacies have the
highest expectations from the pharmaceutical wholesaler and also the lowest
perceptions with a gap of 0.605. It is known that many pharmacies have accounts
with multiple pharmaceutical wholesalers and may have affected their perception
and expectation of service quality from the pharmaceutical wholesaler. Doctors seem
to be the most pleased with the service received from the pharmaceutical wholesaler
with a gap of only 0.301 between the two variables.
5,000 5,200 5,400 5,600 5,800 6,000 6,200 6,400
COURIER CUSTOMERS
LOCAL CUSTOMERS
Perception Expectation

50
Table 3.8: Pharmacies, Doctors and Other
Expectation Perception Difference
Pharmacies 6,337 5,733 0,605
Doctors 6,253 5,952 0,301
Other 6,289 5,932 0,356
Figure 3.10: Pharmacies, Doctors and Other
3.3.3 Exploratory factor analysis
Successful exploratory factor analysis requires data that is suitable for multivariate
analysis. Typically, an adequate sample and sufficiently low sphericity are data
properties that are required to successfully extract meaningful factors from the data.
This study employed the Kaiser-Meyer-Olkin tests to determine the suitability of the
data for factor analysis.
3.3.4.1 Kaiser-Meyer-Olkin and Bartlett’s test
The adequacy of the sample (in this case the number of respondents in the
population) was determined by calculating the Kaiser-Meyer-Olkin measure of
sampling adequacy. Also, the Bartlett test of sphericity was used to determine the
sphericity within the data. Low sphericity (below 0.05) and high sample adequacy
(≥0.70) is needed to determine if the data is suitable to be used for exploratory factor
analysis (Williams et al., 2010:10). The results are shown in table 3.9.
5,00 5,20 5,40 5,60 5,80 6,00 6,20 6,40
Pharmacies
Doctors
Other
Perception Expectation

51
Table 3.9: Bartlett’s test and Kaiser-Meyer-Olkin measure
Kaiser-Meyer-Olkin and Bartlett’s Test
Kaiser-Meyer-Olkin Measure of Sampling Adequacy .963
Bartlett‟s Test of
Sphericity
Approx. Chi-Square
Df
Sig.
10133.241
378
0.000
The Kaiser-Meyer-Olkin measure displays a value of 0.963, indicating that the
sample is adequate. The Bartlett's test of sphericity also returned a favourable value
less than the required value of 0.05.
3.3.4.2 Exploratory factor analysis
Three factors were identified with exploratory factor analysis using an orthogonal
varimax rotation. According to Beavers et al. (2013:10), rotational techniques like
Varimax serve to create a more interpretable solution than Principal component
analysis because it identifies factors and the communalities without altering the
structural relationships, while Field (2009:746) points out that a varimax rotation is
particularly suitable for exploratory studies (like this one) because it aims to
maximise the variance per factor explained. Field (2009:667) also states that factor
loadings of 0.40 and above are considered to be significant and are used in the
analysis. The factors and the criteria loading onto each item are presented in table
3.10.
Table 3.10 below indicates that all 28 of the statements loaded onto three factors; all
had factor loadings of 0.40 or higher. The table also shows the variance explained
and reliability of the factors.

52
Table 3.11: Factor Analysis
NR STATEMENT FACTORS
1 2 3
A5(P) 19. Ability to resolve queries .788
E2(P) 21. Sincere interest in solving problems .786
E1(P) 1. Interest in solving any product related problems .738
A4(P) 18. Call centre agents are professional .713
A6(P) 20. aims to provide excellent service .694
E5(P) 24. Fulfil specific business requirements .689
R2(P) 26. Responds effectively to complaints .677
E3(P) 22. Call centre is easy to reach .670
R1(P) 25. Responds effectively to account enquiries .659
R3(P) 27. Inform on when the order will be delivered .653
A1(P) 15. Order placing are accurate .613
RL6(P) 7. Stock all relevant items required in business .536
T5(P) 12. Drivers act professionally .739
A2(P) 16. Stock delivered on time .686
R4(P) 28. Delivers in time and in full .678
RL2(P) 2. Deliveries contain correct quantities .667
T4(P) 11. Vehicles well branded .666
RL1(P) 3. Deliveries contain correct products .661
T6(P) 13. Drivers are professional in appearance .661
A3(P) 17. Deliveries incorporate specific business needs .634
T7(P) 14. Cold chain is maintained for fridge parcels .603
T1(P) 8. Packaging material of good quality .577
E4(P) 23. Payment methods are convenient .536
RL5(P) 6. Relevant promotions .712
RL4(P) 5. Promotions communicated effectively .653
T2(P) 9. Modern online website .631
RL3(P) 4. Competitive pricing on non-SEP products .618
T3(P) 10. Marketing materials visually appealing .598
Percentage of variance explained 28.31% 23.11% 16.23%
Cumulative percentage of variance 28.31% 51.43% 67.66%
Reliability (Cronbach Alpha) 0.959 0.941 0.866
It is noteworthy from the table that a satisfactory cumulative variance is explained by
the three factors (67.66%) which exceed the desired variance explained of 60%.
Regarding the reliability coefficients for all three factors it is evident that all three of
them returned very satisfactory reliability coefficients, exceeding the required
coefficient of 0.7 with ease. Factors 1 and 2 have reliability coefficients higher that
0.90, whereas Factor 3 has an alpha coefficient which is higher than 0.8.
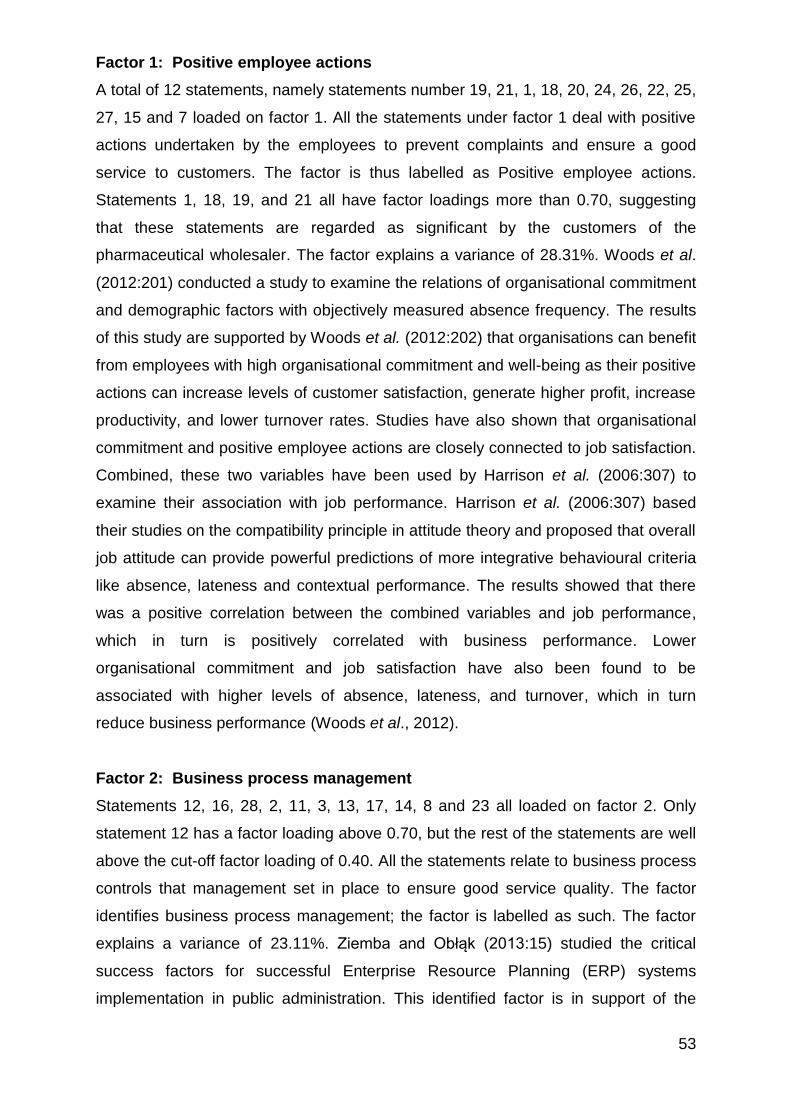
53
Factor 1: Positive employee actions
A total of 12 statements, namely statements number 19, 21, 1, 18, 20, 24, 26, 22, 25,
27, 15 and 7 loaded on factor 1. All the statements under factor 1 deal with positive
actions undertaken by the employees to prevent complaints and ensure a good
service to customers. The factor is thus labelled as Positive employee actions.
Statements 1, 18, 19, and 21 all have factor loadings more than 0.70, suggesting
that these statements are regarded as significant by the customers of the
pharmaceutical wholesaler. The factor explains a variance of 28.31%. Woods et al.
(2012:201) conducted a study to examine the relations of organisational commitment
and demographic factors with objectively measured absence frequency. The results
of this study are supported by Woods et al. (2012:202) that organisations can benefit
from employees with high organisational commitment and well-being as their positive
actions can increase levels of customer satisfaction, generate higher profit, increase
productivity, and lower turnover rates. Studies have also shown that organisational
commitment and positive employee actions are closely connected to job satisfaction.
Combined, these two variables have been used by Harrison et al. (2006:307) to
examine their association with job performance. Harrison et al. (2006:307) based
their studies on the compatibility principle in attitude theory and proposed that overall
job attitude can provide powerful predictions of more integrative behavioural criteria
like absence, lateness and contextual performance. The results showed that there
was a positive correlation between the combined variables and job performance,
which in turn is positively correlated with business performance. Lower
organisational commitment and job satisfaction have also been found to be
associated with higher levels of absence, lateness, and turnover, which in turn
reduce business performance (Woods et al., 2012).
Factor 2: Business process management
Statements 12, 16, 28, 2, 11, 3, 13, 17, 14, 8 and 23 all loaded on factor 2. Only
statement 12 has a factor loading above 0.70, but the rest of the statements are well
above the cut-off factor loading of 0.40. All the statements relate to business process
controls that management set in place to ensure good service quality. The factor
identifies business process management; the factor is labelled as such. The factor
explains a variance of 23.11%. Ziemba and Obłąk (2013:15) studied the critical
success factors for successful Enterprise Resource Planning (ERP) systems
implementation in public administration. This identified factor is in support of the

54
results achieved in a study by Ziemba and Obłąk (2013:16) as they argue that
organisations are constantly looking for ways to increase customer satisfaction,
increase efficiency, improve product quality, and reduce costs. Organisations have
realised that it lies in the performance of their processes. Hsu et al. (2015:927)
examined the relative importance of ERP system quality has on the service quality
rendered to customers. Their findings are similar to that of Ziemba and Obłąk
(2013:12) concluding that service quality was found to significantly interact with
information quality and system quality.
Factor 3: Marketing channels
Five statements, namely: 6, 5, 9, 4 and 10 loaded on factor 3. These statements
describe the marketing channels the pharmaceutical wholesaler use to connect with
customers. The factor is thus labelled as marketing channels because it shows the
effect organisational marketing channels have on the customers‟ service perceptions
of the pharmaceutical wholesaler. Statements 6, reflects a factor loading above 0.70
suggesting that the customers regard relative promotions as very important. The
factor has a variance of 16.23%. The findings are supported by Aghazadeh
(2015:127) in a study on the development of a comprehensive model for Integrated
Marketing Strategy, that argues that marketing strategies and channels used can be
a competitive advantage as it can attract customers, create value for customers,
satisfy customers, and encourage customers to return.
3.4 AN INTEGRATED MODEL TO MEASURE CUSTOMER SERVICE AT A
PHARMACEUTICAL WHOLESALER
The model to measure customer service in this study was developed in three stages.
In the first stage the model employed a sound theoretical basis to identify the
relevant customer service measuring criteria to the wholesale pharmaceutical
industry. These criteria were classified into the five customer service antecedents,
namely tangibility, responsiveness, assurance, reliability and empathy as per the
SERVQUAL model in the second stage. The third and final stage of the model
construction then subjected the measuring criteria to exploratory factor analysis to
identify the latent variables of customer service at a pharmaceutical wholesaler.
Three factors were identified. The model is shown in Figure 3.11.

55
Figure 3.11: An integrated model to measure customer service at a
pharmaceutical wholesaler
The model shows that all five of the customer service antecedents are highly
reliable; they have Cronbach alpha coefficients of more than 0.80. Also, these
antecedents explain high percentages of variance each (exceeding 80% variance
explained in all the cases). In practice this means that each antecedent does
measure the service quality antecedent well. Regarding the factors (or latent
variables), all three also have high Cronbach alpha coefficients and they explain a
satisfactorily cumulative variance of almost 68%.
This model is a practical tool for use by managers if they want to measure the
customer service of a pharmaceutical wholesaler. The model could be highly
productive if these managers apply the findings of their measurements to improve

56
poor service areas while also trying to maintain the excellent service areas.
However, without measuring, there can be no accurate managerial intervention to
enhance the quality of service. Herewith lies the benefit of this study; it provides a
reliable tool to measure customer service in practice that can be used to improve the
competitive stance of a wholesaler in a highly competitive environment where no
product differentiation exists.
3.5 SUMMARY
The objectives of this chapter were to describe the research design and
methodology of the study and to report on the empirical findings of the study.
The study population and technique used to collect the data were discussed. This
study targeted the population and thus no sample was drawn. The study population
consisted of a total of 4468 customers of the pharmaceutical wholesaler. The
chapter discussed the statistical techniques applied. The Cronbach Alpha coefficient
determined the reliability of the data. The sampling adequacy was tested by using
the Kaiser Meyer Olkin Measure of Sampling Adequacy. Descriptive- and Inferential
statistics were conducted to measure the mean and standard deviations of the
different service quality dimensions.
Additionally, it was used to compare their levels of importance for the customers and
the satisfaction the customers have with the quality of service received from the
pharmaceutical wholesaler. The collected data from the Exploratory Factor Analysis
and reliability of the SERVQUAL dimensions were validated and identified a number
of factors of the measuring tool. Exploratory Factor Analysis was used to determine
the underlying or latent needs of service quality influences.
The chapter also presented systematically and in detail the findings, analysis,
discussion and interpretation of the empirical results of this research in the form of
tables and figures to answer the research objectives and questions. The analyses
and interpretation of the findings were presented such that the empirical goals of the
study were achieved. The questionnaire‟s reliability and validity were highlighted.
The chapter then provided preliminary analyses including descriptive statistics and a
description of the demographic characteristics of the population used in the study.
Using an exploratory factor analysis, three determinant dimensions were extracted

57
that constitute pharmaceutical wholesaler service quality. These dimensions in
accordance to their importance are positive employee actions, business process
management, and marketing channels. Ultimately, a conceptual model to measure
service quality in the pharmaceutical wholesale industry was developed and
proposed.
The final chapter concludes the study by providing recommendations, areas for
future research and a summary of the study.

58
CHAPTER 4: CONCLUSIONS AND RECOMMENDATIONS
4.1 INTRODUCTION
Chapter 4 is the final chapter of the study. This chapter aims to conclude the study,
to formulate recommendations and to postulate possible areas for further research.
The study also presents a summary of the findings on the customer service
investigation and ultimately an overview of the study.
4.2 CONCLUSIONS
The South African pharmaceutical wholesale industry is highly competitive and
subject to various macro- and microeconomic forces. The South African
pharmaceutical wholesalers are negatively influenced by the Single Exit Pricing
(SEP) regulations of Government, which limits profit margins for the companies in
the industry and makes it impossible for pharmaceutical wholesalers to compete with
the prices of medicine. It was also found that the South African pharmaceutical
wholesalers‟ industry is a highly competitive and saturated market.
The pharmaceutical wholesaler and its customers form part of a very regulated and
competitive market where a high quality of service is expected; making the
interaction and service received from the wholesaler all the more critical. The quality
of service received from the wholesaler can strongly affect the service a patient
receives from the wholesaler‟s customer and can, as mentioned by Mehralian et al.
(2016:979), directly affect the business performance, profitability, customer loyalty,
and customer satisfaction of the wholesaler‟s customers (Mehralian et al., 2016:979;
Omar et al., 2015:88).
This study succeeded to gain knowledge of how customers of the pharmaceutical
wholesaler judge service quality and it also determined which gaps the
pharmaceutical wholesaler should address to provide a higher quality service that
can meet customers‟ expectations. This study helps the pharmaceutical wholesaler
to understand the significant issues which are affecting their performance. The
investigation revealed that the pharmaceutical wholesaler had a tremendous
opportunity to enhance their service quality. In future, any research concerning the
pharmaceutical wholesaler‟s service measurement should make use of the

59
SERVQUAL measuring instrument. This would also facilitate direct comparative
analysis with the current service levels.
The study also reveals how a modified SERVQUAL instrument can help
pharmaceutical wholesalers identify the service characteristics that are considered
important by their customers‟ point of view. Such a study can help the managers of
the pharmaceutical wholesaler to make informed business decisions. The data for
this study were collected from customers of a specific pharmaceutical wholesaler in
South Africa. Hence, service quality measurements for another pharmaceutical
wholesaler, especially in other countries, may not necessarily follow the same
pattern.
In general, the SERVQUAL model was found to be suitable for measuring customer
satisfaction with services rendered by a pharmaceutical wholesaler. The gap
between customers‟ expectations and perceptions is notable with the method. The
questions were slightly edited and modified to suit the pharmaceutical wholesale
industry in South Africa.
The results concluded that assurance, empathy, responsiveness, reliability and
tangibility are all critical factors affecting the pharmaceutical wholesaler's service
quality, coinciding with Parasuraman et al. (1988:14) and Mehralian et al.
(2016:978). The fact that the customers‟ perceived service quality affects the level of
satisfaction is supported and proved in this study corresponding with earlier studies
of Mehralian et al. (2016:979), Omar et al. (2015:87), and Niaz et al. (2019:27) and
other works.
The reliability coefficients for all data employed in the dimensions of the SERVQUAL
measuring instrument returned a very satisfactory reliability coefficient of more than
0.8. This shows excellent reliability and internal consistency of the data regarding
each of the dimensions. Again, any research concerning the pharmaceutical
wholesaler regarding customer service measurement should use the SERVQUAL
measuring instrument as the foundation for the analysis since it is now tried and
tested statistically for application in this specific business environment.

60
The individual perceived service quality scores (mean values) are all below the
expected service quality scores, showing that the pharmaceutical wholesaler does
not meet their customers‟ service quality expectations. Management should take
note of this and start addressing it. Management can begin by addressing the
dimension with the most significant gap and practical significance, which is
responsiveness. Customers perceive a lack of timeliness and prompt service from
the pharmaceutical wholesaler which might put the wholesaler at a disadvantage.
No individual gap showed large levels of practical significance while one did show a
medium level of significance and twenty-three moderate levels of relevance. All the
service dimensions showed a moderate practical significance.
Finally, the proposed customer service research model provides relevant
management information and appears to be successful in determining the quality of
service of a pharmaceutical wholesaler.
4.3 RECOMMENDATIONS
The following recommendations concerning the service quality of the pharmaceutical
wholesaler can be highlighted.
The results of this study should be made available to the respective
departments of the pharmaceutical wholesaler as well as the responsible
managers of each department so that they can all be aware of the current
service levels rendered.
The manager of each department should further implement a series of action
plans to maintain good performance areas while also trying to improve the
areas of poorer service delivery.
This investigation can form the basis of establishing a customer service
culture at the pharmaceutical wholesaler and can help to accelerate further
expansion of the culture. An overall uniform pursuit and approach to customer
satisfaction are recommended to the establishment of the customer service
culture.
Client service should further be formed part of the pharmaceutical
wholesaler‟s strategic goals and time and effort should be allocated to the
follow-up of research results.

61
Some internal actions to improve service levels are the training of staff and
performance incentives.
Employees that come in direct contact with customers should primarily focus
on showing sincere interest and willingness to assist customers and should
also have the knowledge to do so.
It is also recommended that this study is conducted again in the future to
facilitate direct comparative analysis of the current service levels.
Finally, it is recommended that future researchers investigating service quality
take note of this research model. The model may not be used as is for their
project, but can provide a cognitive roadmap for innovative thinking and future
studies.
4.4 AREAS FOR FUTURE RESEARCH
Possible other research designs could have been used that would also have yielded
handsome information on service quality in the pharmaceutical industry. These
possibilities are:
Alternatively, the study could also have been conducted on one (or more
groups selected) of the types of customers by measuring the quality of
service, for example, received by community pharmacies, providing similar
data as the chosen unit of analysis. This would have had a shortcoming
though of not providing a holistic customer service delivery view of the
wholesaler.
A study could also have been conducted by gathering data from a random
combination of customers of pharmaceutical wholesalers in South Africa.
Such a study will measure service quality of all wholesalers to their customers
and not that of a specific wholesaler. The results will then reflect service
quality levels present in the pharmaceutical wholesale environment and will be
of value to all wholesalers, and not only a specific one. The shortcoming
would be that the generalised approach will not be able to provide accurate
managerial information to any particular wholesaler.
Comparative analysis in both the cases above could have been a third avenue
of research. Here the level of service quality delivered to the different groups
of customers could be compared to determine if some groups receive better
service quality, and if so why? This could render management to deliver a

62
differentiated service quality strategy to serve best each of the four diverse
groups of customers a wholesaler has.
4.5 SUMMARY
The research gave focus to the measurement of service quality of a pharmaceutical
wholesaler in South Africa. The study consists of four chapters.
Chapter 1 sets the background, problem statement and research propositions of the
study. Some pharmaceutical wholesalers distribute medical supplies throughout
South Africa, and similarly to any other business, they need to remain competitive;
here typical strategic competitive thrusts like customer service and satisfaction are
employed to compete actively in the health market. Pharmaceutical wholesalers and
its customers operate in a very regulated and competitive market where a high
quality of service is expected; making the interaction and service received from the
wholesaler all the more critical.
As service quality can have a significant impact on the financial performance of the
pharmaceutical wholesaler, a study was needed to determine the current perceived
service quality. It is further a necessity to evaluate the impact of high service quality
on customer satisfaction. In line with the stated problem, the primary objective (§1.3)
and the secondary objectives of the study were formulated.
The primary objective of this study was to measure the service quality at a
pharmaceutical wholesaler in South Africa. To achieve the primary objective, the
following secondary objectives were formulated and examined:
Determine the perceived level of customer service the retail customers
receive from the pharmaceutical wholesaler;
Determine the perceived level of customer service the retail customers
expect from the pharmaceutical wholesaler;
Determine the difference (Gap 5) between the service levels;
Identify possible correlations between the general business and
demographic variables and the service gaps;
Determine the factors that influence the quality of service provided by a
pharmaceutical wholesaler; and to
Formulate managerial interventions to improve service levels to customers.

63
In chapter 2 the literature research was done and the proposed model to measure
the service quality was compiled and explained. The chapter commenced with an
industry profile of the South African Pharmaceutical market in Section 2.2. A review
of the literature on the structure of the pharmaceutical industry and the regulatory
framework in the supply of pharmaceutical products with specific focus on the role
and function of the pharmaceutical wholesaler in the supply chain were highlighted.
After that, the chapter reviewed the literature on service quality about the definition
and unique characteristics of services. The SERVQUAL model of service quality has
a full use and acceptance among service quality scholars and practitioners and thus
were critically analysed.
Chapter 3 sets out the empirical research results and research methodology. The
chapter outlined and described the research design and methods followed in
gathering and analysing the data for the empirical section of this study together with
the empirical research results of this study. The chapter provided discussions,
arguments and justifications of the research approach, the study population identified
and used, and the instrument used in the collection and analyses of the data. The
study concludes that there is value in the proposed service quality model and that
the model should be implanted at the pharmaceutical wholesaler as part of their
customer service strategy. The model has delivered satisfactory results for
measuring the service quality of the pharmaceutical wholesaler and, consequently,
can be extended to other pharmaceutical wholesalers or businesses in the
healthcare industry. In general, the SERVQUAL model was found to be suitable for
measuring customer satisfaction with services rendered by a pharmaceutical
wholesaler. The gap between customers‟ expectations and perceptions is notable
with the method. The questions were slightly edited and modified to suit the
pharmaceutical wholesale industry in South Africa.
Using an exploratory factor analysis, three determinant dimensions were extracted
that constitute pharmaceutical wholesaler service quality. These dimensions in
accordance to their importance are positive employee actions, business process
management, and marketing channels. Ultimately, a conceptual model to measure
service quality in the pharmaceutical wholesale industry was identified and
proposed.

64

65
REFERENCE LIST
Adebisi, O.S. & Lawal, K.O. 2017. The impact of service quality on customer
loyalty: a study of pharmaceutical firms. Nigerian Chapter of Arabian Journal of
Business and Management Review, 62(139):1-5.
Aghazadeh, H. 2015. Strategic marketing management: achieving superior
business performance through intelligent marketing strategy. Procedia - Social
and Behavioral Sciences, 207:125-134.
Antonie, F., Simkins, C., van Dalsen, A., Chetty, K., Collocott, C., Toxopeus, M. &
Doodnath, A. 2018. The Pharma Report: The supply of pharmaceuticals in
South Africa. Johannesburg: The Helen Suzman Foundation.
Appalayya, M. & Paul, J. 2018. Service quality, consumer satisfaction and loyalty in
hospitals: thinking for the future. Journal of Retailing and Consumer Services,
40:261-269.
Arbuckle, J.L. 2012. IBM SPSS Amos 21 User‟s Guide. Seattle, WA: Amos
Development Corporation.
Ball, D. 2011. The regulation of mark-ups in the pharmaceutical supply chain.
WHO/HAI Project on Medicine Prices and Availability. Review Series on
Pharmaceutical Pricing Policies and Interventions, Working Paper, 3.
Johannesburg: Unpublished.
Bangalee, V. & Suleman, F. 2015. Evaluating the effect of a proposed logistics fee
cap on pharmaceuticals in South Africa - a pre and post analysis. BMC Health
Services Research, 15(1):522-533.
Beavers, A.S., Lounsbury, J.W., Richards, J.K., Huck, S.W., Skolits, G.J. & Esquivel,
S.L. 2013. Practical considerations for using exploratory factor analysis in
educational research. Practical assessment, research & evaluation, 18(6):1-13
Bisschoff, C. & Lotriet, R. 2009. Die dienskwaliteit van die PUK rugby instituut.
Tydskrif vir Geesteswetenskappe(2):266-286.

66
Brady, M.K. & Cronin Jr, J.J. 2001. Some new thoughts on conceptualising
perceived service quality: a hierarchical approach. Journal of marketing,
65(3):34-49.
Bryman, A. & Bell, E. 2014. Research methodology: Business and management
contexts. Cape Town: Oxford University Southern Africa.
Carrillat, F.A., Jaramillo, F. & Mulki, J.P. 2007. The validity of the SERVQUAL and
SERVPERF scales: A meta-analytic view of 17 years of research across five
continents. International Journal of Service Industry Management, 18(5):472-
490.
Chahal, H. & Kumari, N. 2010. Development of multidimensional scale for
healthcare service quality (HCSQ) in Indian context. Journal of Indian Business
Research, 2(4):230-255.
Clapton, J. 2013. Measuring service quality in a private hospital. Potchefstroom:
North West University. (Dissertation - MBA).
Constantinides, E. 2006. The marketing mix revisited: towards the 21st century
marketing. Journal of Marketing Management, 22(3-4):407-438.
Currier, K.M. 2006. Quality-adjusted Laspeyres price caps: A graphical analysis.
Atlantic Economic Journal, 34(4):481-490.
Devi, P.U.M., Rao, B.S., Rajashekar, B. & Bhaskar, N.U. 2016. Measuring service
quality in pharmaceutical supply chain – distributor‟s perspective. International
Journal of Pharmaceutical and Healthcare Marketing(3):258-284.
Doyle, P. & Stern, P. 2006. Marketing management and strategy. London: Pearson
Education.
Ellis, P.D. 2010. The essential guide to effect sizes: Statistical power, meta-
analysis, and the interpretation of research results. Pretoria: Cambridge.
Fahy, J. & Jobber, D. 2012. Foundations of marketing. Maidenhead : McGraw-Hill
Education.
Fatima, T., Malik, S.A. & Shabbir, A. 2017. Hospital healthcare service quality,
patient satisfaction and loyalty : An investigation in context of private healthcare

67
systems. International Journal of Quality & Reliability Management(6):1195-
1214.
Field, A. 2009. Discovering statistics using SPSS. London: Sage.
Gronroos, C. 1988. Service quality: The six criteria of good perceived service.
Review of Business, 9(3):10-31.
Harrison, D.A., Newman, D.A. & Roth, P.L. 2006. How important are job attitudes?
Meta-analytic comparisons of integrative behavioral outcomes and time
sequences. Academy of Management journal, 49(2):305-325.
Heizer, J., Render, B. & Munson, C. 2017. Operational management: sustainability
and supply chain management. Harlow: Pearson.
Hsu, P.-F., Yen, H.R. & Chung, J.-C. 2015. Assessing ERP post-implementation
success at the individual level: Revisiting the role of service quality. Information
& Management, 52:925-942.
IBM SPSS. 2018. IBM Statistical Package for Social Sciences. Seattle, WA: IBM.
ImpactRx. 2016. ImpactRx. http://impactrx.co.za/ Date of access: December 2017.
Ishfaq, R., Reynolds, B. & Zoghi, B. 2005. Pricing of services in wholesale-
distribution industry. Review of the Electronic & Industrial Distribution
Industries, 4(2):13-32.
Kade, A. & Bisschoff, C.A. 2010. Customer service of an ophthalmology practice.
Paper delivered at the 4th International Business Conference, Livingstone,
Zambia, 8-10 Oct.
Kandampully, J. 1998. Service quality to service loyalty: A relationship which goes
beyond customer services. Total Quality Management, 9(6):431-443.
Kleynhans, K. 2008. Customer service of convenience stores. (Dissertation: MBA).
Potchefstroom: North West University.
McDonald, M., Payne, A. & Frow, P. 2011. Marketing plans for services: A
complete guide. New York, NY: Wiley.

68
Mehralian, G., Babapour, J. & Peiravian, F. 2016. Distributor-retailer interface in
pharmaceutical supply chain: service quality measurement scale. Iranian
Journal Of Pharmaceutical Research, 15(4):973-982.
Meyer, C. & Schwager, A. 2007. Customer experience. Harvard Business Review,
85(2):116-126.
Naidoo, K. 2012. Stress management and its impact on work performance of
educators in public schools in KwaZulu-Natal. (Thesis – PhD). Potchefstroom:
North-West University.
Niaz, A., Muhammad Usman, A., Abdul, R. & Leigh, S. 2009. Development of a
service quality scale for pharmaceutical supply chains. International Journal of
Pharmaceutical and Healthcare Marketing(1):26-45.
Omar, H.F.H., Saadan, K.B. & Seman, K.B. 2015. Determining the influence of the
reliability of service quality on customer satisfaction: The case of Libyan e-
commerce customers. International Journal of Learning and Development,
5(1):86-89.
Parasuraman, A., Zeithaml, V.A. & Berry, L.L. 1985. A conceptual model of service
quality and its implications for future research. The Journal of Marketing, 41-
50, Oct.
Parasuraman, A., Zeithaml, V.A. & Berry, L.L. 1988. Servqual: A multiple-item scale
for measuring consumer perc. Journal of retailing, 64(1):14-40.
Pretorius, D. 2011. The impact of the implementation of single exit pricing for
pharmaceuticals in South Africa. (Dissertation: MBA). Johannesburg: University
of the Witwatersrand.
Putit, L., Karim, N.F.A. & Zainuddin, N. 2011. Investigating the relationship between
service quality and customer satisfaction: An empirical perspective on
pharmaceutical healthcare sector. (In: Business, Engineering and Industrial
Applications (ICBEIA), 2011 International Conference on organised by: IEEE.
p. 147-152).
Ramamoorthy, R., Gunasekaran, A., Roy, M., Rai, B.K. & Senthilkumar, S.A. 2018.
Service quality and its impact on customers‟ behavioural intentions and

69
satisfaction: an empirical study of the Indian life insurance sector. Total Quality
Management & Business Excellence, 29(7-8):834-847.
Redda, E.H. 2015. Electronic banking services in South Africa: service quality scale
development and validation. (Thesis: PhD). Vanderbijlpark: North West
University.
Salvador-Ferrer, C.M. 2010. Quality of university services: Dimensional structure of
SERVQUAL vs. ESQS. Service Science, 2(3):167-176.
Shaikh, A. 2017. Measuring management and leadership competencies of business
school educated managers in South Africa. (Thesis - PhD). Potchefstroom:
North-West University.
South Africa (SA). 1965. The Medicines and Related Substances Act (Act 101 of
1965). Pretoria: State printers.
South African Pharmacy Council. 2017. South African Pharmacy Council.
http://www.pharmcouncil.co.za/B_Statistics.asp Date of access: December
2017.
Van den Heever, A. 2003. Administered Price & Health: A report for National
Treasury. http://www.treasury.gov.za/publications/other/epir/health.pdf Date of
access: 10 June 2018.
Van Heerden, J. 2010. Customer Service at a private hospital in the North-West
Province. (Dissertation - MBA). Potchefstroom: North West University.
Wicks, A.M. & Roethlein, C.J. 2009. A satisfaction-based definition of quality.
Journal of Business & Economic Studies, 15(1):82-97.
Williams, B., Onsman, A. & Brown, T. 2010. Exploratory factor analysis: A five-step
guide for novices. Australasian Journal of Paramedicine, 8(3):1-13.
Wilson, A., Zeithaml, V.A., Bitner, M.J. & Gremler, D.D. 2012. Services marketing:
Integrating customer focus across the firm. New York, NY: McGraw Hill.
Wirtz, J. & Bateson, J.E. 1999. Consumer satisfaction with services: integrating the
environment perspective in services marketing into the traditional
disconfirmation paradigm. Journal of Business research, 44(1):55-66.

70
Woods, S.A., Poole, R. & Zibarras, L.D. 2012. Employee absence and
organisational commitment: Moderation effects of age. Journal of Personnel
Psychology, 11(4):199-203.
Zeithaml, V.A., Parasuraman, A. & Berry, L.L. 1990. Delivering quality service:
Balancing customer perceptions and expectations. New York, NY: Simon and
Schuster.
Ziemba, E. & Obłąk, I. 2013. Critical success factors for ERP systems
implementation in public administration. Interdisciplinary Journal of Information,
Knowledge & Management, 8:1-19.

71
APPENDIX A: CUSTOMER SERVICE SURVEY
SECTION A: BACKGROUND
1. The pharmaceutical wholesaler is your 1st, 2
nd or 3
rd choice pharmaceutical wholesaler
1st 2nd 3rd Other
2. You receive stock from the pharmaceutical wholesaler via
Driver of the
Pharmaceutical
wholesaler
Courier
3. You are working at a:
Pharmacy Doctor’s practice Other
SECTION B: EXPECTATION/ACTUAL
There are 28 statements in the following questionnaire, each with two answers. There are no
right or wrong answers.
You will be asked to indicate the number that describes your expected and actual service
received from the Pharmaceutical Wholesaler.
Strongly Disagree Strongly Agree
1 2 3 4 5 6 7
Regarding the statements listed below; indicate in the column that states Expectation, the
level of service you expect at an excellent pharmaceutical wholesaler, and the importance of
the excellent pharmaceutical wholesalers to possess these features described in the
statements.
In the column that states Perception, indicate the actual quality of service that you receive at
Pharmaceutical Wholesaler, and to what extend does the Pharmaceutical Wholesaler
comply with these statements.

72
By choosing a 7, you will indicate that you strongly agree (excellent) and a 1 will indicate
that you strongly disagree (poor). If you feel that the expected and/or actual service provided
was between excellent and poor, then indicate 2-6.
Expectation / Importance
Statement Actual Experience / Perception
1 2 3 4 5 6 7
E 1. The Pharmaceutical Wholesaler
shows sincere interest in solving
any of your product related
problems.
1 2 3 4 5 6 7
1 2 3 4 5 6 7
R
L
2. Deliveries contain correct
quantities of products as per order.
1 2 3 4 5 6 7
1 2 3 4 5 6 7
R
L
3. Deliveries contain correct
products as ordered.
1 2 3 4 5 6 7
1 2 3 4 5 6 7
R
L
4. The Pharmaceutical Wholesaler
offers competitive pricing on non-
SEP products.
1 2 3 4 5 6 7
1 2 3 4 5 6 7
R
L
5. Promotions are communicated
effectively.
1 2 3 4 5 6 7
1 2 3 4 5 6 7
R
L
6. Promotions are relevant and
market related.
1 2 3 4 5 6 7
1 2 3 4 5 6 7
R
L
7. The Pharmaceutical Wholesaler
stock all relevant items required in
my business.
1 2 3 4 5 6 7
1 2 3 4 5 6 7
T 8. The packaging material used to
transport products is of good
quality.
1 2 3 4 5 6 7
1 2 3 4 5 6 7
T 9. The Pharmaceutical Wholesaler
has a modern online website.
1 2 3 4 5 6 7
1 2 3 4 5 6 7
T 10. Communication material such
as marketing, invoices and
statements are easy to read and
understand.
1 2 3 4 5 6 7
1 2 3 4 5 6 7
T 11. The vehicles used for
transportation are well branded.
1 2 3 4 5 6 7

73
1 2 3 4 5 6 7
T 12. Drivers delivering
pharmaceutical products act
professional.
1 2 3 4 5 6 7
1 2 3 4 5 6 7
T 13. Drivers delivering
pharmaceutical products look
presentable and professional in
appearance.
1 2 3 4 5 6 7
1 2 3 4 5 6 7
T 14. Cold chain is maintained for
fridge parcels.
1 2 3 4 5 6 7
1 2 3 4 5 6 7
A 15. Order placing by telesales
agents is accurate.
1 2 3 4 5 6 7
1 2 3 4 5 6 7
A 16. If I order within my cut-off
parameters, my stock is delivered
on time.
1 2 3 4 5 6 7
1 2 3 4 5 6 7
A 17. Deliveries incorporate my
specific business needs.
1 2 3 4 5 6 7
1 2 3 4 5 6 7
A 18. Call centre agents are always
professional.
1 2 3 4 5 6 7
1 2 3 4 5 6 7
A 19. Call centre agents have the
ability to resolve my queries.
1 2 3 4 5 6 7
1 2 3 4 5 6 7
A 20. The Pharmaceutical Wholesaler
aims to provide excellent service to
its customers.
1 2 3 4 5 6 7
1 2 3 4 5 6 7
E 21. When I have a problem, The
Pharmaceutical Wholesaler shows a
sincere interest in solving it.
1 2 3 4 5 6 7
1 2 3 4 5 6 7
E 22. The call centre is easy to reach.
1 2 3 4 5 6 7
1 2 3 4 5 6 7
E 23. The Pharmaceutical Wholesaler
has payment methods that are
convenient to me.
1 2 3 4 5 6 7
1 2 3 4 5 6 7
E 24. The Pharmaceutical Wholesaler
personnel fulfil my specific
business requirements.
1 2 3 4 5 6 7

74
1 2 3 4 5 6 7
R 25. The Pharmaceutical Wholesaler
responds effectively within a
reasonable timeframe to my
account enquiries.
1 2 3 4 5 6 7
1 2 3 4 5 6 7
R 26. The Pharmaceutical Wholesaler
responds effectively within a
reasonable timeframe to my
complaints.
1 2 3 4 5 6 7
1 2 3 4 5 6 7
R 27. The call centre agents are able
to inform customers on when an
order will be delivered.
1 2 3 4 5 6 7
1 2 3 4 5 6 7
R 28. The Pharmaceutical Wholesaler
delivers in time and in full.
1 2 3 4 5 6 7
Suggestions:
…………………………………………………………………………………………………
…………………………………………………………………………………………………
THANK YOU FOR YOUR TIME TO COMPLETE THE SURVEY

75
APPENDIX B: EDITOR’S CERTIFICATE