Service Oriented Mapping: Maps, Apps, Tools and Subscriptions
8
Service Oriented Mapping: Maps, Apps, Tools and Subscriptions Paul Hardy, David Watkins Esri, USA : [phardy,dwatkins]@esri.com ABSTRACT This paper reviews the service-oriented mapping capabilities of a desktop, server, and cloud GIS (Esri ArcGIS), as we move to the new world of “maps of everything, everywhere, for everyone” and online spatial data infrastructure. It describes the concepts of multi-scale basemaps and overlaid operational layers, including the tiered scale data models and cloud resources used for whole-world maps that show content down to detailed scales. It provides examples of basemap services, their cartography, and their use to spatially locate foreground content from different countries and communities. It explains how contextual abstraction tools can be used to produce intermediate scale bands. Finally, it highlights and explores the business model shift from software licenses to usage subscriptions instigated by service-oriented mapping, as exemplified by ArcGIS Online. 1 INTRODUCTION The art, craft and science of cartography is changing rapidly. No longer is a single map produced on a paper sheet as a result of one cartographer spending weeks of effort. Now: The public expect maps of everything, everywhere, for everyone – provided by commodity services like Google Maps, Bing Maps, or ArcGIS.com Cloud computing is providing massive scalability of cartographic resources, and data volumes are rising from Megabytes through GB, TB, to Petabytes We expect not just one map but 20 consistent zoom levels, from the whole world down to individual houses. Automated generalization is becoming possible, to derive smaller scale from larger. Greater cartographic capabilities are available in GIS, so graphical finishing systems are no longer needed. Data sources are evolving beyond authoritative data from National Mapping and Cadastral Agencies (NMCAs), we take from multiple sources including from individuals by crowdsourcing (volunteered geographic information). 2 BASEMAPS 2.1 GIS Basemaps Historically, each map would be compiled from source data and printed for a particular purpose. Now, the trend is for maps to be the result of combining foreground information from GIS analysis, with a background basemap to give spatial context. Examples of basemaps are those from Esri’s ArcGIS Online, through ArcGIS.com. Each of these maps is a multi-scale resource showing increasing detail as you zoom in – at 20 scales from the whole world at 1:591,657,528 down to the most detailed at 1:1,128. The range of basemaps includes: Imagery basemap – aerial photography imagery, mosaicked and harmonized Streetmap – basemap focused on the man-made environment, particularly roads Topographic basemap – more general basemap showing the shape and content of the land Canvas basemap – muted color basemap, allows foreground information to stand out National Geographic – familiar style, good for larger areas Oceans basemap – invaluable for the 70% of the world that is not land, but also for light physical maps. National Geographic Streetmap Topographic Light Gray Canvas Fig. 1 - Spectrum of cartographic styles
Transcript of Service Oriented Mapping: Maps, Apps, Tools and Subscriptions

Service Oriented Mapping: Maps, Apps, Tools and Subscriptions
Paul Hardy, David Watkins
Esri, USA : [phardy,dwatkins]@esri.com
ABSTRACT This paper reviews the service-oriented mapping capabilities of a desktop, server, and cloud GIS (Esri ArcGIS), as we move to the new world of “maps of everything, everywhere, for everyone” and online spatial data infrastructure. It describes the concepts of multi-scale basemaps and overlaid operational layers, including the tiered scale data models and cloud resources used for whole-world maps that show content down to detailed scales. It provides examples of basemap services, their cartography, and their use to spatially locate foreground content from different countries and communities. It explains how contextual abstraction tools can be used to produce intermediate scale bands. Finally, it highlights and explores the business model shift from software licenses to usage subscriptions instigated by service-oriented mapping, as exemplified by ArcGIS Online.
1 INTRODUCTION
The art, craft and science of cartography is changing rapidly. No longer is a single map produced on a paper sheet as a result of one cartographer spending weeks of effort. Now: The public expect maps of everything, everywhere, for everyone – provided by commodity services like
Google Maps, Bing Maps, or ArcGIS.com Cloud computing is providing massive scalability of cartographic resources, and data volumes are rising
from Megabytes through GB, TB, to Petabytes We expect not just one map but 20 consistent zoom levels, from the whole world down to individual houses. Automated generalization is becoming possible, to derive smaller scale from larger. Greater cartographic capabilities are available in GIS, so graphical finishing systems are no longer needed. Data sources are evolving beyond authoritative data from National Mapping and Cadastral Agencies
(NMCAs), we take from multiple sources including from individuals by crowdsourcing (volunteered geographic information).
2 BASEMAPS
2.1 GIS Basemaps
Historically, each map would be compiled from source data and printed for a particular purpose. Now, the trend is for maps to be the result of combining foreground information from GIS analysis, with a background basemap to give spatial context. Examples of basemaps are those from Esri’s ArcGIS Online, through ArcGIS.com. Each of these maps is a multi-scale resource showing increasing detail as you zoom in – at 20 scales from the whole world at 1:591,657,528 down to the most detailed at 1:1,128. The range of basemaps includes: Imagery basemap – aerial photography imagery, mosaicked and harmonized Streetmap – basemap focused on the man-made environment, particularly roads Topographic basemap – more general basemap showing the shape and content of the land Canvas basemap – muted color basemap, allows foreground information to stand out National Geographic – familiar style, good for larger areas Oceans basemap – invaluable for the 70% of the world that is not land, but also for light physical maps.
National Geographic Streetmap Topographic Light Gray Canvas
Fig. 1 - Spectrum of cartographic styles

The set of basemaps is designed with a strong-to-mild spectrum of cartography [Fig. 1]. The intention is that one of these cartographic styles should meet most users’ needs given the application and the type of operational data they are using. At the cartographically rich end of the spectrum is the National Geographic Map, which is more likely to be used as a standalone map. At the more subdued end of the spectrum is the Light Gray Canvas Map, which will almost always be used as a backdrop for thematic data. The World Streetmap and World Topographic Map fall in the middle. 2.2 Basemap Samples
In the following set of samples, Figures 2-3 compare the National Geographic style against the Oceans map for the area around Austria. Similarly Figures 4-6 compare the city of Vienna in Imagery, Streets and Canvas maps. Figure 7 shows the center of Vienna in the topographic style.
Fig. 2 – National Geographic Style Fig. 3 – Oceans
Fig. 4 – Imagery Fig. 5 – Streets
Fig. 6 – Canvas Fig. 7 – Topographic

2.3 Community Basemaps
The Topographic basemap has an extra twist because it is the result of a community process. Esri generates the smaller scale bands, but asks its users and international distributors to source appropriate data for the larger scales, and to build the tile cache for these scales. The data used varies from country to country, but increasingly is able to take advantage of the move by governments to provide free or open data, including map data from national mapping agencies. Such core spatial data forms the basis of a Spatial Data Infrastructure (SDI). In Europe, this is being further driven by the INSPIRE directive on environmental data accessibility, and the PSI Directive on the re-use of public sector information. 2.4 Community Basemap Evolution
The cartography and implementation of these basemaps is still evolving. Coming soon will be a new community topographic map mechanism with new, more consistent but more muted symbology, and further reducing conflict with GIS foreground information. In addition the implementation framework is changing to hold vector data from the community, rather than contributed raster cache tiles, so in the future common data can be rendered for multiple basemap cartographies.
Fig. 8 – Old Cartography - 9K Fig. 9 – New cartography – 9K
Fig. 10 – Old Cartography - 144K Fig. 11 – New Cartography - 144K
3 GENERALIZATION
3.1 Generalization and Conflict Resolution
Generalization in cartography is the simplification and clarification of features to improve display at smaller scales. Conflict Resolution is the management of the extent and placement of symbolized features on maps. Both processes improve the quality of multi-scale map display, and automation of both is needed to achieve efficient generation of multi-scale basemaps. 3.2 Optimization for generalization
Esri has been working for several years on an optimized, constraint-based approach to solving generalization problems within a commercial GIS [Monnot, Hardy, Lee 2007]. ArcGIS 10 introduced a new generation of generalization tools based on an underlying optimizer kernel, and this set has been enlarged and refined in ArcGIS 10.1. The optimization approach seeks to modify geographic features based on a series of pre-defined constraints designed to clarify the display of that data at smaller scales. Examples of constraint are: a building cannot be closer than the specified distance from another building a building cannot move too far from its original location a building cannot appear smaller than a minimum size The satisfaction of an individual constraint is improved with one or more corresponding actions. Examples of actions are “move the building away”, “move the building back”, “enlarge the building” and “suppress the building.” Since constraints often conflict, the optimization approach seeks to find the best overall solution, even if the satisfaction of some constraints must be somewhat compromised. This is consistent with the very nature of cartography which has always required informed compromises about what to display on a map, at each scale 3.3 Geoprocessing for Generalization
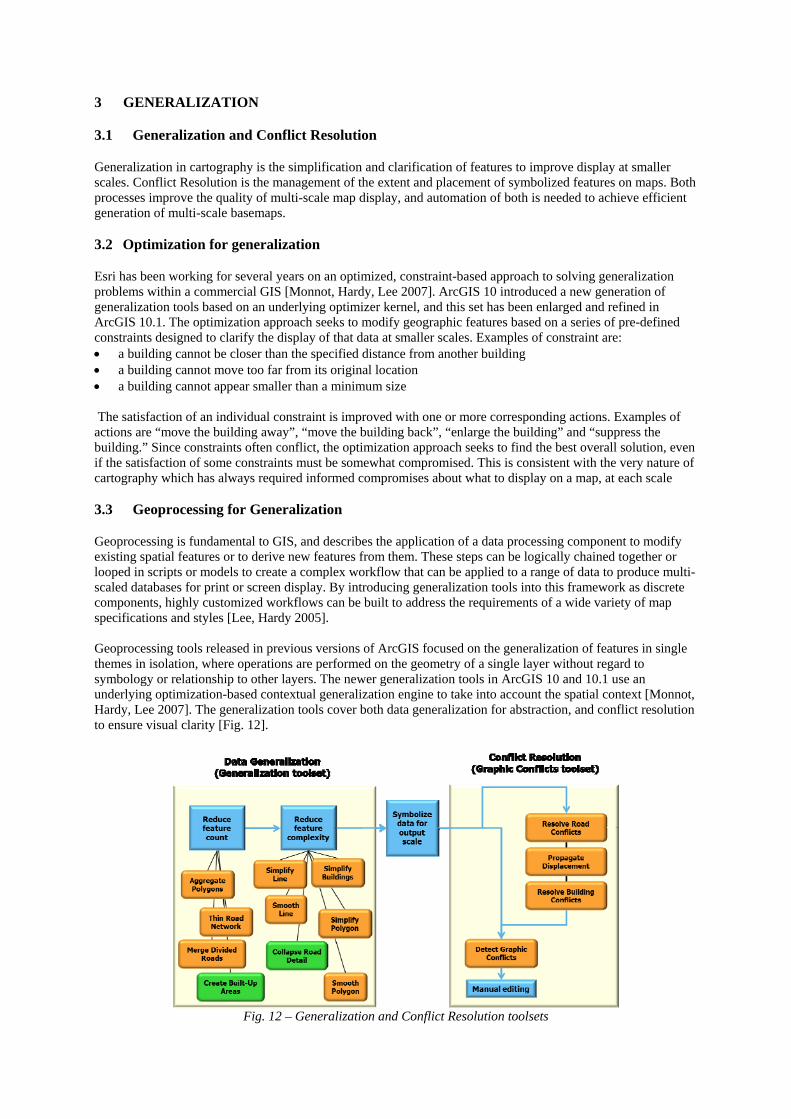
Geoprocessing is fundamental to GIS, and describes the application of a data processing component to modify existing spatial features or to derive new features from them. These steps can be logically chained together or looped in scripts or models to create a complex workflow that can be applied to a range of data to produce multi-scaled databases for print or screen display. By introducing generalization tools into this framework as discrete components, highly customized workflows can be built to address the requirements of a wide variety of map specifications and styles [Lee, Hardy 2005]. Geoprocessing tools released in previous versions of ArcGIS focused on the generalization of features in single themes in isolation, where operations are performed on the geometry of a single layer without regard to symbology or relationship to other layers. The newer generalization tools in ArcGIS 10 and 10.1 use an underlying optimization-based contextual generalization engine to take into account the spatial context [Monnot, Hardy, Lee 2007]. The generalization tools cover both data generalization for abstraction, and conflict resolution to ensure visual clarity [Fig. 12].
Fig. 12 – Generalization and Conflict Resolution toolsets

The Thin Road Network [Fig. 13], Merge Divided Roads, and the new Collapse Junction [Fig. 14] tools simplify road networks while the Resolve Road Conflicts and Resolve Building Conflicts tools redistribute and reshape roads and buildings to avoid symbol conflicts while retaining characteristic pattern and density. To ensure that each tool works with one another to produce a consistent display, the Propagate Displacement tool propagates positional adjustments made during conflict resolution, to adjacent features.
Fig. 13 – Simplify Road Network Fig 14. – Collapse Junction 3.4 Generalization Use Case
A practical example of application of these new generalization tools has been shown by a prototyping project at Netherlands Kadaster, involving Esri NL, and research from ITC Enschede [Stoter et al 2011]. This takes 10K topographic data in the Top10NL data model, and derives 50K topographic mapping by use of the Esri optimizer-based contextual generalization tools, built into complex geoprocessing models in combinations with the many basic geoprocessing tools in the ArcGIS framework [Fig. 15].
Fig. 15 – NL generalization 10K to 50K
4 MAPS AND APPS
4.1 Web Maps
Putting selected foreground features on top of a basemap results in a map (web map or printable map) that provides a targeted set of spatial information to the user. Web maps can also contain more information than a traditional paper map in the form of dynamic popups activated by clicking on foreground features> These popups as well as showing feature attributes can contain charts and graphs, photos, hyperlinks, etc., and can add richness to the map experience.

Example in Figure 16 is a simple one showing Esri office locations in Europe, and then a more complex one showing the different kinds of mapping agencies in Europe at national and autonomous regional level [Fig. 17].
Fig. 16 – Esri offices over Topographic basemap Fig. 17 – Mapping agencies over Oceans basemap 4.2 Applications – ‘Apps’
Taking a step beyond the simple web map, it is now easy to embed the map (basemap with foreground) in a web or mobile application (an ‘App’), often for use in on a smartphone (e.g. iPhone or Android). The ‘app’ allows for presentation of related information, and complex interaction with the foreground features of the map. It is often useful to think of such apps as telling a story which pulls the user into involvement with the data. Figure 18 below tells the story of the sinking of the Titanic and of its passengers. It uses the Esri Oceans basemap, together with tabular information for passengers, point symbology for origins and destinations, lines for routes, etc., all linked so that clicking on an origin point shows the passengers from there and their fates.
Fig. 18 – Story of Titanic passengers

Figure 19 uses the evolution of a series of shaded polygon maps through time, to tell the story of the advance of cellular radio technology and the mobile phone. More such example story maps and apps are found at http://storymaps.esri.com.
Fig. 19 – Story of mobile phone usage through time
5 BUSINESS MODEL CHANGES
5.1 Traditional software licensing
Traditionally, computer software has been licensed by the supplier for use on a particular computer. This was and is the case for desktop mapping software, as typified by ArcGIS Desktop (ArcMap). When server technologies appeared, they were hosted within the enterprise or organization, on identifiable computers, and a similar software licensing arrangement worked OK for web mapping. However, with the advent of ‘the cloud’, there came the wish to run mapping server services outside the enterprise, taking advantage of highly scalable meshes of computers distributed in centers around the world. Examples are the Amazon EC2 (Elastic Compute Cloud), and Microsoft Azure. In this case, it is harder to identify particular machines as being licensable, and fast scalability requires fast changes in licensing, so a new model was needed. 5.2 Subscription model
The majority of mapping in the future is likely to be done using software which is licensed using a subscription model. Such a model has costs increasing with the number of persons who are users, together with the amount of compute, storage and network bandwidth they use. This is similar to the subscription model of mobile phone usage, where a monthly fee gives access to a ‘bundle’ of calls and data transfer, but usage beyond the bundle attracts extra costs. The ArcGIS.com subscription model follows this pattern, with a basic subscription supporting a given number of users, and providing a base level of resources in the form of map tiles rendered, addresses located, etc., which would be sufficient for normal usage. Beyond the base subscription, ‘credits’ can be applied in order to cope with sudden demands for extra mapping – e.g. generating new basemaps for an environmental emergency (flood, earthquake, etc.). The subscription model allows for low-cost project startup using minimal users and resources, but then rapid scalability during rollout to the enterprise, or to the public.

6 CONCLUSIONS
The move to “maps of everything, everywhere, for everyone” is underpinned by a transition from traditional one-off paper mapping, to use of mapping services. These services are increasingly hosted on cloud computing resources.
Service-oriented maps make intensive use of multi-scale basemaps as backgrounds, with overlaid operational layers.
Contextual abstraction tools can produce intermediate scale bands, or tailored cartographic services. Apps, increasingly used on smartphones, take the basemap plus the operational layers and add rich
interaction to provide supporting information and to tell a story. The business model of service-oriented mapping involves a shift from software licenses to usage
subscriptions. Esri’s ArcGIS, running on the desktop and server, and now as cloud-based subscription services,
typifies the transitions happening in the mapping marketplace.
7 REFERENCES
Lee D., Hardy, P. (2005) “Automating Generalization - Tools and Models”, Proceedings of the International Cartographic Conference (ICC), A Coruña, Spain, July 2005.
Monnot, J-L; Hardy, P.; Lee, D. (2007) “An Optimization Approach to Constraint-Based Generalization in a
Commodity GIS Framework”, ICA Workshop on Generalisation and Multiple Representation, Moscow, August 2007.
Stoter, Nijhuis, Post, van Altena1, Bulder, Bruns, van Smaalen, “Feasibility study on an automated
generalisation production line for multiscale topographic products”, ICA Generalisation and Multiple Representation, Paris, June 2011
8 ACKNOWLEDGEMENTS
This paper would not have been possible without the help of the Esri cartography team in Redlands and Europe.
9 BIOGRAPHIES
HARDY (Paul Geoffrey), M.A. MBCS C.Eng CITP FBCart.S Paul graduated in 1975 with a M.A. in Computer Science from Cambridge University in England. He worked for 28 years at Laser-Scan Ltd in Cambridge England, where he held roles of Chief Programmer, Product Manager, and Principal Consultant. He was Product Manager for Cartography at Esri in Redlands California from 2003 to 2006, and project managed the implementation of advanced cartographic capabilities into ArcGIS. He is now Business Development Consultant for Esri in Europe, focused on national mapping and cadastral agencies. He is a Chartered Engineer, a Fellow of the British Cartographic Society and a Member of the British Computer Society. Because of his time in business development and in software development, he bridges the communication gap between business users and technical professionals. WATKINS (David), M.S. David graduated in 1995 with a M.S. in Cartography from Brigham Young University in the United States. He worked for 5 years at H.M. Gousha, a map publisher located in Texas, where he held the position of GIS and Multi-media Manager. David joined Esri in Redlands, California in 1996 where he worked as a Technical Project Manager and a Product Manager for the Production Line Toolset. In 2008, David assumed the responsibilities of Cartography Product Manager working primarily with the ArcGIS Desktop product. David is on the Board of Directors for the International Map Trade Association (Americas), is a member of the North American Cartographic Information Society and the British Cartographic Society. His professional interests include automated cartography, design, and cartographic production. He works closely with customers and partners developing requirements and use cases used to drive cartographic software development..