
TELEMARKETING SERVICE FOR EXPORT. Lattelecom Group Structure.

Policy Research Working Paper 5793
Service Export Sophistication and Europe’s New Growth Model
Susanna Lundstrom Gable Saurabh Mishra
The World BankEurope and Central Asia RegionOffice of the Chief EconomistSeptember 2011
WPS5793P
ublic
Dis
clos
ure
Aut
horiz
edP
ublic
Dis
clos
ure
Aut
horiz
edP
ublic
Dis
clos
ure
Aut
horiz
edP
ublic
Dis
clos
ure
Aut
horiz
edP
ublic
Dis
clos
ure
Aut
horiz
edP
ublic
Dis
clos
ure
Aut
horiz
edP
ublic
Dis
clos
ure
Aut
horiz
edP
ublic
Dis
clos
ure
Aut
horiz
ed

Produced by the Research Support Team
Abstract
The Policy Research Working Paper Series disseminates the findings of work in progress to encourage the exchange of ideas about development issues. An objective of the series is to get the findings out quickly, even if the presentations are less than fully polished. The papers carry the names of the authors and should be cited accordingly. The findings, interpretations, and conclusions expressed in this paper are entirely those of the authors. They do not necessarily represent the views of the International Bank for Reconstruction and Development/World Bank and its affiliated organizations, or those of the Executive Directors of the World Bank or the governments they represent.
Policy Research Working Paper 5793
Technology has changed the nature of service activities and made them more productive, tradable and fragmented in the global supply chain. Has Europe’s growth been benefiting from the ongoing globalization of services? Services dominate growth in EU-15 countries and, to a lesser extent, in New Member States (NMS) and Accession (ACC) countries. Except in the ACC
This paper is a product of the Office of the Chief Economist, Europe and Central Asia Region. It is part of a larger effort by the World Bank to provide open access to its research and make a contribution to development policy discussions around the world. Policy Research Working Papers are also posted on the Web at http://econ.worldbank.org. The authors may be contacted at [email protected] and [email protected].
region, Europe has maintained specialization in service exports. Service productivity, tradability, and exports of modern services are high in EU-15, growing fast in NMS while at a lower pace in ACC. Service export sophistication is important for growth across the region, but especially in NMS.

SERVICE EXPORT SOPHISTICATION AND
EUROPE’S NEW GROWTH MODEL
SUSANNA LUNDSTROM GABLE AND SAURABH MISHRA *
OFFICE OF THE CHIEF ECONOMIST EUROPE AND CENTRAL ASIA
THE WORLD BANK
Keywords: services, trade, structural transformation, productivity, economic growth, sophistication, economic
integration, globalization, Europe.
JEL Classification: F01, O4, O52
*Gable: The World Bank (e-mail: [email protected]) and Mishra: The World Bank (e-mail:
[email protected]). This research paper was prepared as a background paper for the 2011 Europe
and Central Asia Flagship Report ―Restoring the Luster of the European Growth Model‖. We are grateful for
valuable comments from Indermit Gill and Yue Li. We are also grateful to Ivan Kandilov, Thomas Grennes for
sharing their data on direction of trade. The views expressed in this paper are those of the authors, and do not
necessarily represent those of the World Bank group or its executive directors. Any remaining errors are solely
ours.

2
1 INTRODUCTION
Europe is the world‘s most integrated, sophisticated and largest commercial services exporter.
The region accounts for more than half of global services trade. Europe‘s economic growth is
also increasingly services driven. The world in the mid-1990s saw two seemingly separate but
related developments: the revolution in information and communication technology; and the
rapid developments in those global forces often referred to as the 3Ts—technology,
transportability, and tradability (Ghani and Kharas, 2010). Those two developments had a
profound impact on the nature, productivity, and tradability of services. They resulted in rapid
growth of what can be called ―modern impersonal progressive services,‖ such as information
technology, business processing services, education services, entertainment, production
services, designing, marketing and the growing internationalization of innovation. These
services differ significantly from traditional personal services that demand face-to-face
interaction. A rising number of services can now be stored and traded digitally (―intangible
goods‖) similar to manufacturing goods. These sophisticated service-exporting sectors provide
for broad based growth and an opportunity for relatively innovative, high-tech job creation. The
purpose of this paper is to better understand the developments of service exports sophistication
in Europe and to what extent different groups of countries have taken advantage of the
globalization of services.
Previous literature shows that the performance of the service sector across European countries
is heterogeneous, despite patterns of convergence. The contribution of services to GDP growth
for Eastern Europe and Central Asia was below 50 percent of GDP in 1990. Since then
however it has been catching up, with the Baltic countries making the most significant progress
(over 60 percent of GDP growth). This post-transition shift towards services within Eastern and
Central Europe has contributed to an increase in aggregated productivity (World Bank, 2008).
Furthermore, countries in Eastern and Central Europe that made progress in terms of
productivity-enhancing service reforms, such as reforms toward financial and infrastructure
services, have attracted more FDIs and had higher economic growth (Eschenbach and
Hoekman 2006). The difference in the service productivity gap between EU-15 and Eastern
Europe, including the Baltics, is shrinking due to the latter groups catching up (Fernandes
2009). On the sector-level we see that service sub-sectors that have achieved higher results in
terms of policy reforms have exhibit higher growth. This effect is stronger for sub-sectors
further from the technological frontier, suggesting liberalization of the service sector can affect
the speed of catching up. Moreover, Fernandes (2009) shows that service productivity growth
has spillover effects in the rest of the economy.1 However, these facts beg the question how far
specialization in services can go in Europe, given the globalization of services and competition
not least from Asia. The development of modern service exports has changed the directions of
global trade, challenging Central and Eastern Europe as an effective competitor of Asia. For
example, geographic proximity is important for construction services but is negligible for
computer-related services (Kandilov and Grennes, 2010). However, the relative quality of legal
institutions and single market efficiency is important for trade across a range of both traditional
1 The external effects on the rest of the economy are different for different service categories, presumably larger for services with
higher sophistication.

3
and modern services.
There are two aspects of this new channel for growth – specialization within service exports
and the sophistication of service exports – of which the latter has been less studied. A key
component of economic development and the growth process is an increase in the
sophistication of a country‘s production (of good and services), and in particular of its exports.
What a country produces and exports matters for growth: ‗… not all goods are alike in terms of
their consequences for economic performance. Specializing in some products will bring higher
growth than specializing in others‘ (Hausmann et al, 2007, henceforth HHR; see also Lall et al,
2005). Some products may yield greater knowledge spillovers, have a greater potential for
backward and forward linkages, or offer an easier pathway toward other products with such
characteristics. Ultimately, some products are more sophisticated, in the sense that they are
associated with higher productivity levels, and HHR shows that those countries that latch on to
such products will perform better. To examine this phenomenon for service exports, Mishra,
Lundstrom, and Anand (2011) created an index for service exports sophistication, ‗Service
EXPY‘. The empirical results suggest that exports‘ quality in services is positively associated
with economic growth. The results further suggest that this phenomenon is growing in
importance over time. While growth in manufacturing is still an important track for many
countries, service exports and an increase in their sophistication may be an additional or even
alternative channel for sustained high growth.
The paper begins with motivating the analysis by showing some stylized facts in Section 2,
concluding that services dominate growth in Europe and that service productivity, tradability,
exports of modern services are high in EU-15, growing fast in NMS while at a lower pace in
ACC. In Section 3 we start by presenting the methodology of the Service EXPY index and then
show the components and evolution of service export sophistication across European countries.
We present regression results in Section 4, demonstrating the link between service export
sophistication and growth, especially strong in NMS. Section 5 concludes that service export
sophistication will continue playing a critical role in Europe‘s future growth.
2 STYLIZED FACTS
This section will present some stylized facts in terms of services, trade and growth in Europe,
in relation to the rest of the World. The idea is to capture the growing importance of services
and its changing nature, and to what extent Europe has followed these trends. We present the
result for three groups: EU-15, EU New Member States (NMS) and EU Accession countries
(ACC), as defined in Table 1.

4
Table 1: Country groups: EU-15, NMS and ACC. Countries
EU-15 Belgium, Greece, Luxembourg, Denmark, Spain, Netherlands, Germany, France, Portugal, Ireland, Italy, United Kingdom, Austria, Finland, Sweden.
NMS (EU New member states) Poland, Czech Republic, Cyprus, Latvia, Lithuania, Slovenia, Estonia, Slovakia, Hungary, Malta, Bulgaria and Romania.
ACC (EU Accession countries) Albania, Croatia, Macedonia, Montenegro and Turkey
Note: These groups stay the same throughout the analysis even though some of them have changed their formal country group categories during the time period studied.
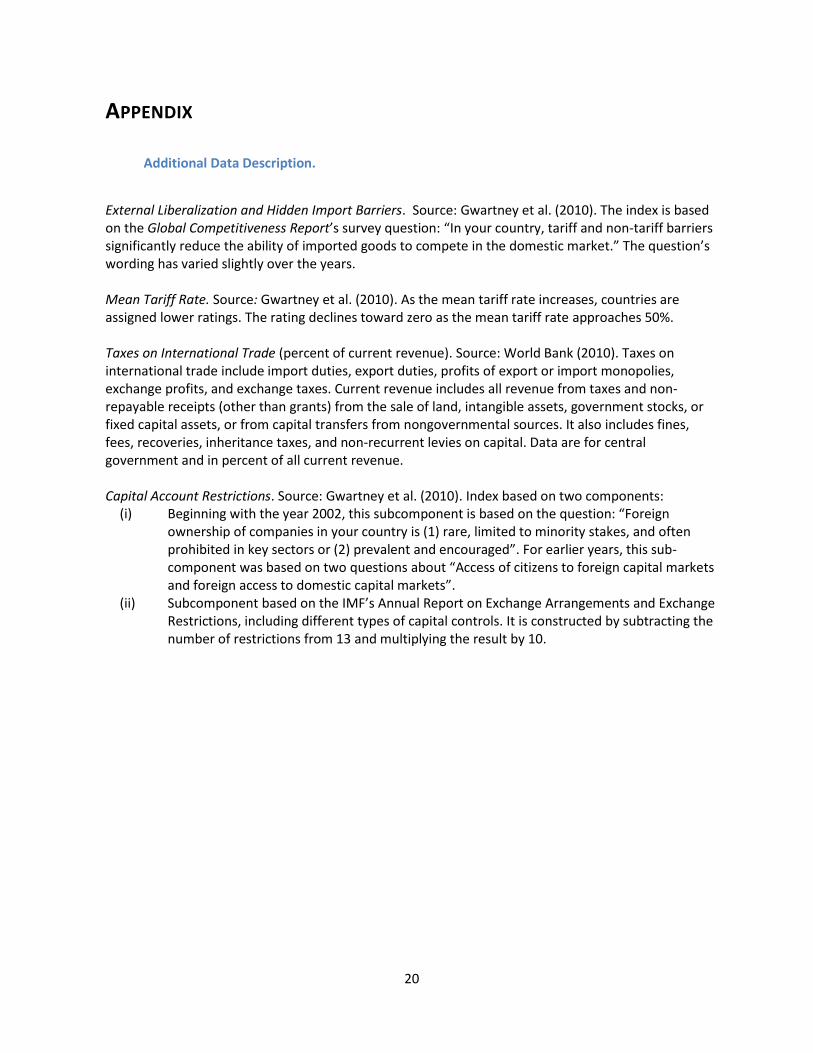
To start out we see that the share of service value added as a percentage of GDP is very high in
EU-15 and NMS, while it is lower in ACC (Figure 1, see also Figures A1-3 in the Appendix for
reference to specific countries). This is expected given their income levels, but many NMS
countries have even higher than expected service shares and ACC lower than expected. Figure
2 (and Figures A4-6) shows GDP growth - controlling for initial income levels and initial levels
of services value added as a share of GDP - for 127 countries over 2000-07, against service
value added growth. EU-15 grew slower than the other groups, both in terms of overall growth
and growth in service value added, which partly is explained by a catching up effect in NMS
and ACC that start out at lower initial levels. However, most European countries have a higher
than expected GDP growth than suggested by their service value added growth. Perhaps there
is a higher share of services being exported or the sophistication is higher, resulting in a larger
growth impact of their service value added share?
Figure 1. Share of service value added as a percentage of GDP vs GDP per capita, 2009.
Source: World Development Indicators, World Bank, 2010 and authors’ calculations.
2040
6080
Servi
ce V
alue a
dded
perce
nt of
GDP
2009
6 7 8 9 10 11Log Per capita GDP PPP $2009
Note: black - all countries, red - EU-15, blue - NMS, green - Accession

5
Figure 2. GDP growth versus service value added growth, 2000-07.
Source: World Development Indicators, World Bank, 2010 and authors’ calculations.
To better understand the link between services and growth in Europe we will look closer into
the following questions: (1) Is there a growing importance of services in growth? (2) Is
productivity of services increasing? (3) Is there an increasing tradability of services? (4) Is
Europe‘s service exports evolving from traditional to modern? (5) Does Europe have
specialization in service exports? (6) What are the trends in terms of direction of Europe‘s
service exports?
2.1 The growing importance of services for general growth
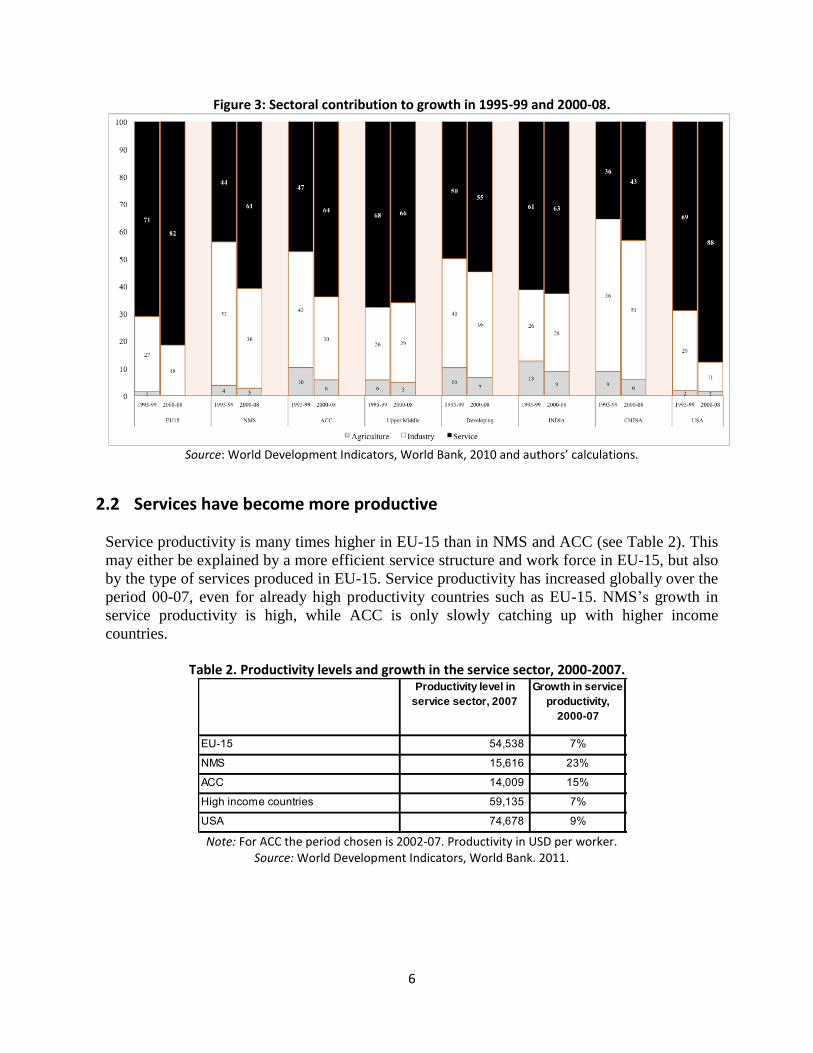
The sectoral contribution of services to GDP growth has risen for most countries in the world
and the services share in global production has increased considerably. Looking specifically at
EU-15, we see that it has a very high level of service domination in recent growth (82 percent),
similar to USA and other advanced countries (see Figure 3, and Figures A7-9 for specific
countries). As shown earlier, growth in services is somewhat lower than expected, even when
taking the relatively low GDP growth in EU-15 into account, but the share of services in GDP
is so significant that it is still the dominating sector for overall growth. Only with the exception
of Finland and Germany, growth in EU-15 is increasingly service dominated when comparing
the two periods, 1995-99 and 2000-08. Expectedly, growth in NMS and ACC is less service
driven but again, the trend is an increasing dominance of services for growth – the contribution
rose from 50 to 60 percent in NMS and 49 to 64 percent in ACC. Maybe more surprisingly,
ACC is – albeit only slightly - more services driven than NMS. However, the next question is
what type of services Europe and the different country groups are producing and in particular
exporting. We will see that the type of service growth in ACC is very different.
-4-2
02
46
Grow
th in
per c
apita
inco
me c
ontro
l for i
nitial
per
capit
a inc
ome
0 5 10Service output growth
Note: black - all countries, red - EU-15, blue - NMS, green - Accession
6
Figure 3: Sectoral contribution to growth in 1995-99 and 2000-08.
Source: World Development Indicators, World Bank, 2010 and authors’ calculations.
2.2 Services have become more productive
Service productivity is many times higher in EU-15 than in NMS and ACC (see Table 2). This
may either be explained by a more efficient service structure and work force in EU-15, but also
by the type of services produced in EU-15. Service productivity has increased globally over the
period 00-07, even for already high productivity countries such as EU-15. NMS‘s growth in
service productivity is high, while ACC is only slowly catching up with higher income
countries.
Table 2. Productivity levels and growth in the service sector, 2000-2007.
Note: For ACC the period chosen is 2002-07. Productivity in USD per worker.
Source: World Development Indicators, World Bank. 2011.
Productivity level in
service sector, 2007
Growth in service
productivity,
2000-07
Growth in industry
productivity, 2000-07
EU-15 54,538 7% 20%
NMS 15,616 23% 40%
ACC 14,009 15% 28%
High income countries 59,135 7% 16%
USA 74,678 9% 18%

7
2.3 Services are becoming more tradable
No more than 10 percent of service value added is currently exported, which could be
compared to 90 percent of goods exports in industrial value added. However, growth in service
tradability has been considerable (Mishra, Lundstrom and Anand, 2011). There are now a host
of new services that can be traded, and more countries are taking advantage of the globalization
of services. NMS has been the very successful in growing its service exports, especially since
mid-2000s (see Figure 4). It is still far from star performers such as Indian and China but is
doing well compared to the rest of the world. EU-15 has also made progress while ACC is
falling behind the rest of the world.
Figure 4: Development of Service Export (1998=100).
Source: Balance of Payments, IMF. 2011.
Figure 5: Service exports as a share of service value added (%), 1990-2007.
Source: Balance of Payments, IMF and World Development Indicators, World Bank. 2011.
0
100
200
300
400
500
600
700
800
900
1000
1998 1999 2000 2001 2002 2003 2004 2005 2006 2007 2008
eu-15 new member accessions developing upper middle china india
0
5
10
15
20
25
1986 1988 1990 1992 1994 1996 1998 2000 2002 2004 2006 2008
EU-15 NMS ACC Developing
Upper middle India China

8
In Figure 5, we present the development of services tradability (as proxied by service exports in
service value added) for EU-15, NMS and ACC, between 1990 and 2007.2 First, it is worth
noticing that they all start off at about the same level around 1990. Service tradability in EU-15
has then followed a smooth increasing trend and traded services of a value equal to about 15
percent of its service value added in 2007. Interestingly, the NMS and ACC doubled their
tradability in the early 1990s. However, this may be explained by a very limited service sector
value added after the transition. Given the relatively limited opportunities domestically for
these countries at that moment, an expansion of exported services had a large effect on this
tradability measure. Since the mid-1990s service tradability has been more or less constant in
NMS at as high as 17 percent in 2007, while service tradability in ACC has decreased to about
11 percent. Again, this decrease in ACC is more likely to be related to a domestic service
expansion, such as in construction, rather than a drop in service exports.3
2.4 Evolution of services from traditional to modern The 3T‘s have changed the very nature of services from traditional to modern. These modern
services (such as financial services, information processing services, business services,
computer and information services etc.), which are digitally tradable and impersonal
(―intangible goods‖), take advantage of ICT, globalization, and scale of economies. However,
there is also ample scope for traditional service (such as tourism, education, musicians,
entertainment production media etc. which require face to face contact) to absorb productivity
gains, knowledge spillovers, tradability and fragmentation from ICT, so the previous patterns
we have seen does not necessarily mean that there has been a move from traditional to modern
services.
Figure 6 shows how annual growth in modern and traditional services differ for the period
2000-08. Modern services have been growing faster as a world average and EU-15 and NMS
both follow the global pattern. NMS is growing faster than the rest of Europe in modern
services, as well as traditional services. ACC are growing their traditional services, but modern
services are even contracting. Looking back at Figure 3 on the higher contribution of services
to growth in ACC than NMS we now suspect that this growth is mainly in traditional services
resulting in the low productivity growth for ACC presented in Table 1.
2 Compare with goods tradability in Figure A10. 3 This jump in early 1990s did not happen for NMS and ACC when looking at goods tradability as domestic production (see Fig
A10 in the Appendix).

9
Figure 6: Annual growth in modern and traditional services, 2000-08.
Notes: Modern Services include communication, insurance, finance, computer & information, royalties and license fees and other business services. Traditional service are Transport, Travel, Construction, Personal, cultural and recreational services.
2.5 Europe’s comparative advantage in service exports
Next we study the revealed comparative advantage (RCA), as defined by the share of a
particular export in a country‘s export basket compared to the share of that export in the global
export basket, in the three European groups.4 EU-15 has RCA in services and the gap between
goods and services is increasing. NMS has also a comparative advantage in services (see Figure
7). The gap to goods was large in the 1990s but has now decreased to the same level as in EU-
15. ACC did have a comparative advantage in services until early 2000s when it dropped and
has since had a comparative disadvantage in services. Figure 7: Revealed comparative advantage in services and goods, for EU-15, NMS and ACC, 1990-007.
Source: Authors‘ calculation using Balance of Payments, IMF. 2011.
4 Formally, the RCA index for country C and product J is defined as: WTWJCTCJ EEEERCA /// , where E denotes exports, T
denotes all products, and W denotes the world.
0
0.5
1
1.5
2
2.5
Goods Services
0
0.5
1
1.5
2
2.5
Goods Services
0
0.5
1
1.5
2
2.5
Goods Services

10
2.6 The direction of European service trade
The nature of modern service exports has affected the direction of global trade and the global
centers of growth. This raises the question to what extent Central and Eastern Europe can be an
effective competitor to Asia. For example, geographic proximity is important for construction
services but is negligible for computer-related services (Kandilov and Grennes, 2010). We are
here interested in looking at the direction of commercial services exports in modern and
traditional activities. Given the limitation of such data, we compare modern and traditional
service exports to EU-15 from India, EU-15 itself and NMS, in 2002 and 2004. As seen in
Figure 8, modern services exports from India to EU-15 grew rapidly whereas the growth in
traditional and construction services shrunk. In the case of exports from NMS to EU-15 both
modern and traditional service exports have increased, but traditional more so. No hard
conclusions should be made as we do not have recent enough data, but at least in the beginning
of the 2000s, India seems to have made a more radical change in their exports to EU-15
following the new opportunities in modern service exports. Given NMS‘s geographical
proximity, it most likely made sense to first reap the benefits from specializing in traditional
service exports to EU-15, but future services growth will more likely lie in further developing
modern service exports.
Figure 8: Share of commercial modern and traditional service exports to EU-15, by origin, in 2002 and 2004 [LHS], and Growth from 2002-04 (%) [RHS].
Source: EuroStat, Direction of Trade Statistics. 2011.
In summary, the stylized facts show that services dominate growth in EU-15 countries and to a
lesser extent in NMS and ACC. Service productivity is many times higher in EU-15 than in the
other two groups but at least NMS are starting to catch up. Highest growth in ―service
tradability‖ is recorded for NMS followed by EU-15 while ACC are falling behind. Both EU-
15 and NMS have revealed comparative advantage in services, but this is not the case for ACC.
Moreover, growth in modern services outweigh growth in traditional services in EU-15 and
NMS, while modern services are even shrinking in ACC. Hence, EU-15 and NMS do seem to
change the nature of their services while for ACC - even though the contribution of services to
growth is strong in ACC - it seems to be less due to an improved quality of services. We next
turn to the sophistication of services. After a short description of the methodology, we will
present some descriptive statistics for Europe that may help us further understand the patterns
in Europe that we have just observed.
0%
10%
20%
30%
40%
50%
60%
70%
80%
90%
100%
2002 2004 2002 2004 2002 2004
India to EU15 EU15 to EU15 NMS to EU15
modern traditional
-40
-20
0
20
40
60
80
100
India to EU15 within EU15 NMS to EU15
Construction Computer and business services

11
3 SERVICE EXPORT SOPHISTICATION
3.1 The Service Export Sophistication Methodology
We build upon the Hausmann, Hwang and Rodrik framework, which uses a goods export
sophistication measure Goods EXPY as a proxy for the most productive set of goods the
country can produce at a given time. They argue that export data is the best way to reveal this
production frontier as we can expect countries to export those goods in which it is most
productive. Along the same reasoning and as described below we will construct a Service
EXPY to proxy the service production frontier of a country, by and large following the
methodology developed by HHR.
We start by constructing so-called PRODY‘s for each category of goods exports, reflecting the
income/productivity level associated with each good, and we do the same for each category of
services. PRODYj is the income value associated with the service j, and is constructed by using
the service export (x) share of a country i in world‘s export of service j, divided by the sum of
shares of j in world exports of j across all countries exporting that service.5 These ratios are
multiplied by the exporting countries‘ respective per capita income level (Y) and the result is
summed up across all countries. In other words, the PRODY becomes the weighted average of
per capita GDPs, where the weights represent the revealed comparative advantage in service j
for each country.6 PRODYs are constructed for each service category, for each year of available
data, and are by construction the same for all countries.
EXPY is then the weighted income value of services exported by a country, computed as the
sum of PRODYs using as weights the share of the particular service in the country‘s total
service export basket. EXPYs are constructed for each country and for each year with available
data.
The trade data come from the IMF Balance of Payments statistics, which has data available for
over 190 countries from 1990 to 2007. Due to data being reported inconsistently on service
exports, we end up with a sample of approximately 100 countries 1990 to 2007. GDP per capita
data is taken from the World Bank Indicators database. Before describing the service EXPY we
would like to discuss two of its characteristics that differ from preexisting goods index – the
need for dynamic PRODYs and the high level of aggregation.
First, the Goods EXPY was constructed using static PRODYs (the PRODY for each good is held
constant at the average value 1999-2001). This means that any increase in Goods EXPY
5 is hence the value-added share of commodity j in the country‘s overall export basket. 6 The rational for using revealed comparative advantages as weights is to control for country size when ranking the services.
ij
ij ii
ij
ii
x
XPRODY Y
x
X
ij
i j
j i
xEXPY PRODY
X
ij
i
x
X

12
measures a country‘s jump from a low PRODY product to a high PRODY product (that is the
share of high PRODY good in the export basket increased). However, in the case of Service
EXPY we will use what we call dynamic PRODYs, i.e. the PRODY values of a certain service
export may vary year to year. Hence, an increase in dynamic EXPY can be due to (i) an increase
in the PRODY of a service and/or (ii) an increase in the share of high PRODY products in the
export basket. This is important for two reasons. First, it gives us an opportunity to capture the
effect of changes in PRODY on EXPY. We do not only want to measure the fact that countries
are getting more and more engaged in higher value service export, but also that the service
exports themselves are increasing in sophistication due to improvements in ICT and 3T‘s. In
fact many richer and high-skilled countries are engaged in service exports boosting the
PRODYs of some service export categories.7 Secondly, since the data is much less
disaggregated for services, using static PRODY fails to capture the movements to higher
PRODY service exports that are only sub-categories of the broader categories captured by the
Balance of Payments data.
A second characteristic, and just mentioned, is that service export data are not collected in the
same detailed manner as goods export data. This means we will end up with only ten broad
categories of service exports. They are different enough to make the analysis interesting, but it
of course limits the extent to which we can understand the mechanisms in play. For example, if
a country – within the same service export category - move from a sub-category of services
with presumed low PRODY, to a sub-category of services with presumed high PRODY that
would not show up at all in the static EXPY. As mentioned, the dynamic EXPY would however
capture this as it allows for the PRODYs to change over time. Unfortunately though, even when
comparing the static EXPY and the dynamic EXPY, due to the high aggregation of data it would
be impossible to know if the increase in the dynamic EXPY was created by a higher share of
high PRODY services in the basket or an increase in the PRODYs themselves as the static
EXPY fails to capture changes in the subcategories of the export basket.
3.2 Descriptive Statistics
The PRODYs for each service category over time are presented in Table 3. The first four
categories represent the traditional services (transportation, travel, communication and
construction), while the last rows represent the modern services (insurance, financial, computer
& information, royalties & license fees, other business services, and personal, cultural &
recreational services). See the Appendix for a more detailed description of what is measured
within each category. Our focus herein is on commercial service exports; therefore we do not
include government services in our sample of measurement of Service EXPY.8 In general, the
7 One potential problem with the dynamic PRODY is that as developing countries starts getting engaged in the high PRODY
services, the PRODYs themselves decreases due to the lower income of developing countries. However, at this point, the share of
service exports of high PRODY value from developing countries is still too small to have an overall impact. The impact of a high
PRODY service in the export basket of a small country can be significant for that country‘s EXPY, but the high PRODY export
from that small country will not have an impact on the overall PRODY of that service, in the same sense that a small firm is a
price taker in a large market. 8 We would like to highlight limitations to the interpretation of service exports and Service EXPY due to the way data is
registered. First, the level of aggregation due to broad categories already mentioned is sometimes exacerbated by the further
aggregation in what the countries report. Secondly, even though there have been no productivity improvements in a particular

13
PRODY of the modern services are higher and their growth has been stronger, despite the
higher initial levels. The table also shows export share of the different categories for the world
average and the three European groups. EU-15 has 43 percent of its export basket in modern
services, while NMS has 26 percent and ACC only 11 percent, compared to the world average
of 21 percent. As can be seen in Figure 9, due to the high PRODYs for modern services, EU-15
EXPY is to a large extent explained by the high share of modern services, especially financial
services. For NMS the EXPY source is more evenly spread but still dominated by traditional
services. ACC‘s EXPY is to a large extent explained by traditional services.
Table 3: PRODYs, 1990-95/1996-99/2000-07 and PRODY value and share by category by country group.
Source: Authors’ calculations using Balance of Payments, IMF. 2011.
Figure 9: Share of service category in EXPY, by country group.
Note: Traditional services are in blue shades, modern in red.
Source: Authors’ calculations using Balance of Payments, IMF. 2011.
service that a country export, they may still register and increased PRODY for that export if the broader category it belongs to
have made productivity improvements.

14
Figure 10 shows the evolution of Service EXPY over time. Interestingly, all groups start out
with more or less the same level of Service EXPY in the beginning of the 1990s, diverge in late
1990s and from 2000 they keep the differences between each other and grow in parallel. EU-15
made the largest jump in late 1990s while the NMS continued an already strong trend albeit at a
lower level then EU-15. An interesting pattern arises when looking at different countries within
EU-15 (see Fig A12 in the Appendix). Northern EU-15 has a solid development of Service
EXPY, while Continental EU-15 is less successful but high levels and growth in Luxemburg
push up the average. Southern EU-15 though is lagging behind with no country standing out.
ACC suddenly dropped in Service EXPY in late 90s and has since not been able to catch up
with the rest of Europe. This graph would hence suggest that EU-15 has been most successful
in latching on to the globalization of services, followed by NMS, while ACC has not benefitted
from this global trend. It remains however, to analyze to what extent these groups have
managed to turn higher service sophistication into economic growth.
Figure 10: Service EXPY, 1990-2007.
Source: Authors’ calculations.
Figure 11 shows log Service EXPY against log GDP per capita, for 1992 and 2007 respectively.
For both time periods, the scales have been kept constant as we also want to bring attention to
the shifting paradigm of service exports globally. In order to look at the evolution of service
export sophistication over time, we contrast the level correlation in 1992 with the correlation in
2007. The relationship is positive at each point in time, i.e. richer countries have typically a
higher sophistication of services, and the three European groups are generally in line with this
pattern.
4000
6000
8000
10000
12000
14000
16000
18000
1990 1991 1992 1993 1994 1995 1996 1997 1998 1999 2000 2001 2002 2003 2004 2005 2006 2007
EU-15 NMS ACC India USA China

15
Figure 11: log Service EXPY against log GDP per capita, for 1992 and 2007.
Source: Authors’ calculations.
Another interesting question is the relationship between Services EXPY and Goods EXPY, and
to what extent Europe is in line with the global pattern. Figure 12 shows that in general,
countries with high Service EXPY have also high Goods EXPY, which is also true for Europe.
Compared to the median for both categories, all European countries have higher sophistication.
Figure 12: Service EXPY vs Goods EXPY, 2008.
Source: Authors’ calculations.
Finally, in Table 4 we compare export sophistication in different years, controlling for the stage
of development and size, to check whether any one of the regions was significantly different
from the global norm. We make the observation that ACC was a significant and positive outlier
in service export sophistication in 1991. In more recent time, 2006, ACC is instead a significant
negative outlier. Put another way, given the stage of development, ACC has a lower level of
Service EXPY than expected.
7.5
88.
59
9.5
Log
Sop
hist
icat
ion
in S
ervi
ce E
xpor
ts 1
992
6 7 8 9 10 11Log Per capita GDP 1992
Note: black - all countries, red - EU-15, blue - NMS, green - Acc
8.5
99.
510
10.5
Log
Sop
hist
icat
ion
in S
ervi
ce E
xpor
ts 2
007
6 7 8 9 10 11Log Per capita GDP 2007
Note: black - all countries, red - EU-15, blue - NMS, green - Acc
8.5
99.
510
10.5
Log
Sop
hist
icat
ion
in S
ervi
ce E
xpor
ts 2
007
8 8.5 9 9.5 10Log Sophistication in Goods Exports 2007
Note: black - all countries, red - EU-15, blue - NMS, green - Acc

16
Table 4: Regressions for Sophistication in Service Exports, 1991, 2000 and 2006
Note: * Significant at 10% level ** Significant at 5% level *** Significant at 1% level. t-statistics are in
parentheses. Size is population size.
With a descriptive picture of the level of service export sophistication in the three European
country groups, we will now look at the extent to which their level of sophistication is
associated with their level of economic growth.
4 RESULTS FROM GROWTH REGRESSIONS
We now turn to the analysis of the relationship between service export sophistication and
growth, and in particular if there are any differences in how the level of sophistication affects
growth in Europe compared to the rest of the world. Mishra, Lundstrom and Arnand (2011)
analyses the relationship between Service EXPY and economic growth through a number of
estimations using fixed effect panels and GMM techniques. The data includes up to 103
countries over the time span of 1990-2007, and the result show a strong positive association
between service sophistication and growth. The result stands given a number of different model
specifications.9 In this section we use the same approach but take a closer look at Europe.
The baseline empirical growth model consists, in addition to the variable of interest, of four
determinants of economic growth - initial income level, rates of physical and human capital
accumulation, trade openness and institutional quality. We use data on income per capita from
WDI. To account for differences in human capital accumulation we use latest available data on
years of schooling from Barro and Lee (2010). We use M2 (as percent of GDP) as a proxy for
9 Apart from the control variables presented in the base model, they control for Goods EXPY, test various time periods and
country groupings and drop outlier such as India, and the result still holds.
(1) (2) (3)
1991 2000 2006
log GDP per capita 0.588* 0.0480 0.462(0.314) (0.221) (0.545)
(log GDP per capita) 2 -0.0293 0.00178 -0.0202(0.0180) (0.0129) (0.0305)
Control for size Yes Yes Yes
EU15 0.0168 0.0632 0.0645(0.0327) (0.0570) (0.0562)
NMS -0.0210 0.00358 0.00881(0.0313) (0.0282) (0.0277)
ACC 0.0834** -0.0490 -0.112**(0.0356) (0.0517) (0.0459)
Constant 5.785*** 8.522*** 6.784***(1.365) (0.964) (2.429)
Observations 116 126 120R-squared 0.380 0.306 0.428

17
financial development from WDI. Finally, we use a measure of Rule of Law from The World
Bank‘s World Governance Indicators.
We use dynamic panel regressions based on three-year panel data for each country. The basic
regression specification is the following:
(1)
where is the natural logarithm of GDP per capita, is the level of GDP per capita at the
beginning of each three year period, is the dynamic service export sophistication
measure, is the set of relevant control variables for growth determinants, represents
time dummies, stands for country fixed effects and is the error term.
We present the growth regression results in Table 5. In column 5, we add three European
groups that we interact with Service EXPY, to see if there is a significantly different impact of
service sophistication in EU-15, NMS or ACC compared to the rest of the world. The result is
show that in the NMS case, there is a positive significant additional impact on growth. This
means that service sophistication has a positive association with growth in all countries but the
association – given a certain level of sophistication – is stronger in NMS than in other
countries. Table 5: Regression results with EU-15, NMS and ACC dummy, Fixed effect 3-year panel of growth in
per capita GDP, 1990-2007.
Note: * Significant at 10% level ** Significant at 5% level *** Significant at 1% level. t-statistics are in
parentheses.
(1) (2) (3) (4) (5)
log lag initial GDP per capita -0.481*** -0.644*** -0.650*** -0.690*** -0.680***(0.0780) (0.0895) (0.0995) (0.106) (0.112)
log lag initial Service EXPY 0.315*** 0.221*** 0.223*** 0.199** 0.207**(0.0553) (0.0733) (0.0737) (0.0793) (0.0803)
years of schooling 0.108*** 0.110*** 0.0968*** 0.112***(0.0306) (0.0309) (0.0344) (0.0355)
log financial develoment 0.00466 -0.00529 -0.00488(0.0314) (0.0333) (0.0342)
external liberlization 0.00377** 0.00183(0.00158) (0.00170)
EU15*Service EXPY -0.318**(0.160)
NMS*Service EXPY 0.379*(0.212)
ACC*Service EXPY -0.0278(0.474)
Constant 1.504** 3.008*** 3.007*** 3.491*** 3.374***(0.594) (0.710) (0.771) (0.819) (0.830)
Observations 702 582 579 533 524R-squared 0.079 0.114 0.115 0.130 0.129Number of countries 157 128 128 115 113

18
5 CONCLUSION
Our study shows that services dominate growth in EU-15 countries and, to a lesser extent, in
New Member States (NMS) and Accession (ACC) countries. Except for ACC, Europe has
maintained specialization in service exports. Service productivity, tradability, and exports of
modern services are high in EU-15, growing fast in NMS but slower in ACC countries. Growth
in modern services outweigh growth in traditional services in EU-15 and NMS, while modern
services are even shrinking in ACC. Hence, even though the contribution of services to growth
is significant in ACC, it seems to be less due to an improved quality of services.
Since the mid-1990s, EU-15 as well as NMS significantly increased their service export
sophistication, while ACC first dropped and then only slowly grew during the 2000s. Our
growth regression results confirm that sophistication in service exports is important for growth.
Moreover, for a given level of export of sophisticated services, the growth impact is stronger in
NMS than the rest of the world.
The results for Europe show that not only does export of services matter for growth but also
what services are exported. NMS seems to be the group that currently is able to reap the most
benefit from the globalization of services – it is still catching up with EU-15 in terms of the
level of service sophistication, and for a given level of sophistication it has a stronger than
average impact on growth. ACC however has yet to latch onto the globalization of services. On
the other hand, that means it still has a strong growth potential through the sophistication of
services.
Fundamentals are important, but do not uniquely determine what Europe, or any country, will
produce and export. There is still room for the European region as a whole but especially in
NMS and ACC to upgrade its sophistication in service exports. There are many policy tools -
such as single market efficiency and common legal and business start-up market integration - to
further pursue. In particular recent work also shows that information flows, access to modern
technology, and highly skilled labor play a particularly critical role in sustaining increases in
service exports sophistication – all aspects found in the European economy.

19
REFERENCES
Barro, R., and J. Lee (1994). “Sources of Economic Growth,” Carnegie-Rochester Conference series on Public Policy 40, pp 1-46.
Eschenbach, F. and B. Hoekman (2006). “Service Policy Reform and Economic Growth in Transition Economies, 1990-2004.” CEPR Discussion Paper No. 5625.
Fernandes, A. (2009). “Structure and Performance of the Service Sector in Transition Economies.” Economics of Transition, Vol 17(3), pp. 467-501.
Francois, J. and B. Hoekman (2010). “Services Trade and Policy.” Journal of Economic Literature 48, pp. 642-692.
Ghani, E., and H. Kharas (2010). “Overview in The Service Revolution in South Asia,” in The Service Revolution in South Asia, edited by Ejaz Ghani, Oxford University Press. Ghani, Ejaz ed., The Service Revolution in South Asia, Oxford University Press.
Gwartney, James; Joshua Hall, Robert Lawson (2010). Economic Freedom of the World: 2010, Fraser Institute.
Hausmann, R., J. Hwang, and D. Rodrik (2007). “What You Export Matters,” Journal of Economic Growth, 12:1: pp. 1-25.
Kandilov, I. and T. Grennes (2010). ”The Determinants of Service Exports from Central and Eastern Europe.“ Economics of Transition, Vol 18(4), pp. 763-794.
Lall, S., Weiss, J., and J. Zhang (2005), “The ‘Sophistication’ of Exports: A New Measure of Product Characteristics,” Queen Elizabeth House Working Paper Number 123, Oxford University
Mishra, S., Lundstrom, S. and R. Anand (2011). ”Service Export Sophistication and Economic Growth.” World Bank Policy Research Working Paper, no 5606. World Bank: Washington, DC.
World Bank (2008). Unleashing Prosperity: Productivity Growth in Eastern Europe and the Former Soviet Union. The World Bank; Washington, DC.
20
APPENDIX
Additional Data Description.
External Liberalization and Hidden Import Barriers. Source: Gwartney et al. (2010). The index is based on the Global Competitiveness Report’s survey question: “In your country, tariff and non-tariff barriers significantly reduce the ability of imported goods to compete in the domestic market.” The question’s wording has varied slightly over the years. Mean Tariff Rate. Source: Gwartney et al. (2010). As the mean tariff rate increases, countries are assigned lower ratings. The rating declines toward zero as the mean tariff rate approaches 50%. Taxes on International Trade (percent of current revenue). Source: World Bank (2010). Taxes on international trade include import duties, export duties, profits of export or import monopolies, exchange profits, and exchange taxes. Current revenue includes all revenue from taxes and non-repayable receipts (other than grants) from the sale of land, intangible assets, government stocks, or fixed capital assets, or from capital transfers from nongovernmental sources. It also includes fines, fees, recoveries, inheritance taxes, and non-recurrent levies on capital. Data are for central government and in percent of all current revenue. Capital Account Restrictions. Source: Gwartney et al. (2010). Index based on two components:
(i) Beginning with the year 2002, this subcomponent is based on the question: “Foreign ownership of companies in your country is (1) rare, limited to minority stakes, and often prohibited in key sectors or (2) prevalent and encouraged”. For earlier years, this sub-component was based on two questions about “Access of citizens to foreign capital markets and foreign access to domestic capital markets”.
(ii) Subcomponent based on the IMF’s Annual Report on Exchange Arrangements and Exchange Restrictions, including different types of capital controls. It is constructed by subtracting the number of restrictions from 13 and multiplying the result by 10.

21

22
Additional Figures FIGURE A1. SERVICE VALUE ADDED AND GDP, EU-15 -2009
FIGURE A2. SERVICE VALUE ADDED AND GDP, NMS - 2009
23
FIGURE A3. SERVICE VALUE ADDED AND GDP, ACC - 2009
FIGURE A4. GDP GROWTH AND SERVICE OUTPUT GROWTH, 2000-08

24
FIGURE A5. GDP GROWTH AND SERVICE OUTPUT GROWTH, 2000-08
FIGURE A6. GDP GROWTH AND SERVICE OUTPUT GROWTH, 2000-08

25
FIGURE A7. DECOMPOSING GDP GROWTH BY SECTORS IN EU-15, 1990-99 AND 2000-08
FIGURE A8. DECOMPOSING GDP GROWTH BY SECTORS IN NMS, 1990-99 AND 2000-08
-10%
10%
30%
50%
70%
90%
110%
1990-992000-08 1990-992000-08 1990-992000-08 1990-992000-08 1990-992000-08 1990-992000-08 1990-992000-08 1990-992000-08
Belgium Finland France Germany Luxembourg Spain United Kingdom Greece
Agricultuer Industry Service
-20%
0%
20%
40%
60%
80%
100%
2000-08 2000-08 2000-08 2000-08 2000-08 2000-08
Bulgaria Czech Republic Hungary Latvia Poland Slovenia
Agriculture Industry Service

26
FIGURE A9. DECOMPOSING GDP GROWTH BY SECTORS IN ACC, 1990-99 AND 2000-08
FIGURE A10. GOODS EXPORTS AS A SHARE OF GOODS VALUE ADDED, 1990-2007.
0
50
100
150
200
250
300
350
1990 1991 1992 1993 1994 1995 1996 1997 1998 1999 2000 2001 2002 2003 2004 2005 2006 2007 2008 2009
EU-15 New members Accession Developing Upper middle income

27
FIGURE A11. SERVICE EXPORT SOPHISTICATION IN NORTHERN EU-15

28
FIGURE A12. SERVICE EXPORT SOPHISTICATION IN NMS

29
FIGURE A13. SERVICE EXPORT SOPHISTICATION IN ACC


![Web of Knowledge [5.5] - Export Transfer Service](https://static.fdocuments.in/doc/165x107/577d1f531a28ab4e1e905d73/web-of-knowledge-55-export-transfer-service.jpg)