Service Continuity Data on Distribution System … 2013 Service Continuity Data on Distribution...
68
www.electricity.ca 2013 Service Continuity Data on Distribution System Performance in Electrical Utilities Composite, Non-Confidential Electric Power System Reliability Assessment
Transcript of Service Continuity Data on Distribution System … 2013 Service Continuity Data on Distribution...
www.electricity.ca
2013 Service Continuity Data on Distribution System Performance in Electrical Utilities
Composite, Non-Confidential
Electric Power System Reliability Assessment

INTRODUCTION This report presents the results of the fifty-first consecutive survey of the performance of the Distribution Systems in electrical utilities. The report, prepared by the Canadian Electricity Association (CEA), presents a statistical summary of the Distribution Systems Performance for the year 2013 and compares it to 2012, as well as to the 2009-2013 five-year average. The report presents some industry standard metrics for the Electricity Distribution including:
• System Average Interruption Frequency Index (SAIFI) • System Average Interruption Duration Index (SAIDI) • Customer Average Interruption Duration Index (CAIDI) • Index of Reliability (IOR) • Customer Interruptions per Kilometre (CIKM) • Customer Hours per Kilometre (CHIKM)
By using the above metrics in combination with the cause of an electricity interruption, utility companies can
• set targets for improvement • develop programs in support of their improvement targets • make design/build decisions that try to mitigate interruption causes
Members of the Service Continuity Committee and participants in the Service Continuity program follow a systematic procedure for collecting and analyzing data with regard to the Distribution System Performance according to definitions set by the Committee. This procedure follows the guidelines set out by CEA’s Electric Power System Reliability Assessment program (EPSRA) which governs system continuity statistics for the entire electricity system. This includes the statistics captured in this report for the Distribution system and also statistics captured in the Bulk Electric System (BES) for service interruptions within the Transmission system. The EPSRA program is governed by the Consultative Committee on Outage Statistics (CCOS). The CCOS Committee was chaired until early 2010 by Dr. Roy Billinton of the University of Saskatchewan, a world renowned expert in the field of Electricity Equipment and Systems Reliability. The mission and vision of the Service Continuity Committee is below: Mission: Provide a comprehensive database of component and system reliability and performance data which will assist member utilities in the optimal utilization of corporate and financial resources. Vision: To be recognized as a world-class reliability database which meets the needs of its member utilities. At the recommendation of the program participants, CCOS approved the creation of the Service Continuity Committee (SCC). The objectives of the SCC are:
• To add value to SCC members by providing a forum for Distribution System personnel to identify, develop and monitor the relevancy of key performance indicators and actively seek ones that provide a perspective on the continuity of electric supply to the customer
• To facilitate development of inter-utility networking for Distribution System reliability • To maintain, update and provide guidance on common definitions and terms used in service continuity
performance measurement consistent with Canadian and international utility practices • Provide guidance with respect to maintaining data integrity • Reporting to CEA’s Consultative Committee on Outage Statistics (CCOS) and supporting its overall
mandate of providing its members with relevant comparative reliability information together with a network of contacts to enhance performance
• Coordinate with other CEA groups such as the Distribution and Customer Councils The membership of SCC includes one member of each of the participating CEA Corporate member utilities. It is chaired by Tom Janzen of Fortis Alberta. The Vice-Chair is Lisa Gryba of EPCOR.

ACKNOWLEDGEMENT We wish to thank the Consultative Committee on Outage Statistics (CCOS) and in particular, its former Chair, Dr. Roy Billinton, for their support and guidance. We wish to thank the utilities that have contributed data for this report. They are: ATCO Electric BC Hydro Caribbean Utilities City of Medicine Hat City of Red Deer Enersource Hydro Mississauga ENMAX Power Co. EPCOR Fortis Alberta Fortis BC Horizon Utilities Hydro One Hydro Ottawa Hydro Québec London Hydro Manitoba Hydro Maritime Electric Co. Ltd. New Brunswick Power Newfoundland and Labrador Hydro Newfoundland Power
Newmarket-Tay Power Distribution Ltd. Northland Utilities Northwest Territories Power Corp. Nova Scotia Power Oakville Hydro Oshawa PUC Networks PowerStream Inc. Saint John Energy Saskatoon Light & Power SaskPower St. Lucia Electricity Services St. Thomas Energy Tata Power (India) Toronto Hydro Trinidad & Tobago Electricity Commission Veridian Connections Waterloo North Hydro Yukon Electrical Co. Ltd. Yukon Energy

TABLE OF CONTENTS PAGE 1.0 DEFINITIONS ............................................................................................................................................. 1 1.1 Definition of Terms............................................................................................................... 2 1.2 Classification of Interruptions by Cause .............................................................................. 4 2.0 PERFORMANCE OF UTILITIES................................................................................................................ 5 2.1 Comparison of 2013 System Indices to 2012 ...................................................................... 6 2.2 General Statistics Summary ................................................................................................ 7 Graph 2-1 Systems Indices for 2008-2013 Canadian Data .................................................................. 8 Graph 2-2 Causes of Interruptions for 2009-2013 Canadian Data ..................................................... 9 Graph 2-3 Contribution to SAIFI by Cause for 2009-2013 Canadian Data ........................................ 10 Graph 2-4 Contribution to SAIDI by Cause for 2009-2013 Canadian Data ....................................... 11 Graph 2-5 Contribution to CAIDI by Cause for 2009-2013 Canadian Data ...................................... 12 Graph 2-6 Contribution to CHIKM by Cause for 2009-2013 Canadian Data ...................................... 13 Graph 2-7 Contribution to CIKM by Cause for 2009-2013 Canadian Data ......................................... 14 3.0 TABULATION AND ANALYSIS OF SERVICE INTERRUPTION DATA ................................................. 15 Table 3-1 Summary of Interruption Data for the Years 2008 to 2013 ................................................ 16 Table 3-2 System Causes of Service Interruption for Year 2013 – Canadian .................................. 17 Table 3-2a System Causes of Service Interruption for Year 2013 – International .............................. 18 4.0 SUMMARY ........................................................................................................................................... 19 5.0 SYSTEM CAUSES OF SERVICE OUTAGES BASED ON CUSTOMER DATA ..................................... 21 Graph 5-1 Contributions to SAIFI for 2013 - Canadian ....................................................................... 22 Graph 5-1a Contributions to SAIFI for 2013 - International .................................................................. 23 Graph 5-2 Contributions to SAIDI for 2013 - Canadian ...................................................................... 24 Graph 5-2a Contributions to SAIDI for 2013 - International .................................................................. 25 Graph 5-3 Contributions to CAIDI for 2013 - Canadian ...................................................................... 26 Graph 5-3a Contributions to CAIDI for 2013 - International .................................................................. 27 Graph 5-4 Contributions to CHIKM for 2013 – Canadian ................................................................... 28 Graph 5-4a Contributions to CHIKM for 2013 – International ............................................................... 29 Graph 5-5 Contributions to CIKM for 2013 – Canadian ...................................................................... 30 Graph 5-5a Contributions to CIKM for 2013 – International .................................................................. 31 Graph 5-6 Summary of Causes for All Interruptions for 2013 Canadian Data .................................... 32 Graph 5-6a Summary of Causes for All Interruptions for 2013 International Data ............................... 33 6.0 TABULATION OF SERVICE INTERRUPTION DATA FOR REGION 1 (URBAN UTILITIES) ................................................................................................................................ 36 6.0 List of Region 1 Utilities .................................................................................................... 37 Table 6-1 Region 1 Summary of Interruption Data for 2008-2013 ..................................................... 38
Table 6-2 Region 1 System Causes of Service Interruption for 2013 ............................................... 39 Graph 6-1 Region 1 SAIDI Excluding MPEs ....................................................................................... 40 Graph 6-2 Region 1 SAIDI Excluding Significant Events .................................................................... 40 Graph 6-3 Region 1 SAIDI Including All Events .................................................................................. 41 Graph 6-4 Region 1 CAIDI Excluding MPEs ....................................................................................... 41 Graph 6-5 Region 1 CAIDI Excluding Significant Events .................................................................... 42 Graph 6-6 Region 1 CAIDI Including All Events .................................................................................. 42 Graph 6-7 Region 1 Customer Hours per KM Excluding MPEs ......................................................... 43 Graph 6-8 Region 1 Customer Hours per KM Excluding Significant Events ...................................... 43 Graph 6-9 Region 1 Customer Hours per KM Including All Events .................................................... 44 Graph 6-10 Region 1 Customer Interruptions per KM Excluding MPEs ............................................... 44 Graph 6-11 Region 1 Customer Interruptions per KM Excluding Significant
Events .......................................................................................................................... 45 Graph 6-12 Region 1 Customer Interruptions per KM Including All Evens ........................................... 45 Graph 6-13 Region 1 SAIFI Excluding MPEs ....................................................................................... 46 Graph 6-14 Region 1 SAIFI Excluding Significant Events .................................................................... 46 Graph 6-15 Region 1 SAIFI Including All Events .................................................................................. 47 7.0 TABULATION OF SERVICE INTERRUPTION FOR REGION 2 (URBAN/RURAL UTILITIES) ................................................................................................................... 48 7.0 List of Region 2 Utilities .................................................................................................... 49 Table 7-1 Region 2 Summary of Interruption Data for 2008-2013 ..................................................... 50 Table 7-2 Region 2 System Causes of Service Interruption for 2013 ................................................ 51 Graph 7-1 Region 2 SAIDI Excluding MPEs ....................................................................................... 52 Graph 7-2 Region 2 SAIDI Excluding Significant Events .................................................................... 52 Graph 7-3 Region 2 SAIDI Including All Events .................................................................................. 53 Graph 7-4 Region 2 CAIDI Excluding MPEs ....................................................................................... 53 Graph 7-5 Region 2 CAIDI Excluding Significant Events .................................................................... 54 Graph 7-6 Region 2 CAIDI Including All Events .................................................................................. 54 Graph 7-7 Region 2 Customer Hours per KM Excluding MPEs ......................................................... 55 Graph 7-8 Region 2 Customer Hours per KM Excluding Significant Events ...................................... 55 Graph 7-9 Region 2 Customer Hours per KM Including All Events .................................................... 56 Graph 7-10 Region 2 Customer Interruptions per KM Excluding MPEs ............................................... 56 Graph 7-11 Region 2 Customer Interruptions per KM Excluding Significant
Events .......................................................................................................................... 57 Graph 7-12 Region 2 Customer Interruptions per KM Including All Evens ........................................... 57 Graph 7-13 Region 2 SAIFI Excluding MPEs ....................................................................................... 58 Graph 7-14 Region 2 SAIFI Excluding Significant Events .................................................................... 58 Graph 7-15 Region 2 SAIFI Including All Events .................................................................................. 59 8.0 SYSTEM INDICES BY REGIONS ............................................................................................................ 60 Graph 8-1 System Indices for Region 1, Region 2 and Total Regions for 2013 Data ........................ 61

1.0 DEFINITIONS
Composite Non-Confidential Report 1
1.0 DEFINITIONS 1.1 DEFINITION OF TERMS DISTRIBUTION SYSTEM A Distribution System is that portion of an electric power system which links the Bulk Electricity System (BES) or sources with the customer's facilities. Subtransmission lines, distribution substations, primary feeders, distribution transformers, secondaries and customers’ services all form different parts of what can generally be called Distribution Systems. The Delivery Point (DP) is the delineation point between the BES and the Distribution System. It is the low voltage busbar of the step down transformer station, whereby the transformer busbar is considered part of the BES System. At the transformer station the voltage is stepped down from a transmission voltage, which may cover a range of 60-750kV to a distribution voltage of under 60kV. Where the reporting company does not own the equipment up to the Delivery Point as defined above, the delineation point shall be at the point of ownership. CUSTOMERS The average number of customers served in the region during the reporting period. This means the number of customer services fed at secondary, primary and subtransmission voltages. A customer is defined as a metered service. Municipal utilities buying power from Provincial utilities should not be reported as customers by the Provincial utility. INTERRUPTION An interruption is the loss of service to one or more customers and is the result of one or more component outages. A momentary interruption is defined as an interruption with a duration of less than one (1) minute. These are interruptions generally restored by automatic reclosure facilities, which are of a very short duration (on the order of a few seconds). INTERRUPTION-DURATION This is the period from the initiation of an interruption to a customer until service has been restored to that customer. INTERRUPTION START TIME
An interruption is deemed to have occurred when the utility supplying power is made aware that a customer is without power. This is either the time the customer calls in or the time remote monitoring devices indicate a power interruption. It may be for either a full or part power interruption.
INTERRUPTION END TIME
An interruption is deemed to have ended when the utility supplying power is made aware that a customer's power has been restored. This is either the time the restoring crew reports the restoration is complete or the time remote monitoring devices indicate a power has been restored. CUSTOMER-HOURS OF INTERRUPTION This is the product of the customer services interrupted by the period of interruption. CUSTOMER-INTERRUPTIONS This is the sum of products of the customer services interrupted by the number of interruptions that affect those customer services.
Composite Non-Confidential Report 2

SYSTEM AVERAGE INTERRUPTION FREQUENCY INDEX (SAIFI)
This index is defined as the average number of interruptions per customer served per year.
SAIFI = Total Customer-Interruptions Total Customers Served
SYSTEM AVERAGE INTERRUPTION FREQUENCY INDEX (MOMENTARY) SAIFI (MI) This index is defined as the average number of interruptions per customer served per year for momentary
interruptions (interruptions of a duration less than 1 minute). SAIFI (MI) = Total Momentary Customer-Interruptions Total Customers Served (in area where momentary interruptions are monitored)
SYSTEM AVERAGE INTERRUPTION DURATION INDEX (SAIDI) This index is defined as the system average interruption duration for customers served per year. SAIDI = Total Customer-Hours of Interruptions Total Customers Served
CUSTOMER AVERAGE INTERRUPTION DURATION INDEX (CAIDI) This index is defined as the customer average interruption duration for customers interrupted during a
year. CAIDI = Total Customer-Hours of Interruptions Total Customer Interruptions
CUSTOMER INTERRUPTIONS PER KM Customer Interruptions per KM = Customer Interruptions Circuit Km
CUSTOMER HOURS PER KM Customer Hours per KM = Customer Hours Circuit Km
INDEX OF RELIABILITY The per unit of annual customer-hours that service is available. Index of Reliability = 8,760 hours/year - SAIDI 8,760 hours/year
Composite Non-Confidential Report 3

1.2 CLASSIFICATION OF INTERRUPTIONS BY CAUSE
A customer interruption has been defined in terms of primary cause of the interruption. These causes have been assigned the following codes:
0 - Unknown
Customer interruptions with no apparent cause or reason which could have contributed to the outage.
1 - Scheduled Outage
Customer interruptions due to the disconnection at a selected time for the purpose of construction or preventive maintenance.
2 - Loss of Supply Customer interruptions due to problems in the bulk electricity supply system such as underfrequency load shedding, transmission system transients, or system frequency excursions. During a rotating load shedding cycle, the duration is the total outage time until normal operating conditions resume, while the number of customers affected is the average number of customers interrupted per rotating cycle.
3 - Tree Contacts
Customer interruptions caused by faults due to trees or tree limbs contacting energized circuits.
4 - Lightning
Customer interruptions due to lightning striking the Distribution System, resulting in an insulation breakdown and/or flashovers.
5 - Equipment Failure Customer interruptions resulting from equipment failures due to deterioration from age, incorrect maintenance, or imminent failures detected by maintenance.
6 - Adverse Weather
Customer interruptions resulting from rain, ice storms, snow, winds, extreme ambient temperatures, freezing fog, or frost and other extreme conditions.
7 - Adverse Environment
Customer interruptions due to equipment being subjected to abnormal environment such as salt spray, industrial contamination, humidity, corrosion, vibration, fire or flooding.
8 - Human Element
Customer interruptions due to the interface of the utility staff with the system such as incorrect records, incorrect use of equipment, incorrect construction or installation, incorrect protection settings, switching errors, commissioning errors, deliberate damage, or sabotage.
9 - Foreign Interference
Customer interruptions beyond the control of the utility such as birds, animals, vehicles, dig-ins, vandalism, sabotage and foreign objects.
Composite Non-Confidential Report 4
2.0 PERFORMANCE OF UTILITIES
Composite Non-Confidential Report 5
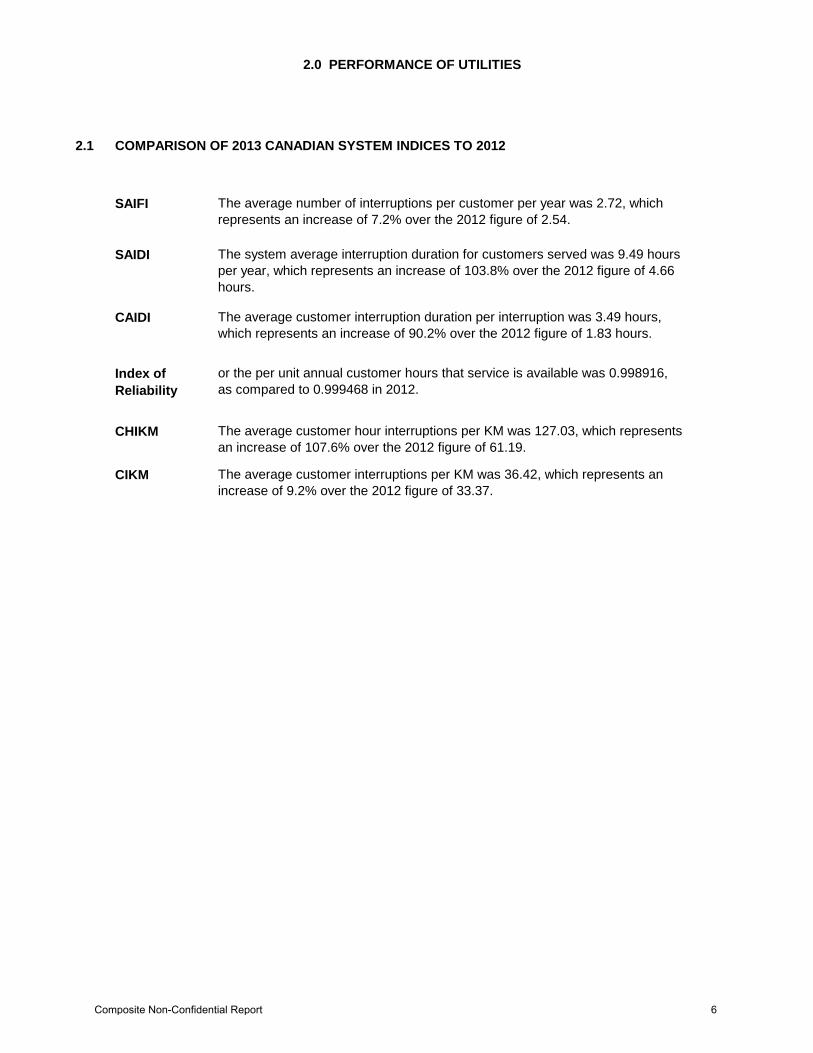
2.1
SAIFI The average number of interruptions per customer per year was 2.72, which represents an increase of 7.2% over the 2012 figure of 2.54.
SAIDI The system average interruption duration for customers served was 9.49 hours per year, which represents an increase of 103.8% over the 2012 figure of 4.66 hours.
CAIDI The average customer interruption duration per interruption was 3.49 hours, which represents an increase of 90.2% over the 2012 figure of 1.83 hours.
Index of Reliability
or the per unit annual customer hours that service is available was 0.998916, as compared to 0.999468 in 2012.
CHIKM The average customer hour interruptions per KM was 127.03, which represents an increase of 107.6% over the 2012 figure of 61.19.
CIKM The average customer interruptions per KM was 36.42, which represents an increase of 9.2% over the 2012 figure of 33.37.
2.0 PERFORMANCE OF UTILITIES
COMPARISON OF 2013 CANADIAN SYSTEM INDICES TO 2012
Composite Non-Confidential Report 6

2.2 General Statistics Summary: Canadian Utilities:
2013 2012 Total Customers:
13,737,830 13,404,198
Total Distribution System Peak (KW):
79,138,607 76,642,968
Average Distribution System Peak (KW): 2,198,295 2,189,799
Total Area Served (SQ.KM): 3,862,779.0 3,859,911 Total Distribution Circuit (KM) Overhead: 878,930 876,922
Total Distribution Circuit (KM) Underground: 147,652 143,537 Total Distribution Circuit (KM) Both: 1,026,582 1,020,459
International Utilities:
2013 2012 Total Customers:
585,553 106,299
Total Distribution System Peak (KW):
62,295 61,465
Average Distribution System Peak (KW): 15,574 30,733 Total Area Served (SQ.KM): 4,225 1,108
Total Distribution Circuit (KM) Overhead: 7,288 1,545 Total Distribution Circuit (KM) Underground: 4,415 2,216
Total Distribution Circuit (KM) Both: 11,703 3,716
Combined:
2013 2012 Total Customers: 14,323,383 13,510,497
Total Distribution System Peak (KW): 79,200,902 76,704,433 Average Distribution System Peak (KW): 1,980,023 2,073,093
Total Area Served (SQ.KM): 3,867,004 3,861,019 Total Distribution Circuit (KM) Overhead: 886,218 878,467
Total Distribution Circuit (KM) Underground: 152,067 145,753 Total Distribution Circuit (KM) Both: 1,038,285 1,024,220
Composite Non-Confidential Report 7

The annual variations in the service indices of SAIFI, SAIDI, CAIDI and the INDEX OF RELIABILITY for Canadian data for the period 2008 to 2013 are shown below in Graph 2.1.
SAIFI SAIDISYSTEM AVERAGE INTERRUPTION
FREQUENCY INDEX (Interruptions/year)SYSTEM AVERAGE INTERRUPTION DURATION
INDEX (Hours/year)
CAIDI INDEX OF RELIABILITYCUSTOMER AVERAGE INTERRUPTION DURATION INDEX (Hours/Interruptions)
CHIKM CIKMCUSTOMER HOUR INTERRUPTIONS PER KM CUSTOMER INTERRUPTIONS PER KM
Note: denotes the exclusion of Significant Event data (see Appendix D).
Graph 2-1 System Indices of SAIFI, SAIDI, CAIDI & IOR for 2008-2013 Canadian Data
Composite Non-Confidential Report 8
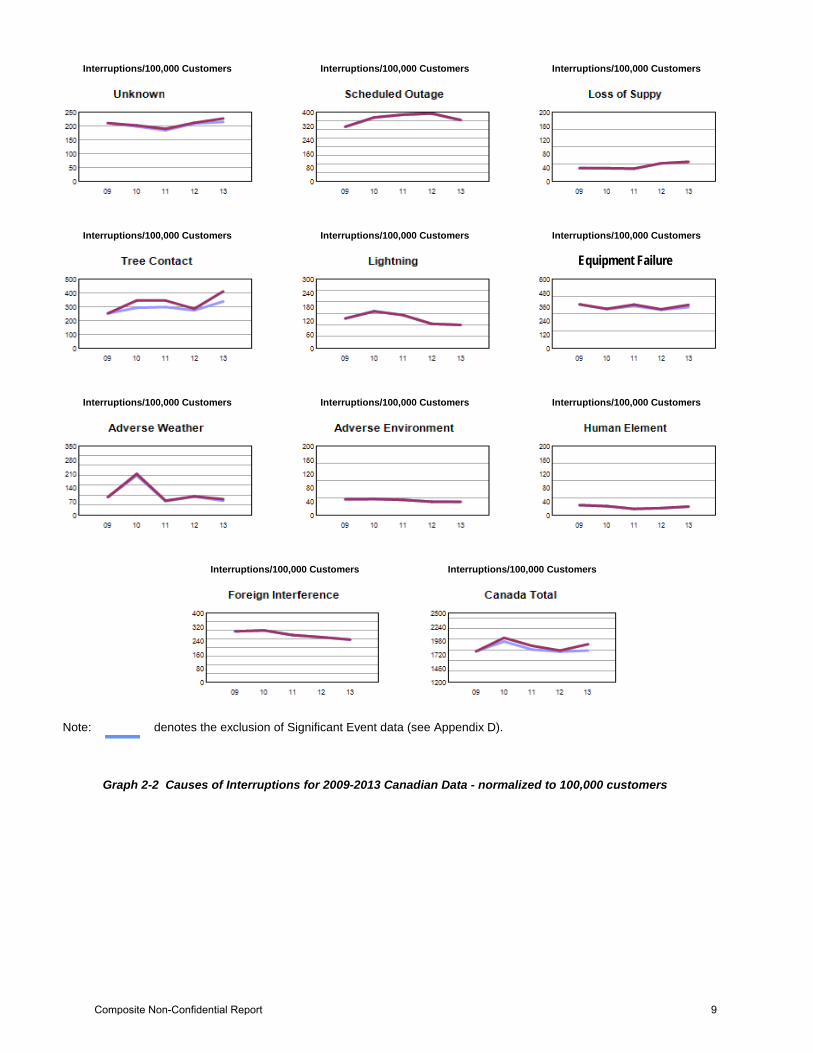
Graph 2-2 Causes of Interruptions for 2009-2013 Canadian Data - normalized to 100,000 customers
Interruptions/100,000 Customers Interruptions/100,000 Customers
Note: denotes the exclusion of Significant Event data (see Appendix D).
Interruptions/100,000 Customers Interruptions/100,000 Customers Interruptions/100,000 Customers
Interruptions/100,000 Customers Interruptions/100,000 Customers Interruptions/100,000 Customers
Interruptions/100,000 Customers Interruptions/100,000 Customers Interruptions/100,000 Customers
Equipment Failure
Composite Non-Confidential Report 9
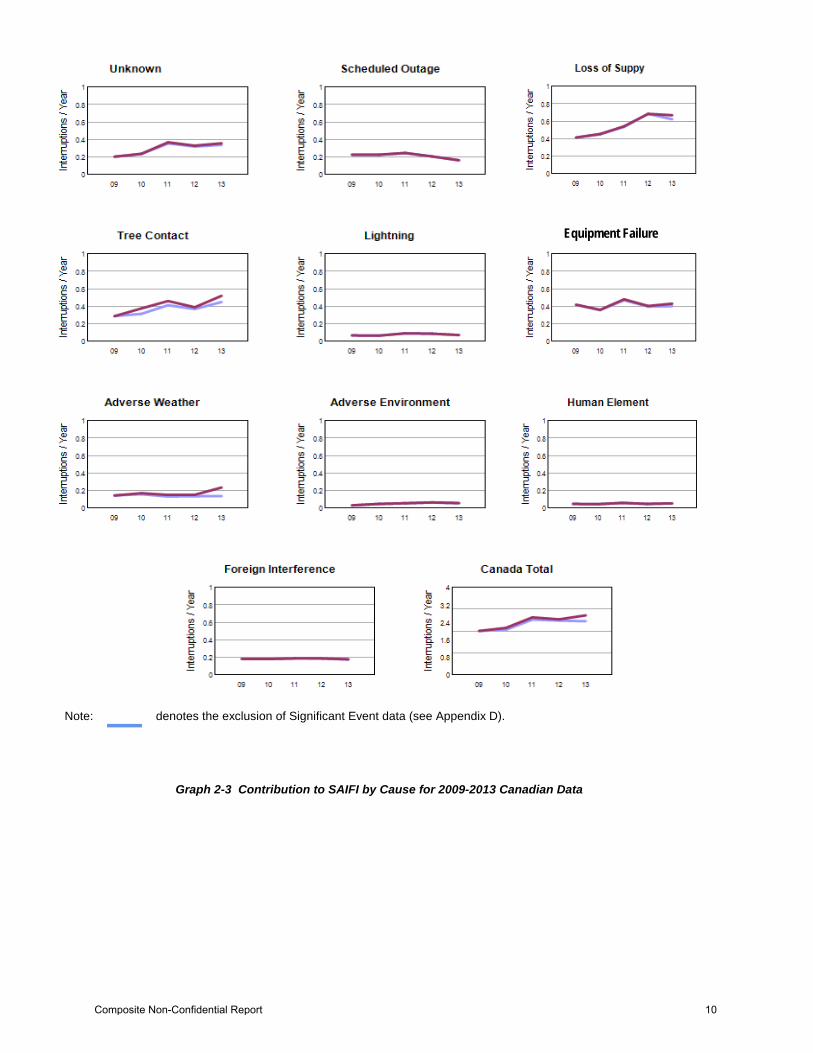
Note: denotes the exclusion of Significant Event data (see Appendix D).
Graph 2-3 Contribution to SAIFI by Cause for 2009-2013 Canadian Data
Equipment Failure
Composite Non-Confidential Report 10
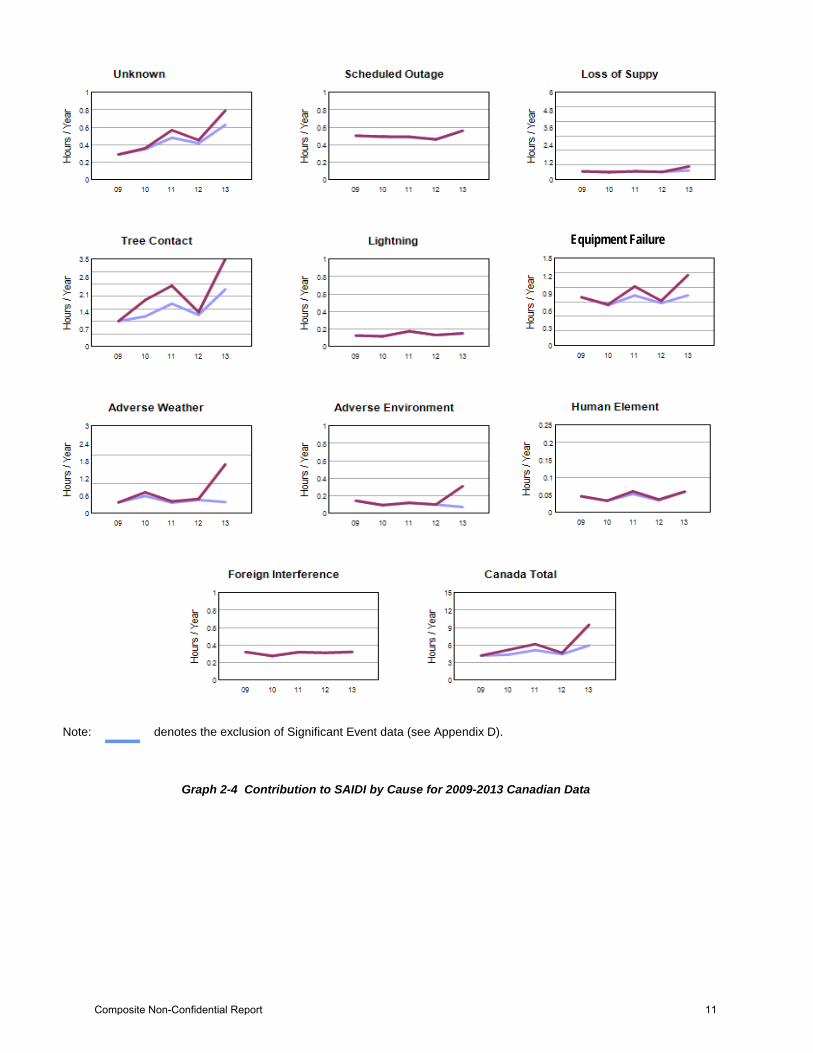
Note: denotes the exclusion of Significant Event data (see Appendix D).
Graph 2-4 Contribution to SAIDI by Cause for 2009-2013 Canadian Data
Equipment Failure
Composite Non-Confidential Report 11
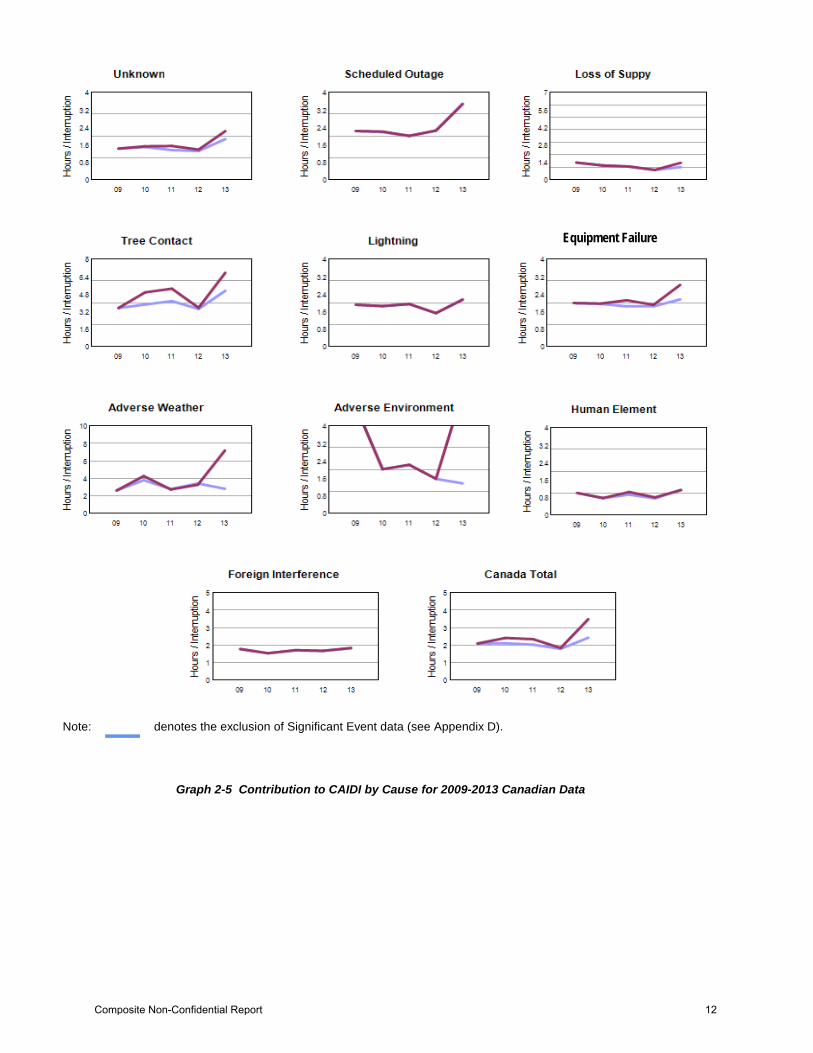
Note: denotes the exclusion of Significant Event data (see Appendix D).
Graph 2-5 Contribution to CAIDI by Cause for 2009-2013 Canadian Data
Equipment Failure
Composite Non-Confidential Report 12
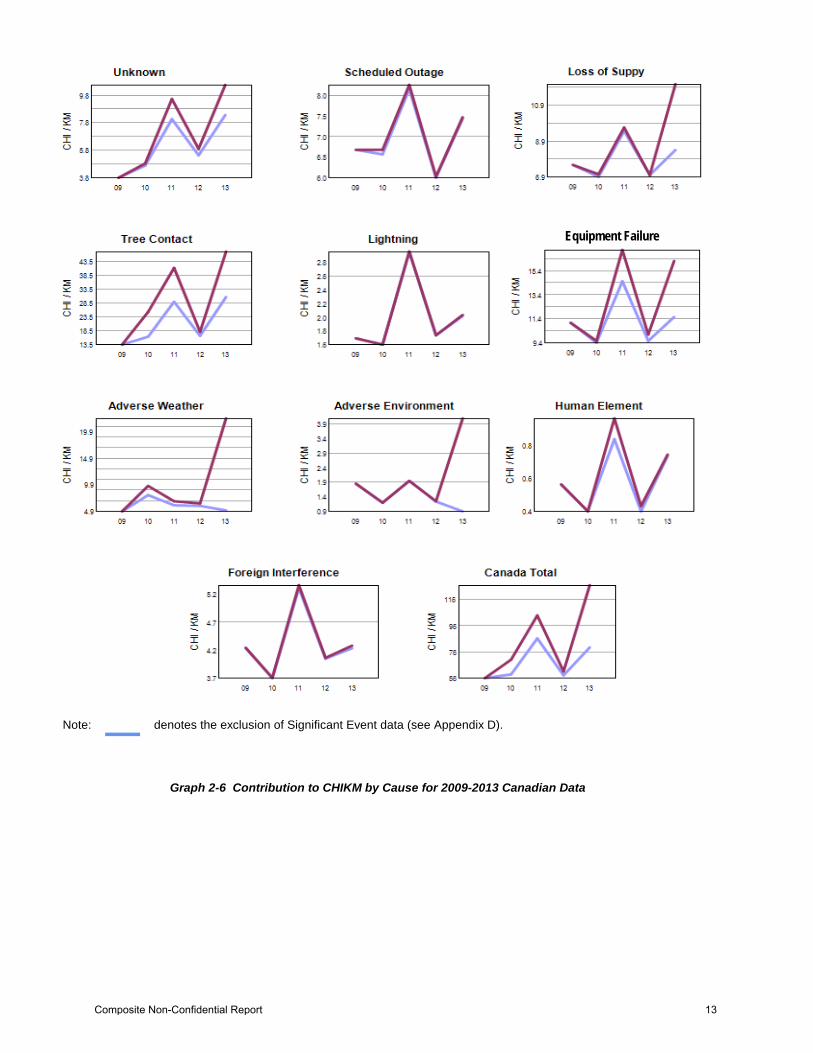
Note: denotes the exclusion of Significant Event data (see Appendix D).
Graph 2-6 Contribution to CHIKM by Cause for 2009-2013 Canadian Data
Equipment Failure
Composite Non-Confidential Report 13

Note: denotes the exclusion of Significant Event data (see Appendix D).
Graph 2-7 Contribution to CIKM by Cause for 2009-2013 Canadian Data
Equipment Failure
Composite Non-Confidential Report 14
3.0 TABULATION AND ANALYSIS OFSERVICE INTERRUPTION DATA
Composite Non-Confidential Report 15

(A) (B)NUMBER OF CUSTOMERS
SERVEDNUMBER OF
INTERRUPTIONSTOTAL CUSTOMER
INTERRUPTIONS
TOTAL INTERRUPTED CUST. HOURS
TOTAL AVAILABLE CUST. HOURS
8,586,360 170,556 20,100,130 53,976,755 75,216,513,600
8,586,360 161,494 18,719,220 39,607,053 75,216,513,600
8,769,616 155,774 17,608,191 36,824,901 76,821,836,160
9,031,410 183,226 19,380,491 46,677,928 79,115,151,600
9,031,410 177,040 18,613,978 39,211,666 79,115,151,600
13,166,791 247,330 34,640,048 81,099,286 115,341,089,160
13,166,791 238,144 33,292,588 67,434,099 115,341,089,160
13,404,198 240,053 34,048,735 62,443,872 117,420,774,480
13,404,198 237,178 33,295,600 59,383,340 117,420,774,480
13,737,830 262,160 37,393,115 130,409,957 120,343,390,800
13,737,830 246,172 34,018,304 84,469,078 120,343,390,800
2,785,977 49,431 5,102,526 7,787,345 24,405,158,520
3,829,690 40,882 8,099,147 11,025,614 33,548,084,400
202,847 7,825 4,183,216 5,344,672 1,776,939,720
160,859 6,898 919,580 737,138 1,409,124,840
106,299 2,924 718,946 751,786 931,179,240
585,553 16,734 3,083,530 3,743,124 5,129,444,280
(A) =
(C) = INDEX OF RELIABILITY: 1 - (A)/(B)
2013 0.999270
SUMMATION OF THE NUMBER OF CUSTOMERS x RESTORATION TIME IN HOURS OF EACH INTERRUPTION
(B) = TWELVE MONTH AVERAGE NUMBER OF CUSTOMERS x 8,760 HOURS (ONE YEAR)
2010 0.996992
2011 0.999477
2012 0.999193
INTERNATIONAL UTILITIES IN 2013
2008 0.999681
2009 0.999671
2013 0.998916
2013** 0.999298
** Excludes Significant Events (see Appendix D)
2011** 0.999415
2012 0.999468
2012** 0.999494
2010 0.999410
2010** 0.999504
2011 0.999297
2008 0.999282
2008** 0.999474
2009 0.999521
IT EQUALS THE PER UNIT ANNUAL CUSTOMER-HOURS THAT SERVICE IS AVAILABLE.
CANADIAN UTILITIES IN 2013
(C)
YEARINDEX OF
RELIABILITY
TABLE 3-1SUMMARY OF INTERRUPTION DATA
(Including Derivation of Index of Reliability)
FOR YEARS 2008 - 2013
THE "INDEX OF RELIABILITY" IS A MEASURE OF SERVICE RELIABILITY.
Composite Non-Confidential Report 16
SAIFI SAIDI CAIDI CIKM
NUMBER % NUMBER % NUMBER % (HRS) (HRS)
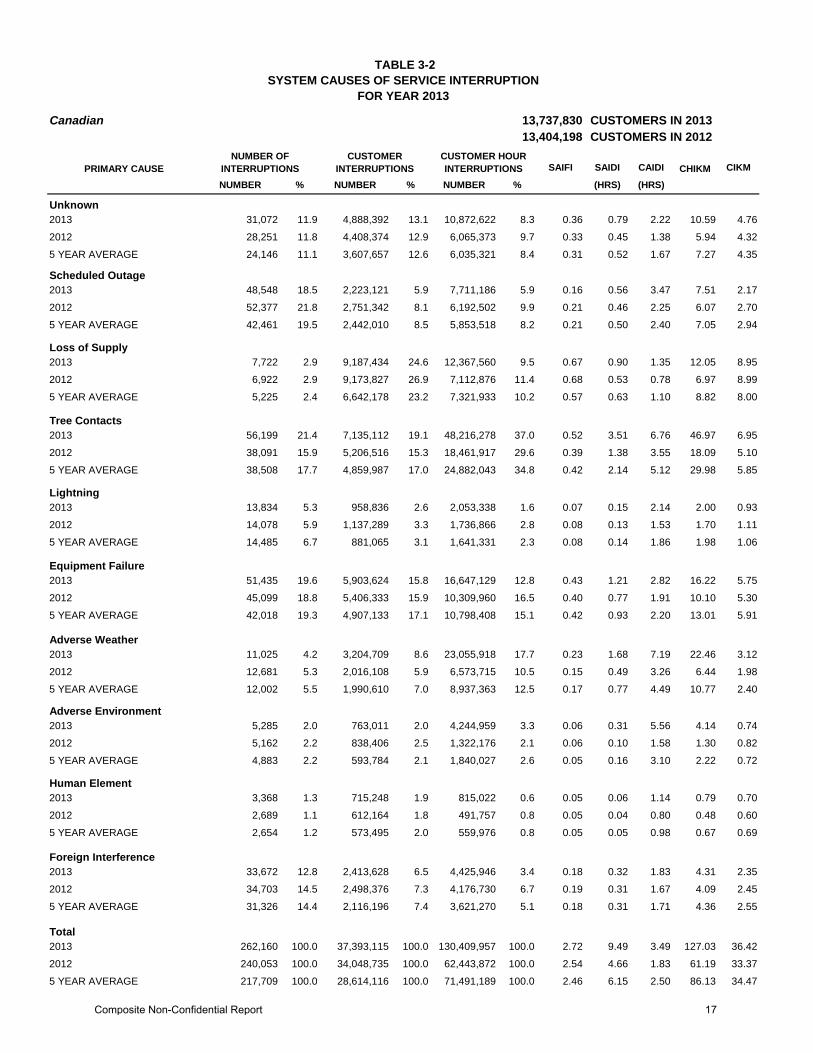
31,072 11.9 4,888,392 13.1 10,872,622 8.3 0.36 0.79 2.22 4.7628,251 11.8 4,408,374 12.9 6,065,373 9.7 0.33 0.45 1.38 4.3224,146 11.1 3,607,657 12.6 6,035,321 8.4 0.31 0.52 1.67 4.35
48,548 18.5 2,223,121 5.9 7,711,186 5.9 0.16 0.56 3.47 2.1752,377 21.8 2,751,342 8.1 6,192,502 9.9 0.21 0.46 2.25 2.7042,461 19.5 2,442,010 8.5 5,853,518 8.2 0.21 0.50 2.40 2.94
7,722 2.9 9,187,434 24.6 12,367,560 9.5 0.67 0.90 1.35 8.956,922 2.9 9,173,827 26.9 7,112,876 11.4 0.68 0.53 0.78 8.995,225 2.4 6,642,178 23.2 7,321,933 10.2 0.57 0.63 1.10 8.00
56,199 21.4 7,135,112 19.1 48,216,278 37.0 0.52 3.51 6.76 6.9538,091 15.9 5,206,516 15.3 18,461,917 29.6 0.39 1.38 3.55 5.1038,508 17.7 4,859,987 17.0 24,882,043 34.8 0.42 2.14 5.12 5.85
13,834 5.3 958,836 2.6 2,053,338 1.6 0.07 0.15 2.14 0.9314,078 5.9 1,137,289 3.3 1,736,866 2.8 0.08 0.13 1.53 1.1114,485 6.7 881,065 3.1 1,641,331 2.3 0.08 0.14 1.86 1.06
51,435 19.6 5,903,624 15.8 16,647,129 12.8 0.43 1.21 2.82 5.7545,099 18.8 5,406,333 15.9 10,309,960 16.5 0.40 0.77 1.91 5.3042,018 19.3 4,907,133 17.1 10,798,408 15.1 0.42 0.93 2.20 5.91
11,025 4.2 3,204,709 8.6 23,055,918 17.7 0.23 1.68 7.19 3.1212,681 5.3 2,016,108 5.9 6,573,715 10.5 0.15 0.49 3.26 1.9812,002 5.5 1,990,610 7.0 8,937,363 12.5 0.17 0.77 4.49 2.40
5,285 2.0 763,011 2.0 4,244,959 3.3 0.06 0.31 5.56 0.745,162 2.2 838,406 2.5 1,322,176 2.1 0.06 0.10 1.58 0.824,883 2.2 593,784 2.1 1,840,027 2.6 0.05 0.16 3.10 0.72
3,368 1.3 715,248 1.9 815,022 0.6 0.05 0.06 1.14 0.702,689 1.1 612,164 1.8 491,757 0.8 0.05 0.04 0.80 0.602,654 1.2 573,495 2.0 559,976 0.8 0.05 0.05 0.98 0.69
33,672 12.8 2,413,628 6.5 4,425,946 3.4 0.18 0.32 1.83 2.3534,703 14.5 2,498,376 7.3 4,176,730 6.7 0.19 0.31 1.67 2.4531,326 14.4 2,116,196 7.4 3,621,270 5.1 0.18 0.31 1.71 2.55
262,160 100.0 37,393,115 100.0 130,409,957 100.0 2.72 9.49 3.49 36.42240,053 100.0 34,048,735 100.0 62,443,872 100.0 2.54 4.66 1.83 33.37217,709 100.0 28,614,116 100.0 71,491,189 100.0 2.46 6.15 2.50 34.47
2013 127.032012 61.195 YEAR AVERAGE 86.13
2012 4.095 YEAR AVERAGE 4.36
Total
5 YEAR AVERAGE 0.67
Foreign Interference2013 4.31
Human Element2013 0.792012 0.48
2013 4.142012 1.305 YEAR AVERAGE 2.22
2012 6.445 YEAR AVERAGE 10.77
Adverse Environment
5 YEAR AVERAGE 13.01
Adverse Weather2013 22.46
Equipment Failure2013 16.222012 10.10
2013 2.002012 1.705 YEAR AVERAGE 1.98
2012 18.095 YEAR AVERAGE 29.98
Lightning
5 YEAR AVERAGE 8.82
Tree Contacts2013 46.97
Loss of Supply2013 12.052012 6.97
2013 7.512012 6.075 YEAR AVERAGE 7.05
2012 5.945 YEAR AVERAGE 7.27
Scheduled Outage
Unknown2013 10.59
13,404,198 CUSTOMERS IN 2012
PRIMARY CAUSENUMBER OF
INTERRUPTIONSCUSTOMER
INTERRUPTIONSCUSTOMER HOUR INTERRUPTIONS CHIKM
TABLE 3-2SYSTEM CAUSES OF SERVICE INTERRUPTION
FOR YEAR 2013
Canadian 13,737,830 CUSTOMERS IN 2013
Composite Non-Confidential Report 17

SAIFI SAIDI CAIDI CIKM
NUMBER % NUMBER % NUMBER % (HRS) (HRS)
2,577 15.4 655,977 21.3 668,435 17.9 1.12 1.14 1.02 56.05301 10.3 172,787 24.0 129,308 17.2 1.63 1.22 0.75 45.93
1,956 13.0 674,263 19.8 676,777 15.7 0.69 0.69 1.00 28.18
509 3.0 79,272 2.6 163,739 4.4 0.14 0.28 2.07 6.77572 19.6 28,741 4.0 85,774 11.4 0.27 0.81 2.98 7.64
1,528 10.2 562,770 16.5 761,887 17.6 0.58 0.78 1.35 23.52
1,339 8.0 249,801 8.1 90,455 2.4 0.43 0.15 0.36 21.341,748 59.8 123,164 17.1 36,939 4.9 1.16 0.35 0.30 32.742,114 14.0 574,039 16.9 395,159 9.1 0.59 0.40 0.69 23.99
2,848 17.0 316,167 10.3 544,955 14.6 0.54 0.93 1.72 27.0111 0.4 22,641 3.1 36,840 4.9 0.21 0.35 1.63 6.02
2,173 14.4 256,530 7.5 467,633 10.8 0.26 0.48 1.82 10.72
254 1.5 157,320 5.1 141,866 3.8 0.27 0.24 0.90 13.4439 1.3 95,186 13.2 76,817 10.2 0.90 0.72 0.81 25.30
685 4.6 186,811 5.5 196,812 4.6 0.19 0.20 1.05 7.81
4,652 27.8 926,593 30.0 1,229,530 32.8 1.58 2.10 1.33 79.17147 5.0 119,180 16.6 235,692 31.4 1.12 2.22 1.98 31.68
3,227 21.4 653,872 19.2 844,146 19.5 0.67 0.86 1.29 27.33
123 0.7 82,906 2.7 172,360 4.6 0.14 0.29 2.08 7.0825 0.9 66,965 9.3 70,415 9.4 0.63 0.66 1.05 17.80
499 3.3 97,195 2.9 496,803 11.5 0.10 0.51 5.11 4.06
1,320 7.9 122,003 4.0 150,080 4.0 0.21 0.26 1.23 10.423 0.1 2,077 0.3 1,486 0.2 0.02 0.01 0.72 0.55
544 3.6 71,368 2.1 85,436 2.0 0.07 0.09 1.20 2.98
303 1.8 101,487 3.3 65,937 1.8 0.17 0.11 0.65 8.676 0.2 9,412 1.3 4,891 0.7 0.09 0.05 0.52 2.50
232 1.5 64,190 1.9 63,572 1.5 0.07 0.07 0.99 2.68
2,809 16.8 392,004 12.7 515,767 13.8 0.67 0.88 1.32 33.4972 2.5 78,793 11.0 73,625 9.8 0.74 0.69 0.93 20.94
2,094 13.9 259,847 7.6 332,242 7.7 0.27 0.34 1.28 10.86
16,734 100.0 3,083,530 100.0 3,743,124 100.0 5.27 6.39 1.21 263.462,924 100.0 718,946 100.0 751,786 100.0 6.76 7.07 1.05 191.11
15,053 100.0 3,400,884 100.0 4,320,467 100.0 3.48 4.42 1.27 142.14
2013 319.822012 199.845 YEAR AVERAGE 180.57
2012 19.575 YEAR AVERAGE 13.89
Total
5 YEAR AVERAGE 2.66
Foreign Interference2013 44.07
Human Element2013 5.632012 1.30
2013 12.822012 0.405 YEAR AVERAGE 3.57
2012 18.725 YEAR AVERAGE 20.76
Adverse Environment
5 YEAR AVERAGE 35.28
Adverse Weather2013 14.73
Equipment Failure2013 105.052012 62.65
2013 12.122012 20.425 YEAR AVERAGE 8.23
2012 9.795 YEAR AVERAGE 19.54
Lightning
5 YEAR AVERAGE 16.52
Tree Contacts2013 46.56
Loss of Supply2013 7.732012 9.82
2013 13.992012 22.805 YEAR AVERAGE 31.84
2012 34.375 YEAR AVERAGE 28.29
Scheduled Outage
Unknown2013 57.11
106,299 CUSTOMERS IN 2012
PRIMARY CAUSENUMBER OF
INTERRUPTIONSCUSTOMER
INTERRUPTIONSCUSTOMER
HOUR CHIKM
TABLE 3-2ASYSTEM CAUSES OF SERVICE INTERRUPTION
FOR YEAR 2013International 585,553 CUSTOMERS IN 2013
Composite Non-Confidential Report 18

4.0 SUMMARY
Composite Non-Confidential Report 19
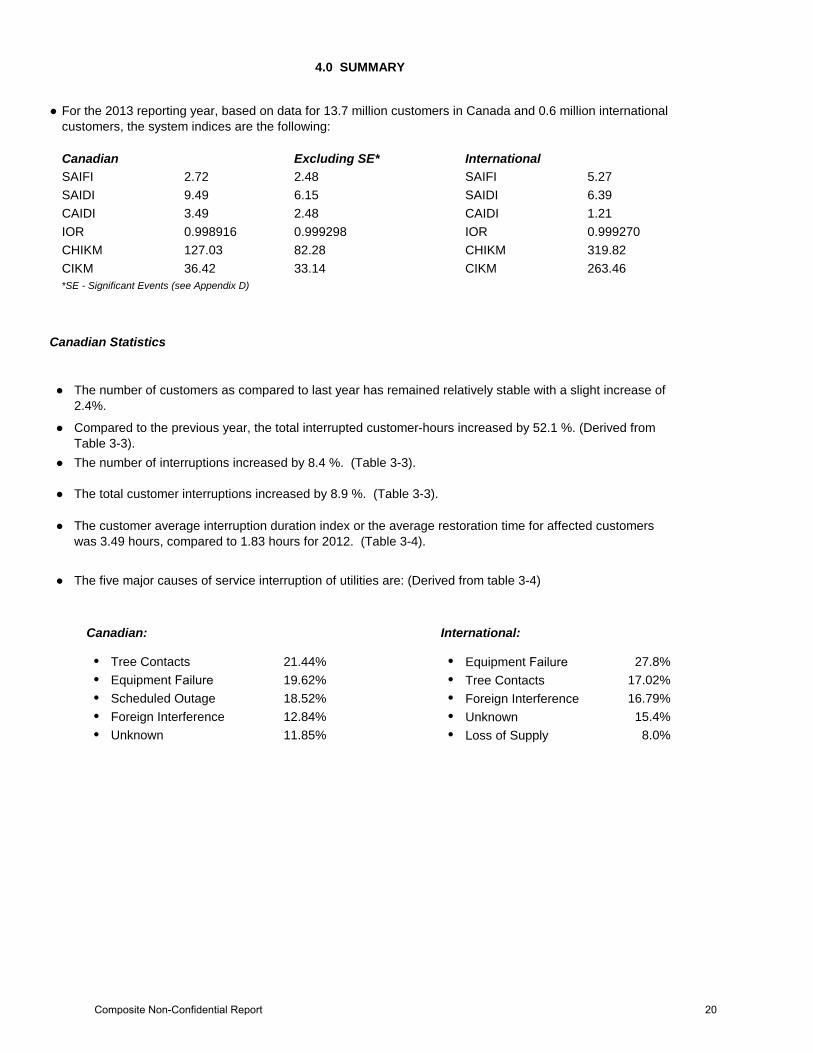
InternationalSAIFISAIDICAIDIIORCHIKMCIKM
● ● 27.8%● ● 17.02%● ● 16.79%● ● 15.4%● ● 8.0%
12.84%
Tree Contacts Equipment Failure Scheduled Outage Foreign Interference Unknown 11.85%
Equipment Failure Tree Contacts Foreign Interference UnknownLoss of Supply
19.62%18.52%
● The five major causes of service interruption of utilities are: (Derived from table 3-4)
Canadian: International:
21.44%
● The number of interruptions increased by 8.4 %. (Table 3-3).
● The total customer interruptions increased by 8.9 %. (Table 3-3).
● The customer average interruption duration index or the average restoration time for affected customerswas 3.49 hours, compared to 1.83 hours for 2012. (Table 3-4).
*SE - Significant Events (see Appendix D)
Canadian Statistics
● The number of customers as compared to last year has remained relatively stable with a slight increase of2.4%.
● Compared to the previous year, the total interrupted customer-hours increased by 52.1 %. (Derived fromTable 3-3).
CHIKM 127.03 82.28 319.82CIKM 36.42 33.14 263.46
CAIDI 3.49 2.48 1.21IOR 0.998916 0.999298 0.999270
SAIFI 2.72 2.48 5.27SAIDI 9.49 6.15 6.39
4.0 SUMMARY
● For the 2013 reporting year, based on data for 13.7 million customers in Canada and 0.6 million internationalcustomers, the system indices are the following:
Canadian Excluding SE*
Composite Non-Confidential Report 20

5.0 SYSTEM CAUSES OF SERVICE OUTAGE
Composite Non-Confidential Report 21
0.05
0.06
0.07
0.16
0.18
0.23
0.36
0.43
0.52
0.67
TOTAL SAIFI =
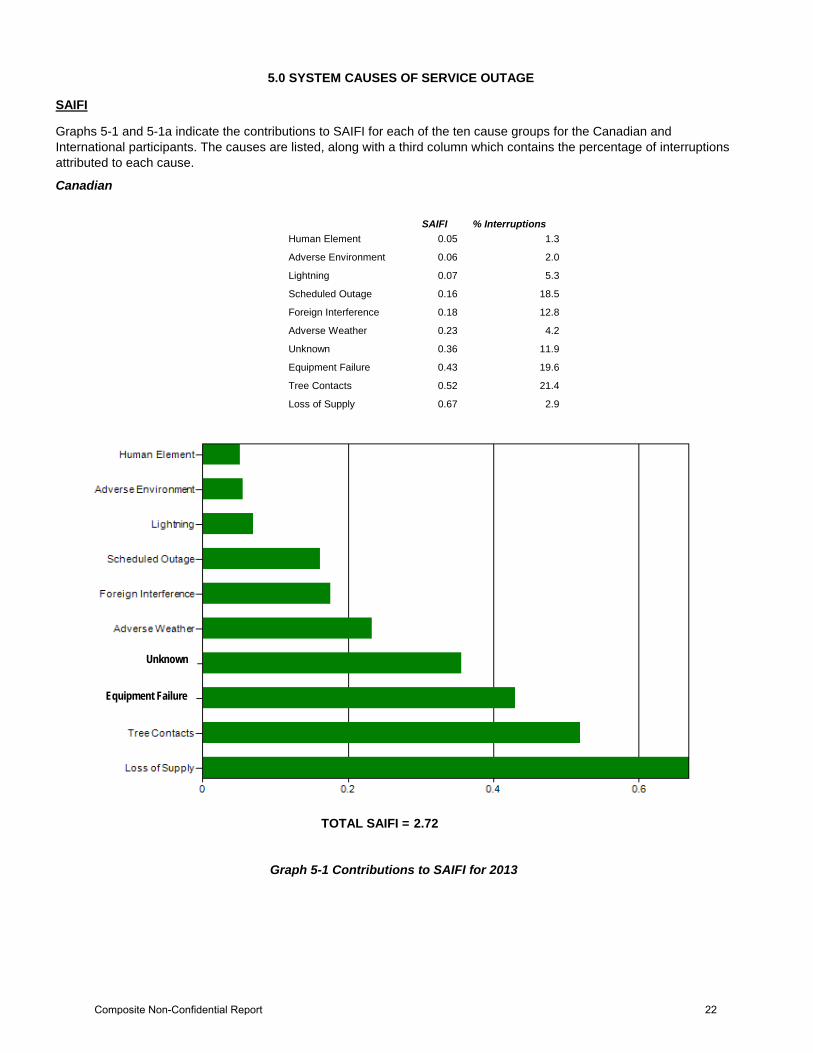
5.0 SYSTEM CAUSES OF SERVICE OUTAGE
SAIFI
Graphs 5-1 and 5-1a indicate the contributions to SAIFI for each of the ten cause groups for the Canadian and International participants. The causes are listed, along with a third column which contains the percentage of interruptions attributed to each cause.
Canadian
SAIFI % InterruptionsHuman Element 1.3
Adverse Environment 2.0
Lightning 5.3
Scheduled Outage 18.5
Foreign Interference 12.8
Adverse Weather 4.2
Unknown 11.9
Equipment Failure 19.6
Tree Contacts 21.4
Loss of Supply 2.9
2.72
Graph 5-1 Contributions to SAIFI for 2013
Equipment Failure
Unknown
Composite Non-Confidential Report 22
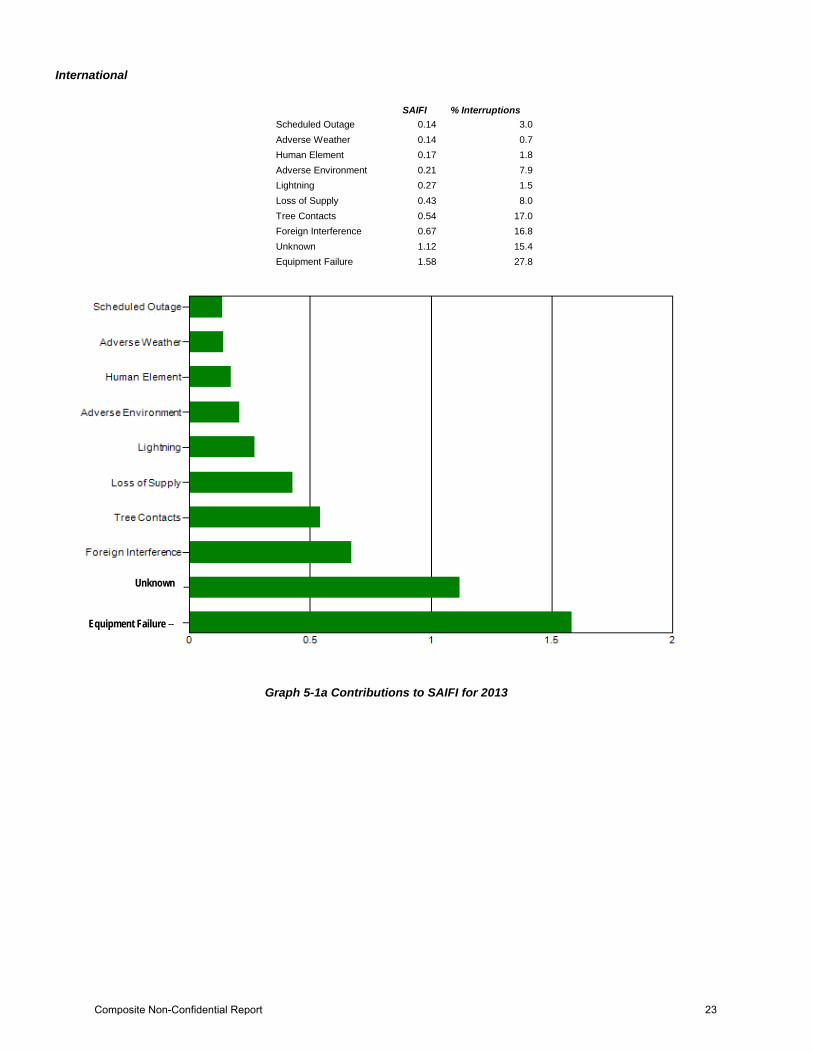
International
SAIFI % InterruptionsScheduled Outage 0.14 3.0Adverse Weather 0.14 0.7Human Element 0.17 1.8Adverse Environment 0.21 7.9Lightning 0.27 1.5Loss of Supply 0.43 8.0Tree Contacts 0.54 17.0Foreign Interference 0.67 16.8Unknown 1.12 15.4
Graph 5-1a Contributions to SAIFI for 2013
Equipment Failure 1.58 27.8
TOTAL SAIFI = 5.27
Equipment Failure --
Unknown
Composite Non-Confidential Report 23
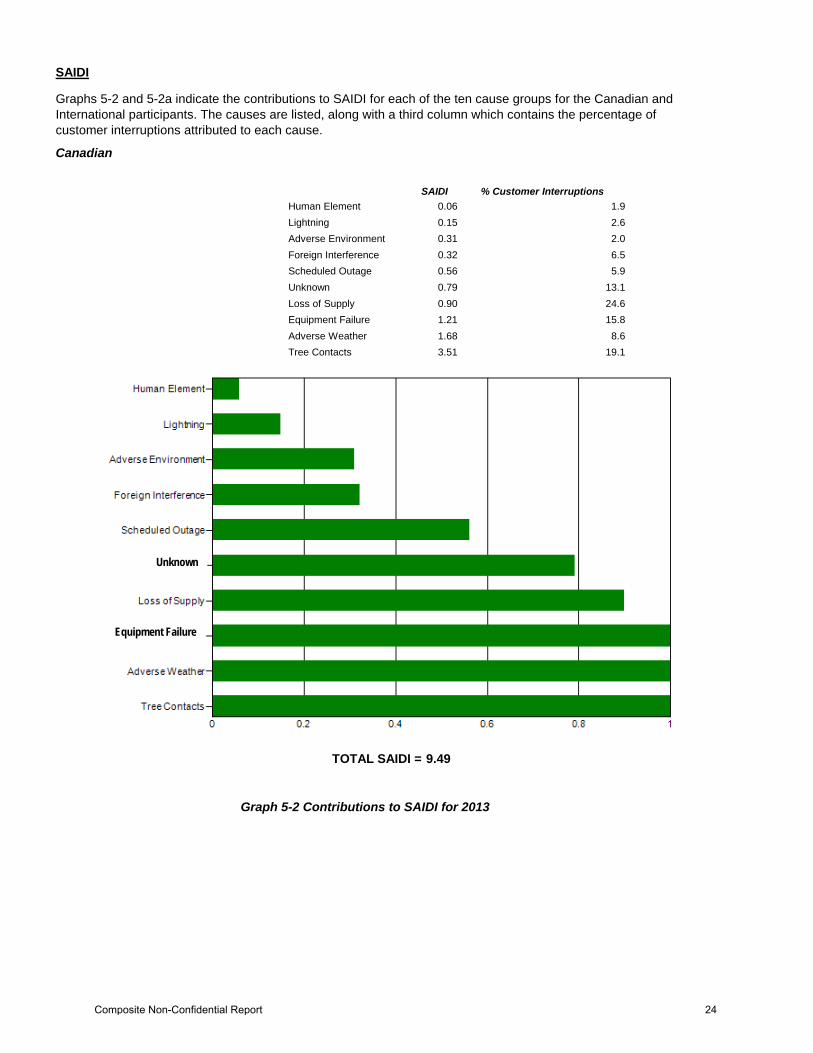
SAIDI
Graphs 5-2 and 5-2a indicate the contributions to SAIDI for each of the ten cause groups for the Canadian and International participants. The causes are listed, along with a third column which contains the percentage of customer interruptions attributed to each cause.
Canadian
SAIDI % Customer InterruptionsHuman Element 0.06 1.9Lightning 0.15 2.6Adverse Environment 0.31 2.0Foreign Interference 0.32 6.5Scheduled Outage 0.56 5.9Unknown 0.79 13.1Loss of Supply 0.90 24.6Equipment Failure 1.21 15.8
TOTAL SAIDI = 9.49
Graph 5-2 Contributions to SAIDI for 2013
Adverse Weather 1.68 8.6Tree Contacts 3.51 19.1
Equipment Failure
Unknown
Composite Non-Confidential Report 24
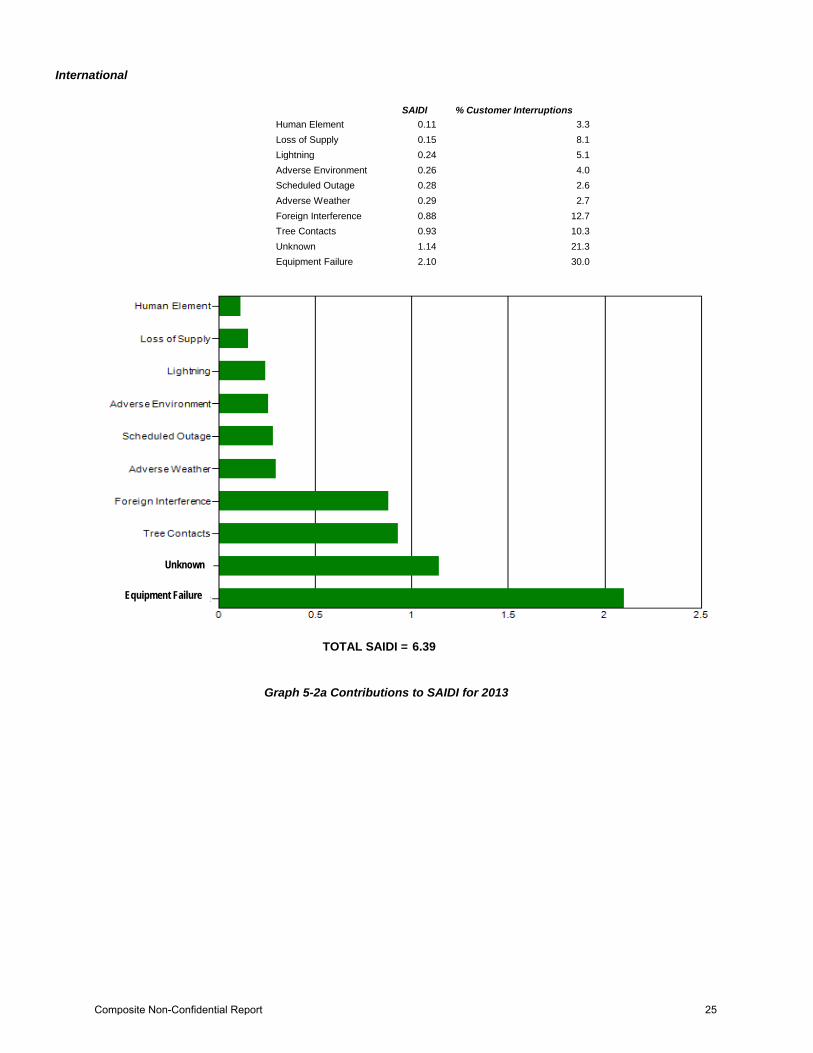
International
SAIDI % Customer InterruptionsHuman Element 0.11 3.3Loss of Supply 0.15 8.1Lightning 0.24 5.1Adverse Environment 0.26 4.0Scheduled Outage 0.28 2.6Adverse Weather 0.29 2.7Foreign Interference 0.88 12.7Tree Contacts 0.93 10.3Unknown 1.14 21.3
Graph 5-2a Contributions to SAIDI for 2013
Equipment Failure 2.10 30.0
TOTAL SAIDI = 6.39
Equipment Failure
Unknown
Composite Non-Confidential Report 25

CAIDI
Graphs 5-3 and 5-3a indicate the contributions to CAIDI for each of the ten cause groups for the Canadian and International participants. The causes are listed, along with a third column which contains the percentage of customer hours of interruption attributed to each cause.
Canadian
CAIDI % Customer-hrs InterruptionsHuman Element 1.14 0.6Loss of Supply 1.35 9.5Foreign Interference 1.83 3.4Lightning 2.14 1.6Unknown 2.22 8.3Equipment Failure 2.82 12.8Scheduled Outage 3.47 5.9Adverse Environment 5.56 3.3
TOTAL CAIDI = 3.49
Graph 5-3 Contributions to CAIDI for 2013
Tree Contacts 6.76 37.0Adverse Weather 7.19 17.7
Equipment Failure
Unknown
Composite Non-Confidential Report 26
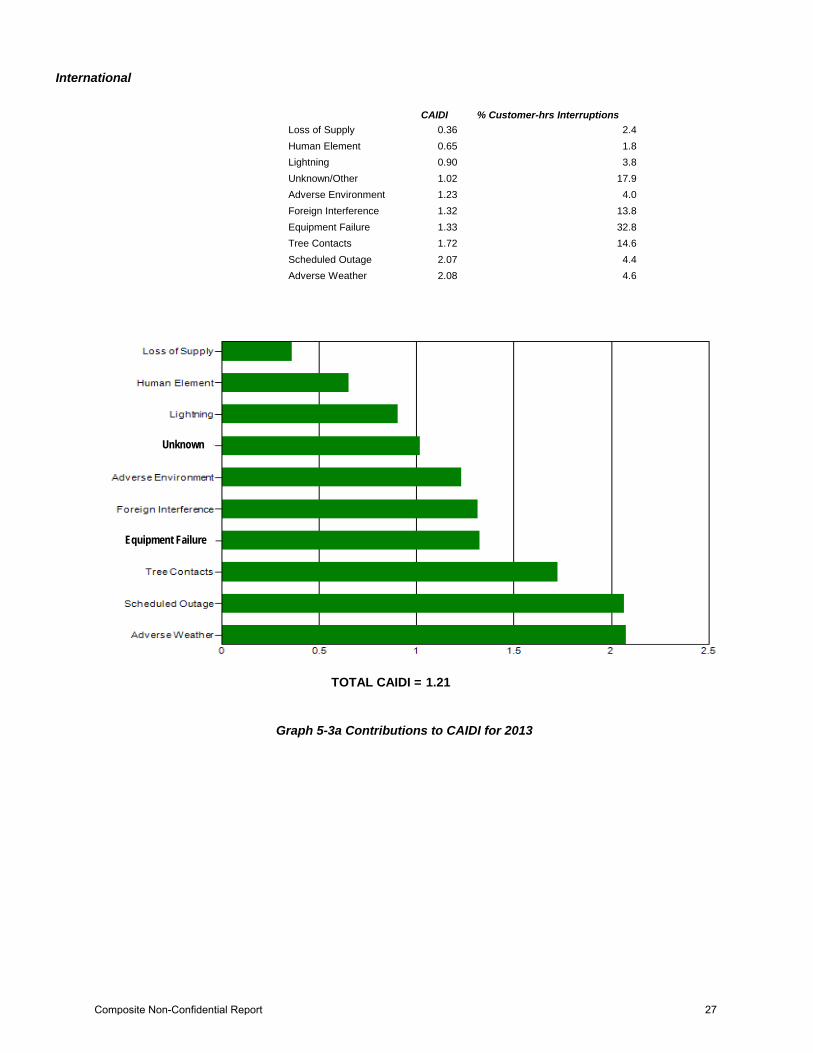
International
CAIDI % Customer-hrs InterruptionsLoss of Supply 0.36 2.4Human Element 0.65 1.8Lightning 0.90 3.8Unknown/Other 1.02 17.9Adverse Environment 1.23 4.0Foreign Interference 1.32 13.8Equipment Failure 1.33 32.8Tree Contacts 1.72 14.6Scheduled Outage 2.07 4.4
Graph 5-3a Contributions to CAIDI for 2013
Adverse Weather 2.08 4.6
TOTAL CAIDI = 1.21
Equipment Failure
Unknown
Composite Non-Confidential Report 27

CHIKM
Graphs 5-4 and 5-4a indicate the contributions to CHIKM for each of the ten cause groups for the Canadian and International participants. The causes are listed, along with a third column which contains the percentage of customer hours of interruption per circuit km attributed to each cause.
Canadian
CHIKM % Customer-hrs InterruptionsHuman Element 0.79 0.6Lightning 2.00 1.6Adverse Environment 4.14 3.3Foreign Interference 4.31 3.4Scheduled Outage 7.51 5.9Unknown 10.59 8.3Loss of Supply 12.05 9.5Equipment Failure 16.22 12.8
TOTAL CHIKM = 127.03
Graph 5-4 Contributions to CHIKM for 2013
Adverse Weather 22.46 17.7Tree Contacts 46.97 37.0
Equipment Failure
Unknown
Composite Non-Confidential Report 28
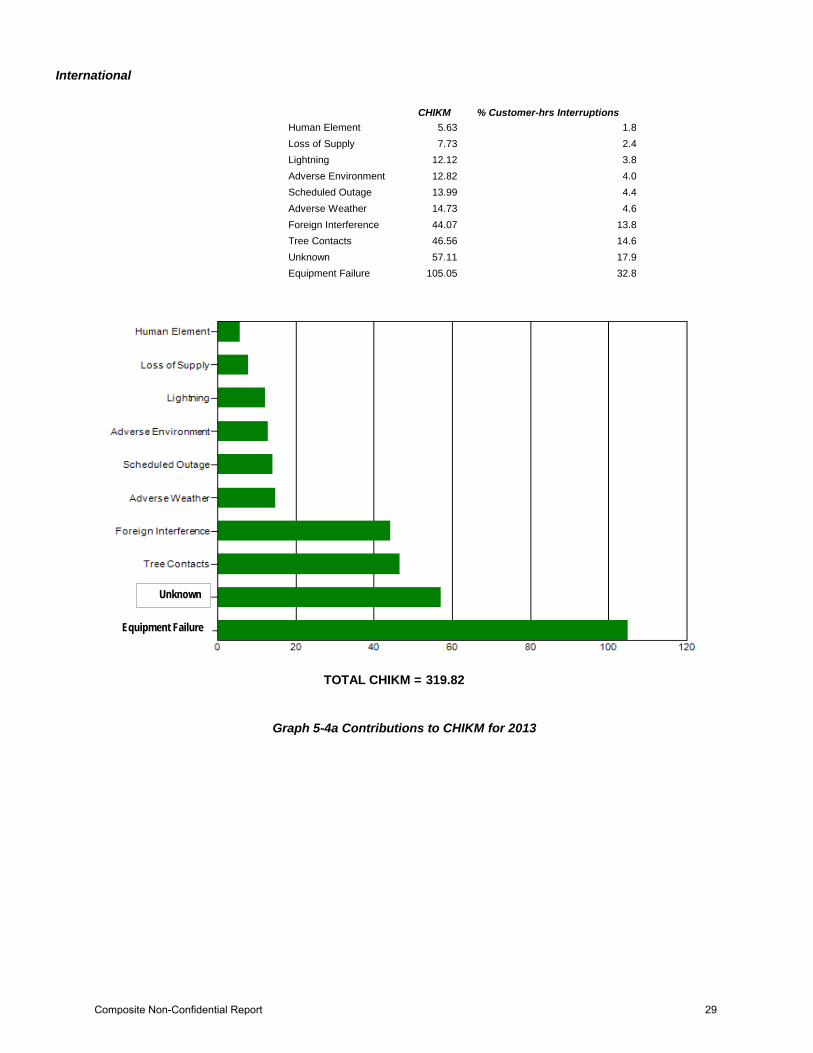
International
CHIKM % Customer-hrs InterruptionsHuman Element 5.63 1.8Loss of Supply 7.73 2.4Lightning 12.12 3.8Adverse Environment 12.82 4.0Scheduled Outage 13.99 4.4Adverse Weather 14.73 4.6Foreign Interference 44.07 13.8Tree Contacts 46.56 14.6Unknown 57.11 17.9
Graph 5-4a Contributions to CHIKM for 2013
Equipment Failure 105.05 32.8
TOTAL CHIKM = 319.82
Equipment Failure
Unknown
Composite Non-Confidential Report 29

CIKM
Graphs 5-5 and 5-5a indicate the contributions to CIKM for each of the ten cause groups for the Canadian and International participants. The causes are listed, along with a third column which contains the percentage of customer interruption per circuit km attributed to each cause.
Canadian
CIKM % Customer InterruptionsHuman Element 0.70 1.9Adverse Environment 0.74 2.0Lightning 0.93 2.6Scheduled Outage 2.17 5.9Foreign Interference 2.35 6.5Adverse Weather 3.12 8.6Unknown 4.76 13.1Equipment Failure 5.75 15.8
TOTAL CIKM = 36.42
Graph 5-5 Contributions to CIKM for 2013
Tree Contacts 6.95 19.1Loss of Supply 8.95 24.6
Equipment Failure
Unknown
Composite Non-Confidential Report 30

International
CIKM % Customer InterruptionsScheduled Outage 6.77 2.6Adverse Weather 7.08 2.7Human Element 8.67 3.3Adverse Environment 10.42 4.0Lightning 13.44 5.1Loss of Supply 21.34 8.1Tree Contacts 27.01 10.3Foreign Interference 33.49 12.7Unknown 56.05 21.3
Graph 5-5a Contributions to CIKM for 2013
Equipment Failure 79.17 30.0
TOTAL CIKM = 263.46
Equipment Failure
Unknown
Composite Non-Confidential Report 31
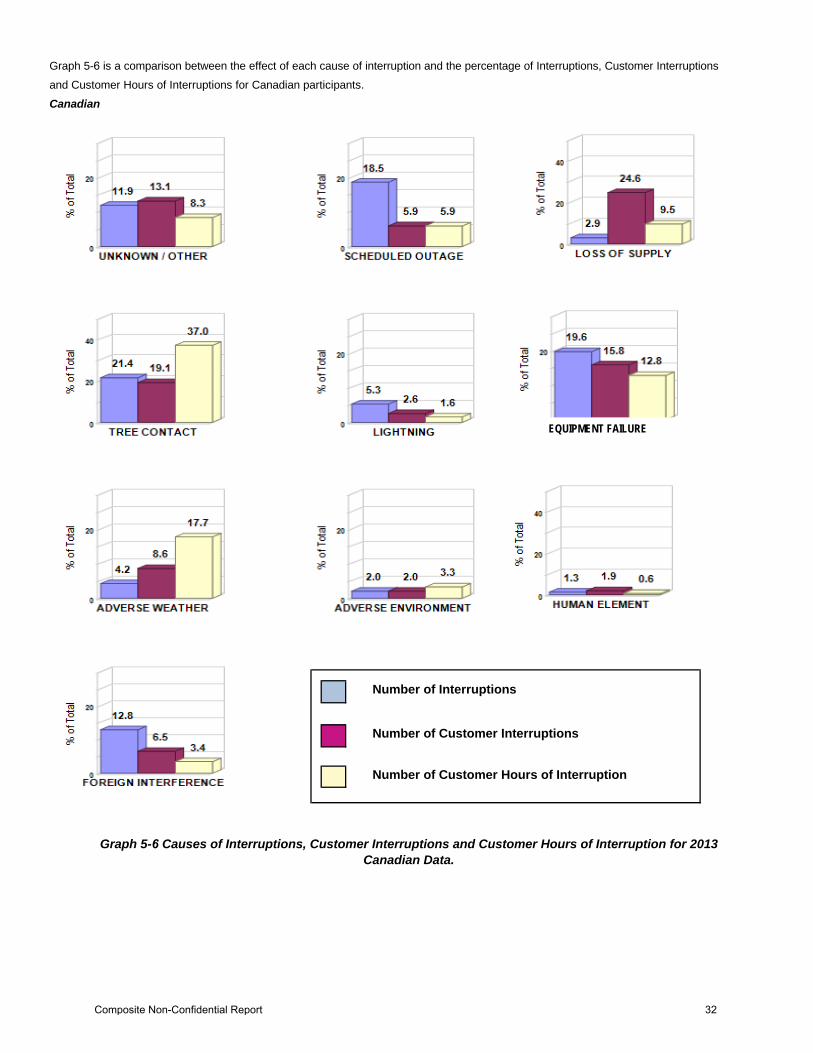
Number of Interruptions
Number of Customer Interruptions
Number of Customer Hours of Interruption
Graph 5-6 Causes of Interruptions, Customer Interruptions and Customer Hours of Interruption for 2013 Canadian Data.
Graph 5-6 is a comparison between the effect of each cause of interruption and the percentage of Interruptions, Customer Interruptions and Customer Hours of Interruptions for Canadian participants.Canadian
EQUIPMENT FAILURE
Composite Non-Confidential Report 32

The following graphs show the comparison between the effect of each cause of interruption and the percentage of Interruptions, Customer Interruptions and Customer Hours of Interruption.
International
Number of Interruptions
Number of Customer Interruptions
Number of Customer Hours of Interruption
Graph 5-6a Causes of Interruptions, Customer Interruptions and Customer Hours of Interruption for 2013 International Data.
EQUIPMENT FAILURE
UNKNOWN
Composite Non-Confidential Report 33
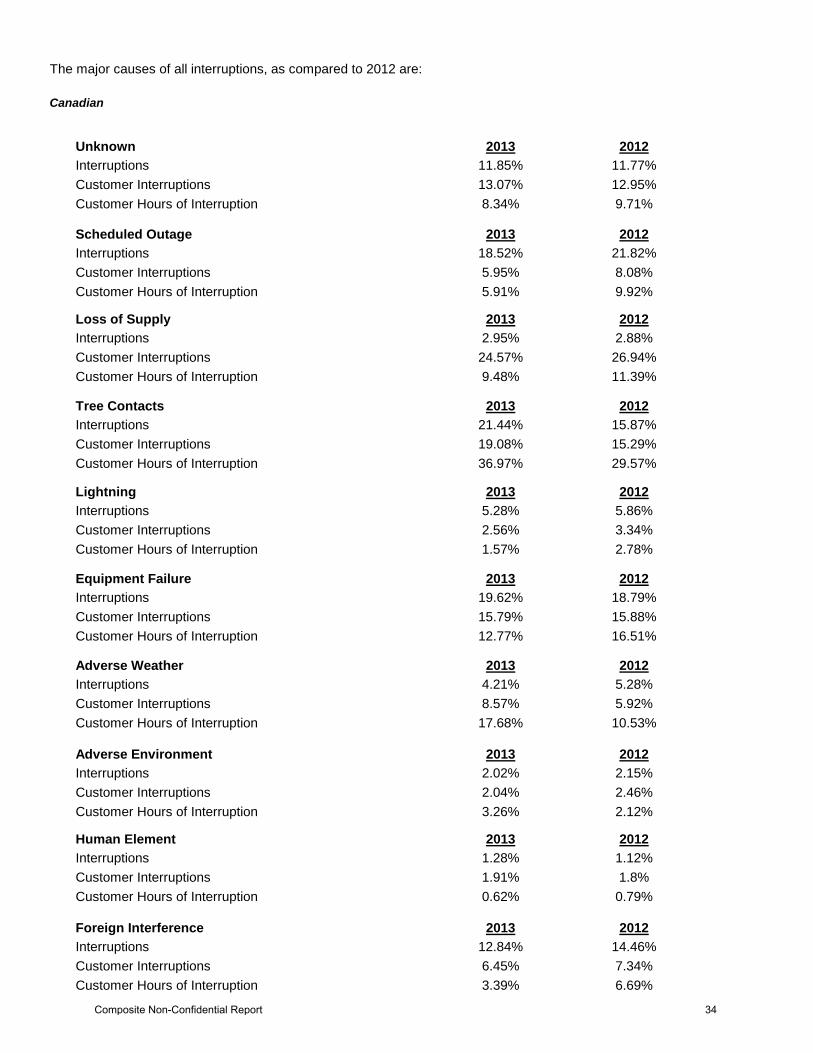
2013 201211.85% 11.77%13.07% 12.95%8.34% 9.71%
2013 201218.52% 21.82%5.95% 8.08%5.91% 9.92%
2013 20122.95% 2.88%24.57% 26.94%9.48% 11.39%
2013 201221.44% 15.87%19.08% 15.29%36.97% 29.57%
2013 20125.28% 5.86%2.56% 3.34%1.57% 2.78%
2013 201219.62% 18.79%15.79% 15.88%12.77% 16.51%
2013 20124.21% 5.28%8.57% 5.92%17.68% 10.53%
2013 20122.02% 2.15%2.04% 2.46%3.26% 2.12%
2013 20121.28% 1.12%1.91% 1.8%0.62% 0.79%
2013 201212.84% 14.46%6.45% 7.34%3.39% 6.69%
Foreign InterferenceInterruptionsCustomer InterruptionsCustomer Hours of Interruption
Human ElementInterruptionsCustomer InterruptionsCustomer Hours of Interruption
Adverse EnvironmentInterruptionsCustomer InterruptionsCustomer Hours of Interruption
Adverse WeatherInterruptionsCustomer InterruptionsCustomer Hours of Interruption
Equipment FailureInterruptionsCustomer InterruptionsCustomer Hours of Interruption
LightningInterruptionsCustomer InterruptionsCustomer Hours of Interruption
Tree ContactsInterruptionsCustomer InterruptionsCustomer Hours of Interruption
Loss of SupplyInterruptionsCustomer InterruptionsCustomer Hours of Interruption
Scheduled OutageInterruptionsCustomer InterruptionsCustomer Hours of Interruption
The major causes of all interruptions, as compared to 2012 are:
Canadian
UnknownInterruptionsCustomer InterruptionsCustomer Hours of Interruption
Composite Non-Confidential Report 34

2013 201215.4% 10.29%21.27% 24.03%17.86% 17.2%
2013 20123.04% 19.56%2.57% 4.0%4.37% 11.41%
2013 20128.0% 59.78%8.1% 17.13%2.42% 4.91%
2013 201217.02% 0.38%10.25% 3.15%14.56% 4.9%
2013 20121.52% 1.33%5.1% 13.24%3.79% 10.22%
2013 201227.8% 5.03%30.05% 16.58%32.85% 31.35%
2013 20120.74% 0.85%2.69% 9.31%4.6% 9.37%
2013 20127.89% 0.1%3.96% 0.29%4.01% 0.2%
2013 20121.81% 0.21%3.29% 1.31%1.76% 0.65%
2013 201216.79% 2.46%12.71% 10.96%13.78% 9.79%
Foreign InterferenceInterruptionsCustomer InterruptionsCustomer Hours of Interruption
Human ElementInterruptionsCustomer InterruptionsCustomer Hours of Interruption
Adverse EnvironmentInterruptionsCustomer InterruptionsCustomer Hours of Interruption
Adverse WeatherInterruptionsCustomer InterruptionsCustomer Hours of Interruption
Equipment FailureInterruptionsCustomer InterruptionsCustomer Hours of Interruption
LightningInterruptionsCustomer InterruptionsCustomer Hours of Interruption
Tree ContactsInterruptionsCustomer InterruptionsCustomer Hours of Interruption
Loss of SupplyInterruptionsCustomer InterruptionsCustomer Hours of Interruption
Scheduled OutageInterruptionsCustomer InterruptionsCustomer Hours of Interruption
The major causes of all interruptions, as compared to 2012 are:
International Participants
UnknownInterruptionsCustomer InterruptionsCustomer Hours of Interruption
Composite Non-Confidential Report 35

6.0 TABULATION OFSERVICE INTERRUPTION DATA
FORREGION 1 (URBAN UTILITIES)
Composite Non-Confidential Report 36
Region 1 (Urban Utilities)City of Medicine HatCity of Red DeerEnersource Hydro Mississauga ENMAX Power CorporationEPCORHorizon UtilitiesHydro Ottawa London HydroOakville Hydro Electricity DistributionOshawa Power and Utilities Corporation PowerStream Inc.Saint John EnergySaskatoon Light & PowerSt. Thomas EnergyTata Power Co. LtdToronto Hydro* B.C. Hydro - Vancouver/Burnaby District* B.C. Hydro - Victoria District* Hydro One - Combined Urban Areas* Hydro-Québec - Montréal Métropolitain* Hydro-Québec - Québec Métropolitain* Manitoba Hydro - Winnipeg* Maritime Electric – Charlottetown Region* NSPI - Halifax Urban* NSPI - Provincial Urban Areas (excl. Halifax)
6.0
Composite Non-Confidential Report 37

(A) (B)NUMBER OF CUSTOMERS
SERVEDNUMBER OF
INTERRUPTIONSTOTAL CUSTOMER
INTERRUPTIONS
TOTAL INTERRUPTED CUST. HOURS
TOTAL AVAILABLE CUST. HOURS
3,754,982 16,821 5,409,457 6,492,473 32,893,642,320
3,820,317 15,938 5,090,911 6,864,459 33,465,976,920
3,970,475 19,033 5,618,851 7,414,610 34,781,361,000
4,098,135 18,993 5,586,221 6,692,238 35,899,658,220
4,098,135 18,613 5,455,638 6,111,107 35,899,658,220
5,570,394 32,019 10,133,340 10,742,967 48,796,651,440
5,570,394 31,785 9,883,968 10,276,493 48,796,651,440
5,294,438 30,971 10,861,180 34,543,885 46,379,276,880
5,294,438 29,764 9,203,858 13,723,065 46,379,276,880
2,275,769 7,294 424,305 998,342 19,935,736,440
32,380 4,112 69,592 30,402 283,648,800
38,810 4,072 80,502 31,024 339,975,600
45,107 2,353 78,232 28,074 395,137,320
52,628 2,916 170,511 145,780 461,021,280
(A) =
(C) =
SUMMATION OF THE NUMBER OF CUSTOMERS x RESTORATION TIME IN HOURS OF EACH INTERRUPTION
(B) = TWELVE MONTH AVERAGE NUMBER OF CUSTOMERS x 8,760 HOURS (ONE YEAR)
INDEX OF RELIABILITY: 1 - (A)/(B)
2011 0.999909
2012 0.999929
2013 0.999684
** Excludes Significant Events (see Appendix D)
INTERNATIONAL UTILITIES IN 2013
2008 0.999950
2010 0.999893
2012** 0.999789
2013 0.999255
2013** 0.999704
2011 0.999814
2011** 0.999830
2012 0.999780
2008 0.999803
2009 0.999795
2010 0.999787
IT EQUALS THE PER UNIT ANNUAL CUSTOMER-HOURS THAT SERVICE IS AVAILABLE.
CANADIAN UTILITIES IN 2013
(C)
YEARINDEX OF
RELIABILITY
TABLE 6-1 (REGION 1)SUMMARY OF INTERRUPTION DATA
(Including Derivation of Index of Reliability)
FOR YEARS 2008 - 2013
THE "INDEX OF RELIABILITY" IS A MEASURE OF SERVICE RELIABILITY.
Composite Non-Confidential Report 38
SAIFI SAIDI CAIDI CIKM
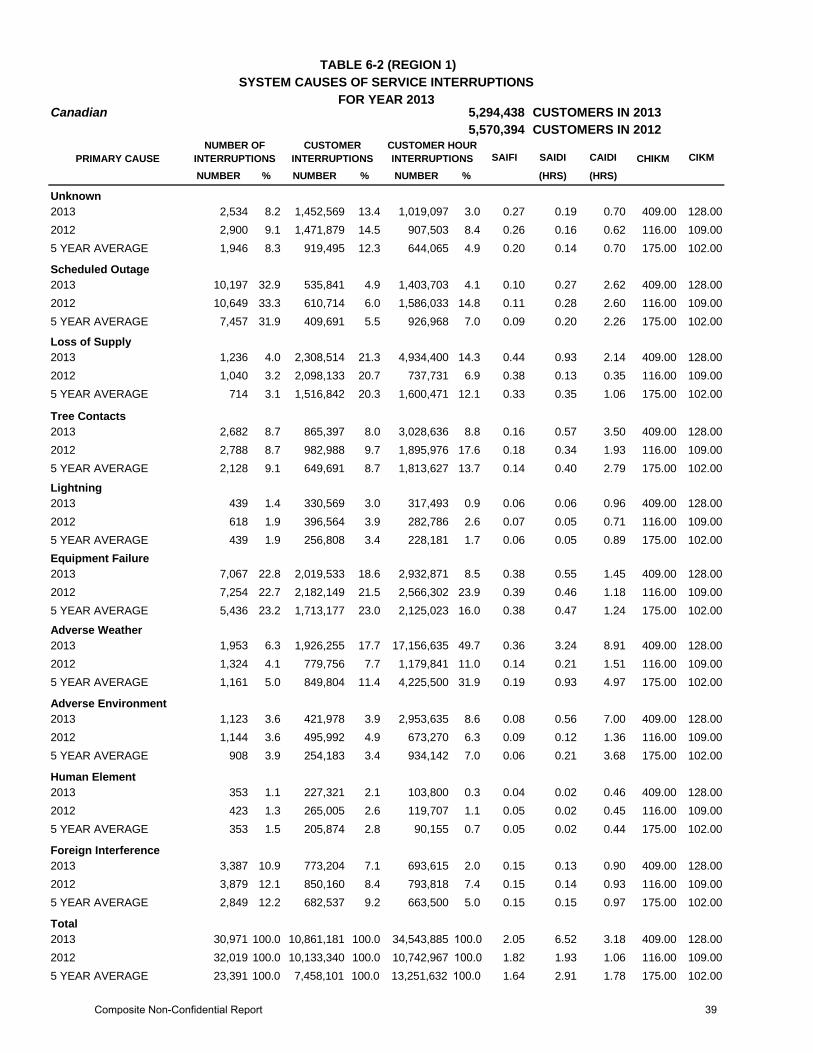
NUMBER % NUMBER % NUMBER % (HRS) (HRS)
2,534 8.2 1,452,569 13.4 1,019,097 3.0 0.27 0.19 0.70 128.002,900 9.1 1,471,879 14.5 907,503 8.4 0.26 0.16 0.62 109.001,946 8.3 919,495 12.3 644,065 4.9 0.20 0.14 0.70 102.00
10,197 32.9 535,841 4.9 1,403,703 4.1 0.10 0.27 2.62 128.0010,649 33.3 610,714 6.0 1,586,033 14.8 0.11 0.28 2.60 109.007,457 31.9 409,691 5.5 926,968 7.0 0.09 0.20 2.26 102.00
1,236 4.0 2,308,514 21.3 4,934,400 14.3 0.44 0.93 2.14 128.001,040 3.2 2,098,133 20.7 737,731 6.9 0.38 0.13 0.35 109.00
714 3.1 1,516,842 20.3 1,600,471 12.1 0.33 0.35 1.06 102.00
2,682 8.7 865,397 8.0 3,028,636 8.8 0.16 0.57 3.50 128.002,788 8.7 982,988 9.7 1,895,976 17.6 0.18 0.34 1.93 109.002,128 9.1 649,691 8.7 1,813,627 13.7 0.14 0.40 2.79 102.00
439 1.4 330,569 3.0 317,493 0.9 0.06 0.06 0.96 128.00618 1.9 396,564 3.9 282,786 2.6 0.07 0.05 0.71 109.00439 1.9 256,808 3.4 228,181 1.7 0.06 0.05 0.89 102.00
7,067 22.8 2,019,533 18.6 2,932,871 8.5 0.38 0.55 1.45 128.007,254 22.7 2,182,149 21.5 2,566,302 23.9 0.39 0.46 1.18 109.005,436 23.2 1,713,177 23.0 2,125,023 16.0 0.38 0.47 1.24 102.00
1,953 6.3 1,926,255 17.7 17,156,635 49.7 0.36 3.24 8.91 128.001,324 4.1 779,756 7.7 1,179,841 11.0 0.14 0.21 1.51 109.001,161 5.0 849,804 11.4 4,225,500 31.9 0.19 0.93 4.97 102.00
1,123 3.6 421,978 3.9 2,953,635 8.6 0.08 0.56 7.00 128.001,144 3.6 495,992 4.9 673,270 6.3 0.09 0.12 1.36 109.00
908 3.9 254,183 3.4 934,142 7.0 0.06 0.21 3.68 102.00
353 1.1 227,321 2.1 103,800 0.3 0.04 0.02 0.46 128.00423 1.3 265,005 2.6 119,707 1.1 0.05 0.02 0.45 109.00353 1.5 205,874 2.8 90,155 0.7 0.05 0.02 0.44 102.00
3,387 10.9 773,204 7.1 693,615 2.0 0.15 0.13 0.90 128.003,879 12.1 850,160 8.4 793,818 7.4 0.15 0.14 0.93 109.002,849 12.2 682,537 9.2 663,500 5.0 0.15 0.15 0.97 102.00
2.05 6.52 3.18 128.001.82 1.93 1.06 109.00
30,971 100.0 10,861,181 100.0 34,543,885 100.0 32,019 100.0 10,133,340 100.0 10,742,967 100.0 23,391 100.0 7,458,101 100.0 13,251,632 100.0 1.64 2.91 1.78 102.00
2013 409.002012 116.005 YEAR AVERAGE 175.00
2012 116.005 YEAR AVERAGE 175.00
Total
5 YEAR AVERAGE 175.00
Foreign Interference2013 409.00
Human Element2013 409.002012 116.00
2013 409.002012 116.005 YEAR AVERAGE 175.00
2012 116.005 YEAR AVERAGE 175.00
Adverse Environment
5 YEAR AVERAGE 175.00
Adverse Weather2013 409.00
Equipment Failure2013 409.002012 116.00
2013 409.002012 116.005 YEAR AVERAGE 175.00
2012 116.005 YEAR AVERAGE 175.00
Lightning
5 YEAR AVERAGE 175.00
Tree Contacts2013 409.00
Loss of Supply2013 409.002012 116.00
2013 409.002012 116.005 YEAR AVERAGE 175.00
2012 116.005 YEAR AVERAGE 175.00
Scheduled Outage
Unknown2013 409.00
5,570,394 CUSTOMERS IN 2012
PRIMARY CAUSENUMBER OF
INTERRUPTIONSCUSTOMER
INTERRUPTIONSCUSTOMER HOUR INTERRUPTIONS CHIKM
TABLE 6-2 (REGION 1)SYSTEM CAUSES OF SERVICE INTERRUPTIONS
FOR YEAR 2013Canadian 5,294,438 CUSTOMERS IN 2013
Composite Non-Confidential Report 39

CEA-Service Continuity: Analysis by Quartile Graph (2009 to 2013)
Graph 6-1: Region 1, SAIDI, Excluding MPEs
Graph 6-2: Region 1, SAIDI, Excluding Ses
Composite Non-Confidential Report 40
CEA-Service Continuity: Analysis by Quartile Graph (2009 to 2013)
Cli k h t t t t l ti
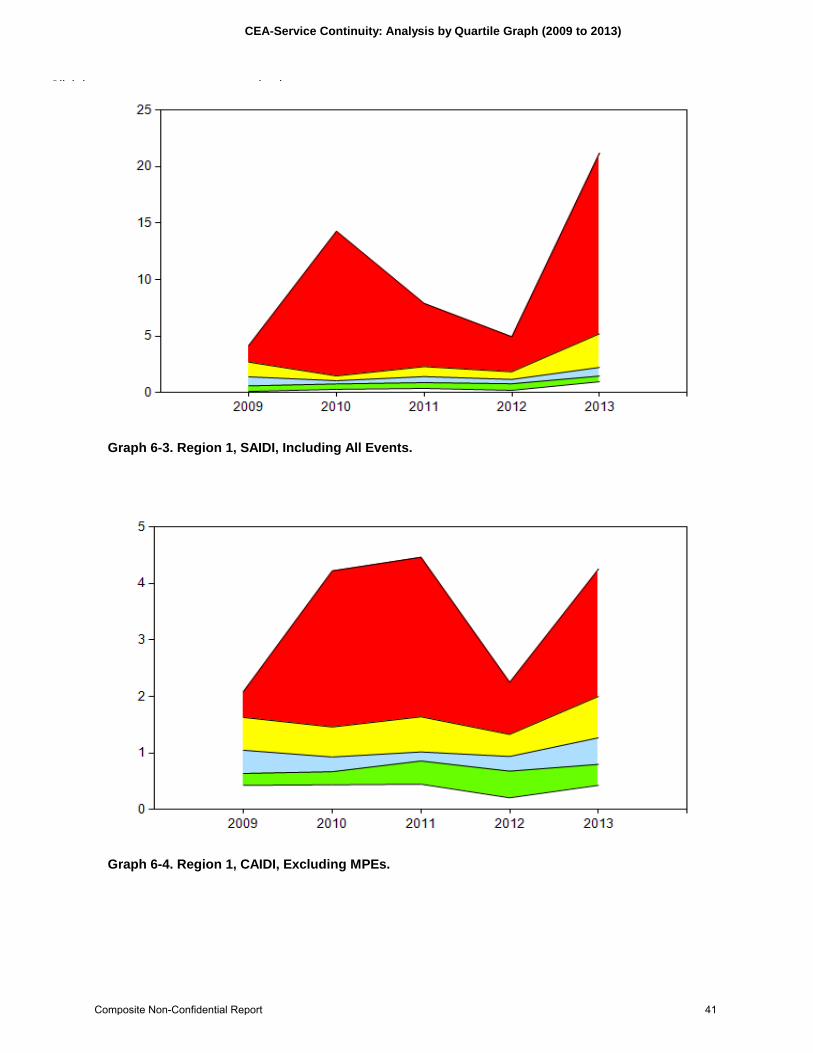
Graph 6-3. Region 1, SAIDI, Including All Events.
Graph 6-4. Region 1, CAIDI, Excluding MPEs.
Composite Non-Confidential Report 41
CEA-Service Continuity: Analysis by Quartile Graph (2009 to 2013)
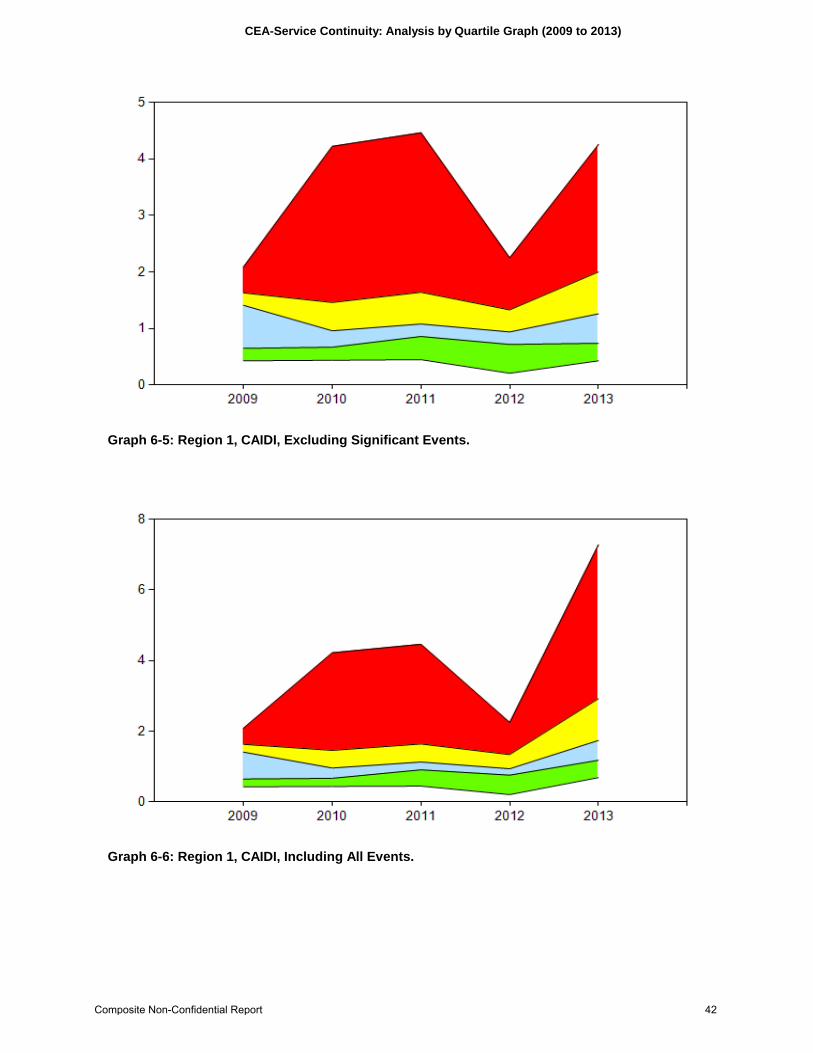
Graph 6-5: Region 1, CAIDI, Excluding Significant Events.
Graph 6-6: Region 1, CAIDI, Including All Events.
Composite Non-Confidential Report 42

CEA-Service Continuity: Analysis by Quartile Graph (2009 to 2013)
Graph 6-7: Region 1, CHIKM, Excluding MPEs.
Graph 6-8: Region 1, CHIKM, Excluding Significant Events.
Composite Non-Confidential Report 43

CEA-Service Continuity: Analysis by Quartile Graph (2009 to 2013)
Graph 6-9: Region 1, CHIKM, Including All Events.
Graph 6-10: Region 1, CIKM, Excluding MPEs.
Composite Non-Confidential Report 44

CEA-Service Continuity: Analysis by Quartile Graph (2009 to 2013)
Graph 6-11. Region 1, CIKM, Excluding Significant Events.
Graph 6-12. Region 1, CIKM, Including All Events.
Composite Non-Confidential Report 45
CEA-Service Continuity: Analysis by Quartile Graph (2009 to 2013)
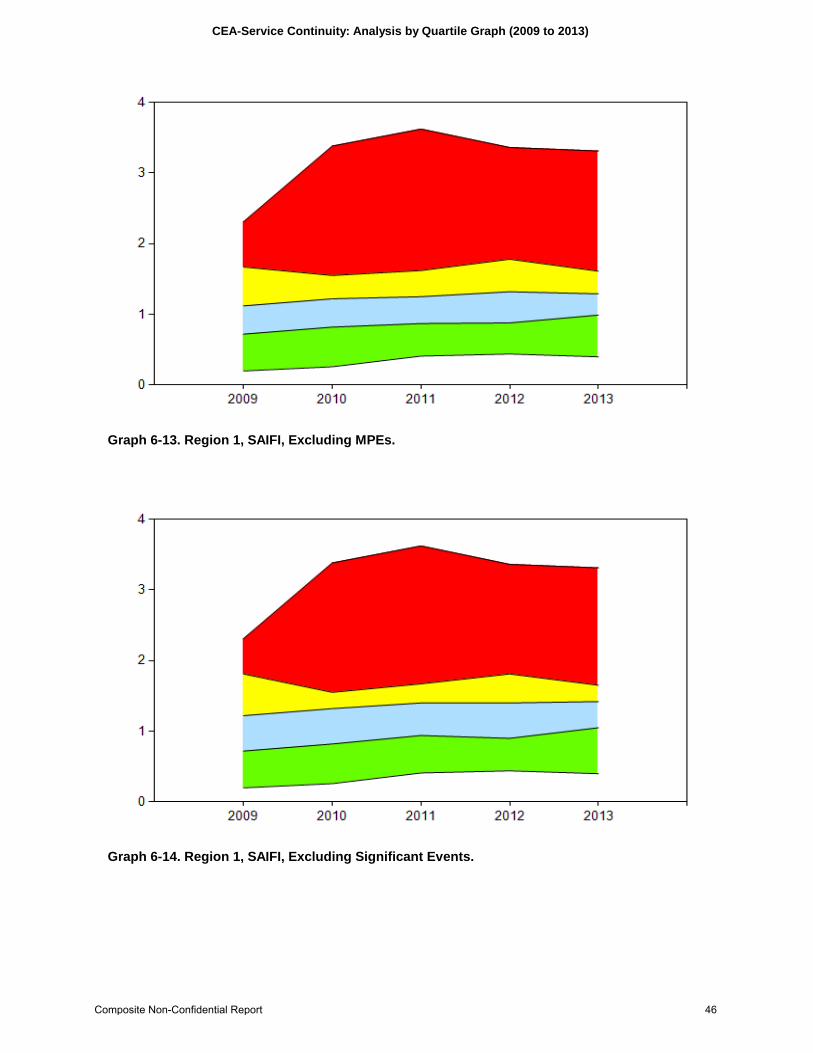
Graph 6-13. Region 1, SAIFI, Excluding MPEs.
Graph 6-14. Region 1, SAIFI, Excluding Significant Events.
Composite Non-Confidential Report 46
CEA-Service Continuity: Analysis by Quartile Graph (2009 to 2013)
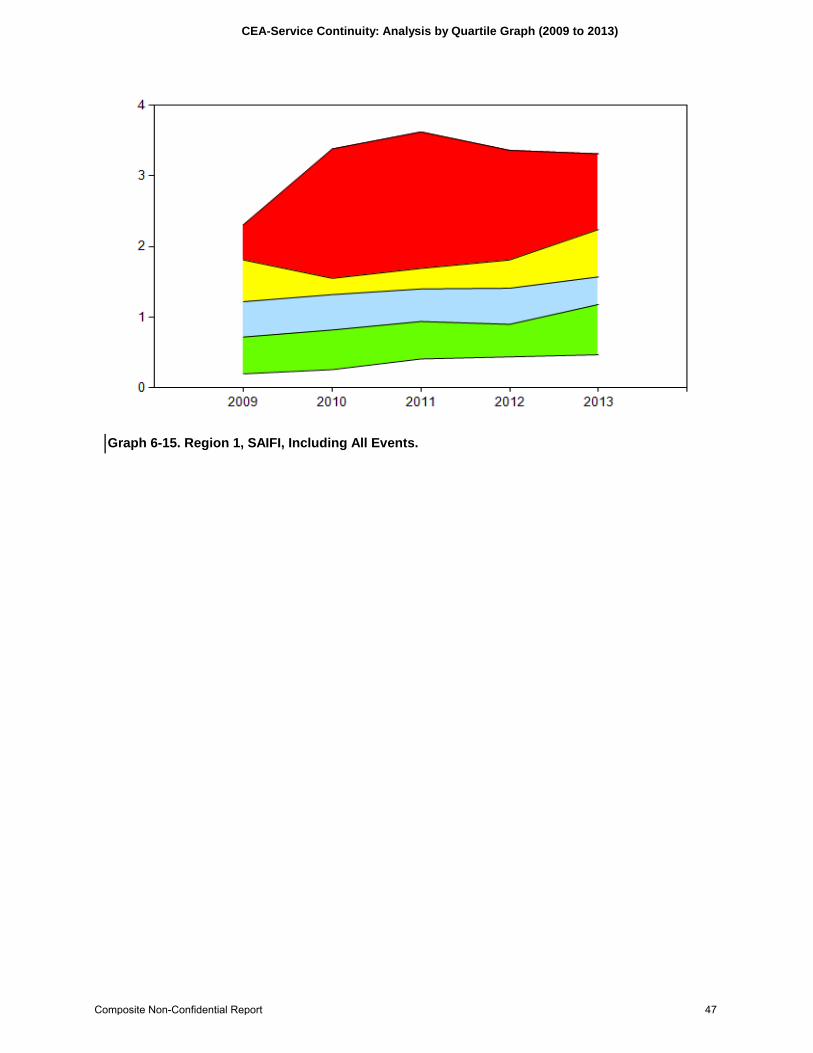
Graph 6-15. Region 1, SAIFI, Including All Events.
Composite Non-Confidential Report 47
7.0 TABULATION OFSERVICE INTERRUPTION DATA
FORREGION 2 (URBAN/RURAL UTILITIES)
Composite Non-Confidential Report 48

Region 2 (Urban / Rural Utilities)ATCO ElectricB.C. HydroCaribbean Utilities FortisAlbertaFortisBCHydro OneHydro-QuébecManitoba HydroMaritime Electric CompanyNew Brunswick PowerNewfoundland & Labrador HydroNewfoundland PowerNewmarket-Tay Power Distribution Ltd.Northland Utilities (NWT)Northland Utilities (Yellowknife)Northwest Territories Power CorporationNova Scotia Power Inc.SaskPowerSt. Lucia Electricity ServicesTrinidad & Tobago Electricity CommissionVeridian ConnectionsWaterloo North Hydro Inc.Yukon Electrical Co. Ltd.Yukon Energy
7.0
Composite Non-Confidential Report 49

(A) (B)NUMBER OF CUSTOMERS
SERVEDNUMBER OF
INTERRUPTIONSTOTAL CUSTOMER
INTERRUPTIONS
TOTAL INTERRUPTED CUST. HOURS
TOTAL AVAILABLE CUST. HOURS
5,989,214 162,469 16,515,698 51,270,337 52,465,514,640
5,989,214 153,407 15,134,787 36,900,636 52,465,514,640
6,090,535 147,223 14,076,167 32,361,156 53,353,086,600
6,212,946 172,647 15,328,180 43,570,121 54,425,406,960
6,212,946 166,461 14,561,666 36,103,859 54,425,406,960
10,326,243 236,958 30,682,291 77,424,503 90,457,888,680
10,326,243 227,883 29,414,607 64,028,521 90,457,888,680
10,520,087 228,415 29,813,908 59,041,000 92,155,962,120
10,520,087 225,728 29,305,502 56,421,959 92,155,962,120
10,660,339 248,987 31,338,135 104,740,011 93,384,569,640
10,660,339 234,206 29,620,644 79,619,951 93,384,569,640
510,208 42,137 4,678,221 6,789,003 4,469,422,080
3,829,690 40,882 8,099,147 11,025,614 33,548,084,400
170,467 3,713 4,113,624 5,314,270 1,493,290,920
122,049 2,826 839,078 706,115 1,069,149,240
61,192 571 640,714 723,712 536,041,920
532,925 13,818 2,913,019 3,597,344 4,668,423,000
(A) =
(C) = INDEX OF RELIABILITY: 1 - (A)/(B)
2013 0.999229
SUMMATION OF THE NUMBER OF CUSTOMERS x RESTORATION TIME IN HOURS OF EACH INTERRUPTION
(B) = TWELVE MONTH AVERAGE NUMBER OF CUSTOMERS x 8,760 HOURS (ONE YEAR)
2010 0.996441
2011 0.999340
2012 0.998650
INTERNATIONAL UTILITIES IN 2013
2008 0.998481
2009 0.999671
2013 0.998878
2013** 0.999147
** Excludes Significant Events (see Appendix D)
2011** 0.999292
2012 0.999359
2012** 0.999388
2010 0.999200
2010** 0.999337
2011 0.999144
2008 0.999023
2008** 0.999297
2009 0.999394
IT EQUALS THE PER UNIT ANNUAL CUSTOMER-HOURS THAT SERVICE IS AVAILABLE.
CANADIAN UTILITIES IN 2013
(C)
YEARINDEX OF
RELIABILITY
TABLE 7-1 (REGION 2)SUMMARY OF INTERRUPTION DATA
(Including Derivation of Index of Reliability)
FOR YEARS 2008 - 2013
THE "INDEX OF RELIABILITY" IS A MEASURE OF SERVICE RELIABILITY.
Composite Non-Confidential Report 50

SAIFI SAIDI CHIKM CIKM
NUMBER % NUMBER % NUMBER % (HRS)
30,498 12.2 4,500,802 14.4 10,794,564 10.3 0.42 1.01 11.00 5.0027,656 12.1 4,068,923 13.6 5,991,845 10.1 0.39 0.57 6.00 4.0023,613 11.4 3,232,914 13.3 5,941,898 9.4 0.37 0.68 7.00 4.00
43,762 17.6 2,071,138 6.6 7,356,877 7.0 0.19 0.69 8.00 2.0047,787 20.9 2,619,276 8.8 5,929,144 10.0 0.25 0.56 6.00 3.0038,202 18.5 2,313,210 9.5 5,583,073 8.8 0.26 0.64 7.00 3.00
7,319 2.9 8,036,960 25.6 8,560,478 8.2 0.75 0.80 9.00 8.006,603 2.9 8,499,736 28.5 6,810,899 11.5 0.81 0.65 7.00 9.004,960 2.4 5,856,513 24.2 6,190,857 9.8 0.67 0.71 8.00 7.00
55,490 22.3 6,740,757 21.5 47,475,586 45.3 0.63 4.45 49.00 7.0037,562 16.4 4,962,372 16.6 18,205,840 30.8 0.47 1.73 19.00 5.0038,013 18.4 4,593,758 18.9 24,500,311 38.6 0.52 2.80 30.00 6.00
13,554 5.4 694,028 2.2 1,884,231 1.8 0.07 0.18 2.00 1.0013,820 6.1 896,863 3.0 1,575,180 2.7 0.09 0.15 2.00 1.0014,230 6.9 675,805 2.8 1,484,204 2.3 0.08 0.17 2.00 1.00
48,542 19.5 4,613,368 14.7 15,370,614 14.7 0.43 1.44 16.00 5.0042,392 18.6 4,153,797 13.9 9,204,941 15.6 0.39 0.87 9.00 4.0039,405 19.1 3,711,080 15.3 9,677,556 15.3 0.42 1.10 12.00 5.00
9,572 3.8 1,655,024 5.3 6,638,364 6.3 0.16 0.62 7.00 2.0011,996 5.3 1,487,385 5.0 5,815,649 9.9 0.14 0.55 6.00 0.0011,247 5.4 1,312,781 5.4 5,083,534 8.0 0.15 0.58 7.00 2.00
5,091 2.0 627,520 2.0 1,834,762 1.8 0.06 0.17 2.00 1.005,063 2.2 769,214 2.6 1,263,533 2.1 0.07 0.12 1.00 1.004,769 2.3 506,502 2.1 1,183,290 1.9 0.06 0.14 1.00 1.00
3,182 1.3 557,204 1.8 759,547 0.7 0.05 0.07 1.00 1.002,526 1.1 430,615 1.4 448,784 0.8 0.04 0.04 0.00 0.002,513 1.2 425,779 1.8 518,836 0.8 0.05 0.06 1.00 0.00
31,977 12.8 1,841,334 5.9 4,064,988 3.9 0.17 0.38 4.00 2.0033,010 14.5 1,925,727 6.5 3,795,185 6.4 0.18 0.36 4.00 2.0029,894 14.5 1,619,392 6.7 3,263,801 5.1 0.18 0.37 4.00 2.00
248,987 100.0 31,338,135 100.0 104,740,011 100.0 2.94 9.83 109.0 32.00228,415 100.0 29,813,908 100.0 59,041,000 100.0 2.83 5.61 61.00 31.00206,846 100.0 24,247,736 100.0 63,427,358 100.0 2.77 7.24 80.00 31.00
2013 3.342012 1.985 YEAR AVERAGE 2.62
2012 1.975 YEAR AVERAGE 2.02Total
5 YEAR AVERAGE 1.22Foreign Interference2013 2.21
Human Element2013 1.362012 1.04
2013 2.922012 1.645 YEAR AVERAGE 2.34
2012 3.915 YEAR AVERAGE 3.87Adverse Environment
5 YEAR AVERAGE 2.61Adverse Weather2013 4.01
Equipment Failure2013 3.332012 2.22
2013 2.712012 1.765 YEAR AVERAGE 2.20
2012 3.675 YEAR AVERAGE 5.33Lightning
5 YEAR AVERAGE 1.06Tree Contacts2013 7.04
Loss of Supply2013 1.072012 0.80
2013 3.552012 2.265 YEAR AVERAGE 2.41
2012 1.475 YEAR AVERAGE 1.84Scheduled Outage
(HRS)Unknown2013 2.40
10,520,087 CUSTOMERS IN 2012
PRIMARY CAUSENUMBER OF
INTERRUPTIONSCUSTOMER
INTERRUPTIONSCUSTOMER HOUR INTERRUPTIONS CAIDI
TABLE 7-2 (REGION 2)SYSTEM CAUSES OF SERVICE INTERRUPTIONS
FOR YEAR 2013Canadian 10,660,339 CUSTOMERS IN 2013
Composite Non-Confidential Report 51
CEA-Service Continuity: Analysis by Quartile Graph (2009 to 2013)
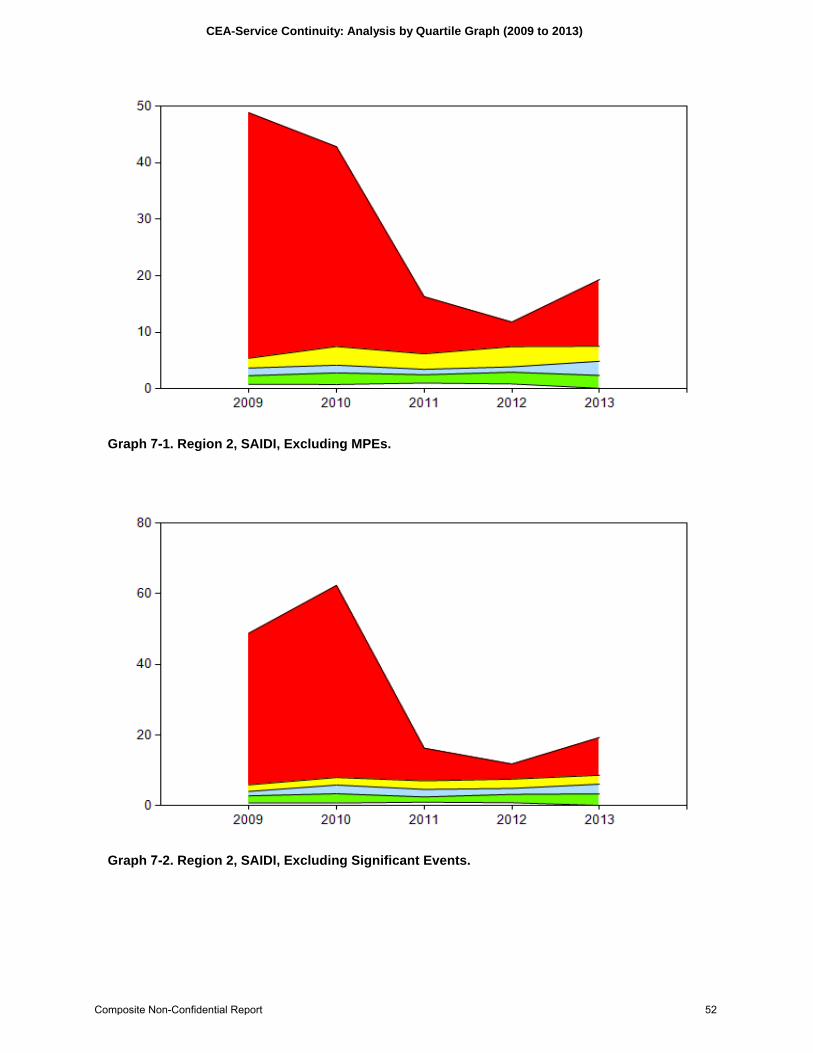
Graph 7-1. Region 2, SAIDI, Excluding MPEs.
Graph 7-2. Region 2, SAIDI, Excluding Significant Events.
Composite Non-Confidential Report 52

CEA-Service Continuity: Analysis by Quartile Graph (2009 to 2013)
Graph 7-3. Region 2, SAIDI, Including All Events.
Graph 7-4. Region 2, CAIDI, Excluding MPEs.
Composite Non-Confidential Report 53
CEA-Service Continuity: Analysis by Quartile Graph (2009 to 2013)
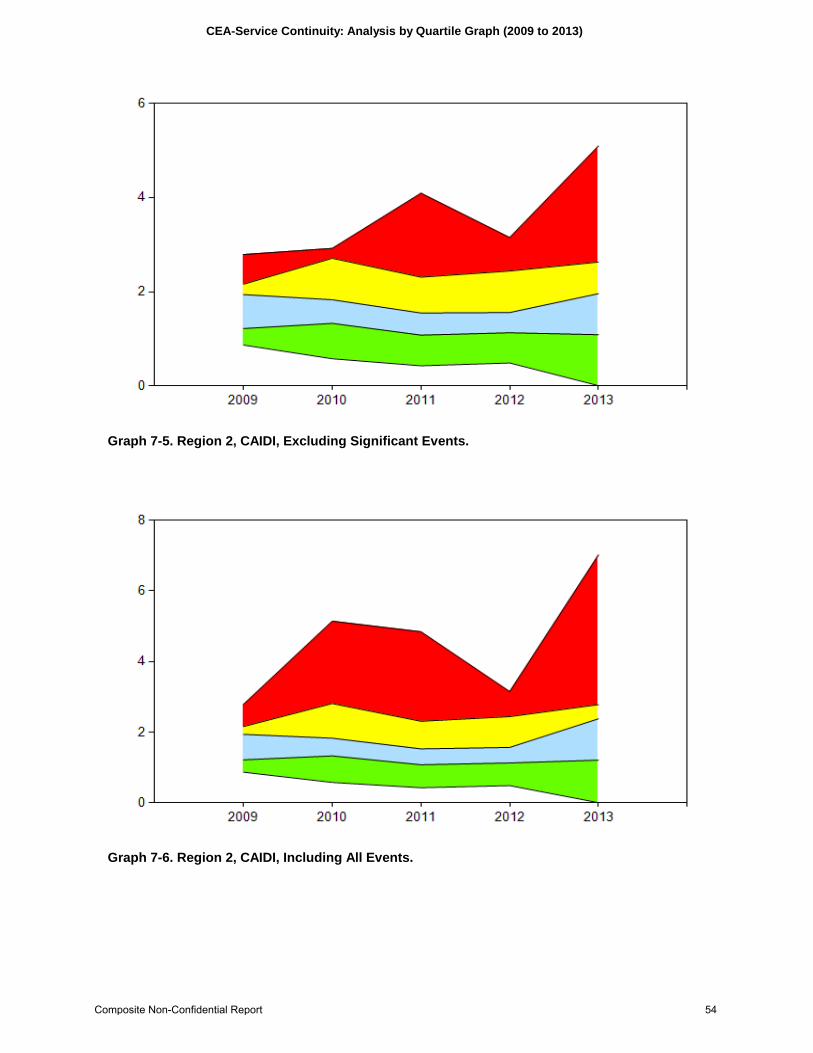
Graph 7-5. Region 2, CAIDI, Excluding Significant Events.
Graph 7-6. Region 2, CAIDI, Including All Events.
Composite Non-Confidential Report 54
CEA-Service Continuity: Analysis by Quartile Graph (2009 to 2013)
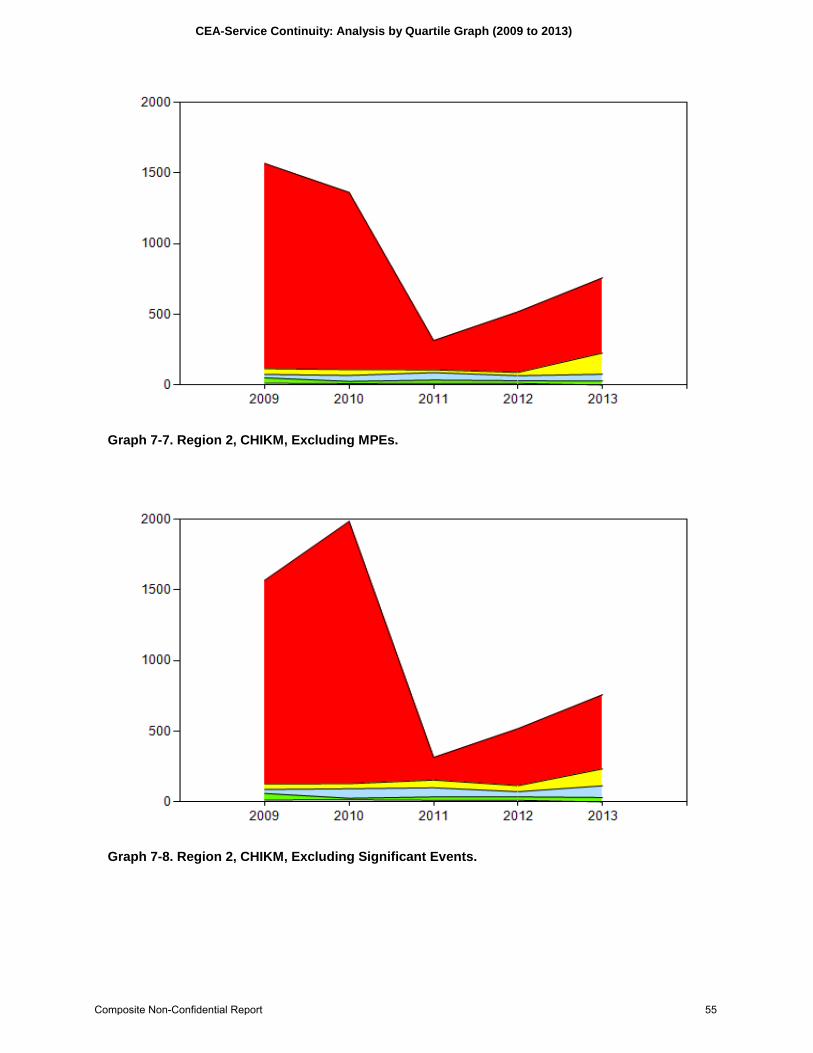
Graph 7-7. Region 2, CHIKM, Excluding MPEs.
Graph 7-8. Region 2, CHIKM, Excluding Significant Events.
Composite Non-Confidential Report 55
CEA-Service Continuity: Analysis by Quartile Graph (2009 to 2013)
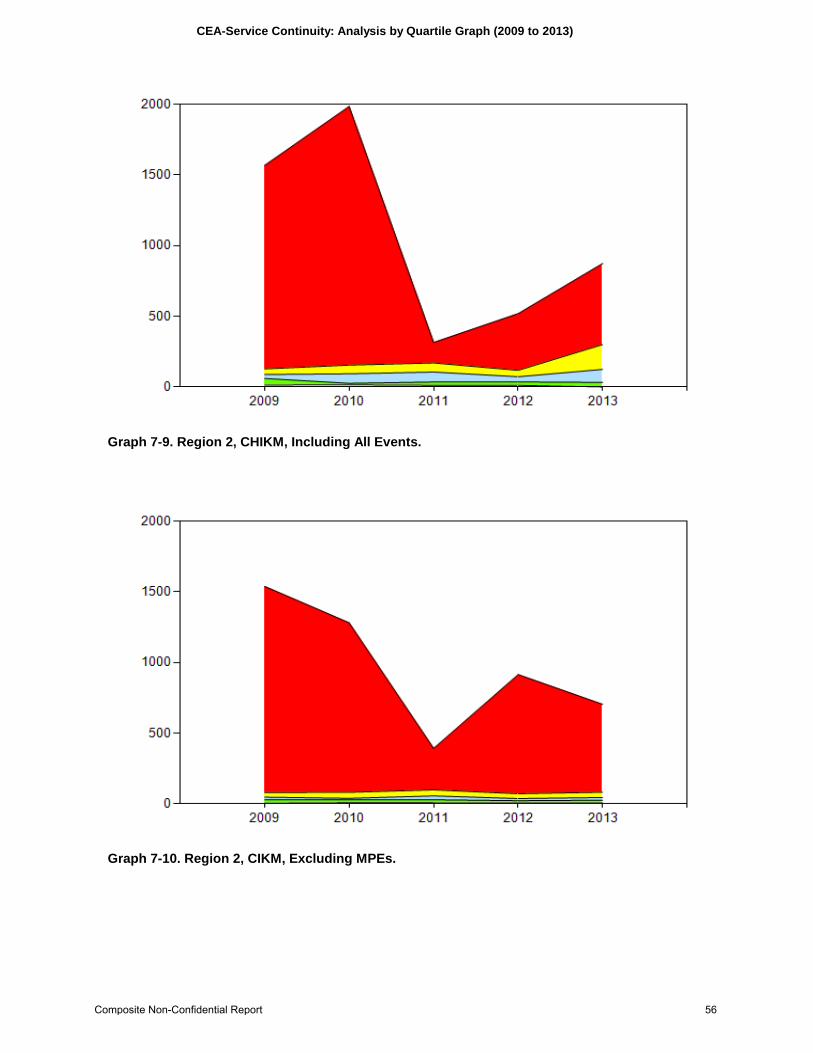
Graph 7-9. Region 2, CHIKM, Including All Events.
Graph 7-10. Region 2, CIKM, Excluding MPEs.
Composite Non-Confidential Report 56

CEA-Service Continuity: Analysis by Quartile Graph (2009 to 2013)
Graph 7-11. Region 2, CIKM, Excluding Significant Events.
Graph 7-12. Region 2, CIKM, Including All Events.
Composite Non-Confidential Report 57

CEA-Service Continuity: Analysis by Quartile Graph (2009 to 2013)
Graph 7-13. Region 2, SAIFI, Excluding MPEs.
Graph 7-14. Region 2, SAIFI, Excluding Significant Events.
Composite Non-Confidential Report 58

CEA-Service Continuity: Analysis by Quartile Graph (2009 to 2013)
Graph 7-15. SAIFI, Including All Events.
Composite Non-Confidential Report 59
8.0 SYSTEM INDICES FOR REGIONS
Composite Non-Confidential Report 60

System Average Interruption Duration Index
8.0 SYSTEM INDICES FOR REGIONS
Graph 8.1 below shows the variations in the services indices of SAIFI, SAIDI, CAIDI, the Index of Reliability, CHIKM, CIKM for 2013 total Canadian and International data and by regions.
SAIFISystem Average Interruption Frequency Index
SAIDI
Composite Non-Confidential Report 61
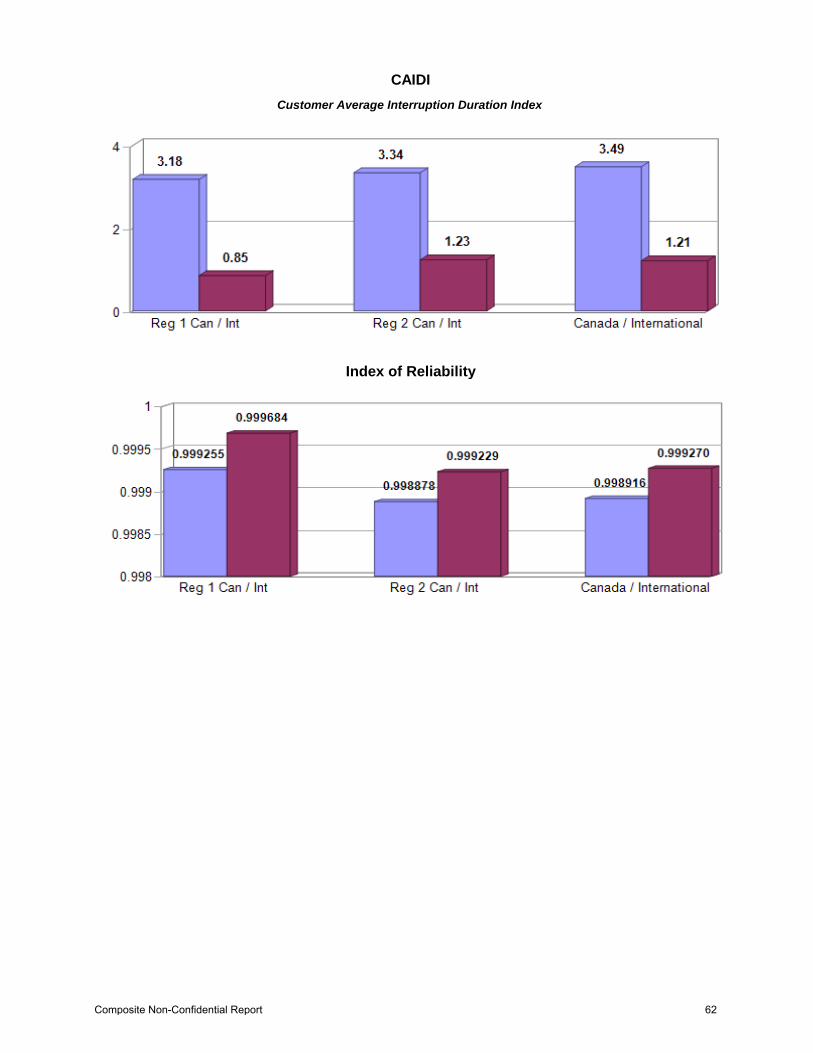
CAIDICustomer Average Interruption Duration Index
Index of Reliability
Composite Non-Confidential Report 62
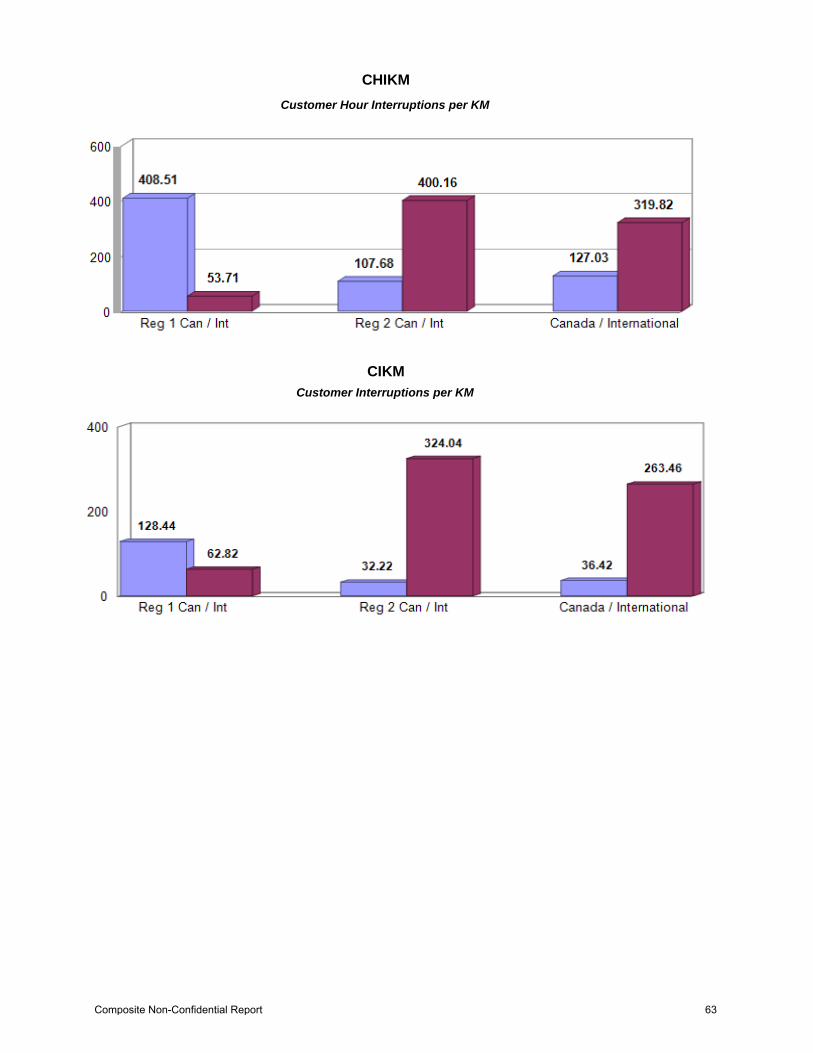
CHIKMCustomer Hour Interruptions per KM
CIKMCustomer Interruptions per KM
Composite Non-Confidential Report 63


![Complementary Lipschitz continuity results for the …arXiv:1810.10859v2 [stat.OT] 16 Apr 2019 Complementary Lipschitz continuity results for the distribution of intersections or unions](https://static.fdocuments.in/doc/165x107/5e995863aede2370a254fa09/complementary-lipschitz-continuity-results-for-the-arxiv181010859v2-statot.jpg)