
Service Concepts for DC Fast Chargingpublications.lib.chalmers.se/records/fulltext/145808.pdf ·...
184
Service Concepts for DC Fast Charging A master thesis for ABB Switzerland DAVID GUSTAFSSON Department of Technology Management and Economics Division of Operations Management CHALMERS UNIVERSITY OF TECHNOLOGY Göteborg, Sweden, 2011 Report No. E2011:021
Transcript of Service Concepts for DC Fast Chargingpublications.lib.chalmers.se/records/fulltext/145808.pdf ·...
Service Concepts for DC Fast Charging A master thesis for ABB Switzerland
DAVID GUSTAFSSON
Department of Technology Management and Economics
Division of Operations Management
CHALMERS UNIVERSITY OF TECHNOLOGY
Göteborg, Sweden, 2011
Report No. E2011:021

i
MASTER’S THESIS E2011:021
Service Concepts for DC Fast Charging A master thesis for ABB Switzerland
DAVID GUSTAFSSON
Tutor, Chalmers: Lars Trygg
Tutors, ABB: Fredrik Lidén and Cal Lankton
Department of Technology Management and Economics
Division of Operations Management
CHALMERS UNIVERSITY OF TECHNOLOGY
Göteborg, Sweden 2011

ii
Service Concepts for DC-fast Charging, ABB
DAVID GUSTAFSSON
© TOMAS DAVID EMANUEL GUSTAFSSON (2011)
Department of Technology Management and Economics
Division of Operations Management
Chalmers University of Technology
SE-412 96 Göteborg, Sweden
Telephone: + 46 (0)31-772 1000
Cover:
Figure 1. ABB Charging station prototype design of the so called “slim pole” (ABB
marketing material).
Chalmers Reposervice
Göteborg, Sweden 2011.

iii
ACKNOWLEDGEMENTS
This master thesis has been written for Chalmers University of Technology, Sweden, and
ABB ATP eMobility, Switzerland. The master thesis is the end of a Master of Science within
Quality and Operations Management (300 Hp). However, it is also the start of my future
working life. I have been part of ABB’s development team for five months. It has been a great
adventure. I have gotten to know many amazing people and kick-started a future career. The
eMobility field touches on many areas that interest me personally. Two examples are business
development and the environment. Electric mobility will hopefully develop within the next
years to be part of the solution to the environmental problem originating from oil dependency.
I would like to express my sincere gratitude to ABB Switzerland and my managers Johan-
Petter Victorin and Tanja Vainio for giving me the opportunity to undertake this project. My
supervisors Fredrik Lidén (ABB), Cal Lankton (ABB) and Lars Trygg (Chalmers) also
deserve my greatest thanks for supporting me during my work. The same is also true for my
friends and colleagues Sofia Karlsson (colleague), Karl Wackerberg (colleague) and Sofia
Eklund (future colleague); thanks for your continuous inspiration and support with the
improvement of my report.
The thesis is based on empirical data and interviews with companies’ current or possible
future interest in eMobility. Many thanks to ICA Fastigheter, Vattenfall, EON, Fortum, Nuon,
EKZ, KF Fastigheter, Statoil, Preem, Move About, Swedavia Arlanda, Taxi 020, Gatubolaget
Göteborg, Parkeringsbolaget Göteborg, Göteborg Energi, Amsterdam, ABB’s local offices,
Ericsson, Eskilstuna Energi och Miljö and Project Test Site Sweden, for your support and
cooperation.
Din EL Miljöfond and Miljöfonden (Sveriges Ingenjörer) have sponsored my work and living
in Switzerland. For this I am greatly thankful.
Finally, I would like to thank the eMobility team and my stakeholders including Cal Lankton
(US), Tanja Vainio (FI), Fredrik Lidén (SE), Johan-Petter Victorin (SE), Fabian Hess (GE),
Nick Butcher (NZ), Irina Kurdina (RU), Micha Gilomen (CH), Mark Knechtle (GE) and
Christin Morf (CH) for your support. Good luck with the future product launches and service
development!
2011-06-10, Turgi, Switzerland
iv
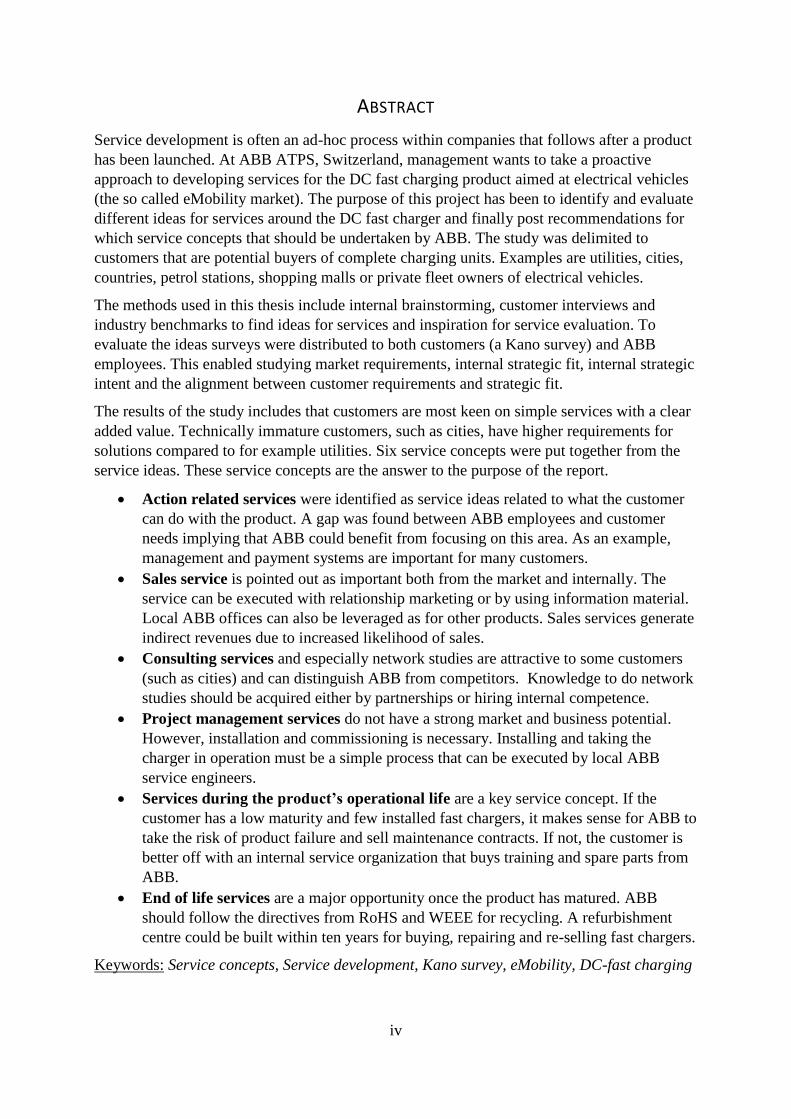
ABSTRACT
Service development is often an ad-hoc process within companies that follows after a product
has been launched. At ABB ATPS, Switzerland, management wants to take a proactive
approach to developing services for the DC fast charging product aimed at electrical vehicles
(the so called eMobility market). The purpose of this project has been to identify and evaluate
different ideas for services around the DC fast charger and finally post recommendations for
which service concepts that should be undertaken by ABB. The study was delimited to
customers that are potential buyers of complete charging units. Examples are utilities, cities,
countries, petrol stations, shopping malls or private fleet owners of electrical vehicles.
The methods used in this thesis include internal brainstorming, customer interviews and
industry benchmarks to find ideas for services and inspiration for service evaluation. To
evaluate the ideas surveys were distributed to both customers (a Kano survey) and ABB
employees. This enabled studying market requirements, internal strategic fit, internal strategic
intent and the alignment between customer requirements and strategic fit.
The results of the study includes that customers are most keen on simple services with a clear
added value. Technically immature customers, such as cities, have higher requirements for
solutions compared to for example utilities. Six service concepts were put together from the
service ideas. These service concepts are the answer to the purpose of the report.
Action related services were identified as service ideas related to what the customer
can do with the product. A gap was found between ABB employees and customer
needs implying that ABB could benefit from focusing on this area. As an example,
management and payment systems are important for many customers.
Sales service is pointed out as important both from the market and internally. The
service can be executed with relationship marketing or by using information material.
Local ABB offices can also be leveraged as for other products. Sales services generate
indirect revenues due to increased likelihood of sales.
Consulting services and especially network studies are attractive to some customers
(such as cities) and can distinguish ABB from competitors. Knowledge to do network
studies should be acquired either by partnerships or hiring internal competence.
Project management services do not have a strong market and business potential.
However, installation and commissioning is necessary. Installing and taking the
charger in operation must be a simple process that can be executed by local ABB
service engineers.
Services during the product’s operational life are a key service concept. If the
customer has a low maturity and few installed fast chargers, it makes sense for ABB to
take the risk of product failure and sell maintenance contracts. If not, the customer is
better off with an internal service organization that buys training and spare parts from
ABB.
End of life services are a major opportunity once the product has matured. ABB
should follow the directives from RoHS and WEEE for recycling. A refurbishment
centre could be built within ten years for buying, repairing and re-selling fast chargers.
Keywords: Service concepts, Service development, Kano survey, eMobility, DC-fast charging

v
SAMMANFATTNING
Tjänsteutveckling är ofta en oplanerad aktivitet i många företag som sker efter att en produkt
har lanserats på marknaden. ABB ATPS, Schweiz, vill dock arbeta proaktivt med
serviceutveckling för snabbladdaren över likström som utvecklas för elbilar (eMobility).
Syftet med exjobbet var att utveckla och utvärdera olika serviceidéer för att slutligen
rekommendera de servicekoncept som ABB skulle kunna erbjuda. Kunder inkluderar de
företag som kan tänka sig att äga en snabbladdningsenhet för elbilar. Exempel är nätbolag,
städer, länder, bensinstationer, köpcenters och ägare av privata elbilsflottor.
Intern brainstorming, kundintervjuer och benchmarks har gjorts för att generera idéer och
inspiration. För utvärdering av idéerna har två enkäter genomförts, en intern inom ABB och
en extern till kunder. Förutom att mäta de två gruppnas åsikter kunde även passningen mellan
dem utvärderas och besvara frågan om kunder och anställda prioriterar samma idéer.
Resultatet visar att kunderna är ute efter enkla tjänsteidéer med ett tydligt direkt värde. Det
går också att se skillnader mellan olika kunder beroende på teknisk och servicemässig
mognad. Städer efterfrågar till exempel ett bredare åtagande från leverantören än elbolag.
Följande tjänstekoncept besvarar rapportens syfte:
Användningsrelaterade tjänster anses mer attraktiva av kunden jämfört med hur de
värderas av ABB-anställda. Ett styrsystem, statistikverktyg samt betalningssystem är
viktiga produktegenskaper som enligt kunderna bör finnas. Övriga kringtjänster var
inte speciellt intressanta. Detta är framförallt viktigt att tänka på i produktutveckling.
Säljtjänst – En säljtjänst efterfrågas från både kunder och internt. Säljtjänsten bör
differentiera mellan olika kundsegment beroende på mognad och projektstorlek. Att
bygga kundrelationer via lokala ABB-kontor bör utnyttjas. Dessutom bör
informationsmaterial skapas.
Konsulttjänst – Nätstudier är attraktivt för vissa kunder och skulle kunna differentiera
ABB. Tjänsten kan levereras via partnerskap eller genom att skaffa kunskap internt.
Installation och överlämnande har dålig lönsamhet men bör av juridiska anledningar
tillhandahållas. Tjänsten bör kostnadsoptimeras och utföras av lokala ABB kontor.
Underhållstjänster identifierades som viktiga av kunder och internt. Att göra
underhåll åt kunden är relevant när kunden har få snabbladdare och/eller en omogen
organisation. Omvänt, bör kunden ha en egen underhållsorganisation och köpa
reservdelar och träning från ABB. Totalt årligt underhåll motsvarar ungefär 8% av
hårdvarukostnaden på $20’000. Utryckningstjänster motsvarar 85% av det årliga
underhållet. Aktuella reservdelar är till största delen inte ABB tillverkade (86%).
Därför är bruttomarginalen för reservdelar relativt låg.
Tjänster efter uttjänande är attraktiva för kunderna och av lönsamhetsskäl. Tjänsten
bör tillhandahållas först om tio år. Ett renoveringscenter bör då skapas för gamla
komponenter och snabbladdare, atervinning bör också göras och WEEE och RoHS bör
tas i beaktande. Lönsamhet kan förväntas på grund av högt råvaruinnehåll.
Nyckelord: Tjänstekoncept, tjänsteutveckling, Kano-enkät, eMobility, DC-snabbladdning
vi
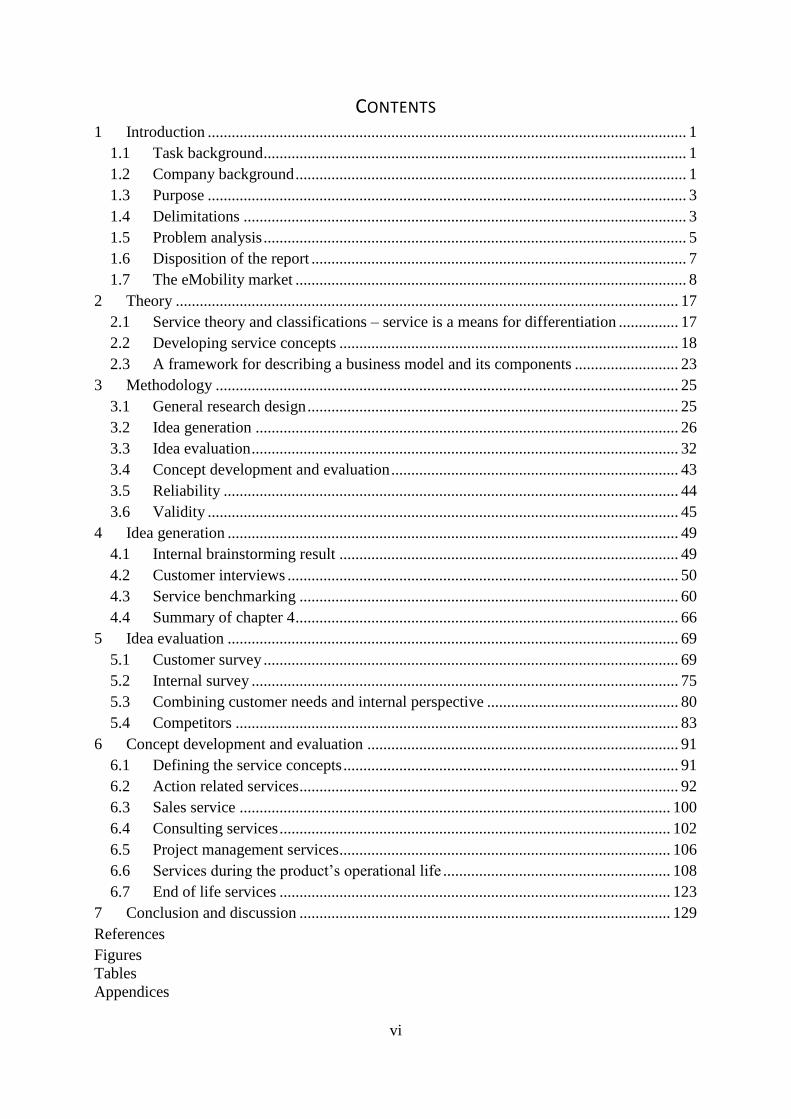
CONTENTS
1 Introduction ........................................................................................................................ 1
1.1 Task background .......................................................................................................... 1
1.2 Company background .................................................................................................. 1
1.3 Purpose ........................................................................................................................ 3
1.4 Delimitations ............................................................................................................... 3
1.5 Problem analysis .......................................................................................................... 5
1.6 Disposition of the report .............................................................................................. 7
1.7 The eMobility market .................................................................................................. 8
2 Theory .............................................................................................................................. 17
2.1 Service theory and classifications – service is a means for differentiation ............... 17
2.2 Developing service concepts ..................................................................................... 18
2.3 A framework for describing a business model and its components .......................... 23
3 Methodology .................................................................................................................... 25
3.1 General research design ............................................................................................. 25
3.2 Idea generation .......................................................................................................... 26
3.3 Idea evaluation ........................................................................................................... 32
3.4 Concept development and evaluation ........................................................................ 43
3.5 Reliability .................................................................................................................. 44
3.6 Validity ...................................................................................................................... 45
4 Idea generation ................................................................................................................. 49
4.1 Internal brainstorming result ..................................................................................... 49
4.2 Customer interviews .................................................................................................. 50
4.3 Service benchmarking ............................................................................................... 60
4.4 Summary of chapter 4 ................................................................................................ 66
5 Idea evaluation ................................................................................................................. 69
5.1 Customer survey ........................................................................................................ 69
5.2 Internal survey ........................................................................................................... 75
5.3 Combining customer needs and internal perspective ................................................ 80
5.4 Competitors ............................................................................................................... 83
6 Concept development and evaluation .............................................................................. 91
6.1 Defining the service concepts .................................................................................... 91
6.2 Action related services ............................................................................................... 92
6.3 Sales service ............................................................................................................ 100
6.4 Consulting services .................................................................................................. 102
6.5 Project management services ................................................................................... 106
6.6 Services during the product’s operational life ......................................................... 108
6.7 End of life services .................................................................................................. 123
7 Conclusion and discussion ............................................................................................. 129
References
Figures
Tables
Appendices
vii
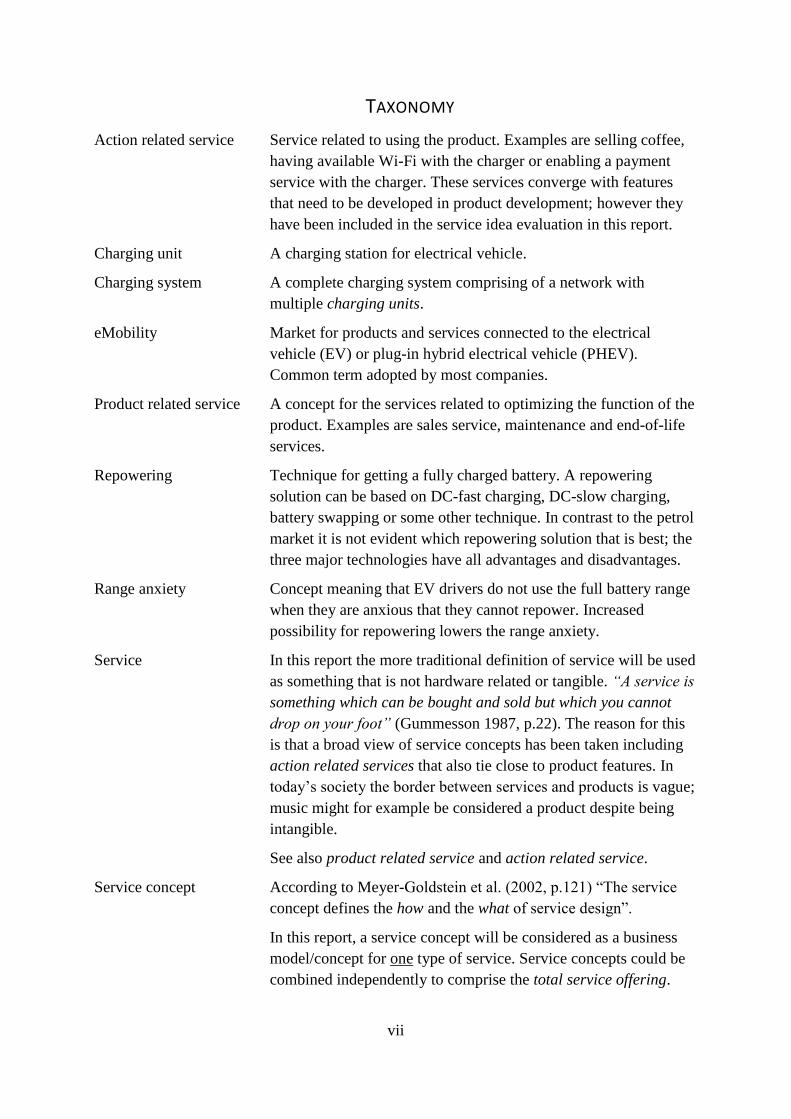
TAXONOMY
Action related service Service related to using the product. Examples are selling coffee,
having available Wi-Fi with the charger or enabling a payment
service with the charger. These services converge with features
that need to be developed in product development; however they
have been included in the service idea evaluation in this report.
Charging unit A charging station for electrical vehicle.
Charging system A complete charging system comprising of a network with
multiple charging units.
eMobility Market for products and services connected to the electrical
vehicle (EV) or plug-in hybrid electrical vehicle (PHEV).
Common term adopted by most companies.
Product related service A concept for the services related to optimizing the function of the
product. Examples are sales service, maintenance and end-of-life
services.
Repowering Technique for getting a fully charged battery. A repowering
solution can be based on DC-fast charging, DC-slow charging,
battery swapping or some other technique. In contrast to the petrol
market it is not evident which repowering solution that is best; the
three major technologies have all advantages and disadvantages.
Range anxiety Concept meaning that EV drivers do not use the full battery range
when they are anxious that they cannot repower. Increased
possibility for repowering lowers the range anxiety.
Service In this report the more traditional definition of service will be used
as something that is not hardware related or tangible. “A service is
something which can be bought and sold but which you cannot
drop on your foot” (Gummesson 1987, p.22). The reason for this
is that a broad view of service concepts has been taken including
action related services that also tie close to product features. In
today’s society the border between services and products is vague;
music might for example be considered a product despite being
intangible.
See also product related service and action related service.
Service concept According to Meyer-Goldstein et al. (2002, p.121) “The service
concept defines the how and the what of service design”.
In this report, a service concept will be considered as a business
model/concept for one type of service. Service concepts could be
combined independently to comprise the total service offering.

viii
Service contract A service agreement setup between a hardware owner and a
service organization. If nothing is specified this report defines a
service contract as a contract where the supplier’s service
organization guarantees certain performance in exchange for a
recurring revenue stream. Normally this means guaranteeing
uptime or response time to accidents (break down risk taken by
service organization) but it could also mean a spare part agreement
(break down risk taken by customer).
Total service offering A set of service concepts that comprise a company’s offering in a
certain market.
ix
ABBREVIATIONS
AC Alternating Current
API Application Programming Interface
B2B Business to Business
B2C Business to Consumer
DC Direct Current
DB Data Base
EOL End Of Life
EV Electrical Vehicle
GPRS General Packet Radio Service
HW Hardware
IB Installed Base
IO Input-Output
IP Intellectual Property
KPI Key Performance Indicator
MTBF Mean Time Between Failure
MTTR Mean Time To Repair
TTR Time To Repair
PEV Plug-in Electric Vehicle
PHEV Plug-in Hybrid Electric Vehicle
PRS Product Requirement Specification
PV Petrol Vehicle
QFD Quality Function Deployment
RFID Radio Frequency Identification System
RoHS Restriction of Hazardous Substances
SLA Service Level Agreement
SW Software
WEEE Waste Electrical and Electronic Equipment

Service concepts for DC Fast Charging
1 (132)
1 INTRODUCTION
This section presents the background to why the project is conducted. It also defines the
specific purpose and the research questions that are based on the purpose.
1.1 TASK BACKGROUND
One of today’s macro trends in business is that service tends to be a higher part of
manufacturing companies’ revenues. The percentage of people employed in the service sector
as well as the percentage of GDP resulting from services has increased over the past decades
in industrialized countries (Grönroos 2007).
The reasons for an increased focus on services are many and they can, according to Nutek
(2008), be grouped into financial and market benefits. Financially, services often bring higher
margins, increased revenues and are less risky than core product sales. One reason for the
financial benefits is the market benefits that include better differentiation which lead to
competitive advantage. Customer relationships that are built from services increase the
chances of future sales and contribute to an increased understanding of customer needs (ibid).
Even though services have gained increased recognition, few companies lack a service
structured development process. Product development processes have been explored by
researchers and are nowadays part of every company. So called stage gate models are used for
structuring the development from idea to product launch (Wheelwright & Clark 1992).
However, the processes used for new service development are to a much greater extent ad hoc
or/and not existing in industry. Of the companies studied by Tekes (2003), none had a
specified service development process.
The thesis is supported by ABB ATPS, which is the service department within ABB Power
Electronics and Medium Voltage Drives in Turgi, Switzerland (ATP). The study is the start of
a process where ABB ATPS aims to take control over service development. The department
wants to have a proactive approach to development and define what is required to be a market
leader in services for the DC fast charging product at an early stage of development. This
approach to service development is pioneering within ABB and for many reasons also within
industry in general. The results of this project might stimulate an increased focus of proactive
service development; both within industry and within ABB.
1.2 COMPANY BACKGROUND
ABB is a global supplier of power and automation technologies. The product offer is
diversified and covers power products, power systems, discrete automation and motion, low
voltage products and process automation. The ABB group operates in around 100 countries
and has about 117,000 employees. ABB’s vision and tag line is “Power and productivity for a
better world” (ABB 2011a). The core of this business concept is that ABB is building
Service concepts for DC Fast Charging
2 (132)
products that help customers run their businesses more efficiently, with a higher output and
quality.
ABB has headquarters in Switzerland. The company was created when Swedish ASEA
merged with Swiss Brown Broveri in 1988. ABB Group had revenues of $32b in 2009 and
spent the same year $1b on R&D. By investing in R&D, the company aims to continue a
history of leading the development within power and automation (ABB 2010a).
ABB ATPS is organized within the Power Electronics and Medium Voltage Drives business
unit. Power Electronics makes products for converting between AC/DC current for mid- and
low voltage applications. Medium Voltage Drives uses the same core technology for varying
frequency of a current (going from AC to DC and back from DC to AC with a new frequency)
in the 315kW to 100MW segment. This is used as an electrical gear box in for example trains
and large ships since the frequency is directly proportionate to the speed of a motor (ABB
2010b).
eMobility is a new emerging market where ABB ATP aims to be a key player. With a history
of supplying power products, such as AC/DC-converters, power electronics and drives, the
company has the fundamental knowledge of the technology in the eMobility market. ABB
ATP in Turgi, Switzerland, is in this stage developing products and capability to enter the
charging equipment market for electrical vehicles (EV) and plug-in electrical vehicles (PEV).
First generation product releases are available for prototype installations but there is still work
to be done in development before the product is fully launched. A cost optimized mass
produced product is planned to be available in the beginning of year 2012.
Traditionally ABB ATP has been selling core products with a service offering limited to
installation, sales of spare parts and upgrades of existing installations (both replace and repair
solutions). Training and commissioning have also been part of the service offering. This
strategy has been appropriate for the market ABB is competing in, which has been adopting
the same business model for decades. However, what services that is wise to offer within
eMobility is not yet clear.
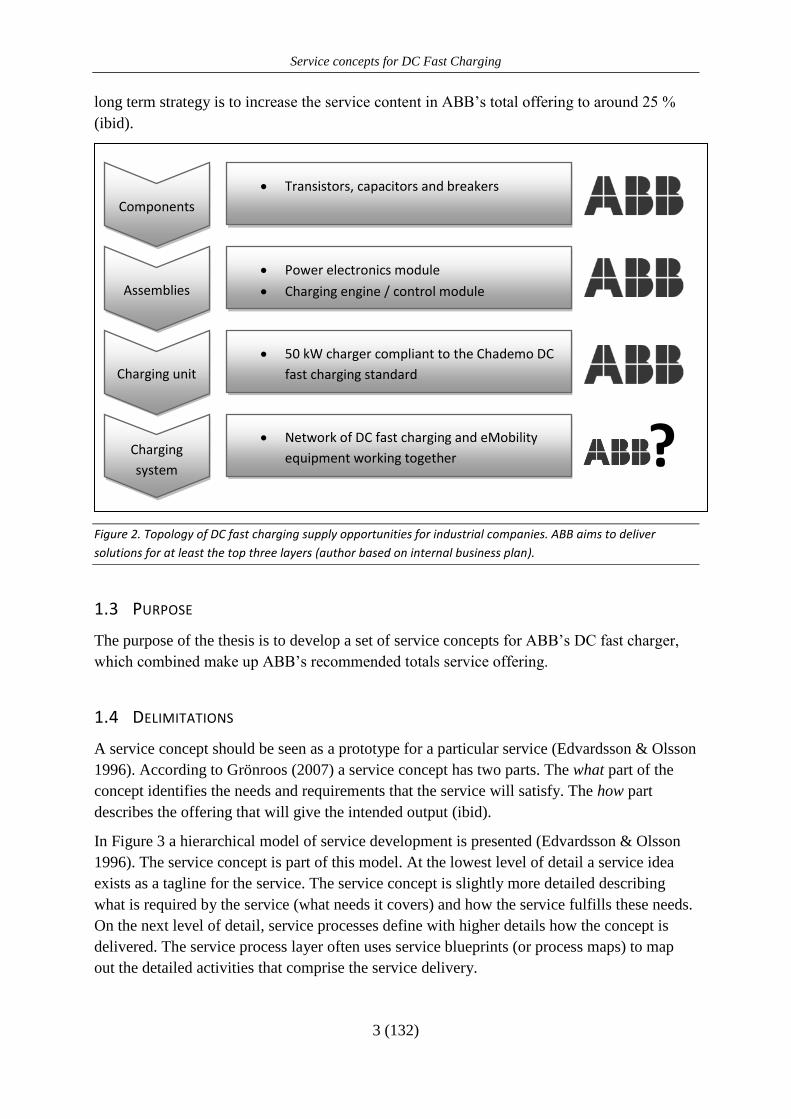
The current business plan suggests that ABB will enter the market as a business-to-business
(B2B) charging unit supplier. This implies that ABB will offer the core charging station
product but not own or operate a network of charging stations. However the core product
might be network enabled so that many charging units can work together in a system. ABB
will however not target the end users/consumers who drive electrical cars. The EV drivers are
targeted by one of ABB’s planned customer segments, the charging system owner. Apart from
charging system owners there are a range of potential customers. ABB will also deliver
assemblies (such as the charging engine or power electronics equipment) and sub components
(e.g. transistors) that will be part of charging units for other suppliers. Figure 2 illustrates the
DC fast charging value chain and where ABB aims to be positioned.
There is a belief among both the service (ATPS) and the business development (ATP)
departments that service has a great potential to be part of ABB’s final value proposition. In
the ABB Group, services accounted for 15.6 % of the total sales in 2009 (ABB 2010c). The
Service concepts for DC Fast Charging
3 (132)
long term strategy is to increase the service content in ABB’s total offering to around 25 %
(ibid).
Figure 2. Topology of DC fast charging supply opportunities for industrial companies. ABB aims to deliver
solutions for at least the top three layers (author based on internal business plan).
1.3 PURPOSE
The purpose of the thesis is to develop a set of service concepts for ABB’s DC fast charger,
which combined make up ABB’s recommended totals service offering.
1.4 DELIMITATIONS
A service concept should be seen as a prototype for a particular service (Edvardsson & Olsson
1996). According to Grönroos (2007) a service concept has two parts. The what part of the
concept identifies the needs and requirements that the service will satisfy. The how part
describes the offering that will give the intended output (ibid).
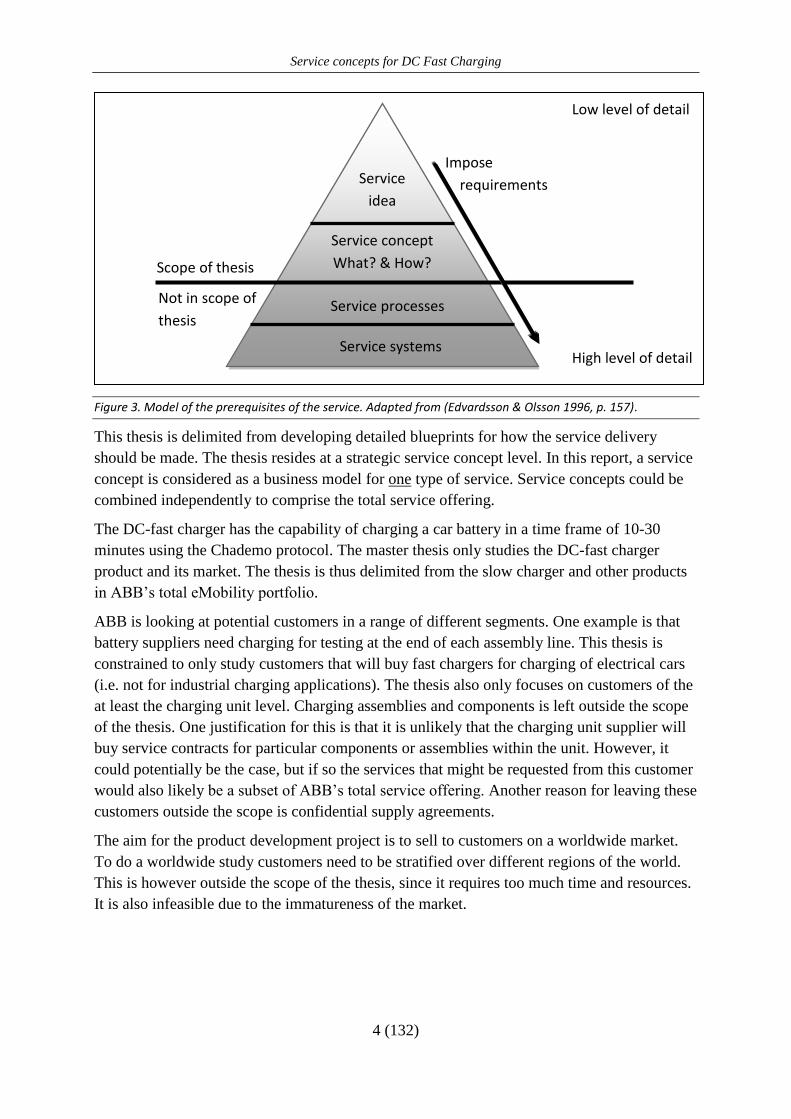
In Figure 3 a hierarchical model of service development is presented (Edvardsson & Olsson
1996). The service concept is part of this model. At the lowest level of detail a service idea
exists as a tagline for the service. The service concept is slightly more detailed describing
what is required by the service (what needs it covers) and how the service fulfills these needs.
On the next level of detail, service processes define with higher details how the concept is
delivered. The service process layer often uses service blueprints (or process maps) to map
out the detailed activities that comprise the service delivery.
Components
Assemblies
Charging unit
Charging
system
Transistors, capacitors and breakers
Power electronics module
Charging engine / control module
50 kW charger compliant to the Chademo DC
fast charging standard
Network of DC fast charging and eMobility
equipment working together ?
Service concepts for DC Fast Charging
4 (132)
Figure 3. Model of the prerequisites of the service. Adapted from (Edvardsson & Olsson 1996, p. 157).
This thesis is delimited from developing detailed blueprints for how the service delivery
should be made. The thesis resides at a strategic service concept level. In this report, a service
concept is considered as a business model for one type of service. Service concepts could be
combined independently to comprise the total service offering.
The DC-fast charger has the capability of charging a car battery in a time frame of 10-30
minutes using the Chademo protocol. The master thesis only studies the DC-fast charger
product and its market. The thesis is thus delimited from the slow charger and other products
in ABB’s total eMobility portfolio.
ABB is looking at potential customers in a range of different segments. One example is that
battery suppliers need charging for testing at the end of each assembly line. This thesis is
constrained to only study customers that will buy fast chargers for charging of electrical cars
(i.e. not for industrial charging applications). The thesis also only focuses on customers of the
at least the charging unit level. Charging assemblies and components is left outside the scope
of the thesis. One justification for this is that it is unlikely that the charging unit supplier will
buy service contracts for particular components or assemblies within the unit. However, it
could potentially be the case, but if so the services that might be requested from this customer
would also likely be a subset of ABB’s total service offering. Another reason for leaving these
customers outside the scope is confidential supply agreements.
The aim for the product development project is to sell to customers on a worldwide market.
To do a worldwide study customers need to be stratified over different regions of the world.
This is however outside the scope of the thesis, since it requires too much time and resources.
It is also infeasible due to the immatureness of the market.
Service concept
What? & How?
Service processes
Service systems
Service
idea
Impose
requirements
Scope of thesis
Not in scope of
thesis
High level of detail
Low level of detail
Service concepts for DC Fast Charging
5 (132)
1.5 PROBLEM ANALYSIS
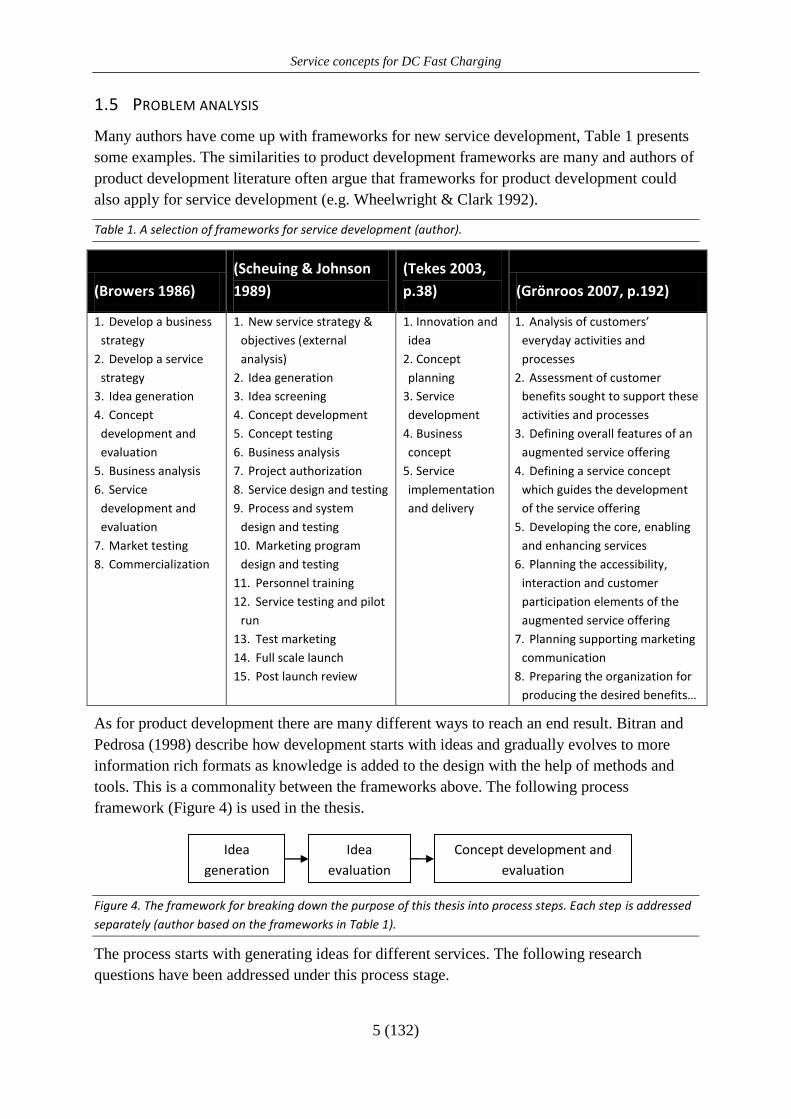
Many authors have come up with frameworks for new service development, Table 1 presents
some examples. The similarities to product development frameworks are many and authors of
product development literature often argue that frameworks for product development could
also apply for service development (e.g. Wheelwright & Clark 1992).
Table 1. A selection of frameworks for service development (author).
(Browers 1986)
(Scheuing & Johnson
1989)
(Tekes 2003,
p.38) (Grönroos 2007, p.192)
1. Develop a business
strategy
2. Develop a service
strategy
3. Idea generation
4. Concept
development and
evaluation
5. Business analysis
6. Service
development and
evaluation
7. Market testing
8. Commercialization
1. New service strategy &
objectives (external
analysis)
2. Idea generation
3. Idea screening
4. Concept development
5. Concept testing
6. Business analysis
7. Project authorization
8. Service design and testing
9. Process and system
design and testing
10. Marketing program
design and testing
11. Personnel training
12. Service testing and pilot
run
13. Test marketing
14. Full scale launch
15. Post launch review
1. Innovation and
idea
2. Concept
planning
3. Service
development
4. Business
concept
5. Service
implementation
and delivery
1. Analysis of customers’
everyday activities and
processes
2. Assessment of customer
benefits sought to support these
activities and processes
3. Defining overall features of an
augmented service offering
4. Defining a service concept
which guides the development
of the service offering
5. Developing the core, enabling
and enhancing services
6. Planning the accessibility,
interaction and customer
participation elements of the
augmented service offering
7. Planning supporting marketing
communication
8. Preparing the organization for
producing the desired benefits…
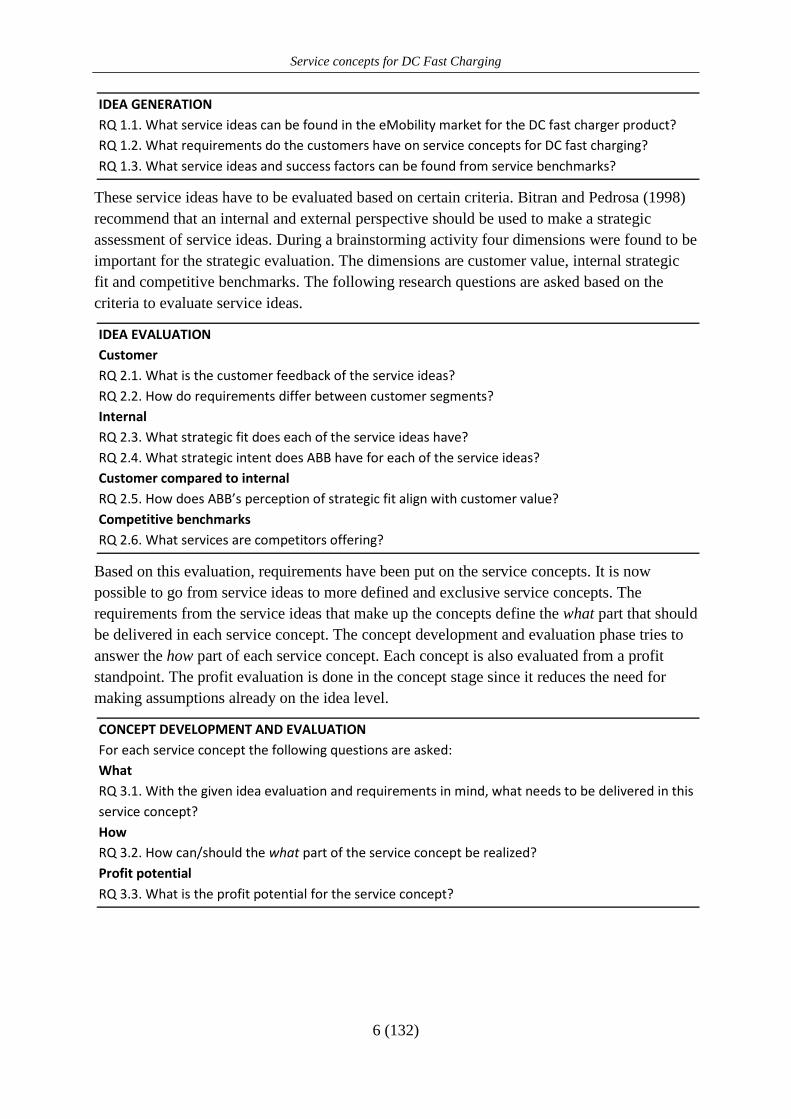
As for product development there are many different ways to reach an end result. Bitran and
Pedrosa (1998) describe how development starts with ideas and gradually evolves to more
information rich formats as knowledge is added to the design with the help of methods and
tools. This is a commonality between the frameworks above. The following process
framework (Figure 4) is used in the thesis.
Figure 4. The framework for breaking down the purpose of this thesis into process steps. Each step is addressed
separately (author based on the frameworks in Table 1).
The process starts with generating ideas for different services. The following research
questions have been addressed under this process stage.
Idea
generation
Idea
evaluation
Concept development and
evaluation
Service concepts for DC Fast Charging
6 (132)
IDEA GENERATION
RQ 1.1. What service ideas can be found in the eMobility market for the DC fast charger product?
RQ 1.2. What requirements do the customers have on service concepts for DC fast charging?
RQ 1.3. What service ideas and success factors can be found from service benchmarks?
These service ideas have to be evaluated based on certain criteria. Bitran and Pedrosa (1998)
recommend that an internal and external perspective should be used to make a strategic
assessment of service ideas. During a brainstorming activity four dimensions were found to be
important for the strategic evaluation. The dimensions are customer value, internal strategic
fit and competitive benchmarks. The following research questions are asked based on the
criteria to evaluate service ideas.
IDEA EVALUATION
Customer
RQ 2.1. What is the customer feedback of the service ideas?
RQ 2.2. How do requirements differ between customer segments?
Internal
RQ 2.3. What strategic fit does each of the service ideas have?
RQ 2.4. What strategic intent does ABB have for each of the service ideas?
Customer compared to internal
RQ 2.5. How does ABB’s perception of strategic fit align with customer value?
Competitive benchmarks
RQ 2.6. What services are competitors offering?
Based on this evaluation, requirements have been put on the service concepts. It is now
possible to go from service ideas to more defined and exclusive service concepts. The
requirements from the service ideas that make up the concepts define the what part that should
be delivered in each service concept. The concept development and evaluation phase tries to
answer the how part of each service concept. Each concept is also evaluated from a profit
standpoint. The profit evaluation is done in the concept stage since it reduces the need for
making assumptions already on the idea level.
CONCEPT DEVELOPMENT AND EVALUATION
For each service concept the following questions are asked:
What
RQ 3.1. With the given idea evaluation and requirements in mind, what needs to be delivered in this
service concept?
How
RQ 3.2. How can/should the what part of the service concept be realized?
Profit potential
RQ 3.3. What is the profit potential for the service concept?
Service concepts for DC Fast Charging
7 (132)
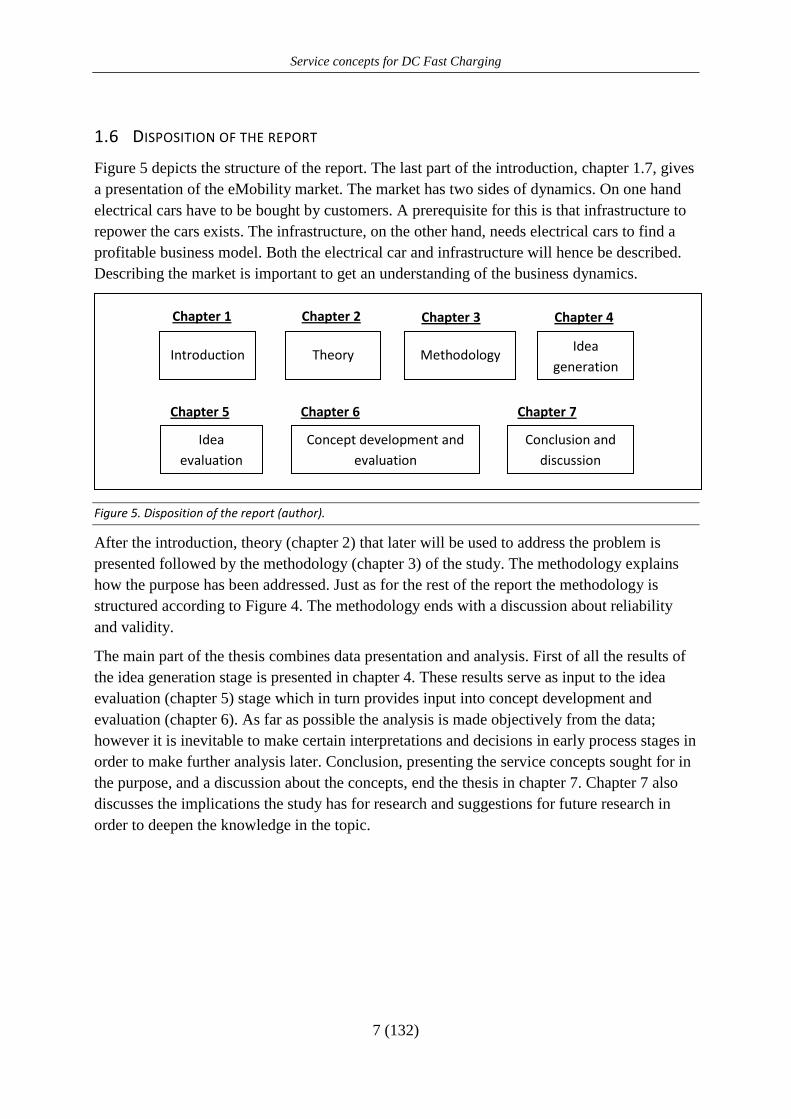
1.6 DISPOSITION OF THE REPORT
Figure 5 depicts the structure of the report. The last part of the introduction, chapter 1.7, gives
a presentation of the eMobility market. The market has two sides of dynamics. On one hand
electrical cars have to be bought by customers. A prerequisite for this is that infrastructure to
repower the cars exists. The infrastructure, on the other hand, needs electrical cars to find a
profitable business model. Both the electrical car and infrastructure will hence be described.
Describing the market is important to get an understanding of the business dynamics.
Figure 5. Disposition of the report (author).
After the introduction, theory (chapter 2) that later will be used to address the problem is
presented followed by the methodology (chapter 3) of the study. The methodology explains
how the purpose has been addressed. Just as for the rest of the report the methodology is
structured according to Figure 4. The methodology ends with a discussion about reliability
and validity.
The main part of the thesis combines data presentation and analysis. First of all the results of
the idea generation stage is presented in chapter 4. These results serve as input to the idea
evaluation (chapter 5) stage which in turn provides input into concept development and
evaluation (chapter 6). As far as possible the analysis is made objectively from the data;
however it is inevitable to make certain interpretations and decisions in early process stages in
order to make further analysis later. Conclusion, presenting the service concepts sought for in
the purpose, and a discussion about the concepts, end the thesis in chapter 7. Chapter 7 also
discusses the implications the study has for research and suggestions for future research in
order to deepen the knowledge in the topic.
Idea
evaluation
Concept development and
evaluation
Chapter 5 Chapter 6
Introduction
Chapter 1
Theory
Chapter 2
Methodology
Chapter 3
Idea
generation
Chapter 4
Conclusion and
discussion
Chapter 7
Service concepts for DC Fast Charging
8 (132)
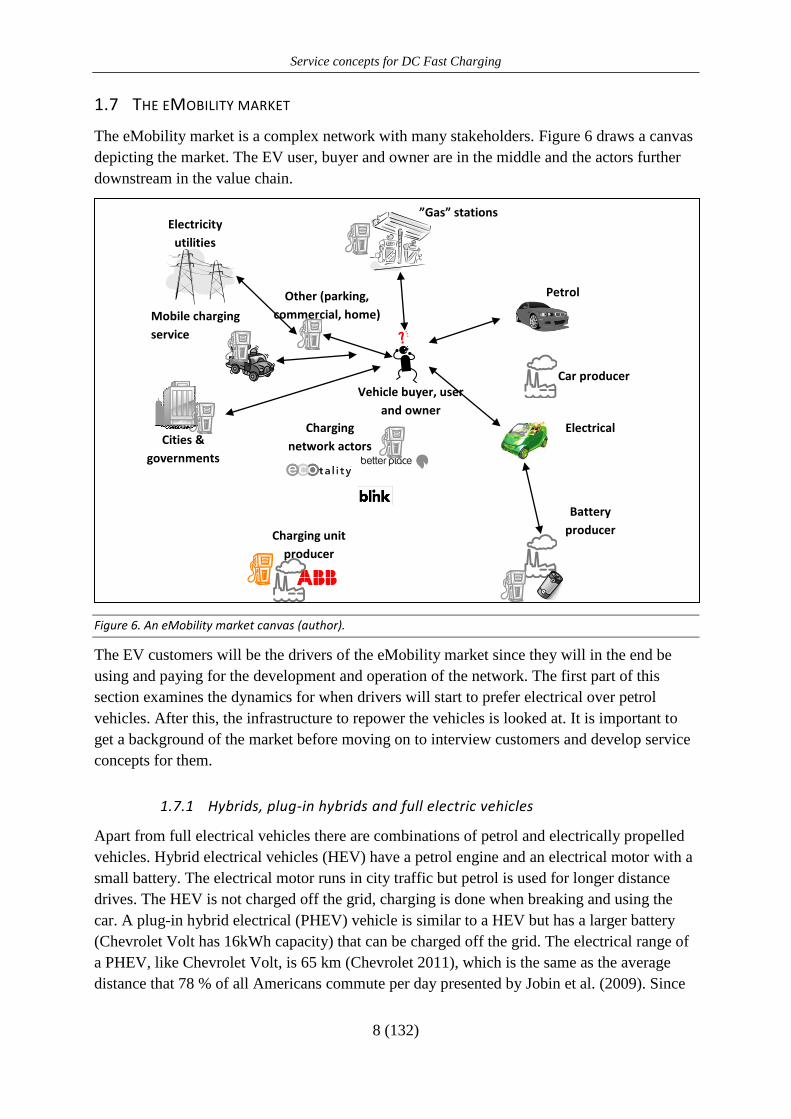
1.7 THE EMOBILITY MARKET
The eMobility market is a complex network with many stakeholders. Figure 6 draws a canvas
depicting the market. The EV user, buyer and owner are in the middle and the actors further
downstream in the value chain.
Figure 6. An eMobility market canvas (author).
The EV customers will be the drivers of the eMobility market since they will in the end be
using and paying for the development and operation of the network. The first part of this
section examines the dynamics for when drivers will start to prefer electrical over petrol
vehicles. After this, the infrastructure to repower the vehicles is looked at. It is important to
get a background of the market before moving on to interview customers and develop service
concepts for them.
1.7.1 Hybrids, plug-in hybrids and full electric vehicles
Apart from full electrical vehicles there are combinations of petrol and electrically propelled
vehicles. Hybrid electrical vehicles (HEV) have a petrol engine and an electrical motor with a
small battery. The electrical motor runs in city traffic but petrol is used for longer distance
drives. The HEV is not charged off the grid, charging is done when breaking and using the
car. A plug-in hybrid electrical (PHEV) vehicle is similar to a HEV but has a larger battery
(Chevrolet Volt has 16kWh capacity) that can be charged off the grid. The electrical range of
a PHEV, like Chevrolet Volt, is 65 km (Chevrolet 2011), which is the same as the average
distance that 78 % of all Americans commute per day presented by Jobin et al. (2009). Since
Charging unit
producer
Battery
producer
Electrical
Car producer
Petrol
Charging
network actors
Electricity
utilities
”Gas” stations
Cities &
governments
Mobile charging
service
Other (parking,
commercial, home)
Vehicle buyer, user
and owner
Service concepts for DC Fast Charging
9 (132)
the PHEV has a range that is sufficient to cover one day’s commuting it is unlikely that fast
charging will be used for those vehicle owners. Especially since the charging cost is likely to
be lower when plugging in at home compared to charging at a fast charging station. If running
out of power the PHEV owner would go the last distance with petrol and then charge at the
destination. The EV owner must, on the other hand, have power in the battery since no petrol
reserves exist. Using fast charging would hence be more applicable for this segment.
Appendix 1 provides a list of full electrical vehicles that can be bought today.
1.7.2 What is driving the shift to electrical vehicles and when is it coming?
In the beginning of the 20th
century electrical cars were ahead of competition from substitute
products. The EV had low vibration, smell and sound, together with a relatively competitive
range (better than the steam car). The electrical car holds the record of being first over the 100
kilometer per hour speed barrier (Wikipedia, Electric Car). By 1910 the shift started from
electrical to petrol vehicles led by the development of the internal combustion engine, cheaper
access to oil and the era of mass production (Jobin et al. 2009). It all came down to a matter of
performance; the petrol-car eventually had a longer range, was faster and became the cheapest
alternative.
Today transportation is a major industry. The car fills a very important need in most
developed countries. Petrol prices have risen ever since the combustion engine was invented
but our need for transportation is so strong that it does not fall with rising prices; instead
rather the opposite has been true (GP 2011-03-14). So will a shift in propulsion technology
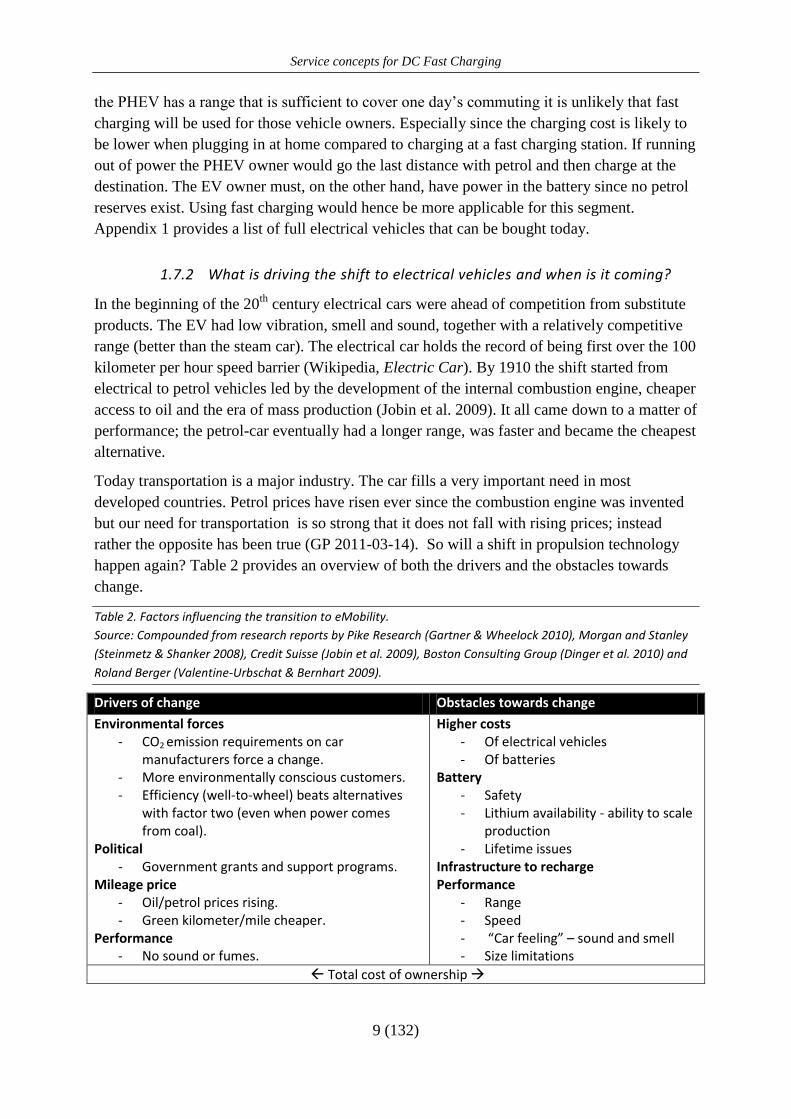
happen again? Table 2 provides an overview of both the drivers and the obstacles towards
change.
Table 2. Factors influencing the transition to eMobility.
Source: Compounded from research reports by Pike Research (Gartner & Wheelock 2010), Morgan and Stanley
(Steinmetz & Shanker 2008), Credit Suisse (Jobin et al. 2009), Boston Consulting Group (Dinger et al. 2010) and
Roland Berger (Valentine-Urbschat & Bernhart 2009).
Drivers of change Obstacles towards change
Environmental forces - CO2 emission requirements on car
manufacturers force a change. - More environmentally conscious customers. - Efficiency (well-to-wheel) beats alternatives
with factor two (even when power comes from coal).
Political - Government grants and support programs.
Mileage price - Oil/petrol prices rising. - Green kilometer/mile cheaper.
Performance - No sound or fumes.
Higher costs - Of electrical vehicles - Of batteries
Battery - Safety - Lithium availability - ability to scale
production - Lifetime issues
Infrastructure to recharge Performance
- Range - Speed - “Car feeling” – sound and smell - Size limitations
Total cost of ownership

Service concepts for DC Fast Charging
10 (132)
Many research institutes indicate that the transition to EVs will start in this decade. However
it is uncertain in which form the market will shape and in what speed.
“We wish we had all these answers but at this stage we do not, as
in many countries politics may play as important a role as
economics. However, what we can calculate is the economics of the
electric car, which we find quite compelling, and when one adds to
that the potential CO2 benefits as well as the security
considerations, we have no doubt that some form of either EV or
HEV transport will grow rapidly in the next decade.”(Jobin et al.
2009, p.9).
The major issue in the transition will be the total cost of ownership (Jobin et al. 2009), just as
it was when the transition in the early 20th
century took place. Jobin et al. (2009) indicate that
there will be a few customers who are willing to pay uneconomical prices for electrical
vehicles, but that the majority will make the switch when it is cost efficient. The economics
depend on a few factors including payback period, battery cost per kWh, petrol price, how
often/far the vehicle is driven and tax subsidies from governments. With today’s (2011)
situation, the EV is not cost efficient and some of these variables have to change. Everything
points towards that a change will eventually happen in petrol and battery prices. Petrol is a
finite resource and economics of scale will drive battery prices down. The question is when it
has changed for the transition to EVs to be cost efficient?
Valentine-Urbschat and Bernhart (2009) write that governments have had and will have a big
role to play in the transition towards EVs. Two examples of today are Portugal and Ireland
that provide subsidies for buyers of electrical vehicles. In Portugal EV buyers get $7k in tax
incentives and $10k for trading old vehicles (Darragh 2010) and in Ireland the grant is on €5k
(The Irish Times 2010). With the current petrol price ($3/gallon) and battery technology,
these grants are sufficient for a transition to EVs to be economical in those countries
according to Jobin’s et al. (2009, p.19) analysis of breakeven (see appendix 2). Other
governments, such as Denmark, have the strategy of placing high taxes on petrol vehicles to
make EVs more competitive. Giving away charging and parking for EVs is another shifting
strategy used in the city of Amsterdam.1
Apart from the cost issue, the performance of EVs compared to petrol vehicles must be
discussed. Nissan Leaf is an EV with a 100 mile range (Jobin’s et al. 2009) which already
today is sufficient for a large portion of the market. However this is still a main concern for
many drivers who do not want to restrict their options even though the vast majority of travels
can be covered within the 100 mile range. European Automobile Manufacturer’s Association
(2010) writes that the combustion engine will be the preferred choice applications that require
range, light weight and speed. The EV is also less reliable in cold weather.
1 Interview with city of Amsterdam, Ronald de Haas, Project manager for eMobility, 2011-03-10.

Service concepts for DC Fast Charging
11 (132)
The environmental considerations are the basis for governments favoring electrical vehicles
which emit less CO2 and other particles leading to greener city centers and less global
warming. Air pollution is today a major problem in large cities around the world. Another
problem with petrol cars is the dependency on imported (for most western countries) oil. The
global transportation sector accounts for 72% of the world’s oil dependency and 30% of all
CO2 emissions (Jobin et al. 2009). With the current fleet of power plants that will charge the
EV infrastructure, the EVs generate the least amount of CO2 emissions per km. Looking at
efficiency, EVs are also more efficient than other forms of powering cars with more than
twice the efficiency of a hybrid car when it comes to km/kWh (Jobin et al. 2009). This is
because the energy that powers an electrical vehicle is generated in a highly efficient plant
and there are comparably low losses from generation in the plant until consumption in the car.
The EV charging also does neither have to refine a propellant, which is the case for hydrogen
or petrol powered vehicles. Brown, Atherton and Lawson (2009) present an analysis of the
well-to-wheel efficiency of petrol versus electricity when both are generated from fossil fuel.
The efficiency is 20-40 % for EVs and 12-30 % for petrol vehicles.
A current debate is whether it is worth investing vast amounts in EV development and
infrastructure when small incremental developments of the petrol vehicle can reach CO2
targets for a long time ahead. It is also not certain if electricity is the choice of the future when
hydrogen and fuel cells could be other good alternatives. Valentine-Urbschat and Bernhart
(2009) mean however that petrol development has certain limits and even if petrol and diesel
engines improve by 40% until 2030 the targets set by for example EU will not be met. The
current OECD average emission for light duty vehicles is 176 g CO2/km and the goal set for
2030 is below 90 g CO2/km (Valentine-Urbschat & Bernhart 2009). This EU goal is set for
the vehicle fleet on average which means that new vehicles sold 2030 must have emissions
below 60 g CO2/km for the total average target to add up (ibid). 60 g CO2/km represent an
average fuel consumption of the car manufacturer’s fleet to be 2.5 liter per 100 km. Today
176 g CO2/km represent an average fuel consumption of 7.4 liter per 100 km. The EU targets
are slightly harder than US and Japanese restrictions. It indicates that governments take
environmental impact increasingly more serious. However, there is today no European
legislation for emissions that are binding. The figures are only targets set up together with
manufacturers. Small car manufacturers such as Fiat follow the targets, but for example
BMW, Porche and Audi do not. Discussions are held in EU if binding legislation should be
put in place (Wikipedia – European emission standards).
Jobin et al. (2009) mean that the industry has reached a plateau of efficiency at about 25 miles
per gallon and with petrol engines alone it is not likely that great improvements will occur.
Jobin et al. (2009) further writes that even if efficiency will increase in petrol vehicles this
does not solve the dependency of oil. The number of cars in the world is steadily increasing.
This further favors a transition towards electrical vehicles that might be the solution to the
transportation efficiency dilemma.
47'952'995 cars were produced in 2009 and this figure has been increasing with 2% annually
for the past ten years (OICA n.d.). In 2015, researchers believe that about 1 million of the
53.6m cars produced are electrical (roughly 2% of sales). Figure 7 shows three research
Service concepts for DC Fast Charging
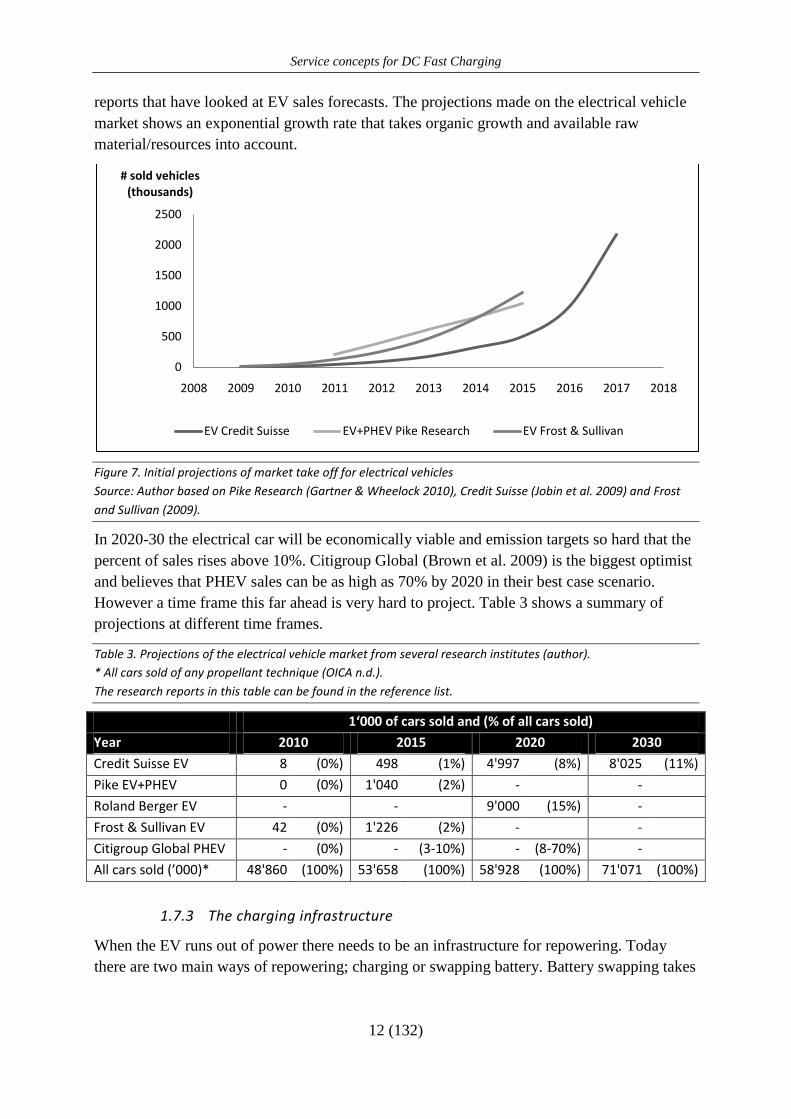
12 (132)
reports that have looked at EV sales forecasts. The projections made on the electrical vehicle
market shows an exponential growth rate that takes organic growth and available raw
material/resources into account.
Figure 7. Initial projections of market take off for electrical vehicles
Source: Author based on Pike Research (Gartner & Wheelock 2010), Credit Suisse (Jobin et al. 2009) and Frost
and Sullivan (2009).
In 2020-30 the electrical car will be economically viable and emission targets so hard that the
percent of sales rises above 10%. Citigroup Global (Brown et al. 2009) is the biggest optimist
and believes that PHEV sales can be as high as 70% by 2020 in their best case scenario.
However a time frame this far ahead is very hard to project. Table 3 shows a summary of
projections at different time frames.
Table 3. Projections of the electrical vehicle market from several research institutes (author).
* All cars sold of any propellant technique (OICA n.d.).
The research reports in this table can be found in the reference list.
1‘000 of cars sold and (% of all cars sold)
Year 2010 2015 2020 2030
Credit Suisse EV 8 (0%) 498 (1%) 4'997 (8%) 8'025 (11%)
Pike EV+PHEV 0 (0%) 1'040 (2%) - -
Roland Berger EV - - 9'000 (15%) -
Frost & Sullivan EV 42 (0%) 1'226 (2%) - -
Citigroup Global PHEV - (0%) - (3-10%) - (8-70%) -
All cars sold (’000)* 48'860 (100%) 53'658 (100%) 58'928 (100%) 71'071 (100%)
1.7.3 The charging infrastructure
When the EV runs out of power there needs to be an infrastructure for repowering. Today
there are two main ways of repowering; charging or swapping battery. Battery swapping takes
0
500
1000
1500
2000
2500
2008 2009 2010 2011 2012 2013 2014 2015 2016 2017 2018
# sold vehicles (thousands)
EV Credit Suisse EV+PHEV Pike Research EV Frost & Sullivan
Service concepts for DC Fast Charging
13 (132)
about 3 minutes for repowering while charging requires more than 15 minutes from an empty
to a full charge (Gartner & Wheelock 2010).
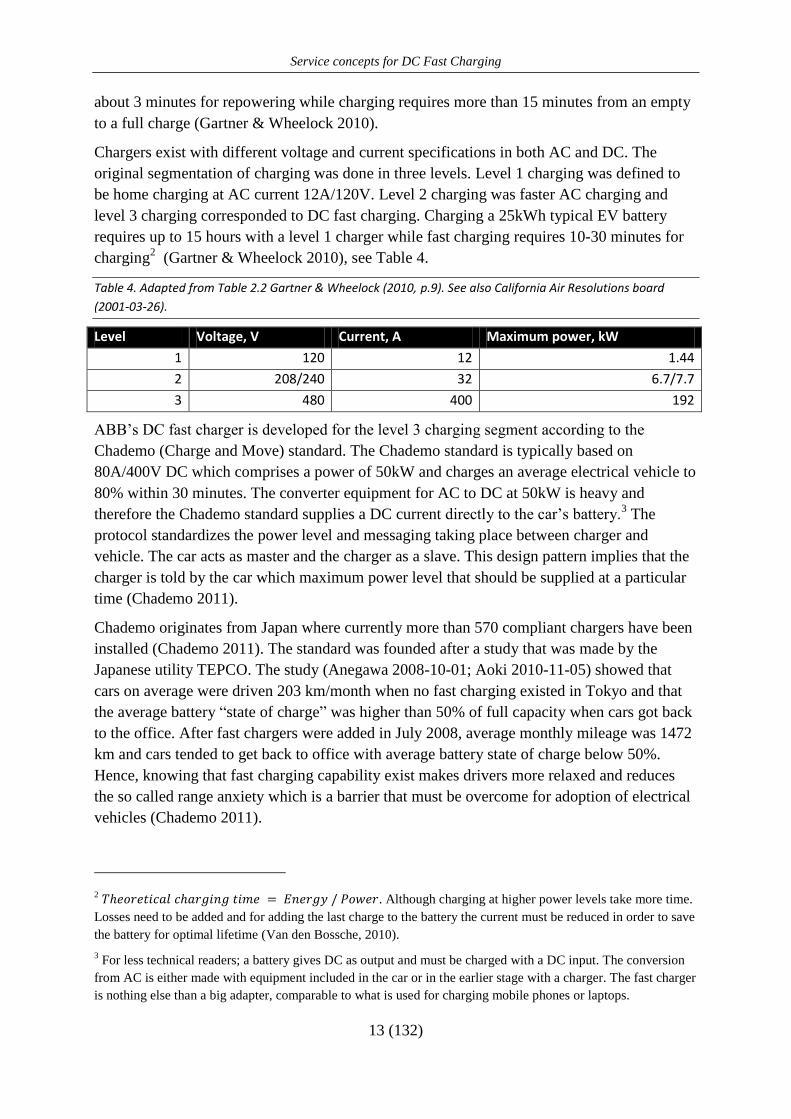
Chargers exist with different voltage and current specifications in both AC and DC. The
original segmentation of charging was done in three levels. Level 1 charging was defined to
be home charging at AC current 12A/120V. Level 2 charging was faster AC charging and
level 3 charging corresponded to DC fast charging. Charging a 25kWh typical EV battery
requires up to 15 hours with a level 1 charger while fast charging requires 10-30 minutes for
charging2 (Gartner & Wheelock 2010), see Table 4.
Table 4. Adapted from Table 2.2 Gartner & Wheelock (2010, p.9). See also California Air Resolutions board
(2001-03-26).
Level Voltage, V Current, A Maximum power, kW
1 120 12 1.44
2 208/240 32 6.7/7.7
3 480 400 192
ABB’s DC fast charger is developed for the level 3 charging segment according to the
Chademo (Charge and Move) standard. The Chademo standard is typically based on
80A/400V DC which comprises a power of 50kW and charges an average electrical vehicle to
80% within 30 minutes. The converter equipment for AC to DC at 50kW is heavy and
therefore the Chademo standard supplies a DC current directly to the car’s battery.3 The
protocol standardizes the power level and messaging taking place between charger and
vehicle. The car acts as master and the charger as a slave. This design pattern implies that the
charger is told by the car which maximum power level that should be supplied at a particular
time (Chademo 2011).
Chademo originates from Japan where currently more than 570 compliant chargers have been
installed (Chademo 2011). The standard was founded after a study that was made by the
Japanese utility TEPCO. The study (Anegawa 2008-10-01; Aoki 2010-11-05) showed that
cars on average were driven 203 km/month when no fast charging existed in Tokyo and that
the average battery “state of charge” was higher than 50% of full capacity when cars got back
to the office. After fast chargers were added in July 2008, average monthly mileage was 1472
km and cars tended to get back to office with average battery state of charge below 50%.
Hence, knowing that fast charging capability exist makes drivers more relaxed and reduces
the so called range anxiety which is a barrier that must be overcome for adoption of electrical
vehicles (Chademo 2011).
2 . Although charging at higher power levels take more time.
Losses need to be added and for adding the last charge to the battery the current must be reduced in order to save
the battery for optimal lifetime (Van den Bossche, 2010).
3 For less technical readers; a battery gives DC as output and must be charged with a DC input. The conversion
from AC is either made with equipment included in the car or in the earlier stage with a charger. The fast charger
is nothing else than a big adapter, comparable to what is used for charging mobile phones or laptops.
Service concepts for DC Fast Charging
14 (132)
Today the Chademo standard has more than 300 members and it is adopted by the Nissan
Leaf, Subaru R1e and Mitsubishi i-MiEV which are the first electrical vehicles mass produced
by the main auto companies. Concept cars from Toyota (EV), Volvo (C30), Citroen (C4),
Peugeot (iON) and Protoscar are also supporting, or will support Chademo. However it is far
from clear yet if Chademo is going to be adopted worldwide. China is developing a
proprietary standard on 100 kW DC (BYD 2011-03-11). The German car manufacturers are
looking at using the same connector (Mennekes) for all levels of charging delivering an AC
current of up to 44kW.
To get a sense of how big the market for infrastructure in eMobility is, petrol stations can be
studied. There were 117,908 petrol stations with revenues of $448b in USA in 2007 (U.S.
Census Bureau 2009). These stations refuel 255.9m registered vehicles (137m cars) (Bureau
of Transportation Statistics n.d.) which mean about 2000 vehicles per station. For long time,
petrol vehicles will however outnumber EVs. This will require fewer charging stations for
EVs than for petrol vehicles. However the growth of chargers is likely to be in parity with the
growth of cars for the first years. Frost & Sullivan (2009) believe that after 2011 the number
of chargers per car will drop below one and 2015 there will be two cars on one charger. The
charging units this refers to is not only DC-fast chargers, but the number estimate includes
slow chargers at level 1 and 2. ABB estimates are using 1 DC-fast charger per 100 electrical
vehicles as a measure for estimating the fast charging market initially. The price of a DC-fast
charging unit is initially around $50’000 but this will drop when the market takes off to about
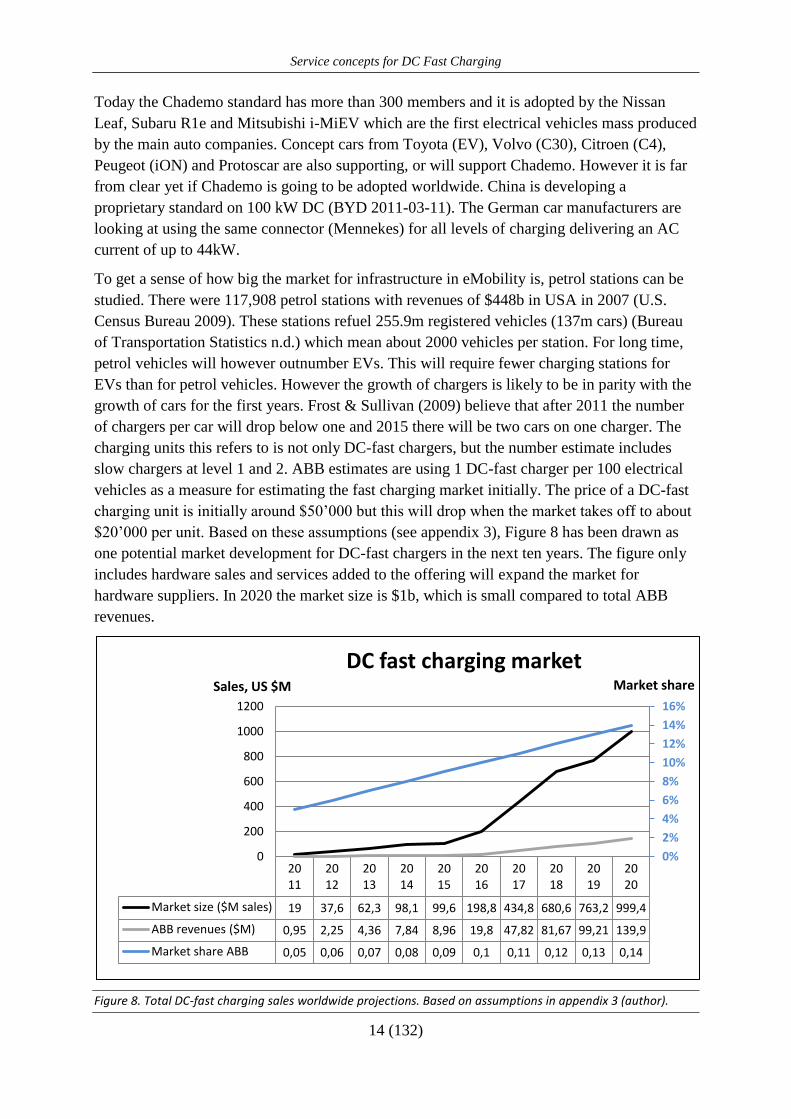
$20’000 per unit. Based on these assumptions (see appendix 3), Figure 8 has been drawn as
one potential market development for DC-fast chargers in the next ten years. The figure only
includes hardware sales and services added to the offering will expand the market for
hardware suppliers. In 2020 the market size is $1b, which is small compared to total ABB
revenues.
Figure 8. Total DC-fast charging sales worldwide projections. Based on assumptions in appendix 3 (author).
2011
2012
2013
2014
2015
2016
2017
2018
2019
2020
Market size ($M sales) 19 37,6 62,3 98,1 99,6 198,8 434,8 680,6 763,2 999,4
ABB revenues ($M) 0,95 2,25 4,36 7,84 8,96 19,8 47,82 81,67 99,21 139,9
Market share ABB 0,05 0,06 0,07 0,08 0,09 0,1 0,11 0,12 0,13 0,14
0%
2%
4%
6%
8%
10%
12%
14%
16%
0
200
400
600
800
1000
1200
Sales, US $M
DC fast charging marketMarket share
Service concepts for DC Fast Charging
15 (132)
A major advantage with electricity is that the core network is already developed and the
charging infrastructure will in many cases be easy to connect. Compared to repowering with
petrol, charging electricity can be done whenever the car is not moving. Charging the car can
hence be tied together with every parking place. For most of the cases when a car is used the
driver will not go far, and the car will often be full when starting the trip. For many EV users
there will therefore not be a need to visit fast charging stations regularly. When it is done a
fast charging station will be used in the same way as a petrol station is today. 350Green is a
company that aims to provide charging infrastructure in the US. The company stresses that it
can be a one-to-one mapping between cheap home charging stations and parking. For fast
charging, utilization of the charger is important and hence fast chargers should be built around
areas where the parking space is only utilized for maximum 30 minutes (350Green 2011-03-
15).
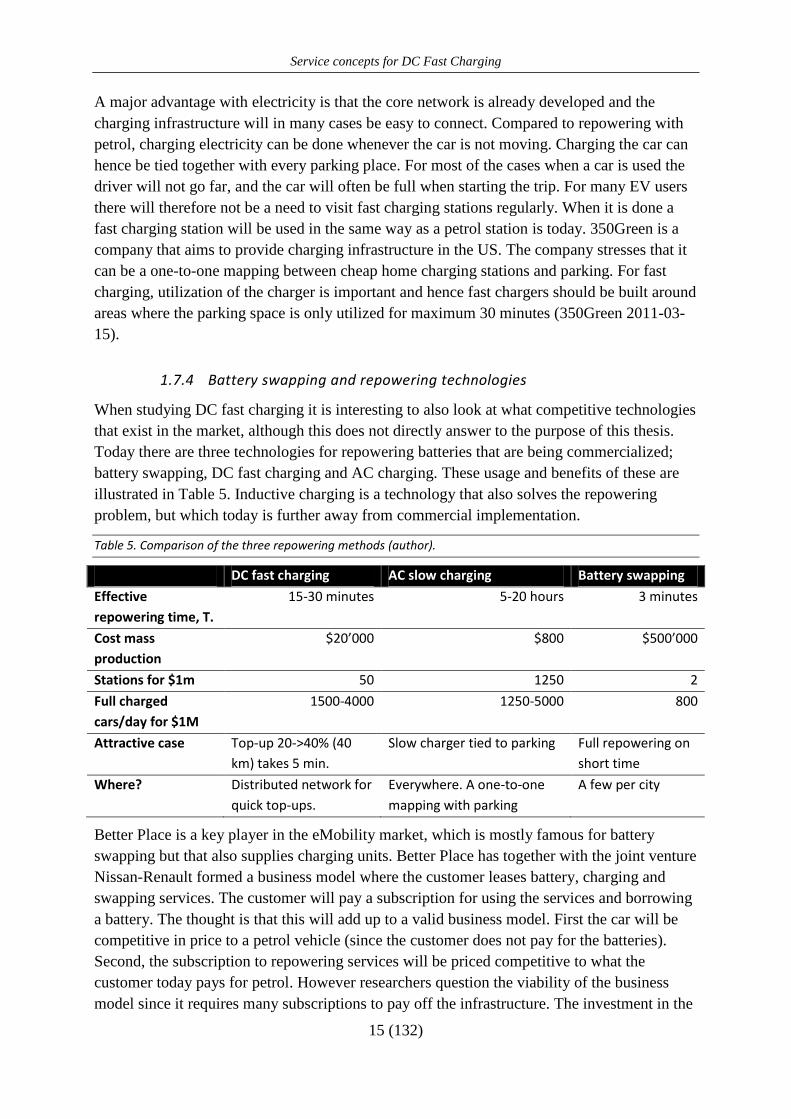
1.7.4 Battery swapping and repowering technologies
When studying DC fast charging it is interesting to also look at what competitive technologies
that exist in the market, although this does not directly answer to the purpose of this thesis.
Today there are three technologies for repowering batteries that are being commercialized;
battery swapping, DC fast charging and AC charging. These usage and benefits of these are
illustrated in Table 5. Inductive charging is a technology that also solves the repowering
problem, but which today is further away from commercial implementation.
Table 5. Comparison of the three repowering methods (author).
DC fast charging AC slow charging Battery swapping
Effective
repowering time, T.
15-30 minutes 5-20 hours 3 minutes
Cost mass
production
$20’000 $800 $500’000
Stations for $1m 50 1250 2
Full charged
cars/day for $1M
1500-4000 1250-5000 800
Attractive case Top-up 20->40% (40
km) takes 5 min.
Slow charger tied to parking Full repowering on
short time
Where? Distributed network for
quick top-ups.
Everywhere. A one-to-one
mapping with parking
A few per city
Better Place is a key player in the eMobility market, which is mostly famous for battery
swapping but that also supplies charging units. Better Place has together with the joint venture
Nissan-Renault formed a business model where the customer leases battery, charging and
swapping services. The customer will pay a subscription for using the services and borrowing
a battery. The thought is that this will add up to a valid business model. First the car will be
competitive in price to a petrol vehicle (since the customer does not pay for the batteries).
Second, the subscription to repowering services will be priced competitive to what the
customer today pays for petrol. However researchers question the viability of the business
model since it requires many subscriptions to pay off the infrastructure. The investment in the
Service concepts for DC Fast Charging
16 (132)
swapping station facility alone is about $500’000 (Gartner & Wheelock 2010). Jobin’s et al.
(2009) mean that if Better Place could reach 40’000 customers with 85 installed stations the
investment will be break even if customers are charged with fees equivalent to a petrol price
of $5 per gallon (today $3 per gallon).
The investment in battery swapping can be compared to a petrol station investment. With 4
pumps a station costs about 6M SEK to buy, build and install. This corresponds to $850’000
at an exchange rate of 7SEK/$ (appendix 4). A petrol station with four pumps has similar
capacity to a battery swapping station in terms of cars per time unit to repower (one every two
to three minutes). Since the cost of petrol is high, a comparably low gross margin is enough to
get a good profit and cover overheads. For a swapping station the gross margin for selling
electricity must be very large to cover investments and overheads. This is because the value of
electricity that can be sold per time unit is low compared to petrol4. The customer of petrol
does neither have an alternative source of buying petrol to compare prices with. This is
however the case for the customer of electricity which implies that it is hard to motivate a
high gross margin. A subscription model with other value adding services (such as owning
and servicing the battery for the EV driver) might be the only viable commercial business
model for battery swapping.
Better Place is at the moment rolling out infrastructure in Israel and Denmark. Apart from
battery swapping, the aim is to build networks of 100 000 chargers in both countries (Gartner
& Wheelock 2010). However, since the business model is capital intensive, Better Place aims
at raising venture capital for building networks in each country (Garthwaite 2009-03-06).
Since charging to 90% will be done at home the network of swapping stations must be a lot
sparser than for petrol stations. Battery swapping may seem like a superior technology for the
EV user’s perspective for solving the range anxiety problem with fast repowering. It only
takes three minutes to change battery and this is comparable to today’s system with petrol
stations. However the infrastructure is costly and for the same investment of one swapping
station ($500’000) one could build 25 DC-fast charging stations (assuming $20’000 per
station). With a 15 minute service time these stations can serve five times more customers5.
With this in mind, DC-Fast charging seems to have a performance/cost benefit for repowering
system providers for some market segment. Table 5 compares three methods for repowering
an electrical vehicle. One development that might be likely is that fast charging stations will
have a similar spread as petrol stations while battery swapping will only exist in cities and
densely populated areas.
4 The value of 1 fully charged battery is the value of 25kWh energy. This is about $1-2.
The value of a full tank of petrol (50 liter) is on the other hand around $50, which is many factors higher.
Repowering a battery or a petrol tank takes about the same time.
5 Using Little’s law where
. With
But with 25 chargers the total rate is .
Service concepts for DC Fast Charging
17 (132)
2 THEORY
In order to address the research purpose, theory is used. In this section the key frameworks
that will be applied in the methodology, data presentation and analysis are presented.
2.1 SERVICE THEORY AND CLASSIFICATIONS – SERVICE IS A MEANS FOR DIFFERENTIATION
Services can be categorized in different ways when looking at an industrial goods producing
company. One concept, the augmented product, looks at services as something that
strengthens the core product. Levitt (1980) discusses the generic, expected and augmented
product. A generic product is the steel of a steel producer or the loan from a bank. Two steel
producers make essentially the same steel and two loans with the same interest rate are at their
core the same. However, the customer expects more than a core product; delivery, support
efforts and cost reducing new ideas are some examples posted by Levitt (1980). A product
can only be sold once overall expectations are met, even if the core offer is the same. The
augmented product in Levitt’s (1980) definition is to offer customers value from something
that they do not expect which makes the company stand out from competition. Grönroos
(1987) has adopted Levitt’s (1980) theory to a classification for services, although the content
is basically the same. Facilitating services corresponds to the expected product that the
customer buys. Supporting/enhancing services, on the other hand, correspond to what Levitt
(1980) calls the augmented product, an offering that surprises and adds value to the customer.
In a global competitive market, such as for eMobility, it is of great importance to stand out
and be differentiated. Augmenting and differentiating can be done by any means as long as it
adds value to the customer in a cost efficient way for the supplier (Levitt 1980). In the 21th
century, as described earlier, service has come to play a greater role in companies’ offers.
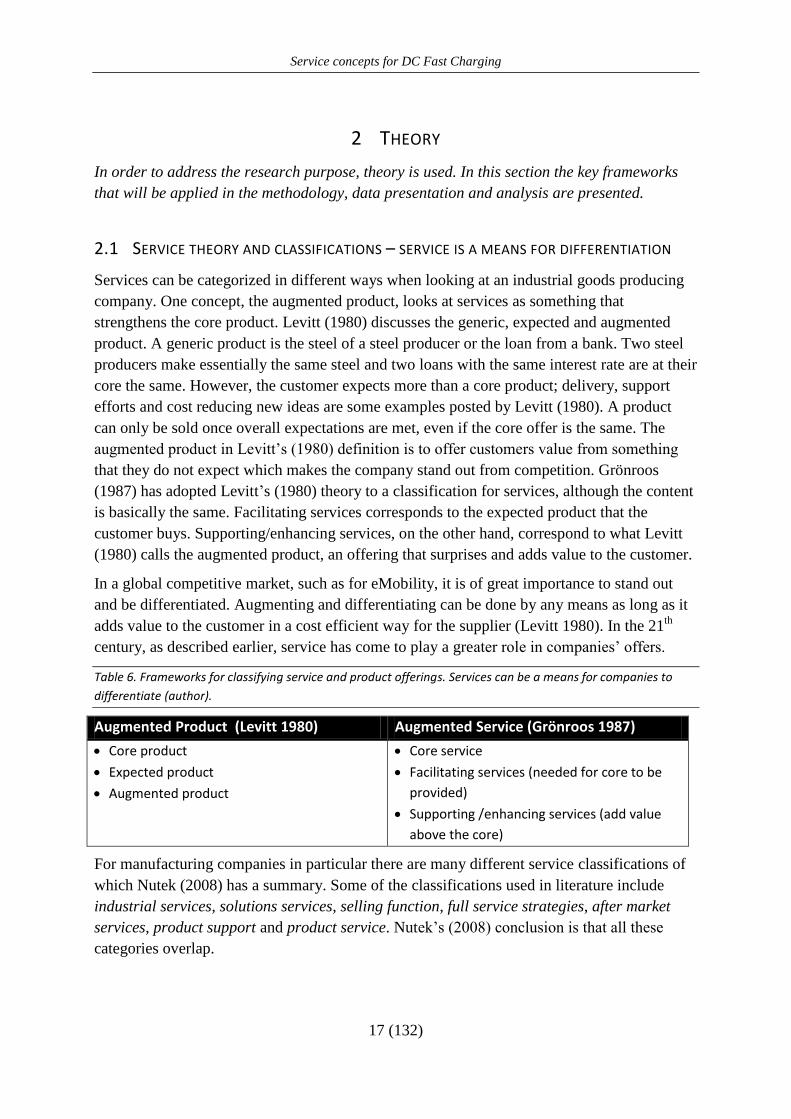
Table 6. Frameworks for classifying service and product offerings. Services can be a means for companies to
differentiate (author).
Augmented Product (Levitt 1980) Augmented Service (Grönroos 1987)
Core product
Expected product
Augmented product
Core service
Facilitating services (needed for core to be
provided)
Supporting /enhancing services (add value
above the core)
For manufacturing companies in particular there are many different service classifications of
which Nutek (2008) has a summary. Some of the classifications used in literature include
industrial services, solutions services, selling function, full service strategies, after market
services, product support and product service. Nutek’s (2008) conclusion is that all these
categories overlap.
Service concepts for DC Fast Charging
18 (132)
A useful way of classifying services is to look at when the service is supplied and this is
described by Grönroos (2007) to be a common approach in industry where companies use a
life cycle approach to service the products.
According to Grönroos (2007) service management shifts the focus from product based value
(focus on one time sales) to a total value view for the customer (value in use). This implies
long term relationships and a shift from providing core products to providing products that
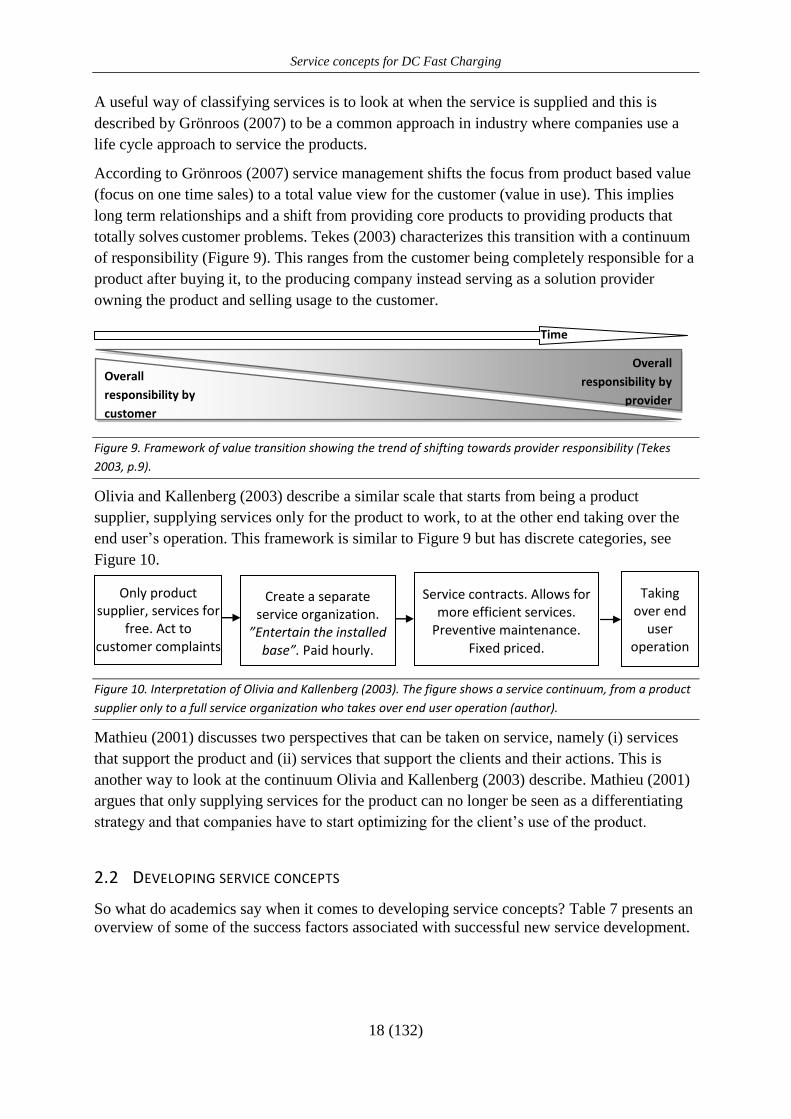
totally solves customer problems. Tekes (2003) characterizes this transition with a continuum
of responsibility (Figure 9). This ranges from the customer being completely responsible for a
product after buying it, to the producing company instead serving as a solution provider
owning the product and selling usage to the customer.
Figure 9. Framework of value transition showing the trend of shifting towards provider responsibility (Tekes
2003, p.9).
Olivia and Kallenberg (2003) describe a similar scale that starts from being a product
supplier, supplying services only for the product to work, to at the other end taking over the
end user’s operation. This framework is similar to Figure 9 but has discrete categories, see
Figure 10.
Figure 10. Interpretation of Olivia and Kallenberg (2003). The figure shows a service continuum, from a product
supplier only to a full service organization who takes over end user operation (author).
Mathieu (2001) discusses two perspectives that can be taken on service, namely (i) services
that support the product and (ii) services that support the clients and their actions. This is
another way to look at the continuum Olivia and Kallenberg (2003) describe. Mathieu (2001)
argues that only supplying services for the product can no longer be seen as a differentiating
strategy and that companies have to start optimizing for the client’s use of the product.
2.2 DEVELOPING SERVICE CONCEPTS
So what do academics say when it comes to developing service concepts? Table 7 presents an
overview of some of the success factors associated with successful new service development.
Only product supplier, services for
free. Act to customer complaints
Create a separate service organization.
”Entertain the installed base”. Paid hourly.
Taking over end
user operation
Service contracts. Allows for more efficient services.
Preventive maintenance. Fixed priced.
Overall
responsibility by
customer
Overall
responsibility by
provider
Time
Service concepts for DC Fast Charging
19 (132)
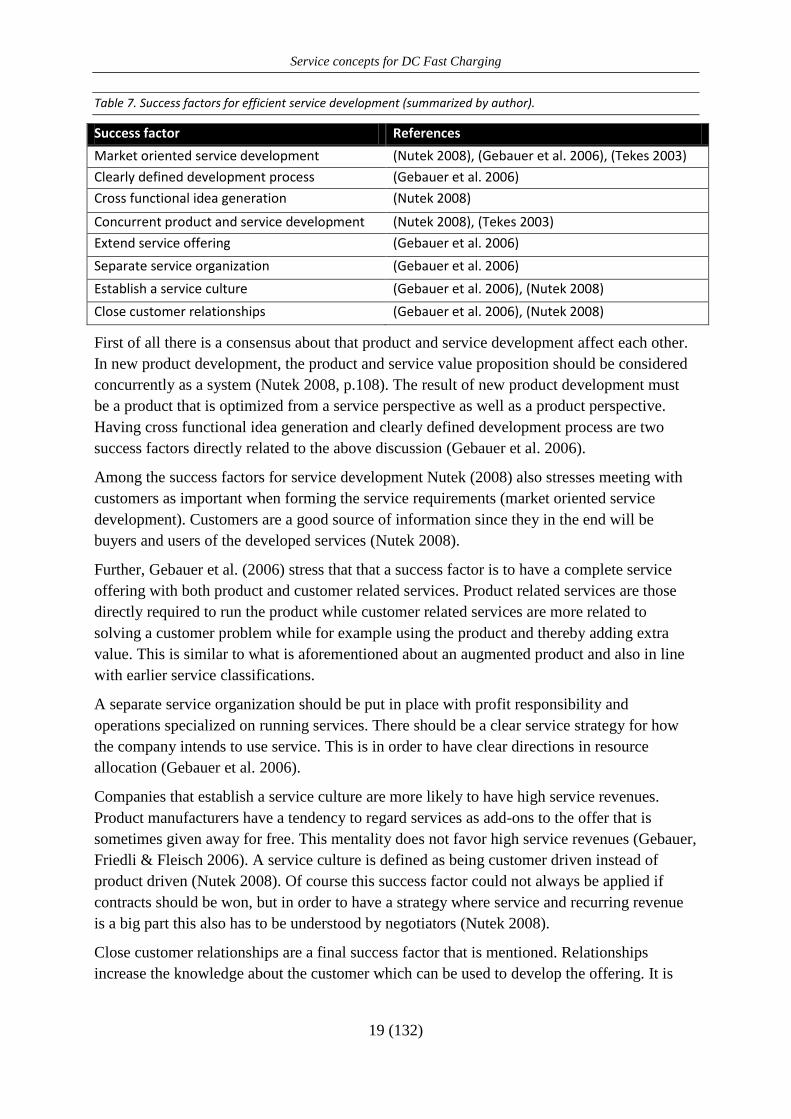
Table 7. Success factors for efficient service development (summarized by author).
Success factor References
Market oriented service development (Nutek 2008), (Gebauer et al. 2006), (Tekes 2003)
Clearly defined development process (Gebauer et al. 2006)
Cross functional idea generation (Nutek 2008)
Concurrent product and service development (Nutek 2008), (Tekes 2003)
Extend service offering (Gebauer et al. 2006)
Separate service organization (Gebauer et al. 2006)
Establish a service culture (Gebauer et al. 2006), (Nutek 2008)
Close customer relationships (Gebauer et al. 2006), (Nutek 2008)
First of all there is a consensus about that product and service development affect each other.
In new product development, the product and service value proposition should be considered
concurrently as a system (Nutek 2008, p.108). The result of new product development must
be a product that is optimized from a service perspective as well as a product perspective.
Having cross functional idea generation and clearly defined development process are two
success factors directly related to the above discussion (Gebauer et al. 2006).
Among the success factors for service development Nutek (2008) also stresses meeting with
customers as important when forming the service requirements (market oriented service
development). Customers are a good source of information since they in the end will be
buyers and users of the developed services (Nutek 2008).
Further, Gebauer et al. (2006) stress that that a success factor is to have a complete service
offering with both product and customer related services. Product related services are those
directly required to run the product while customer related services are more related to
solving a customer problem while for example using the product and thereby adding extra
value. This is similar to what is aforementioned about an augmented product and also in line
with earlier service classifications.
A separate service organization should be put in place with profit responsibility and
operations specialized on running services. There should be a clear service strategy for how
the company intends to use service. This is in order to have clear directions in resource
allocation (Gebauer et al. 2006).
Companies that establish a service culture are more likely to have high service revenues.
Product manufacturers have a tendency to regard services as add-ons to the offer that is
sometimes given away for free. This mentality does not favor high service revenues (Gebauer,
Friedli & Fleisch 2006). A service culture is defined as being customer driven instead of
product driven (Nutek 2008). Of course this success factor could not always be applied if
contracts should be won, but in order to have a strategy where service and recurring revenue
is a big part this also has to be understood by negotiators (Nutek 2008).
Close customer relationships are a final success factor that is mentioned. Relationships
increase the knowledge about the customer which can be used to develop the offering. It is
Service concepts for DC Fast Charging
20 (132)
also a means to protect from competition since it increases customer loyalty (Nutek 2008;
Gebauer et al. 2006).
2.2.1 Assessing customer needs
As stated above, one success factor for service development is to use the customer as a source
of information. The importance of this has also been stressed in product development
literature (see Wheelwright & Clark 1992). The customer is the central pillar in the total
quality management which by many academics is promoted to be a best practice way of
managing organizations (see Bergman & Klefsjö 2010). The importance of the customer is
clear since he or she in the end will be providing the revenue streams.
But how are customers’ best used in service development? Customers can be used in all
stages of service development, from idea assessment to implementation, as an evaluator of the
developed ideas and concepts (Bergman & Klefsjö 2010). However, according to Marin and
Horne (1993), companies that use customers in all stages are not more successful than
companies who use customers in a subset of the product development process stages. This
means that customers should not be overused. According to Edvardsson and Olsson (1996)
the customer can not only be used as an evaluator and entity for specifying requirements, also
ideas can be retrieved from customers. Britan and Pedrosa (1998) argue that development
should start by identifying what the customer needs and requires and combine these
requirements together.
However, asking the customer what he wants is likely to not give all the possible service
concept opportunities that are available. Osterwalder (2010) quotes Hendry Ford, founder of
Ford Motor Company and father of mass production:
“If I would have asked my customers what they wanted, they would
have told me ‘a faster horse’” (Hendry Ford, from Osterwalder
2010, p.129).
Matzler et al. (1996) argue that for idea generation the attractive requirements, that will
differentiate the company towards competitors, are hard for customers to imagine if being
prompted directly. Attractive needs are implicit for the customer and likely to be omitted.
There are essentially two ways to overcome this problem:
Ask the customer the right questions when interviewing. The right question means
that you should ask the customer about problems and not desires (Matzler et al. 1996,
p.9). When you do this you will not limit yourself to particular solutions that the
customer knows about; the design space is still open. On the other hand, as a
researcher you will later have to put some effort in finding solutions to the problems.
Matzler et al. (1996) presents the following questions as a guideline:
a. Which associations does the customer make when using the product (or
service)?
Service concepts for DC Fast Charging
21 (132)
b. Which problems/defects/complaints does the customer associate with the use
of the product (or service)?
c. Which criteria does the customer take into consideration when buying the
product (or service)?
d. Which new features or services would better meet the expectations of the
customer? What would the customer change in the product?
Use ethnography, which means to observe customers who use the product. This is
recommended by Alam (2006) in order to discover implicit needs.
A Kano survey is a good way to classify attributes into categories of importance. The survey
can measure to which degree an attribute (a service or product idea) contributes to customer
satisfaction if it exists, and also how dissatisfied a customer will be if the attribute is absent
(Matzler et al. 1996, p.10). Depending on where an attribute is in this space, Kano made a
classification which is depicted in Table 8.
Table 8. Kano requirements classification (author adopted from Matzler et al. 1996).
Requirement/attribute
Specification
If present If not present
Attractive, (A) Satisfaction No impact
One dimensional, (O) Satisfaction Dissatisfaction
Must be, (M) No impact Dissatisfaction
Indifferent, (I) No impact No impact
Reverse, (R) Dissatisfaction No impact
This can also be depicted in a graph, see Figure 11.
Figure 11. The Kano model for customer satisfaction (Matzler et al. 1996).
Must be requirements are those that a value proposition must have in order to even compete
on the market. One-dimensional requirements could be omitted but most actors will include
Customer dissatisfied
Requirement fulfilled
Requirement not fulfilled
Attractive
One dimensional
Must be
Indifferent
Reverse
Customer
satisfied

Service concepts for DC Fast Charging
22 (132)
them with different quality in the offering. Attractive requirements are those that will make a
company stand out from competitors if they are included in an offering. Finally, an indifferent
attribute does not give any value to customers and should be omitted (Matzler et al. 1996).
Customer preferences of attributes tend to change over time according to the rule:
(Nilsson-Witell & Fundin 2005).
An attribute that today is indifferent might in a few years be attractive and when the market
matures even more turn to one-dimensional or must be. By studying the customer maturity via
a technology readiness index it is possible to determine where the customer preferences are on
the scale (Nilsson-Witell & Fundin 2005).
It can be noted that the classification of attributes/requirements in the Kano model is similar
to the levels of service that Levitt (1980) proposed. Hence, the Kano model is in line with the
success factor presented earlier in this chapter. A product should be augmented if it should be
successful in the market.
2.2.2 Measuring the internal perspective
A core competence is a skill that is unique and difficult to imitate. It differentiates a company
from competition. According to Leonard-Barton (1992) there are four dimensions to core
competence; (i) skills and knowledge base, (ii) technical systems, (iii) managerial systems and
(iv) values and norms. If there is a match between all of these, the competence could be seen
as core.
An interesting note is that a paradox exists between innovation (implying change from core
competences) and the status quo (strategic fit with core competences) (Leonard-Barton 1992).
A company should do what it is good at, but at the same time it must deviate from this in
order to innovate and stay ahead of competition. Prahalad (1993) discusses the notion of the
strategic intent to be the misfit between aspirations and current resources and processes for
using them (core competences). In technology intensive businesses Leonard-Barton (1992)
concludes that organizations have no other choice than continuously challenging old
competences. Ibid further argues that organizational learning therefore is an important
element to sustain competitive.
Irrespective of the paradox many authors have although found that aligning new offers with
core competences tends to be correlated with success. Martin and Horne (1993) conclude that
firms successful in new service development tend to align services better with the current
business compared with unsuccessful firms. Similarly de Brentani and Cooper (1992) have
found that a company’s ability to leverage resources, skills and experience contributes to
development success.
According to Britan and Pedrosa (1998) an internal strategic assessment should determine
how well the new product or service ideas fits the firm’s current offering and how it will
impact operations. It is up to the organization to find criteria for how to determine if a
competence could be considered core or not.
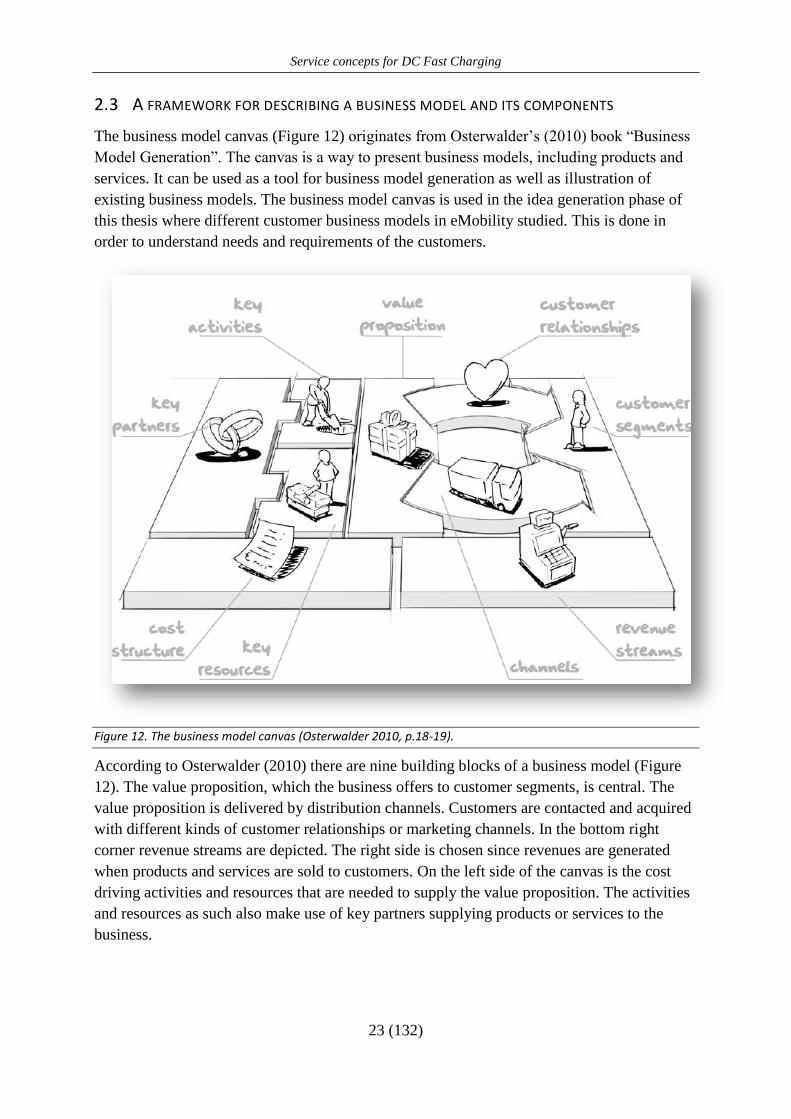
Service concepts for DC Fast Charging
23 (132)
2.3 A FRAMEWORK FOR DESCRIBING A BUSINESS MODEL AND ITS COMPONENTS
The business model canvas (Figure 12) originates from Osterwalder’s (2010) book “Business
Model Generation”. The canvas is a way to present business models, including products and
services. It can be used as a tool for business model generation as well as illustration of
existing business models. The business model canvas is used in the idea generation phase of
this thesis where different customer business models in eMobility studied. This is done in
order to understand needs and requirements of the customers.
Figure 12. The business model canvas (Osterwalder 2010, p.18-19).
According to Osterwalder (2010) there are nine building blocks of a business model (Figure
12). The value proposition, which the business offers to customer segments, is central. The
value proposition is delivered by distribution channels. Customers are contacted and acquired
with different kinds of customer relationships or marketing channels. In the bottom right
corner revenue streams are depicted. The right side is chosen since revenues are generated
when products and services are sold to customers. On the left side of the canvas is the cost
driving activities and resources that are needed to supply the value proposition. The activities
and resources as such also make use of key partners supplying products or services to the
business.

Service concepts for DC Fast Charging
24 (132)
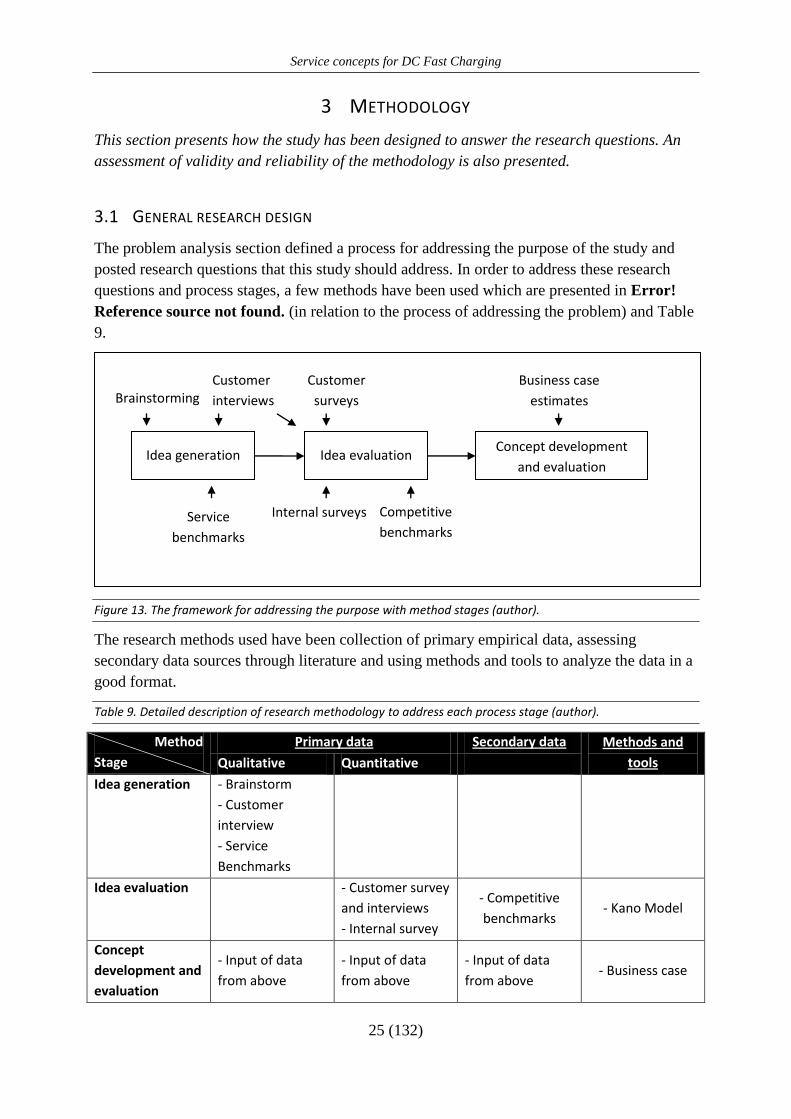
Service concepts for DC Fast Charging
25 (132)
3 METHODOLOGY
This section presents how the study has been designed to answer the research questions. An
assessment of validity and reliability of the methodology is also presented.
3.1 GENERAL RESEARCH DESIGN
The problem analysis section defined a process for addressing the purpose of the study and
posted research questions that this study should address. In order to address these research
questions and process stages, a few methods have been used which are presented in Error!
Reference source not found. (in relation to the process of addressing the problem) and Table
9.
Figure 13. The framework for addressing the purpose with method stages (author).
The research methods used have been collection of primary empirical data, assessing
secondary data sources through literature and using methods and tools to analyze the data in a
good format.
Table 9. Detailed description of research methodology to address each process stage (author).
Method
Stage
Primary data Secondary data Methods and
tools Qualitative Quantitative
Idea generation - Brainstorm
- Customer
interview
- Service
Benchmarks
Idea evaluation
- Customer survey
and interviews
- Internal survey
- Competitive
benchmarks - Kano Model
Concept
development and
evaluation
- Input of data
from above
- Input of data
from above
- Input of data
from above - Business case
Internal surveys Competitive
benchmarks
Idea evaluation Concept development
and evaluation
Business case
estimates
Customer
surveys
Customer
interviews
Brainstorming
Service
benchmarks
Idea generation
Service concepts for DC Fast Charging
26 (132)
3.2 IDEA GENERATION
During the idea generation stage, brainstorming was primarily used to come up with the ideas
that later was evaluated. The idea generation phase also included customer interviews and
service benchmarks. The customer interviews were used to assess the needs and requirements
from customers, the latter which are used as input to idea evaluation and concept
development. This also leaded to generation of new service ideas. Benchmarks were also
primary used to get ideas and inspiration for different service strategies.
3.2.1 Brainstorming
Osterwalder (2010) presents a creativity method using the business model canvas as a starting
point for the discussion. Together with the canvas the method makes use of Post-It notes and
brainstorming to come up with valid business opportunities. As with all brainstorming
session’s quantity is the focus before quality. It is important not to give negative critique to
other ideas, all ideas could potentially contribute in the end and analysis should not be done
during idea generation. Encouraging wild ideas, being visual (paintings and descriptions) and
letting one participants speak at a time are other norms Osterwalder (2010) recommends.
Osterwalder (2010) also recommends not going too far off target and to have a facilitator to
keep the session organized.
Figure 14. Ongoing brainstorming session with team 1 (author).
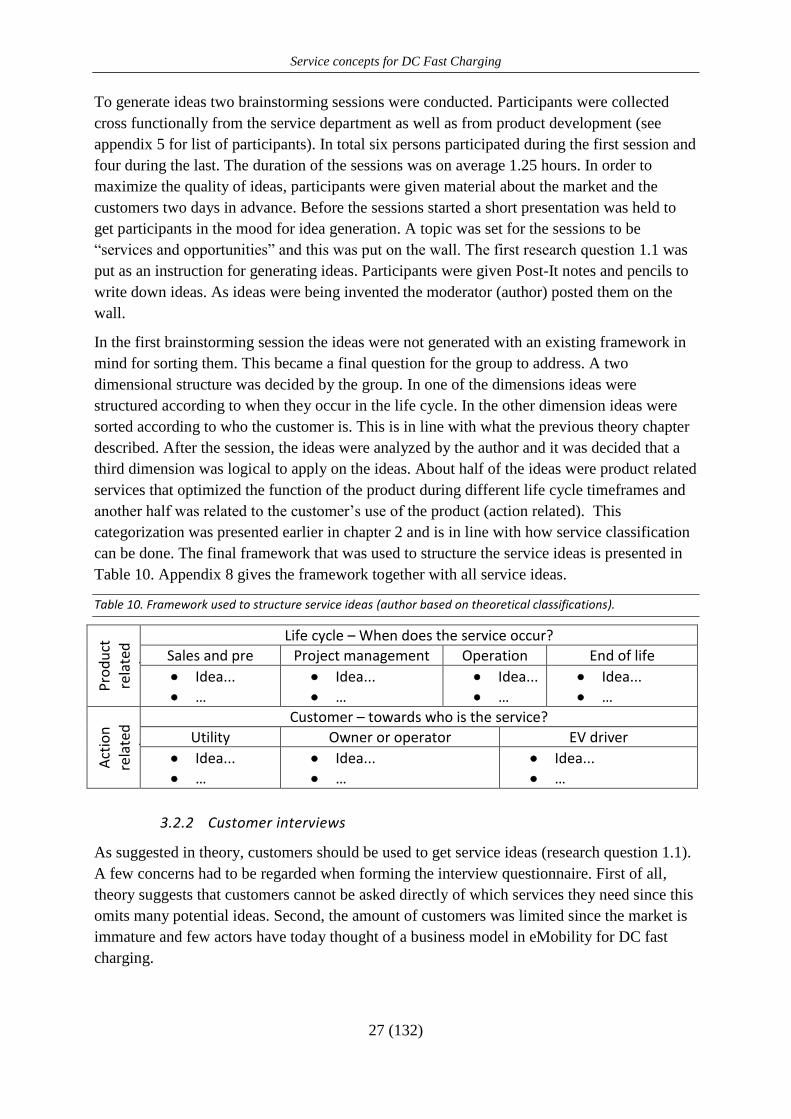
Service concepts for DC Fast Charging
27 (132)
To generate ideas two brainstorming sessions were conducted. Participants were collected
cross functionally from the service department as well as from product development (see
appendix 5 for list of participants). In total six persons participated during the first session and
four during the last. The duration of the sessions was on average 1.25 hours. In order to
maximize the quality of ideas, participants were given material about the market and the
customers two days in advance. Before the sessions started a short presentation was held to
get participants in the mood for idea generation. A topic was set for the sessions to be
“services and opportunities” and this was put on the wall. The first research question 1.1 was
put as an instruction for generating ideas. Participants were given Post-It notes and pencils to
write down ideas. As ideas were being invented the moderator (author) posted them on the
wall.
In the first brainstorming session the ideas were not generated with an existing framework in
mind for sorting them. This became a final question for the group to address. A two
dimensional structure was decided by the group. In one of the dimensions ideas were
structured according to when they occur in the life cycle. In the other dimension ideas were
sorted according to who the customer is. This is in line with what the previous theory chapter
described. After the session, the ideas were analyzed by the author and it was decided that a
third dimension was logical to apply on the ideas. About half of the ideas were product related
services that optimized the function of the product during different life cycle timeframes and
another half was related to the customer’s use of the product (action related). This
categorization was presented earlier in chapter 2 and is in line with how service classification
can be done. The final framework that was used to structure the service ideas is presented in
Table 10. Appendix 8 gives the framework together with all service ideas.
Table 10. Framework used to structure service ideas (author based on theoretical classifications).
Pro
du
ct
rela
ted
se
rvic
es Life cycle – When does the service occur?
Sales and pre Project management Operation End of life
Idea...
…
Idea...
…
Idea...
…
Idea...
…
Act
ion
rela
ted
se
rvic
es Customer – towards who is the service?
Utility Owner or operator EV driver
Idea...
…
Idea...
…
Idea...
…
3.2.2 Customer interviews
As suggested in theory, customers should be used to get service ideas (research question 1.1).
A few concerns had to be regarded when forming the interview questionnaire. First of all,
theory suggests that customers cannot be asked directly of which services they need since this
omits many potential ideas. Second, the amount of customers was limited since the market is
immature and few actors have today thought of a business model in eMobility for DC fast
charging.
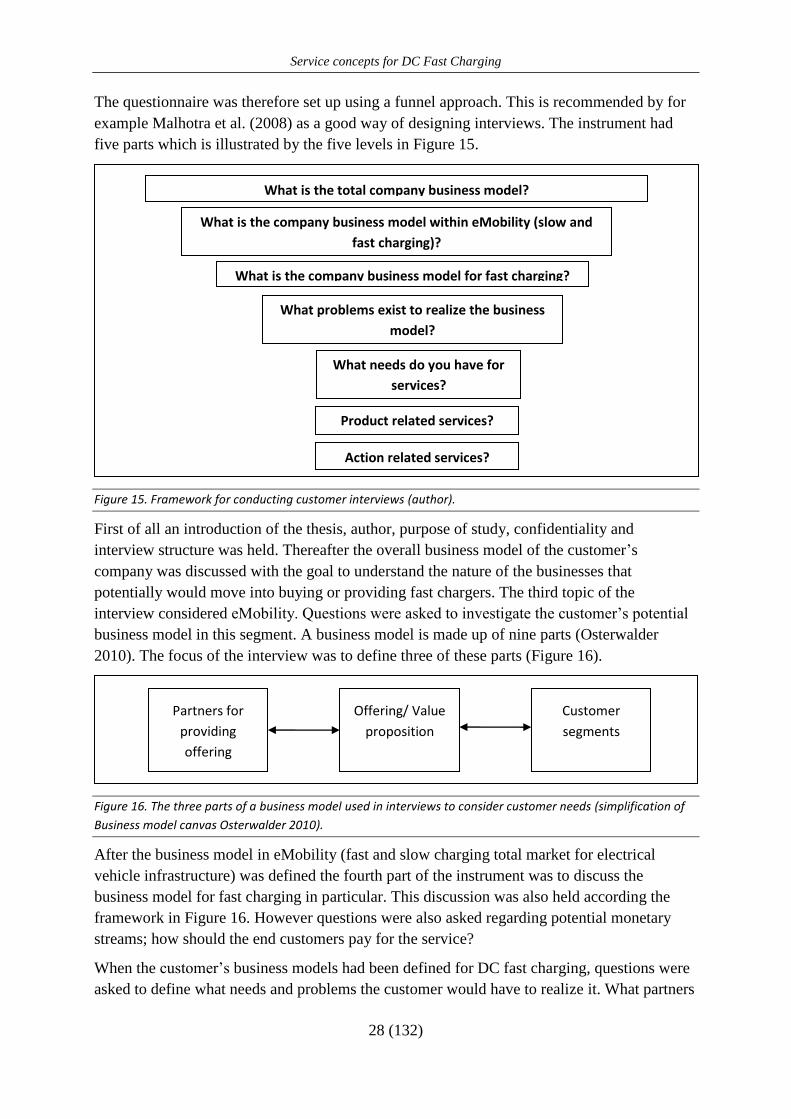
Service concepts for DC Fast Charging
28 (132)
The questionnaire was therefore set up using a funnel approach. This is recommended by for
example Malhotra et al. (2008) as a good way of designing interviews. The instrument had
five parts which is illustrated by the five levels in Figure 15.
Figure 15. Framework for conducting customer interviews (author).
First of all an introduction of the thesis, author, purpose of study, confidentiality and
interview structure was held. Thereafter the overall business model of the customer’s
company was discussed with the goal to understand the nature of the businesses that
potentially would move into buying or providing fast chargers. The third topic of the
interview considered eMobility. Questions were asked to investigate the customer’s potential
business model in this segment. A business model is made up of nine parts (Osterwalder
2010). The focus of the interview was to define three of these parts (Figure 16).
Figure 16. The three parts of a business model used in interviews to consider customer needs (simplification of
Business model canvas Osterwalder 2010).
After the business model in eMobility (fast and slow charging total market for electrical
vehicle infrastructure) was defined the fourth part of the instrument was to discuss the
business model for fast charging in particular. This discussion was also held according the
framework in Figure 16. However questions were also asked regarding potential monetary
streams; how should the end customers pay for the service?
When the customer’s business models had been defined for DC fast charging, questions were
asked to define what needs and problems the customer would have to realize it. What partners
Offering/ Value
proposition
Customer
segments
Partners for
providing
offering
What is the total company business model?
What is the company business model within eMobility (slow and
fast charging)?
What is the company business model for fast charging?
What problems exist to realize the business
model?
What needs do you have for
services?
Product related services?
Action related services?
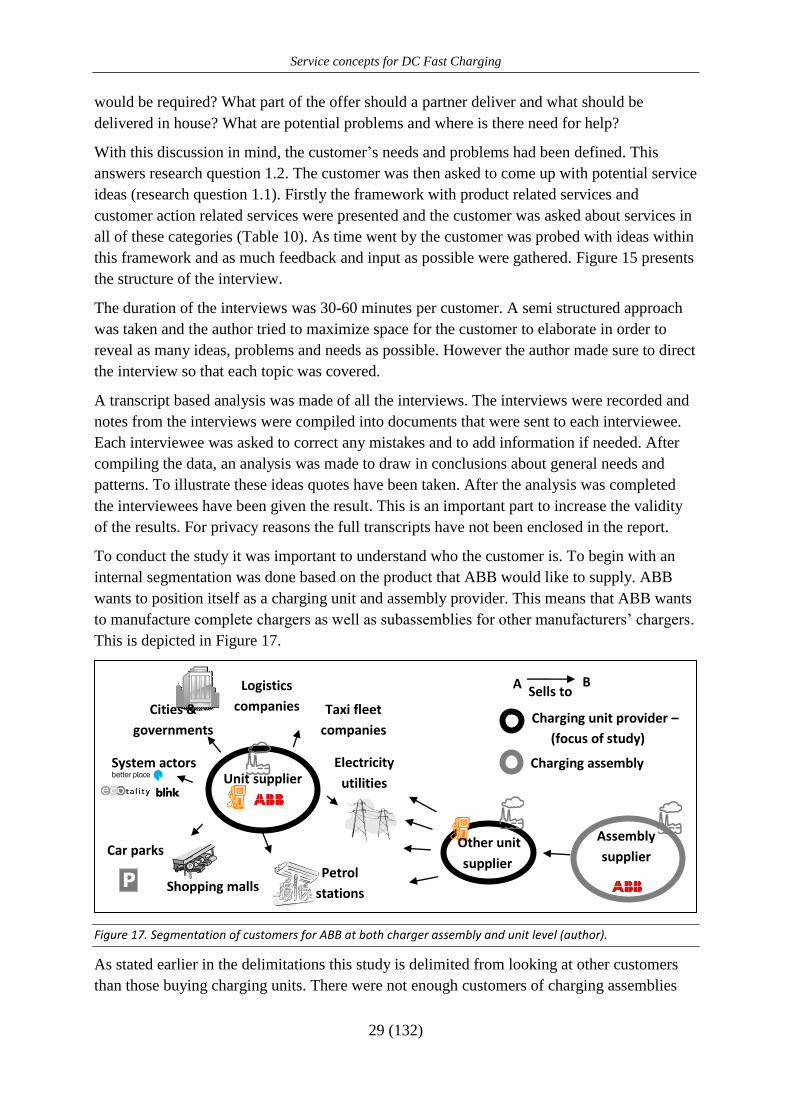
Service concepts for DC Fast Charging
29 (132)
would be required? What part of the offer should a partner deliver and what should be
delivered in house? What are potential problems and where is there need for help?
With this discussion in mind, the customer’s needs and problems had been defined. This
answers research question 1.2. The customer was then asked to come up with potential service
ideas (research question 1.1). Firstly the framework with product related services and
customer action related services were presented and the customer was asked about services in
all of these categories (Table 10). As time went by the customer was probed with ideas within
this framework and as much feedback and input as possible were gathered. Figure 15 presents
the structure of the interview.
The duration of the interviews was 30-60 minutes per customer. A semi structured approach
was taken and the author tried to maximize space for the customer to elaborate in order to
reveal as many ideas, problems and needs as possible. However the author made sure to direct
the interview so that each topic was covered.
A transcript based analysis was made of all the interviews. The interviews were recorded and
notes from the interviews were compiled into documents that were sent to each interviewee.
Each interviewee was asked to correct any mistakes and to add information if needed. After
compiling the data, an analysis was made to draw in conclusions about general needs and
patterns. To illustrate these ideas quotes have been taken. After the analysis was completed
the interviewees have been given the result. This is an important part to increase the validity
of the results. For privacy reasons the full transcripts have not been enclosed in the report.
To conduct the study it was important to understand who the customer is. To begin with an
internal segmentation was done based on the product that ABB would like to supply. ABB
wants to position itself as a charging unit and assembly provider. This means that ABB wants
to manufacture complete chargers as well as subassemblies for other manufacturers’ chargers.
This is depicted in Figure 17.
Figure 17. Segmentation of customers for ABB at both charger assembly and unit level (author).
As stated earlier in the delimitations this study is delimited from looking at other customers
than those buying charging units. There were not enough customers of charging assemblies
Unit supplier System actors Electricity
utilities
Cities &
governments
Taxi fleet
companies
Petrol
stations Shopping malls
Car parks Other unit
supplier
Assembly
supplier
Charging unit provider –
(focus of study)
Charging assembly
provider
Logistics
companies
A Sells to
B
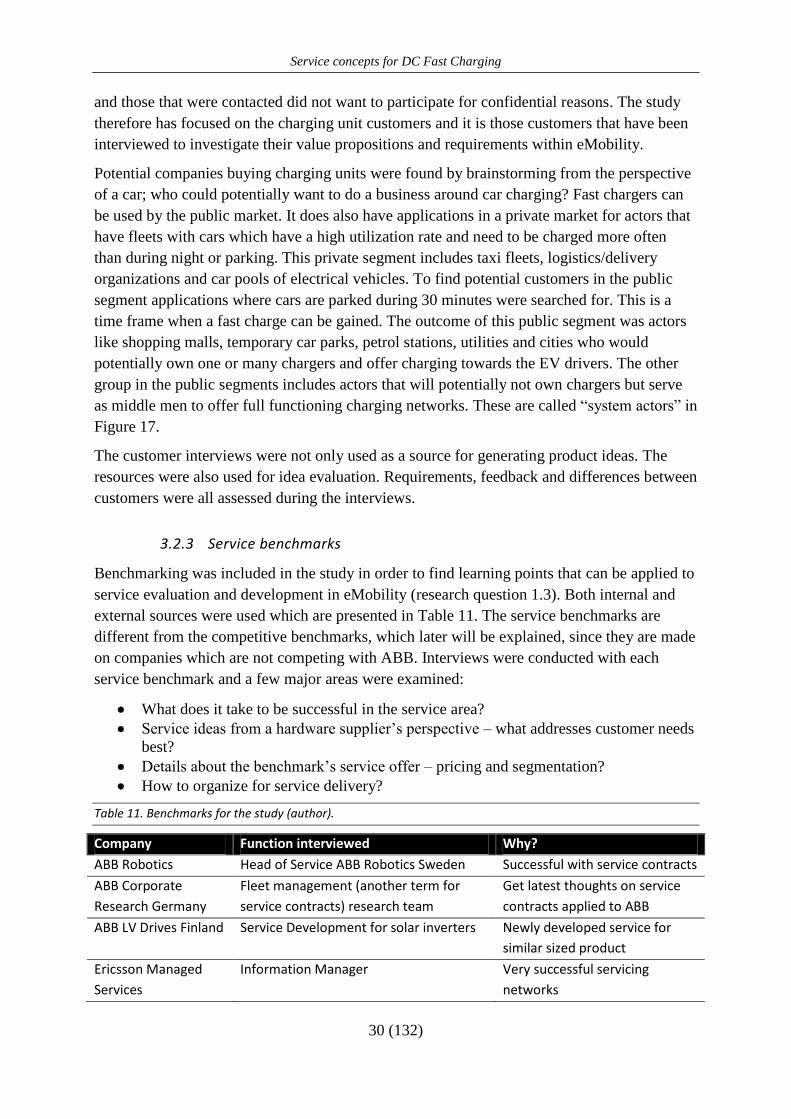
Service concepts for DC Fast Charging
30 (132)
and those that were contacted did not want to participate for confidential reasons. The study
therefore has focused on the charging unit customers and it is those customers that have been
interviewed to investigate their value propositions and requirements within eMobility.
Potential companies buying charging units were found by brainstorming from the perspective
of a car; who could potentially want to do a business around car charging? Fast chargers can
be used by the public market. It does also have applications in a private market for actors that
have fleets with cars which have a high utilization rate and need to be charged more often
than during night or parking. This private segment includes taxi fleets, logistics/delivery
organizations and car pools of electrical vehicles. To find potential customers in the public
segment applications where cars are parked during 30 minutes were searched for. This is a
time frame when a fast charge can be gained. The outcome of this public segment was actors
like shopping malls, temporary car parks, petrol stations, utilities and cities who would
potentially own one or many chargers and offer charging towards the EV drivers. The other
group in the public segments includes actors that will potentially not own chargers but serve
as middle men to offer full functioning charging networks. These are called “system actors” in
Figure 17.
The customer interviews were not only used as a source for generating product ideas. The
resources were also used for idea evaluation. Requirements, feedback and differences between
customers were all assessed during the interviews.
3.2.3 Service benchmarks
Benchmarking was included in the study in order to find learning points that can be applied to
service evaluation and development in eMobility (research question 1.3). Both internal and
external sources were used which are presented in Table 11. The service benchmarks are
different from the competitive benchmarks, which later will be explained, since they are made
on companies which are not competing with ABB. Interviews were conducted with each
service benchmark and a few major areas were examined:
What does it take to be successful in the service area?
Service ideas from a hardware supplier’s perspective – what addresses customer needs
best?
Details about the benchmark’s service offer – pricing and segmentation?
How to organize for service delivery?
Table 11. Benchmarks for the study (author).
Company Function interviewed Why?
ABB Robotics Head of Service ABB Robotics Sweden Successful with service contracts
ABB Corporate
Research Germany
Fleet management (another term for
service contracts) research team
Get latest thoughts on service
contracts applied to ABB
ABB LV Drives Finland Service Development for solar inverters Newly developed service for
similar sized product
Ericsson Managed
Services
Information Manager Very successful servicing
networks
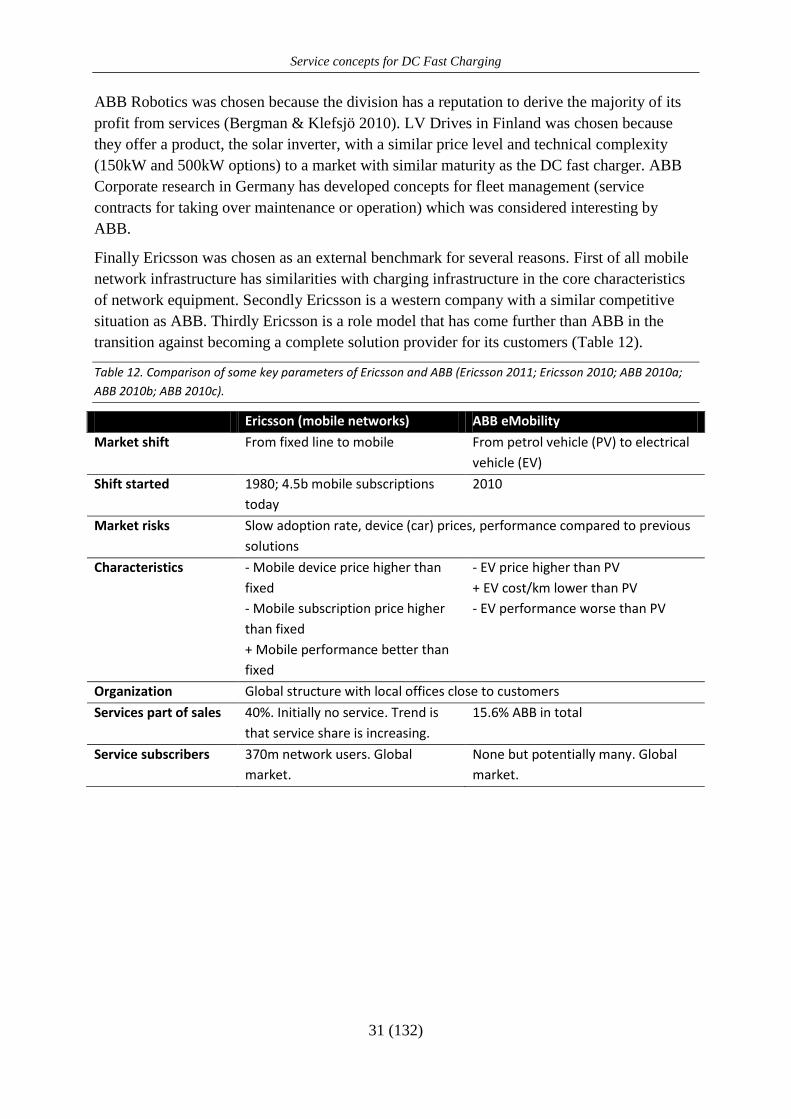
Service concepts for DC Fast Charging
31 (132)
ABB Robotics was chosen because the division has a reputation to derive the majority of its
profit from services (Bergman & Klefsjö 2010). LV Drives in Finland was chosen because
they offer a product, the solar inverter, with a similar price level and technical complexity
(150kW and 500kW options) to a market with similar maturity as the DC fast charger. ABB
Corporate research in Germany has developed concepts for fleet management (service
contracts for taking over maintenance or operation) which was considered interesting by
ABB.
Finally Ericsson was chosen as an external benchmark for several reasons. First of all mobile
network infrastructure has similarities with charging infrastructure in the core characteristics
of network equipment. Secondly Ericsson is a western company with a similar competitive
situation as ABB. Thirdly Ericsson is a role model that has come further than ABB in the
transition against becoming a complete solution provider for its customers (Table 12).
Table 12. Comparison of some key parameters of Ericsson and ABB (Ericsson 2011; Ericsson 2010; ABB 2010a;
ABB 2010b; ABB 2010c).
Ericsson (mobile networks) ABB eMobility
Market shift From fixed line to mobile From petrol vehicle (PV) to electrical
vehicle (EV)
Shift started 1980; 4.5b mobile subscriptions
today
2010
Market risks Slow adoption rate, device (car) prices, performance compared to previous
solutions
Characteristics - Mobile device price higher than
fixed
- Mobile subscription price higher
than fixed
+ Mobile performance better than
fixed
- EV price higher than PV
+ EV cost/km lower than PV
- EV performance worse than PV
Organization Global structure with local offices close to customers
Services part of sales 40%. Initially no service. Trend is
that service share is increasing.
15.6% ABB in total
Service subscribers 370m network users. Global
market.
None but potentially many. Global
market.
Service concepts for DC Fast Charging
32 (132)
3.3 IDEA EVALUATION
To evaluate the ideas and present decision support material for concept development, three
methods were used; a customer survey, an internal survey and competitive benchmarks. The
surveys were of quantitative nature and the competitive benchmarks qualitative based on
secondary data.
3.3.1 Customer survey
In order to examine the customers’ preferences for particular service concepts (research
question 2.1) a Kano survey was conducted. The concept behind a Kano survey was
previously described in the theory chapter. The survey is a useful way to get customer
feedback in a consistent manor on different service attributes. The Kano survey was designed
around the framework of ideas generated in the brainstorming session.
The same set of service ideas was used in all surveys. Even though potentially new ideas were
gathered during the customer interviews these were not added to the survey since the same
survey needed to be given to all customers for consistency. The ideas found during the
customer interviews all fitted to some degree with the ideas from the internal brainstorming
session. No service idea was therefore left out from evaluation. The total number of ideas that
were surveyed amounted to 43. Of these, 26 were product related services over the product’s
life cycle, 10 action related service ideas towards the EV driver, 4 action related services
towards the charging station owner and 3 action related services towards the utility.
A Kano questionnaire has a special structure. It consists of two questions per attribute. The
first question asks how a customer would feel if an attribute/service idea is present
(functional). The second question asks how the customer would feel if the attribute/service
idea is not present (dysfunctional). Both questions are answered with a special categorical
scale with five options (Matzler et al. 1996):
I like it that way
It must be that way
I am neutral
I can live with it that way
I dislike it that way
Since the questionnaire had 43 attributes space needed to be taken into account as a long
questionnaire decreases the response rate (Malhotra et al. 2008). It was therefore decided to
use a table formatted questionnaire with the options as headings and the attributes as rows.
The question (functional or dysfunctional) was the same for each table. This does not provide
the same celerity as repeating the answer alternatives for each attribute; however the tradeoff
is worthwhile to get responses to the survey. An example of how the questions were
structured in provided in Table 13. To minimize bias due to misinterpretations the author
made clear instructions to each participant about how the questionnaire should be filled in.
To decrease the likelihood of misunderstandings in filling in the questionnaire it was
electronically distributed. Computer technology allows for instructions on each question as
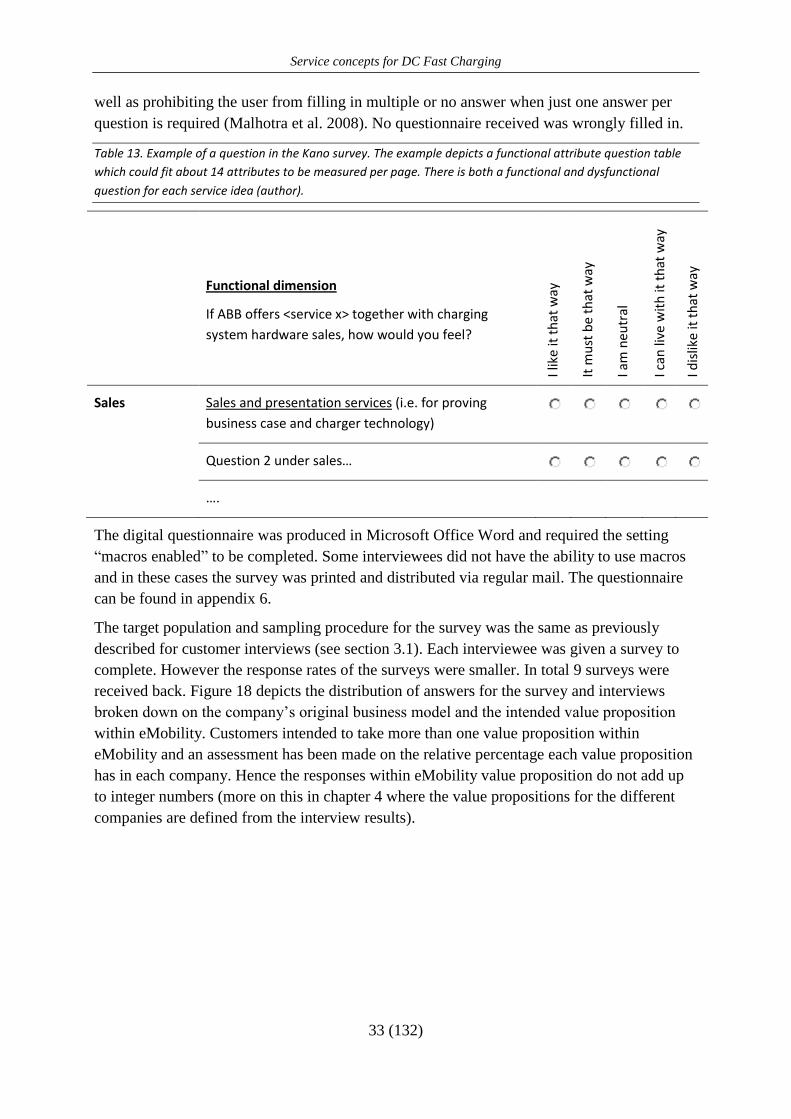
Service concepts for DC Fast Charging
33 (132)
well as prohibiting the user from filling in multiple or no answer when just one answer per
question is required (Malhotra et al. 2008). No questionnaire received was wrongly filled in.
Table 13. Example of a question in the Kano survey. The example depicts a functional attribute question table
which could fit about 14 attributes to be measured per page. There is both a functional and dysfunctional
question for each service idea (author).
Functional dimension
If ABB offers <service x> together with charging
system hardware sales, how would you feel?
I lik
e it
th
at w
ay
It m
ust
be
that
way
I am
neu
tral
I can
live
wit
h it
th
at w
ay
I dis
like
it t
hat
way
Sales Sales and presentation services (i.e. for proving
business case and charger technology)
Question 2 under sales…
….
The digital questionnaire was produced in Microsoft Office Word and required the setting
“macros enabled” to be completed. Some interviewees did not have the ability to use macros
and in these cases the survey was printed and distributed via regular mail. The questionnaire
can be found in appendix 6.
The target population and sampling procedure for the survey was the same as previously
described for customer interviews (see section 3.1). Each interviewee was given a survey to
complete. However the response rates of the surveys were smaller. In total 9 surveys were
received back. Figure 18 depicts the distribution of answers for the survey and interviews
broken down on the company’s original business model and the intended value proposition
within eMobility. Customers intended to take more than one value proposition within
eMobility and an assessment has been made on the relative percentage each value proposition
has in each company. Hence the responses within eMobility value proposition do not add up
to integer numbers (more on this in chapter 4 where the value propositions for the different
companies are defined from the interview results).
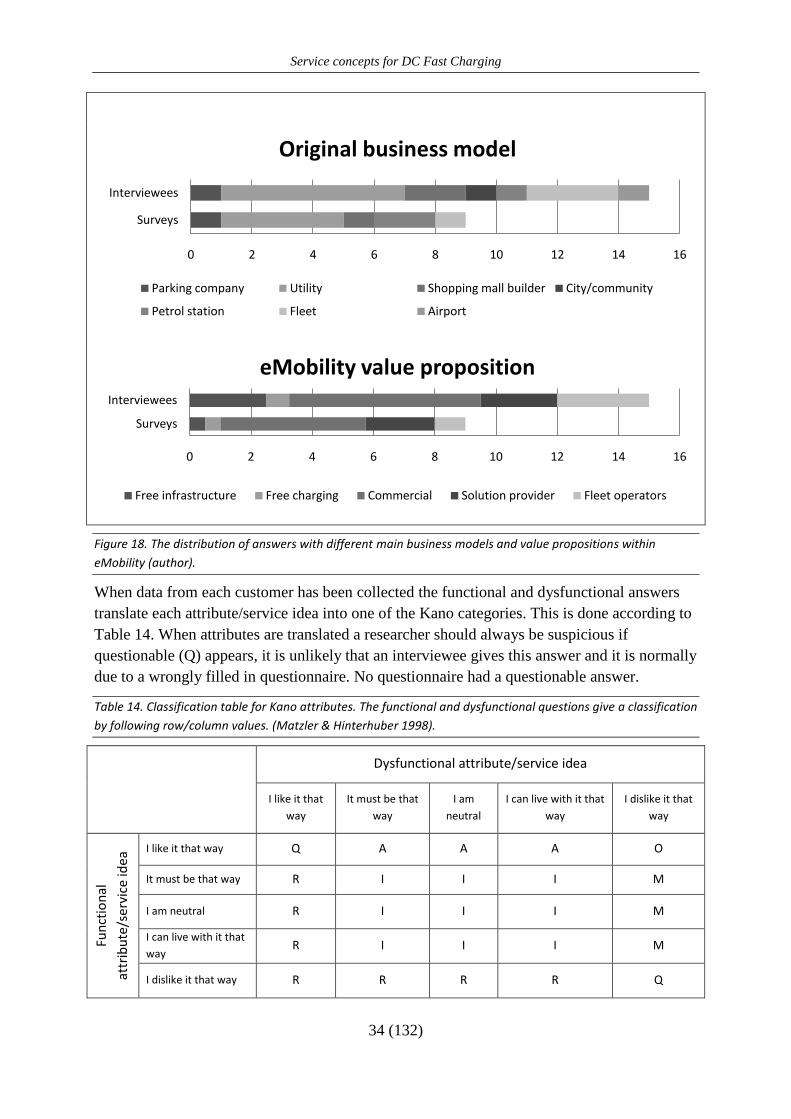
Service concepts for DC Fast Charging
34 (132)
Figure 18. The distribution of answers with different main business models and value propositions within
eMobility (author).
When data from each customer has been collected the functional and dysfunctional answers
translate each attribute/service idea into one of the Kano categories. This is done according to
Table 14. When attributes are translated a researcher should always be suspicious if
questionable (Q) appears, it is unlikely that an interviewee gives this answer and it is normally
due to a wrongly filled in questionnaire. No questionnaire had a questionable answer.
Table 14. Classification table for Kano attributes. The functional and dysfunctional questions give a classification
by following row/column values. (Matzler & Hinterhuber 1998).
Dysfunctional attribute/service idea
I like it that
way
It must be that
way
I am
neutral
I can live with it that
way
I dislike it that
way
Fun
ctio
nal
attr
ibu
te/s
ervi
ce id
ea I like it that way Q A A A O
It must be that way R I I I M
I am neutral R I I I M
I can live with it that
way R I I I M
I dislike it that way R R R R Q
0 2 4 6 8 10 12 14 16
Surveys
Interviewees
Original business model
Parking company Utility Shopping mall builder City/community
Petrol station Fleet Airport
0 2 4 6 8 10 12 14 16
Surveys
Interviewees
eMobility value proposition
Free infrastructure Free charging Commercial Solution provider Fleet operators
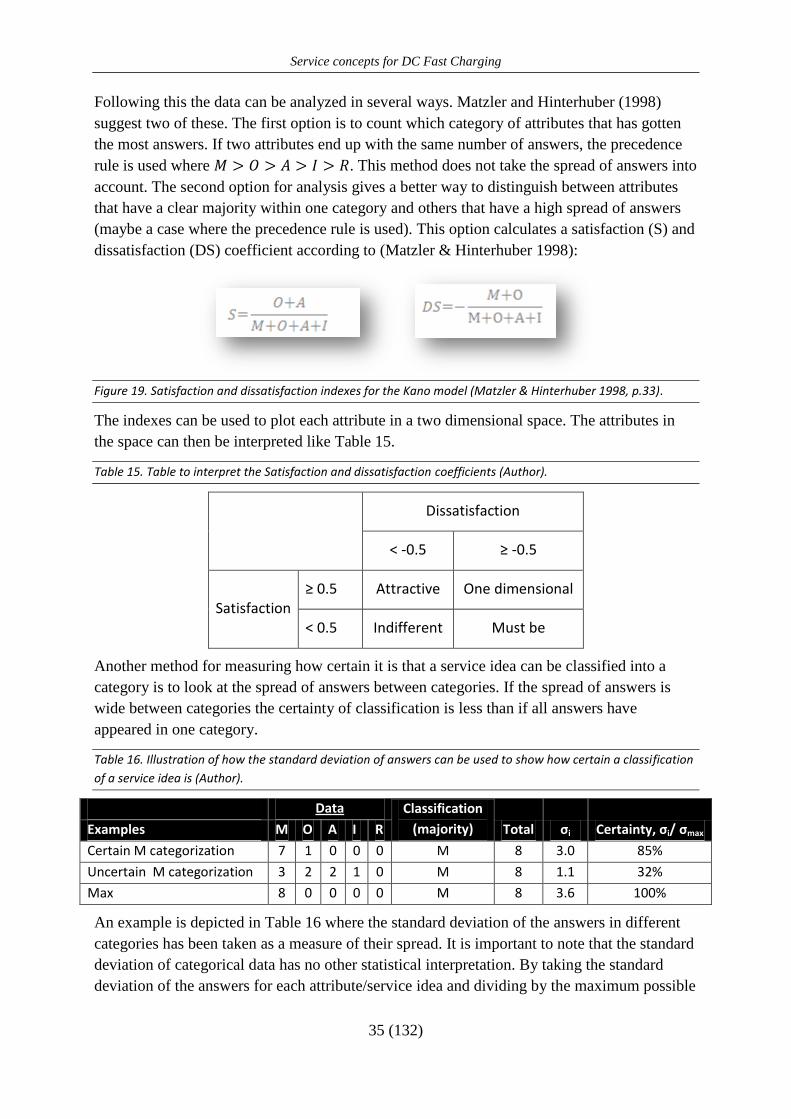
Service concepts for DC Fast Charging
35 (132)
Following this the data can be analyzed in several ways. Matzler and Hinterhuber (1998)
suggest two of these. The first option is to count which category of attributes that has gotten
the most answers. If two attributes end up with the same number of answers, the precedence
rule is used where . This method does not take the spread of answers into
account. The second option for analysis gives a better way to distinguish between attributes
that have a clear majority within one category and others that have a high spread of answers
(maybe a case where the precedence rule is used). This option calculates a satisfaction (S) and
dissatisfaction (DS) coefficient according to (Matzler & Hinterhuber 1998):
Figure 19. Satisfaction and dissatisfaction indexes for the Kano model (Matzler & Hinterhuber 1998, p.33).
The indexes can be used to plot each attribute in a two dimensional space. The attributes in
the space can then be interpreted like Table 15.
Table 15. Table to interpret the Satisfaction and dissatisfaction coefficients (Author).
Dissatisfaction
< -0.5 ≥ -0.5
Satisfaction ≥ 0.5 Attractive One dimensional
< 0.5 Indifferent Must be
Another method for measuring how certain it is that a service idea can be classified into a
category is to look at the spread of answers between categories. If the spread of answers is
wide between categories the certainty of classification is less than if all answers have
appeared in one category.
Table 16. Illustration of how the standard deviation of answers can be used to show how certain a classification
of a service idea is (Author).
Data Classification
(majority) Total σi Certainty, σi/ σmax Examples M O A I R
Certain M categorization 7 1 0 0 0 M 8 3.0 85%
Uncertain M categorization 3 2 2 1 0 M 8 1.1 32%
Max 8 0 0 0 0 M 8 3.6 100%
An example is depicted in Table 16 where the standard deviation of the answers in different
categories has been taken as a measure of their spread. It is important to note that the standard
deviation of categorical data has no other statistical interpretation. By taking the standard
deviation of the answers for each attribute/service idea and dividing by the maximum possible
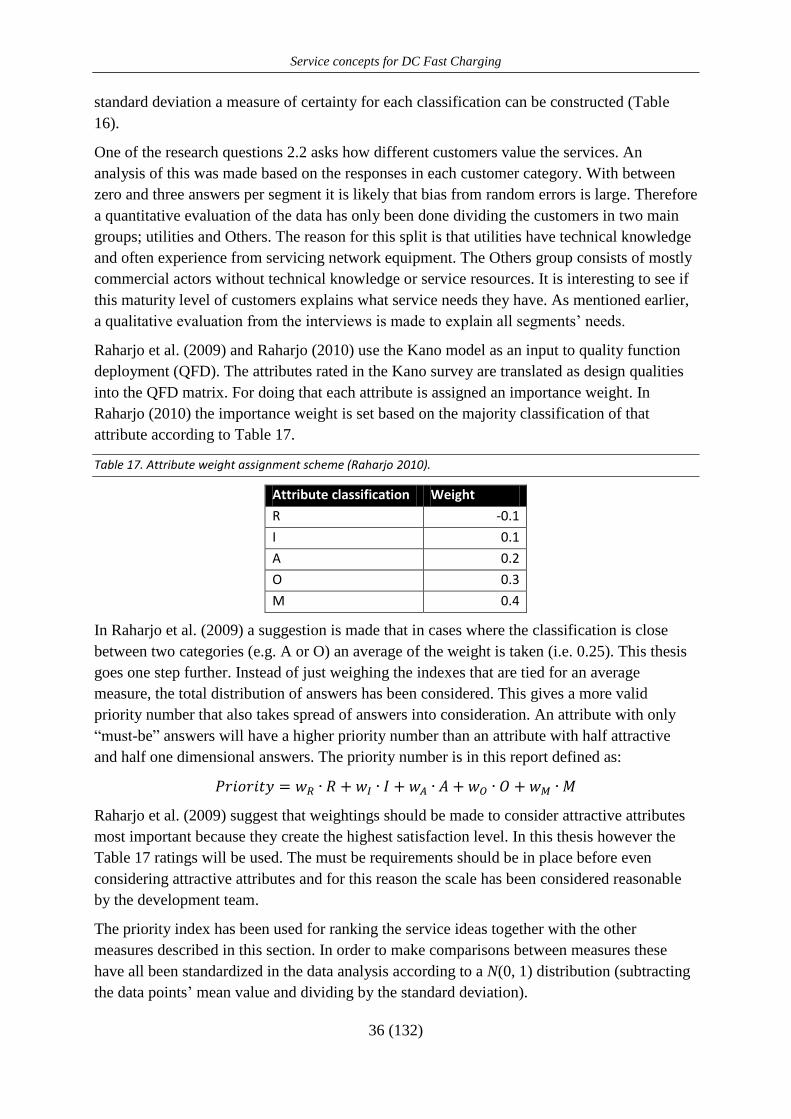
Service concepts for DC Fast Charging
36 (132)
standard deviation a measure of certainty for each classification can be constructed (Table
16).
One of the research questions 2.2 asks how different customers value the services. An
analysis of this was made based on the responses in each customer category. With between
zero and three answers per segment it is likely that bias from random errors is large. Therefore
a quantitative evaluation of the data has only been done dividing the customers in two main
groups; utilities and Others. The reason for this split is that utilities have technical knowledge
and often experience from servicing network equipment. The Others group consists of mostly
commercial actors without technical knowledge or service resources. It is interesting to see if
this maturity level of customers explains what service needs they have. As mentioned earlier,
a qualitative evaluation from the interviews is made to explain all segments’ needs.
Raharjo et al. (2009) and Raharjo (2010) use the Kano model as an input to quality function
deployment (QFD). The attributes rated in the Kano survey are translated as design qualities
into the QFD matrix. For doing that each attribute is assigned an importance weight. In
Raharjo (2010) the importance weight is set based on the majority classification of that
attribute according to Table 17.
Table 17. Attribute weight assignment scheme (Raharjo 2010).
Attribute classification Weight
R -0.1
I 0.1
A 0.2
O 0.3
M 0.4
In Raharjo et al. (2009) a suggestion is made that in cases where the classification is close
between two categories (e.g. A or O) an average of the weight is taken (i.e. 0.25). This thesis
goes one step further. Instead of just weighing the indexes that are tied for an average
measure, the total distribution of answers has been considered. This gives a more valid
priority number that also takes spread of answers into consideration. An attribute with only
“must-be” answers will have a higher priority number than an attribute with half attractive
and half one dimensional answers. The priority number is in this report defined as:
Raharjo et al. (2009) suggest that weightings should be made to consider attractive attributes
most important because they create the highest satisfaction level. In this thesis however the
Table 17 ratings will be used. The must be requirements should be in place before even
considering attractive attributes and for this reason the scale has been considered reasonable
by the development team.
The priority index has been used for ranking the service ideas together with the other
measures described in this section. In order to make comparisons between measures these
have all been standardized in the data analysis according to a N(0, 1) distribution (subtracting
the data points’ mean value and dividing by the standard deviation).
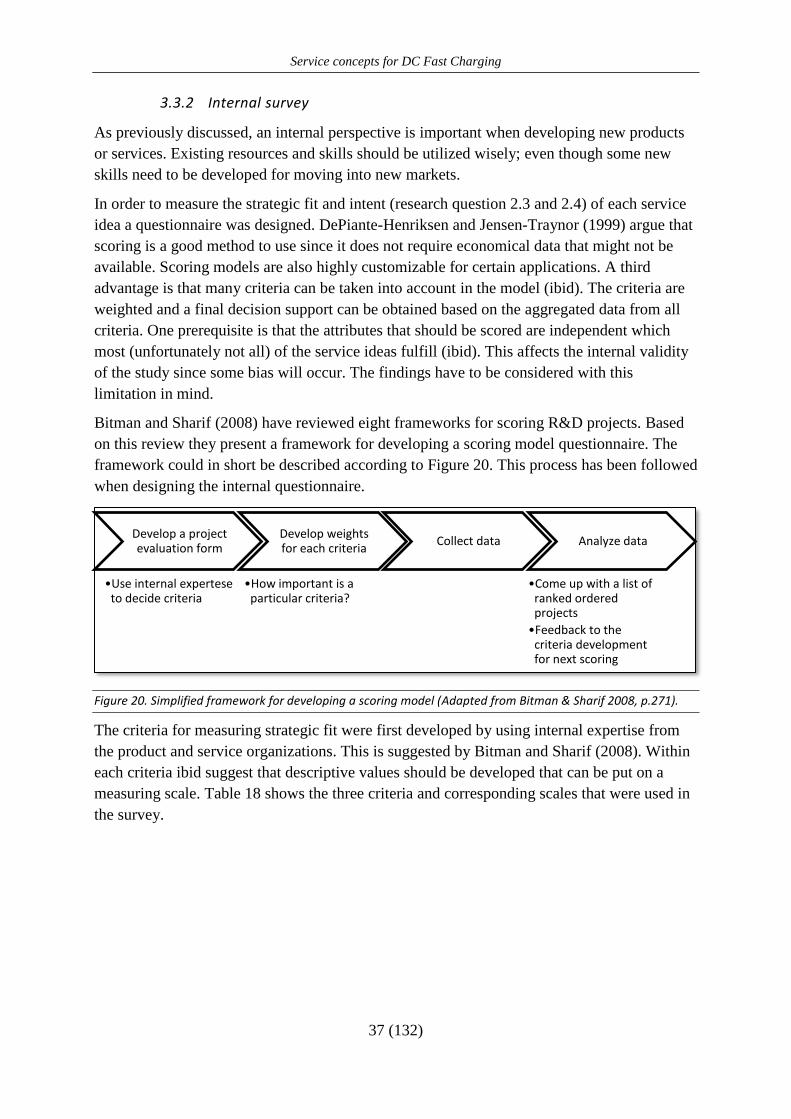
Service concepts for DC Fast Charging
37 (132)
3.3.2 Internal survey
As previously discussed, an internal perspective is important when developing new products
or services. Existing resources and skills should be utilized wisely; even though some new
skills need to be developed for moving into new markets.
In order to measure the strategic fit and intent (research question 2.3 and 2.4) of each service
idea a questionnaire was designed. DePiante-Henriksen and Jensen-Traynor (1999) argue that
scoring is a good method to use since it does not require economical data that might not be
available. Scoring models are also highly customizable for certain applications. A third
advantage is that many criteria can be taken into account in the model (ibid). The criteria are
weighted and a final decision support can be obtained based on the aggregated data from all
criteria. One prerequisite is that the attributes that should be scored are independent which
most (unfortunately not all) of the service ideas fulfill (ibid). This affects the internal validity
of the study since some bias will occur. The findings have to be considered with this
limitation in mind.
Bitman and Sharif (2008) have reviewed eight frameworks for scoring R&D projects. Based
on this review they present a framework for developing a scoring model questionnaire. The
framework could in short be described according to Figure 20. This process has been followed
when designing the internal questionnaire.
Figure 20. Simplified framework for developing a scoring model (Adapted from Bitman & Sharif 2008, p.271).
The criteria for measuring strategic fit were first developed by using internal expertise from
the product and service organizations. This is suggested by Bitman and Sharif (2008). Within
each criteria ibid suggest that descriptive values should be developed that can be put on a
measuring scale. Table 18 shows the three criteria and corresponding scales that were used in
the survey.
Develop a project evaluation form
•Use internal expertese to decide criteria
Develop weights for each criteria
•How important is a particular criteria?
Collect data Analyze data
•Come up with a list of ranked ordered projects
•Feedback to the criteria development for next scoring
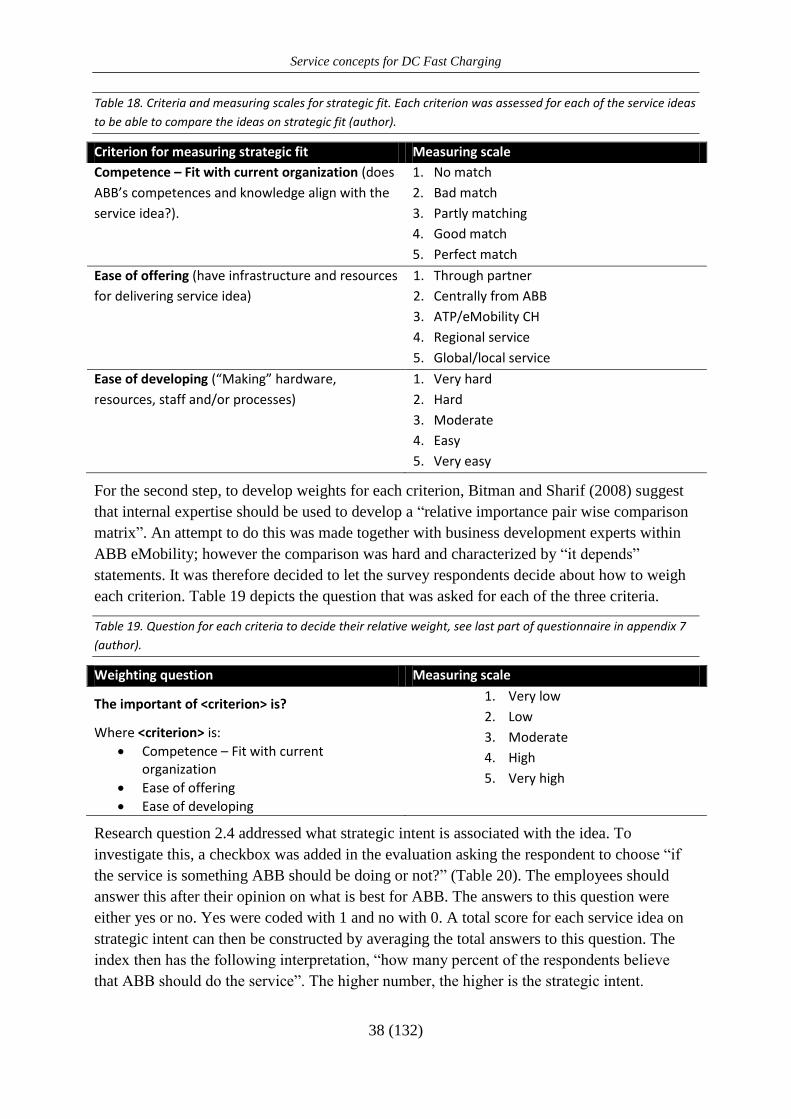
Service concepts for DC Fast Charging
38 (132)
Table 18. Criteria and measuring scales for strategic fit. Each criterion was assessed for each of the service ideas
to be able to compare the ideas on strategic fit (author).
Criterion for measuring strategic fit Measuring scale
Competence – Fit with current organization (does
ABB’s competences and knowledge align with the
service idea?).
1. No match
2. Bad match
3. Partly matching
4. Good match
5. Perfect match
Ease of offering (have infrastructure and resources
for delivering service idea)
1. Through partner
2. Centrally from ABB
3. ATP/eMobility CH
4. Regional service
5. Global/local service
Ease of developing (“Making” hardware,
resources, staff and/or processes)
1. Very hard
2. Hard
3. Moderate
4. Easy
5. Very easy
For the second step, to develop weights for each criterion, Bitman and Sharif (2008) suggest
that internal expertise should be used to develop a “relative importance pair wise comparison
matrix”. An attempt to do this was made together with business development experts within
ABB eMobility; however the comparison was hard and characterized by “it depends”
statements. It was therefore decided to let the survey respondents decide about how to weigh
each criterion. Table 19 depicts the question that was asked for each of the three criteria.
Table 19. Question for each criteria to decide their relative weight, see last part of questionnaire in appendix 7
(author).
Weighting question Measuring scale
The important of <criterion> is?
Where <criterion> is:
Competence – Fit with current organization
Ease of offering
Ease of developing
1. Very low
2. Low
3. Moderate
4. High
5. Very high
Research question 2.4 addressed what strategic intent is associated with the idea. To
investigate this, a checkbox was added in the evaluation asking the respondent to choose “if
the service is something ABB should be doing or not?” (Table 20). The employees should
answer this after their opinion on what is best for ABB. The answers to this question were
either yes or no. Yes were coded with 1 and no with 0. A total score for each service idea on
strategic intent can then be constructed by averaging the total answers to this question. The
index then has the following interpretation, “how many percent of the respondents believe
that ABB should do the service”. The higher number, the higher is the strategic intent.
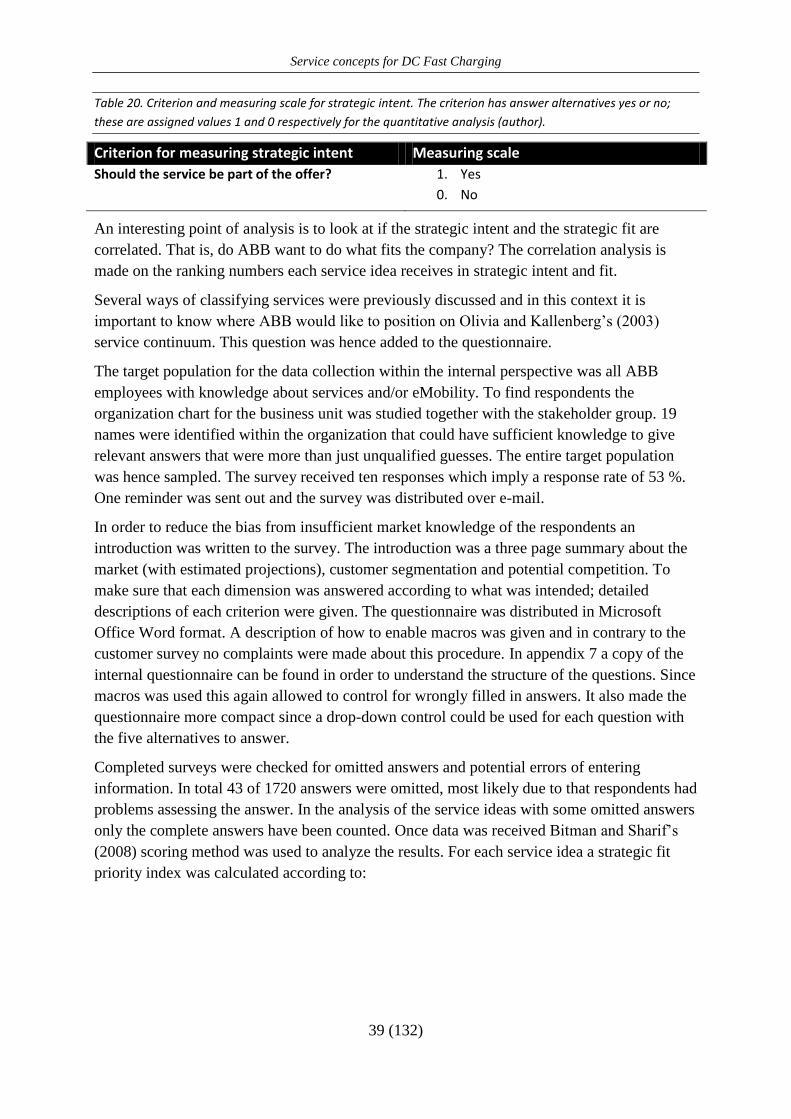
Service concepts for DC Fast Charging
39 (132)
Table 20. Criterion and measuring scale for strategic intent. The criterion has answer alternatives yes or no;
these are assigned values 1 and 0 respectively for the quantitative analysis (author).
Criterion for measuring strategic intent Measuring scale
Should the service be part of the offer? 1. Yes
0. No
An interesting point of analysis is to look at if the strategic intent and the strategic fit are
correlated. That is, do ABB want to do what fits the company? The correlation analysis is
made on the ranking numbers each service idea receives in strategic intent and fit.
Several ways of classifying services were previously discussed and in this context it is
important to know where ABB would like to position on Olivia and Kallenberg’s (2003)
service continuum. This question was hence added to the questionnaire.
The target population for the data collection within the internal perspective was all ABB
employees with knowledge about services and/or eMobility. To find respondents the
organization chart for the business unit was studied together with the stakeholder group. 19
names were identified within the organization that could have sufficient knowledge to give
relevant answers that were more than just unqualified guesses. The entire target population
was hence sampled. The survey received ten responses which imply a response rate of 53 %.
One reminder was sent out and the survey was distributed over e-mail.
In order to reduce the bias from insufficient market knowledge of the respondents an
introduction was written to the survey. The introduction was a three page summary about the
market (with estimated projections), customer segmentation and potential competition. To
make sure that each dimension was answered according to what was intended; detailed
descriptions of each criterion were given. The questionnaire was distributed in Microsoft
Office Word format. A description of how to enable macros was given and in contrary to the
customer survey no complaints were made about this procedure. In appendix 7 a copy of the
internal questionnaire can be found in order to understand the structure of the questions. Since
macros was used this again allowed to control for wrongly filled in answers. It also made the
questionnaire more compact since a drop-down control could be used for each question with
the five alternatives to answer.
Completed surveys were checked for omitted answers and potential errors of entering
information. In total 43 of 1720 answers were omitted, most likely due to that respondents had
problems assessing the answer. In the analysis of the service ideas with some omitted answers
only the complete answers have been counted. Once data was received Bitman and Sharif’s
(2008) scoring method was used to analyze the results. For each service idea a strategic fit
priority index was calculated according to:
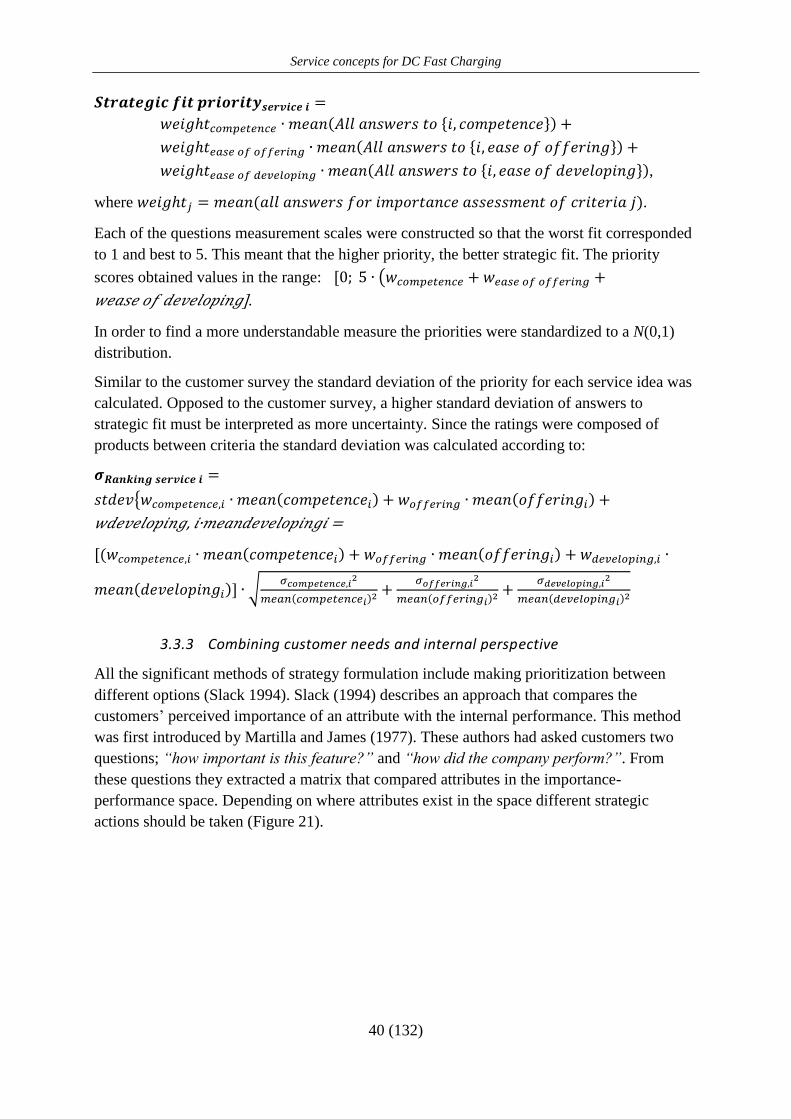
Service concepts for DC Fast Charging
40 (132)
,
where .
Each of the questions measurement scales were constructed so that the worst fit corresponded
to 1 and best to 5. This meant that the higher priority, the better strategic fit. The priority
scores obtained values in the range:
].
In order to find a more understandable measure the priorities were standardized to a N(0,1)
distribution.
Similar to the customer survey the standard deviation of the priority for each service idea was
calculated. Opposed to the customer survey, a higher standard deviation of answers to
strategic fit must be interpreted as more uncertainty. Since the ratings were composed of
products between criteria the standard deviation was calculated according to:
, =
3.3.3 Combining customer needs and internal perspective
All the significant methods of strategy formulation include making prioritization between
different options (Slack 1994). Slack (1994) describes an approach that compares the
customers’ perceived importance of an attribute with the internal performance. This method
was first introduced by Martilla and James (1977). These authors had asked customers two
questions; “how important is this feature?” and “how did the company perform?”. From
these questions they extracted a matrix that compared attributes in the importance-
performance space. Depending on where attributes exist in the space different strategic
actions should be taken (Figure 21).
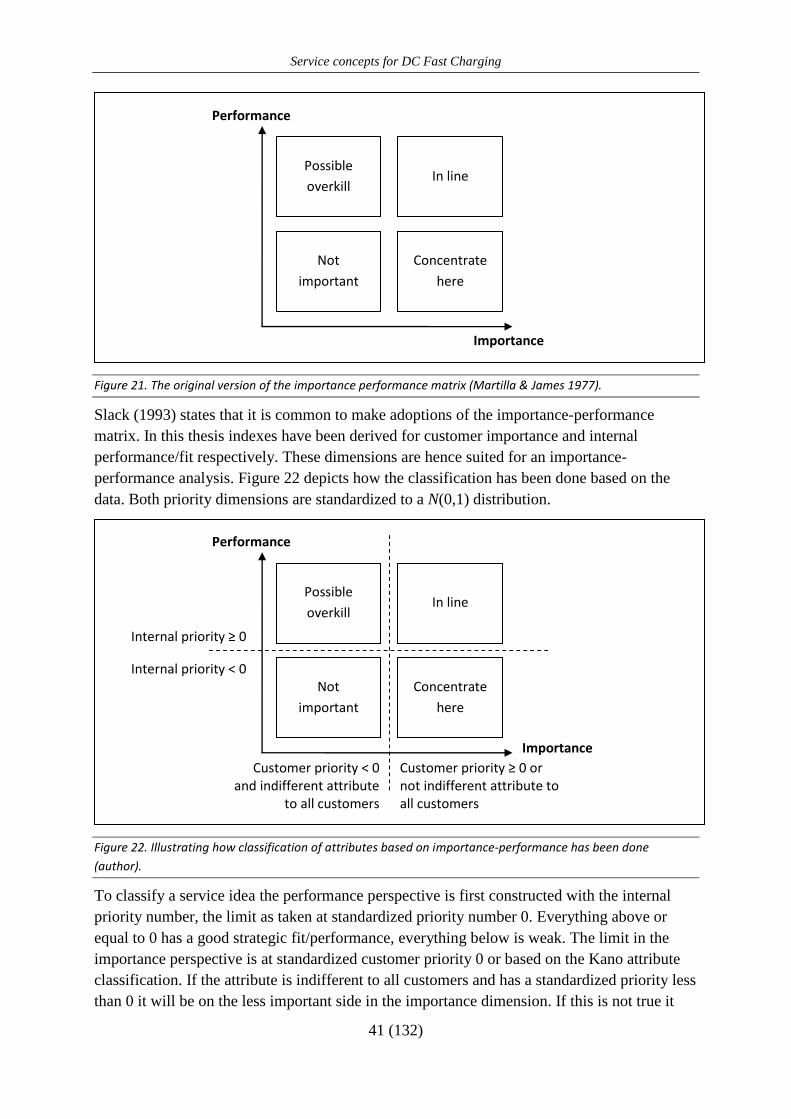
Service concepts for DC Fast Charging
41 (132)
Figure 21. The original version of the importance performance matrix (Martilla & James 1977).
Slack (1993) states that it is common to make adoptions of the importance-performance
matrix. In this thesis indexes have been derived for customer importance and internal
performance/fit respectively. These dimensions are hence suited for an importance-
performance analysis. Figure 22 depicts how the classification has been done based on the
data. Both priority dimensions are standardized to a N(0,1) distribution.
Figure 22. Illustrating how classification of attributes based on importance-performance has been done
(author).
To classify a service idea the performance perspective is first constructed with the internal
priority number, the limit as taken at standardized priority number 0. Everything above or
equal to 0 has a good strategic fit/performance, everything below is weak. The limit in the
importance perspective is at standardized customer priority 0 or based on the Kano attribute
classification. If the attribute is indifferent to all customers and has a standardized priority less
than 0 it will be on the less important side in the importance dimension. If this is not true it
Not
important
Possible
overkill
Concentrate
here
In line
Importance
Performance
Internal priority ≥ 0
Internal priority < 0
Customer priority < 0 and indifferent attribute
to all customers
Customer priority ≥ 0 or not indifferent attribute to all customers
Not
important
Possible
overkill
Concentrate
here
In line
Importance
Performance
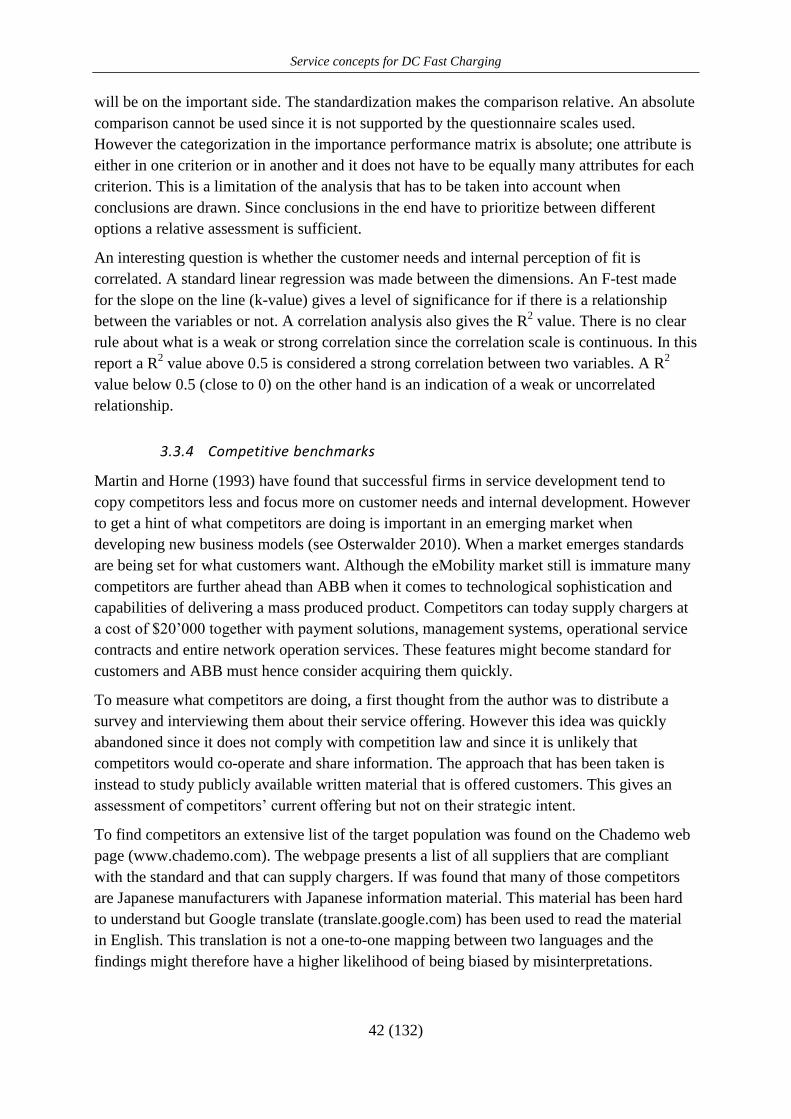
Service concepts for DC Fast Charging
42 (132)
will be on the important side. The standardization makes the comparison relative. An absolute
comparison cannot be used since it is not supported by the questionnaire scales used.
However the categorization in the importance performance matrix is absolute; one attribute is
either in one criterion or in another and it does not have to be equally many attributes for each
criterion. This is a limitation of the analysis that has to be taken into account when
conclusions are drawn. Since conclusions in the end have to prioritize between different
options a relative assessment is sufficient.
An interesting question is whether the customer needs and internal perception of fit is
correlated. A standard linear regression was made between the dimensions. An F-test made
for the slope on the line (k-value) gives a level of significance for if there is a relationship
between the variables or not. A correlation analysis also gives the R2 value. There is no clear
rule about what is a weak or strong correlation since the correlation scale is continuous. In this
report a R2 value above 0.5 is considered a strong correlation between two variables. A R
2
value below 0.5 (close to 0) on the other hand is an indication of a weak or uncorrelated
relationship.
3.3.4 Competitive benchmarks
Martin and Horne (1993) have found that successful firms in service development tend to
copy competitors less and focus more on customer needs and internal development. However
to get a hint of what competitors are doing is important in an emerging market when
developing new business models (see Osterwalder 2010). When a market emerges standards
are being set for what customers want. Although the eMobility market still is immature many
competitors are further ahead than ABB when it comes to technological sophistication and
capabilities of delivering a mass produced product. Competitors can today supply chargers at
a cost of $20’000 together with payment solutions, management systems, operational service
contracts and entire network operation services. These features might become standard for
customers and ABB must hence consider acquiring them quickly.
To measure what competitors are doing, a first thought from the author was to distribute a
survey and interviewing them about their service offering. However this idea was quickly
abandoned since it does not comply with competition law and since it is unlikely that
competitors would co-operate and share information. The approach that has been taken is
instead to study publicly available written material that is offered customers. This gives an
assessment of competitors’ current offering but not on their strategic intent.
To find competitors an extensive list of the target population was found on the Chademo web
page (www.chademo.com). The webpage presents a list of all suppliers that are compliant
with the standard and that can supply chargers. If was found that many of those competitors
are Japanese manufacturers with Japanese information material. This material has been hard
to understand but Google translate (translate.google.com) has been used to read the material
in English. This translation is not a one-to-one mapping between two languages and the
findings might therefore have a higher likelihood of being biased by misinterpretations.
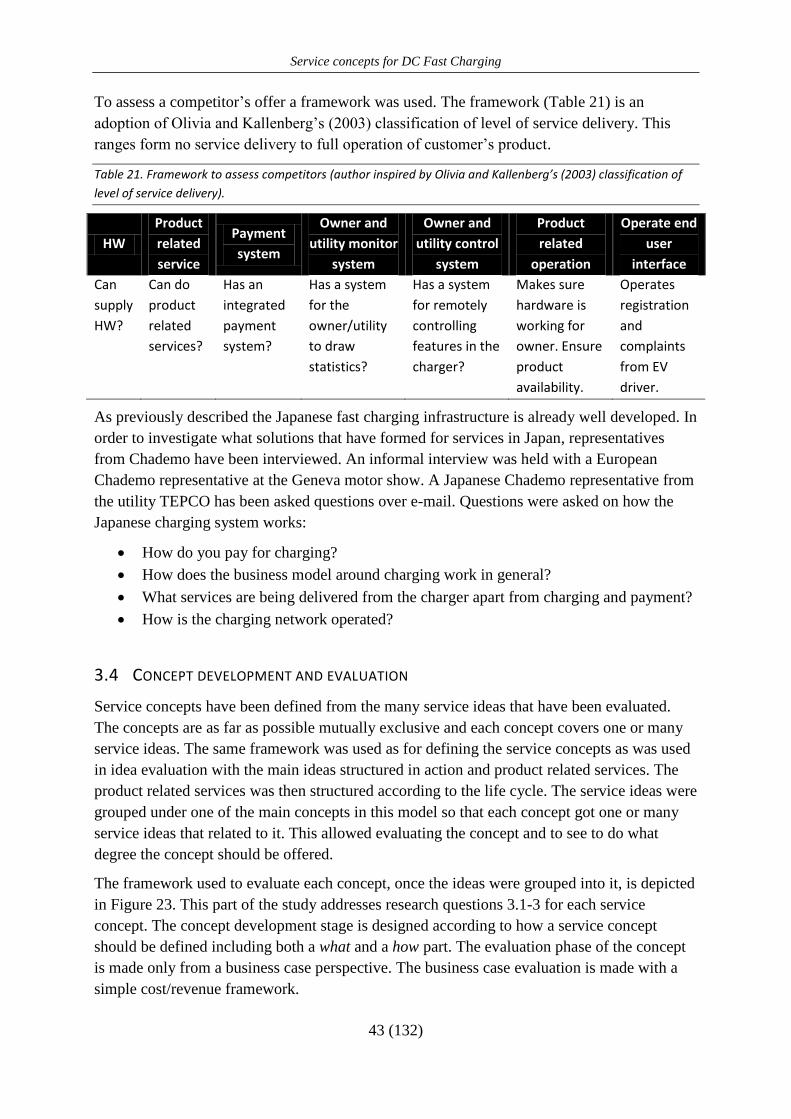
Service concepts for DC Fast Charging
43 (132)
To assess a competitor’s offer a framework was used. The framework (Table 21) is an
adoption of Olivia and Kallenberg’s (2003) classification of level of service delivery. This
ranges form no service delivery to full operation of customer’s product.
Table 21. Framework to assess competitors (author inspired by Olivia and Kallenberg’s (2003) classification of
level of service delivery).
HW
Product
related
service
Payment
system
Owner and
utility monitor
system
Owner and
utility control
system
Product
related
operation
Operate end
user
interface
Can
supply
HW?
Can do
product
related
services?
Has an
integrated
payment
system?
Has a system
for the
owner/utility
to draw
statistics?
Has a system
for remotely
controlling
features in the
charger?
Makes sure
hardware is
working for
owner. Ensure
product
availability.
Operates
registration
and
complaints
from EV
driver.
As previously described the Japanese fast charging infrastructure is already well developed. In
order to investigate what solutions that have formed for services in Japan, representatives
from Chademo have been interviewed. An informal interview was held with a European
Chademo representative at the Geneva motor show. A Japanese Chademo representative from
the utility TEPCO has been asked questions over e-mail. Questions were asked on how the
Japanese charging system works:
How do you pay for charging?
How does the business model around charging work in general?
What services are being delivered from the charger apart from charging and payment?
How is the charging network operated?
3.4 CONCEPT DEVELOPMENT AND EVALUATION
Service concepts have been defined from the many service ideas that have been evaluated.
The concepts are as far as possible mutually exclusive and each concept covers one or many
service ideas. The same framework was used as for defining the service concepts as was used
in idea evaluation with the main ideas structured in action and product related services. The
product related services was then structured according to the life cycle. The service ideas were
grouped under one of the main concepts in this model so that each concept got one or many
service ideas that related to it. This allowed evaluating the concept and to see to do what
degree the concept should be offered.
The framework used to evaluate each concept, once the ideas were grouped into it, is depicted
in Figure 23. This part of the study addresses research questions 3.1-3 for each service
concept. The concept development stage is designed according to how a service concept
should be defined including both a what and a how part. The evaluation phase of the concept
is made only from a business case perspective. The business case evaluation is made with a
simple cost/revenue framework.
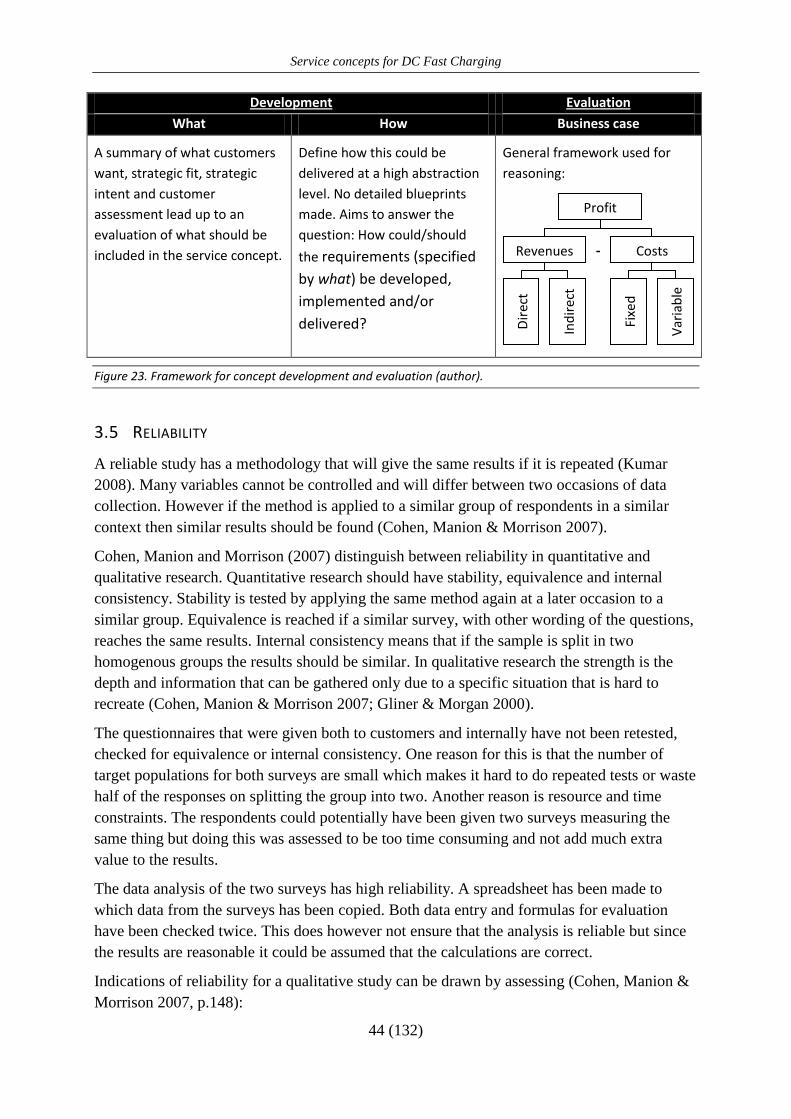
Service concepts for DC Fast Charging
44 (132)
Development Evaluation
What How Business case
A summary of what customers
want, strategic fit, strategic
intent and customer
assessment lead up to an
evaluation of what should be
included in the service concept.
Define how this could be
delivered at a high abstraction
level. No detailed blueprints
made. Aims to answer the
question: How could/should
the requirements (specified
by what) be developed,
implemented and/or
delivered?
General framework used for
reasoning:
Figure 23. Framework for concept development and evaluation (author).
3.5 RELIABILITY
A reliable study has a methodology that will give the same results if it is repeated (Kumar
2008). Many variables cannot be controlled and will differ between two occasions of data
collection. However if the method is applied to a similar group of respondents in a similar
context then similar results should be found (Cohen, Manion & Morrison 2007).
Cohen, Manion and Morrison (2007) distinguish between reliability in quantitative and
qualitative research. Quantitative research should have stability, equivalence and internal
consistency. Stability is tested by applying the same method again at a later occasion to a
similar group. Equivalence is reached if a similar survey, with other wording of the questions,
reaches the same results. Internal consistency means that if the sample is split in two
homogenous groups the results should be similar. In qualitative research the strength is the
depth and information that can be gathered only due to a specific situation that is hard to
recreate (Cohen, Manion & Morrison 2007; Gliner & Morgan 2000).
The questionnaires that were given both to customers and internally have not been retested,
checked for equivalence or internal consistency. One reason for this is that the number of
target populations for both surveys are small which makes it hard to do repeated tests or waste
half of the responses on splitting the group into two. Another reason is resource and time
constraints. The respondents could potentially have been given two surveys measuring the
same thing but doing this was assessed to be too time consuming and not add much extra
value to the results.
The data analysis of the two surveys has high reliability. A spreadsheet has been made to
which data from the surveys has been copied. Both data entry and formulas for evaluation
have been checked twice. This does however not ensure that the analysis is reliable but since
the results are reasonable it could be assumed that the calculations are correct.
Indications of reliability for a qualitative study can be drawn by assessing (Cohen, Manion &
Morrison 2007, p.148):
Revenues
Profit
Costs -
Dir
ect
Ind
irec
t
Var
iab
le
Fixe
d
Service concepts for DC Fast Charging
45 (132)
Stability – if the observations occurred in a different time frame, would the result be
the same?
Inter-rater reliability – would another researcher have drawn similar conclusions given
the same observations and theoretical background?
Given the fact that the brainstorming session and interviews have been designed and acted
according to questionnaires the data collection procedure can be repeated. Using the same
participants and interviewees would most likely yield the same or similar answers. However it
must be noted that idea generation and creativity to some extent is spontaneous and many
ideas could potentially have been discovered only because a certain situation or discussion
appeared. The interviews were semi structured around a framework of questions which makes
it hard to recreate the same questions. Also if the interviewees and brainstorm participants
would have been gathered today, a few months later, the participants have had time to learn
more about the topic and may give other answers. The internal participants would also be
biased by the findings the author has presented during his work.
The author believes that another researcher would have drawn similar conclusions from the
data. Transcripts are available of the interviews and brainstorms from where conclusions can
be drawn. These are available for internal assessment, so that anyone can go over the findings.
Stakeholder meetings have been held continuously to discuss the findings in order to reach a
common logical interpretation. The conclusions that have been made are further strengthened
by using quotes from the original data.
3.6 VALIDITY
A valid methodology measures exactly what the purpose claims should be measured (Kumar
2008). Validity can be split into internal and external validity. External validity “is the
condition permitting the generalization or inference of the sample finding to the population
from which the sample was selected” (Singh & Bajpai 2008, p.135). External validity hence
has to do with how sampling is made and to what extent the findings from the sample could
be generalized to a larger population. Internal validity on the other hand means how variables
have been controlled during an experiment (Singh & Bajpai 2008).
The brainstorming and internal survey have a high external validity. A majority of the
employees who could have knowledge in the field were present during the brainstorm and the
internal survey had a reasonably high response-rate within the internal stakeholder group.
There is no reason to believe that the 47% of non-respondents would have a different opinion
than the respondents, however this has not been further investigated (which according to
Malhotra et al. 2008 could be done to increase validity).
The goal of the customer interviews was to access needs and problems in different segments
in order to find ideas for services. With this objective in mind the results from interviews are
probably valid. The author got the feeling that interviewees with similar business models
addressed the same problems and that an exhaustive list of ideas to a high degree was reached.
If customer segments are homogenous (in this case representing the same type of customer) it
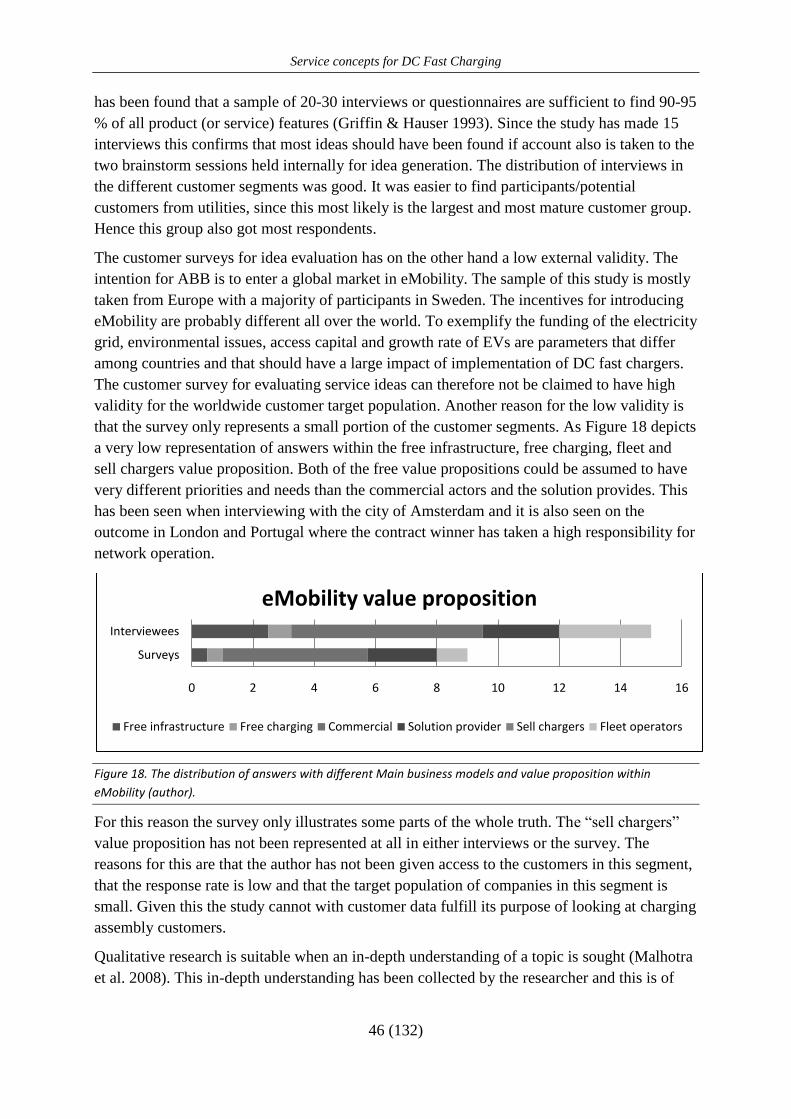
Service concepts for DC Fast Charging
46 (132)
has been found that a sample of 20-30 interviews or questionnaires are sufficient to find 90-95
% of all product (or service) features (Griffin & Hauser 1993). Since the study has made 15
interviews this confirms that most ideas should have been found if account also is taken to the
two brainstorm sessions held internally for idea generation. The distribution of interviews in
the different customer segments was good. It was easier to find participants/potential
customers from utilities, since this most likely is the largest and most mature customer group.
Hence this group also got most respondents.
The customer surveys for idea evaluation has on the other hand a low external validity. The
intention for ABB is to enter a global market in eMobility. The sample of this study is mostly
taken from Europe with a majority of participants in Sweden. The incentives for introducing
eMobility are probably different all over the world. To exemplify the funding of the electricity
grid, environmental issues, access capital and growth rate of EVs are parameters that differ
among countries and that should have a large impact of implementation of DC fast chargers.
The customer survey for evaluating service ideas can therefore not be claimed to have high
validity for the worldwide customer target population. Another reason for the low validity is
that the survey only represents a small portion of the customer segments. As Figure 18 depicts
a very low representation of answers within the free infrastructure, free charging, fleet and
sell chargers value proposition. Both of the free value propositions could be assumed to have
very different priorities and needs than the commercial actors and the solution provides. This
has been seen when interviewing with the city of Amsterdam and it is also seen on the
outcome in London and Portugal where the contract winner has taken a high responsibility for
network operation.
Figure 18. The distribution of answers with different Main business models and value proposition within
eMobility (author).
For this reason the survey only illustrates some parts of the whole truth. The “sell chargers”
value proposition has not been represented at all in either interviews or the survey. The
reasons for this are that the author has not been given access to the customers in this segment,
that the response rate is low and that the target population of companies in this segment is
small. Given this the study cannot with customer data fulfill its purpose of looking at charging
assembly customers.
Qualitative research is suitable when an in-depth understanding of a topic is sought (Malhotra
et al. 2008). This in-depth understanding has been collected by the researcher and this is of
0 2 4 6 8 10 12 14 16
Surveys
Interviewees
eMobility value proposition
Free infrastructure Free charging Commercial Solution provider Sell chargers Fleet operators

Service concepts for DC Fast Charging
47 (132)
value when evaluation is done. The value of this cannot be disregarded in concept evaluation,
even though it is not measured in validity terms.
Internal validity has been increased by cross checking the results with customers after a draft
of the report was written. Notes from the interviews have been given to participants for
commenting, changing misunderstandings and adding information that might have been left
out. The results from the survey and interviews have also been shared with participants. This
has increased both the validity of the results as well as ensured that customers have given
consent of the information to be published. For confidentiality reasons it was in
correspondence with the customers decided that company names should not be published in
the report.

Service concepts for DC Fast Charging
48 (132)
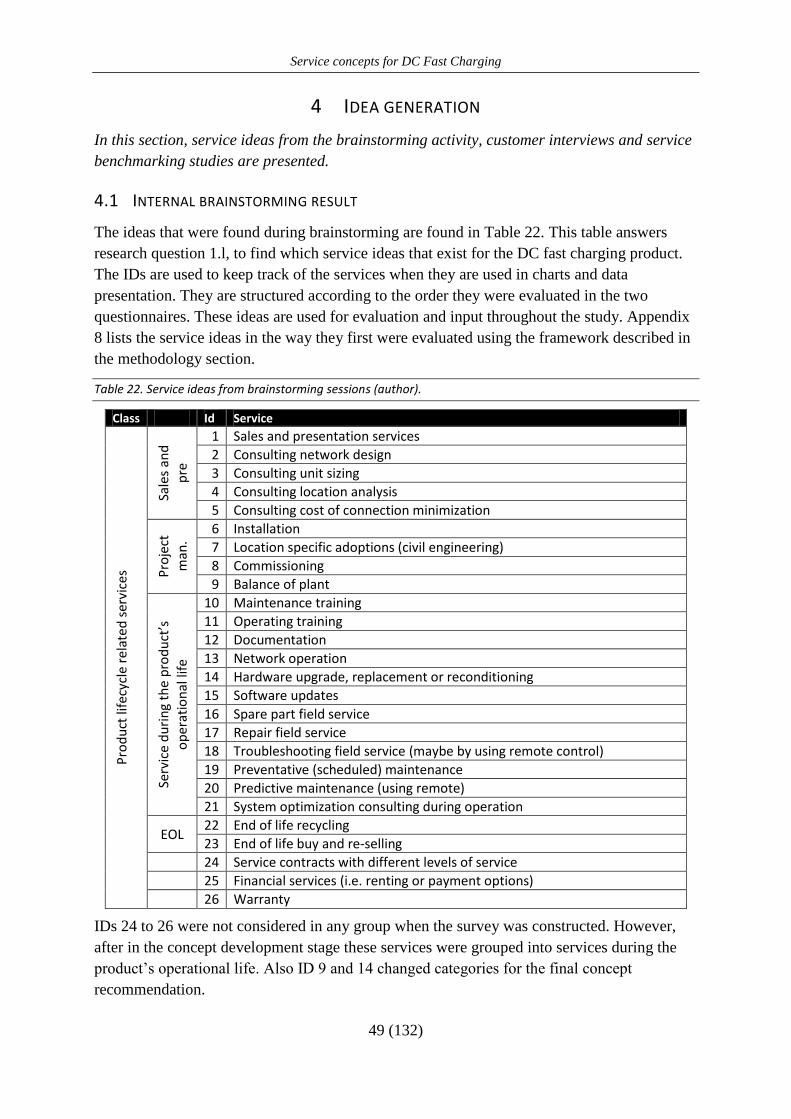
Service concepts for DC Fast Charging
49 (132)
4 IDEA GENERATION
In this section, service ideas from the brainstorming activity, customer interviews and service
benchmarking studies are presented.
4.1 INTERNAL BRAINSTORMING RESULT
The ideas that were found during brainstorming are found in Table 22. This table answers
research question 1.l, to find which service ideas that exist for the DC fast charging product.
The IDs are used to keep track of the services when they are used in charts and data
presentation. They are structured according to the order they were evaluated in the two
questionnaires. These ideas are used for evaluation and input throughout the study. Appendix
8 lists the service ideas in the way they first were evaluated using the framework described in
the methodology section.
Table 22. Service ideas from brainstorming sessions (author).
Class Id Service
Pro
du
ct li
fecy
cle
rela
ted
ser
vice
s
Sale
s an
d
pre
1 Sales and presentation services
2 Consulting network design
3 Consulting unit sizing
4 Consulting location analysis
5 Consulting cost of connection minimization
Pro
ject
m
an.
6 Installation
7 Location specific adoptions (civil engineering)
8 Commissioning
9 Balance of plant
Serv
ice
du
rin
g th
e p
rod
uct
’s
op
erat
ion
al li
fe
10 Maintenance training
11 Operating training
12 Documentation
13 Network operation
14 Hardware upgrade, replacement or reconditioning
15 Software updates
16 Spare part field service
17 Repair field service
18 Troubleshooting field service (maybe by using remote control)
19 Preventative (scheduled) maintenance
20 Predictive maintenance (using remote)
21 System optimization consulting during operation
EOL 22 End of life recycling
23 End of life buy and re-selling
24 Service contracts with different levels of service
25 Financial services (i.e. renting or payment options)
26 Warranty
IDs 24 to 26 were not considered in any group when the survey was constructed. However,
after in the concept development stage these services were grouped into services during the
product’s operational life. Also ID 9 and 14 changed categories for the final concept
recommendation.

Service concepts for DC Fast Charging
50 (132)
…Table 22. Service ideas from brainstorming sessions (author).
Class Id Service A
ctio
n r
elat
ed
ser
vice
s
EV d
rive
r
27 Smart payment service (subscription, cash or credit)
28 Reward system for charging at your stations
29 Open payment standard (supported by all chargers)
30 Wi-Fi services to smart phones in the area
31 Media distribution/sales capability (app or movie store)
32 Car maintenance (software updates to cars)
33 Statistics/information (battery, how often, where, prices)
34 Unit availability (where is the next charger?)
35 Remote charging control (user can be away and see status on phone)
36 Openly accessible stats API for app development
Ow
ner
37 Remote control of display content
38 Remote system for advertising on display
39 Operational statistics raw data
40 Processed statistics in a interesting and useful format
Uti
lity 41 A smart grid service for selling, buying and storing power
42 Operational statistics
43 Pre and post grid analysis
4.2 CUSTOMER INTERVIEWS6
As previously described, customers have been interviewed in many different segments. The
general business models of customers are utilities, shopping mall builders, parking
companies, cities, petrol stations and different fleets. When interviewing these customers a
few generic value propositions for eMobility have been found. These are listed in Table 23
split on the interviewee companies. The interviewed companies were investigating multiple
value propositions and the degree of strategic intent within each has been assessed using pie
slices. For each customer all slices add up to a full pie. As an example utility 1 mostly intends
to have a commercial value proposition (assessed to ¾ of the strategic intent), putting fast
chargers on the streets and collect the revenue. To ¼ of the strategic intent utility 1 could also
see itself being a solution provider, reselling fast chargers to others.
This section describes each of these value propositions. Answers will be given to research
questions 1.2 and 2.2 on customer requirements differences between customer segments. This
will help to provide further answers to research question 1.1 for finding service ideas.
6 The information in this chapter is taken from customer interviews if no reference is given. Transcripts are
available from each interview (however not part of the appendix) and the information has been cross checked
with each interviewee to increase reliability.
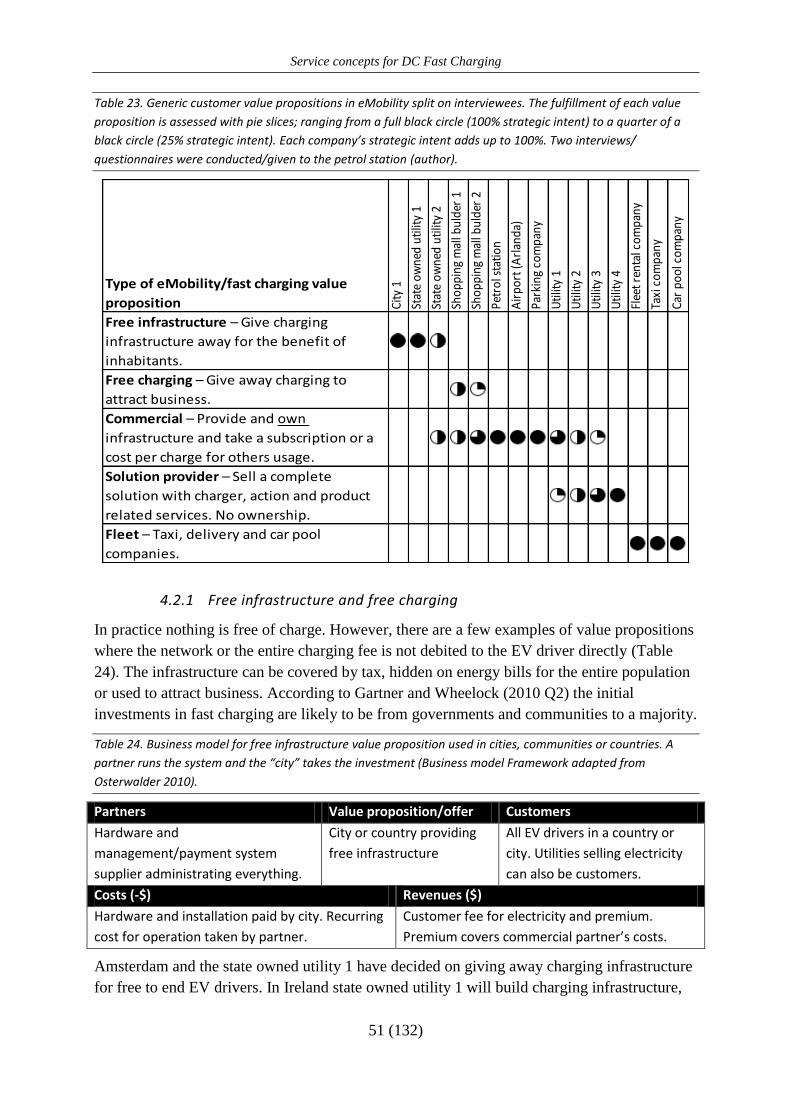
Service concepts for DC Fast Charging
51 (132)
Table 23. Generic customer value propositions in eMobility split on interviewees. The fulfillment of each value
proposition is assessed with pie slices; ranging from a full black circle (100% strategic intent) to a quarter of a
black circle (25% strategic intent). Each company’s strategic intent adds up to 100%. Two interviews/
questionnaires were conducted/given to the petrol station (author).
Type of eMobility/fast charging value
proposition City
1
Stat
e ow
ned
utili
ty 1
Stat
e ow
ned
utili
ty 2
Shop
ping
mal
l bul
der
1
Shop
ping
mal
l bul
der
2
Petr
ol s
tatio
n
Air
port
(Arl
anda
)
Park
ing
com
pany
Util
ity 1
Util
ity 2
Util
ity 3
Util
ity 4
Flee
t ren
tal c
ompa
ny
Taxi
com
pany
Car
pool
com
pany
Free infrastructure – Give charging
infrastructure away for the benefit of
inhabitants.
Free charging – Give away charging to
attract business.
Commercial – Provide and own
infrastructure and take a subscription or a
cost per charge for others usage.
Solution provider – Sell a complete
solution with charger, action and product
related services. No ownership.
Fleet – Taxi, delivery and car pool
companies.
4.2.1 Free infrastructure and free charging
In practice nothing is free of charge. However, there are a few examples of value propositions
where the network or the entire charging fee is not debited to the EV driver directly (Table
24). The infrastructure can be covered by tax, hidden on energy bills for the entire population
or used to attract business. According to Gartner and Wheelock (2010 Q2) the initial
investments in fast charging are likely to be from governments and communities to a majority.
Table 24. Business model for free infrastructure value proposition used in cities, communities or countries. A
partner runs the system and the “city” takes the investment (Business model Framework adapted from
Osterwalder 2010).
Partners Value proposition/offer Customers
Hardware and
management/payment system
supplier administrating everything.
City or country providing
free infrastructure
All EV drivers in a country or
city. Utilities selling electricity
can also be customers.
Costs (-$) Revenues ($)
Hardware and installation paid by city. Recurring
cost for operation taken by partner.
Customer fee for electricity and premium.
Premium covers commercial partner’s costs.
Amsterdam and the state owned utility 1 have decided on giving away charging infrastructure
for free to end EV drivers. In Ireland state owned utility 1 will build charging infrastructure,

Service concepts for DC Fast Charging
52 (132)
which can be used by energy producers to sell electricity to EV drivers. The infrastructure is
paid for by the Irish population via the network fee, which is part of every electricity bill. In
Amsterdam the infrastructure is put in place for environmental benefits to air quality and to
encourage driving electrical cars.
In both Amsterdam and Ireland the network is free for the EV driver but charging from the
network will in the long run not be (although Amsterdam initially has set up a model where
parking and charging is free until April 2012 to stimulate EV buyers). In Amsterdam fast
charging will cost 4€ per 30 minutes fast charge. This fee will be collected by the company
who are responsible for operating and maintaining the infrastructure and interacting with end
EV drivers. In Ireland the electricity producers and dealers will put different tariffs to compete
about customers. Tariffs will be based on the type of charging and when charging is done on
the day. For both Ireland and Amsterdam the management system will consist of RFID cards
that are used for customer identification and billing. In the Irish case the RFID works as a
prepaid card that can be charged with money from different providers that the user selects
when buying credit over the internet or via shops/small stores. The system is open for all
vendors of electricity. In Amsterdam the system will be operated by RWE (German utility and
competitor) who will sell electricity and collect revenues to cover for the operation. Opposed
to Ireland, the system in Amsterdam is closed to RWE, which alone will supply the
electricity.
In the shopping mall sector Shopping mall builder 1 and Shopping mall builder 2 see an
opportunity of adding chargers when building shopping malls to make them more attractive.
The chargers would potentially give away charging for free (see Table 25 for assessment of
this value proposition).
“The electrical car might change the current trend of moving
shopping malls back to city centers. When cars are becoming green
there is no large ecological incentive to reduce shopping malls
outside city centers. At shopping malls outside city centers I can see
a need for chargers, slow and fast, to attract customers to business.
Our vision is to build Sweden’s most attractive shopping centers.” –
Shopping mall builder 2
Shopping mall builder 1 sees a business model for shops giving charging away for free.
Charging is tied to a loyalty program and shopping at a store. By entering the shop, the
customer is more likely to buy existing products. That will pay the small costs of supplying
the customer with electricity.
The free infrastructure or charging value propositions have in general high needs for partners.
In Amsterdam the city sought for one supplier who could deliver chargers and take care of
operations towards the EV drivers. To just interface with one supplier was important for the
city. RWE is today taking this role, buying chargers from a hardware supplyer and operating
the network. In London Siemens has taken the same role. Siemens provide a system for
operating the network and handling the payment and identification over RFID (Source
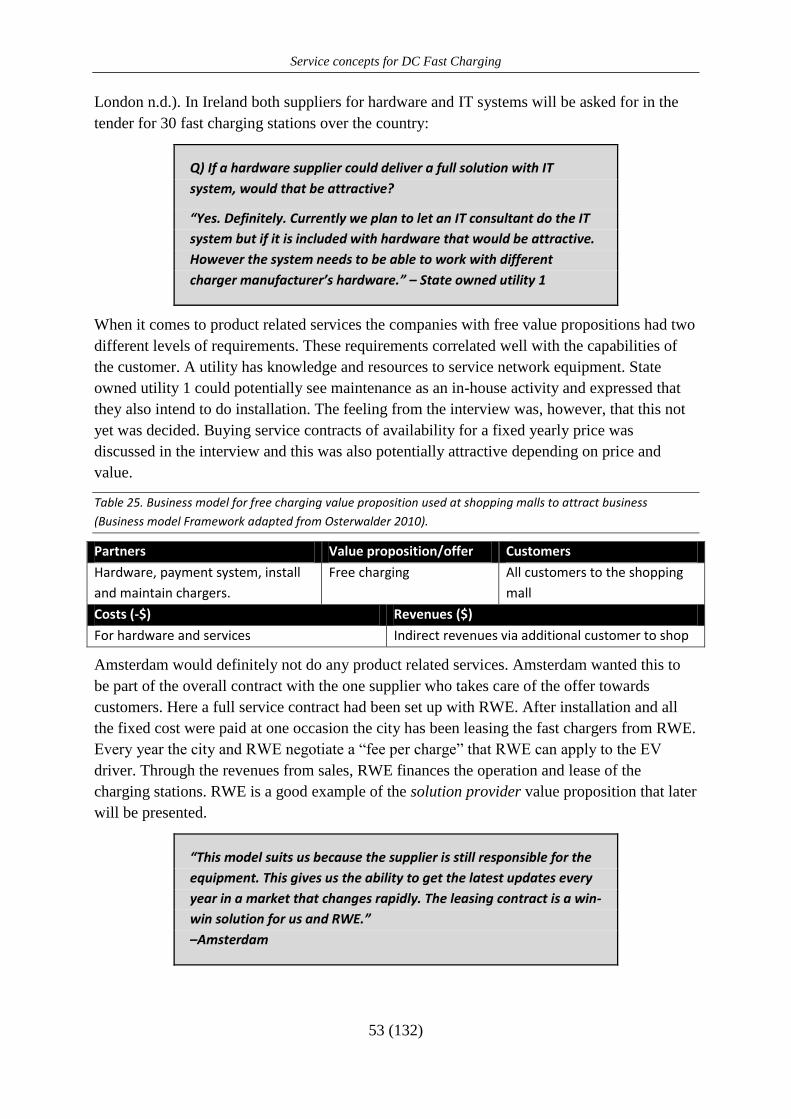
Service concepts for DC Fast Charging
53 (132)
London n.d.). In Ireland both suppliers for hardware and IT systems will be asked for in the
tender for 30 fast charging stations over the country:
Q) If a hardware supplier could deliver a full solution with IT
system, would that be attractive?
“Yes. Definitely. Currently we plan to let an IT consultant do the IT
system but if it is included with hardware that would be attractive.
However the system needs to be able to work with different
charger manufacturer’s hardware.” – State owned utility 1
When it comes to product related services the companies with free value propositions had two
different levels of requirements. These requirements correlated well with the capabilities of
the customer. A utility has knowledge and resources to service network equipment. State
owned utility 1 could potentially see maintenance as an in-house activity and expressed that
they also intend to do installation. The feeling from the interview was, however, that this not
yet was decided. Buying service contracts of availability for a fixed yearly price was
discussed in the interview and this was also potentially attractive depending on price and
value.
Table 25. Business model for free charging value proposition used at shopping malls to attract business
(Business model Framework adapted from Osterwalder 2010).
Partners Value proposition/offer Customers
Hardware, payment system, install
and maintain chargers.
Free charging All customers to the shopping
mall
Costs (-$) Revenues ($)
For hardware and services Indirect revenues via additional customer to shop
Amsterdam would definitely not do any product related services. Amsterdam wanted this to
be part of the overall contract with the one supplier who takes care of the offer towards
customers. Here a full service contract had been set up with RWE. After installation and all
the fixed cost were paid at one occasion the city has been leasing the fast chargers from RWE.
Every year the city and RWE negotiate a “fee per charge” that RWE can apply to the EV
driver. Through the revenues from sales, RWE finances the operation and lease of the
charging stations. RWE is a good example of the solution provider value proposition that later
will be presented.
“This model suits us because the supplier is still responsible for the
equipment. This gives us the ability to get the latest updates every
year in a market that changes rapidly. The leasing contract is a win-
win solution for us and RWE.”
–Amsterdam

Service concepts for DC Fast Charging
54 (132)
For the companies that potentially want to provide free charging as a value proposition the
importance of partners was also big. Both Shopping mall builder 1 and Shopping mall builder
2 expressed that they would like to tie charging to their customer loyalty programs. The
customer loyalty card was expressed as one potential solution.
For product related services both Shopping mall builder 1 and 2 expressed a need of services
all over the life cycle. Installation, network design and maintenance were addressed by both
actors. Service contracts were also interesting and leasing chargers was seen as something
attractive. Shopping mall builder 1 expressed that they do not have the technical capabilities
to assess what maintenance that is needed on a charging system and leaving that risk to the
supplier was discussed during the interview as an attractive option. However price and the
business case was of course an important issue. Shopping mall builder 2 stressed that the lease
fee has to be compared with the price of borrowing money from a bank.
Smart grid solutions of building battery storage, chargers and local production (solar or wind)
together was an idea that was brought up by both shopping malls builders. The idea was
attractive from a marketing perspective of the facilities, as well as from power supply
perspective. Shopping mall builder 2 consumes 300 GWh of energy every year in its
properties which implies a cost that can be reduced. Shopping mall builder 1 has made tests
with smart grid generation at a few properties. Erikslund in Västerås, is one example were the
roof is covered with 200m2 of solar cells delivering 35kW (0.2GWh/year) on average. This is
about 2% of the usage of the store but the power is sufficient to run a DC fast charger at
50kW through battery storage.
The biggest problem that was put forward by Shopping mall builder 1 and 2 for implementing
charging was power supply to the stores. At an existing store Shopping mall builder 1
typically has 6-7 cables high voltage inlets. Each cable is 250A/400V so the total power is
around 600kW. This is typically used at peak consumption and to add a fast charger requires
an extra 50kW or another inlet cable. This is a large investment apart from the charger and
something that hinders investing in fast chargers for all existing facilities.
Advertising and additional action related services, such as selling washer liquid, was not
attractive for this segment. At shopping malls advertising is done with large paper posters.
Washer liquid can be bought inside the shopping malls.
London and Portugal are two free value proposition actors who have not been interviewed.
However a general understanding about the projects have been gained through public
accessible information, speaking to representatives at Geneva Motor Show and in London’s
case by talking to the local ABB representative. In London and Portugal RFID systems have
been/will be put in place. In London a subscription model is used while in Portugal the EV
driver pay per charge. The city and community have in both cases made the infrastructure
investment. The direct fees cover network operation. What seems to have been important
when a fast charger supplier has been selected in London is to provide solutions for the
customer. This can be seen from the following quote.
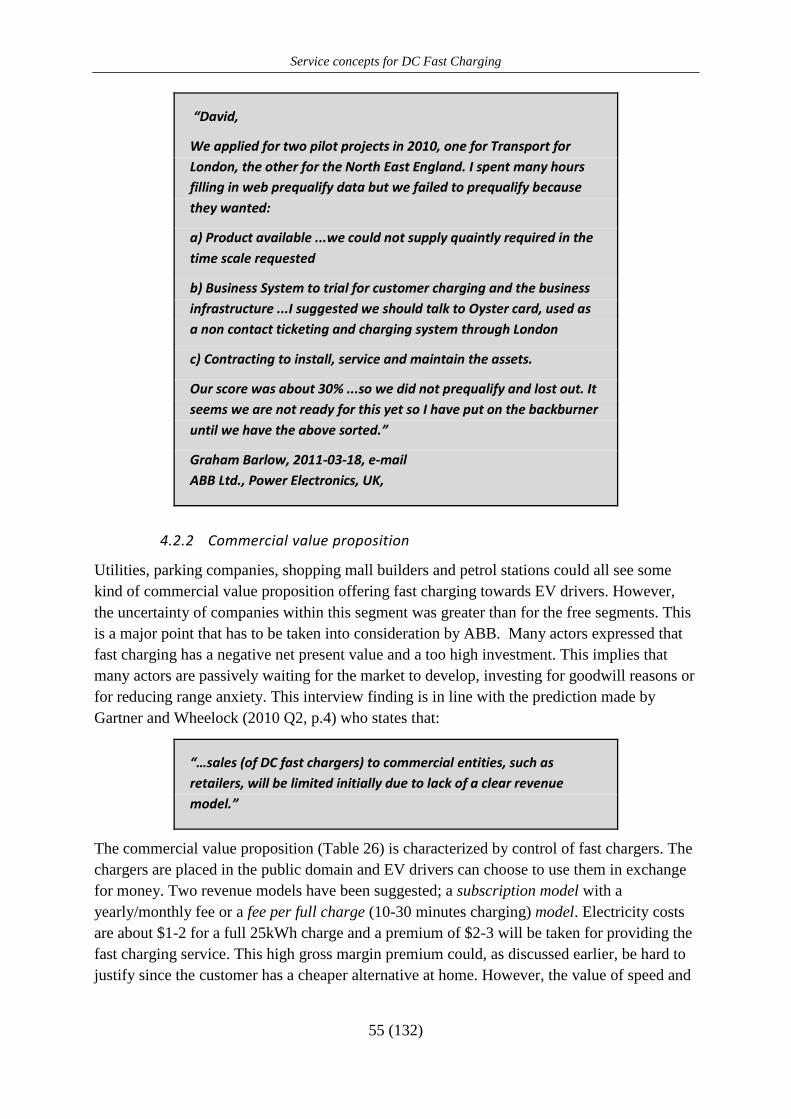
Service concepts for DC Fast Charging
55 (132)
“David,
We applied for two pilot projects in 2010, one for Transport for
London, the other for the North East England. I spent many hours
filling in web prequalify data but we failed to prequalify because
they wanted:
a) Product available ...we could not supply quaintly required in the
time scale requested
b) Business System to trial for customer charging and the business
infrastructure ...I suggested we should talk to Oyster card, used as
a non contact ticketing and charging system through London
c) Contracting to install, service and maintain the assets.
Our score was about 30% ...so we did not prequalify and lost out. It
seems we are not ready for this yet so I have put on the backburner
until we have the above sorted.”
Graham Barlow, 2011-03-18, e-mail
ABB Ltd., Power Electronics, UK,
4.2.2 Commercial value proposition
Utilities, parking companies, shopping mall builders and petrol stations could all see some
kind of commercial value proposition offering fast charging towards EV drivers. However,
the uncertainty of companies within this segment was greater than for the free segments. This
is a major point that has to be taken into consideration by ABB. Many actors expressed that
fast charging has a negative net present value and a too high investment. This implies that
many actors are passively waiting for the market to develop, investing for goodwill reasons or
for reducing range anxiety. This interview finding is in line with the prediction made by
Gartner and Wheelock (2010 Q2, p.4) who states that:
“…sales (of DC fast chargers) to commercial entities, such as
retailers, will be limited initially due to lack of a clear revenue
model.”
The commercial value proposition (Table 26) is characterized by control of fast chargers. The
chargers are placed in the public domain and EV drivers can choose to use them in exchange
for money. Two revenue models have been suggested; a subscription model with a
yearly/monthly fee or a fee per full charge (10-30 minutes charging) model. Electricity costs
are about $1-2 for a full 25kWh charge and a premium of $2-3 will be taken for providing the
fast charging service. This high gross margin premium could, as discussed earlier, be hard to
justify since the customer has a cheaper alternative at home. However, the value of speed and
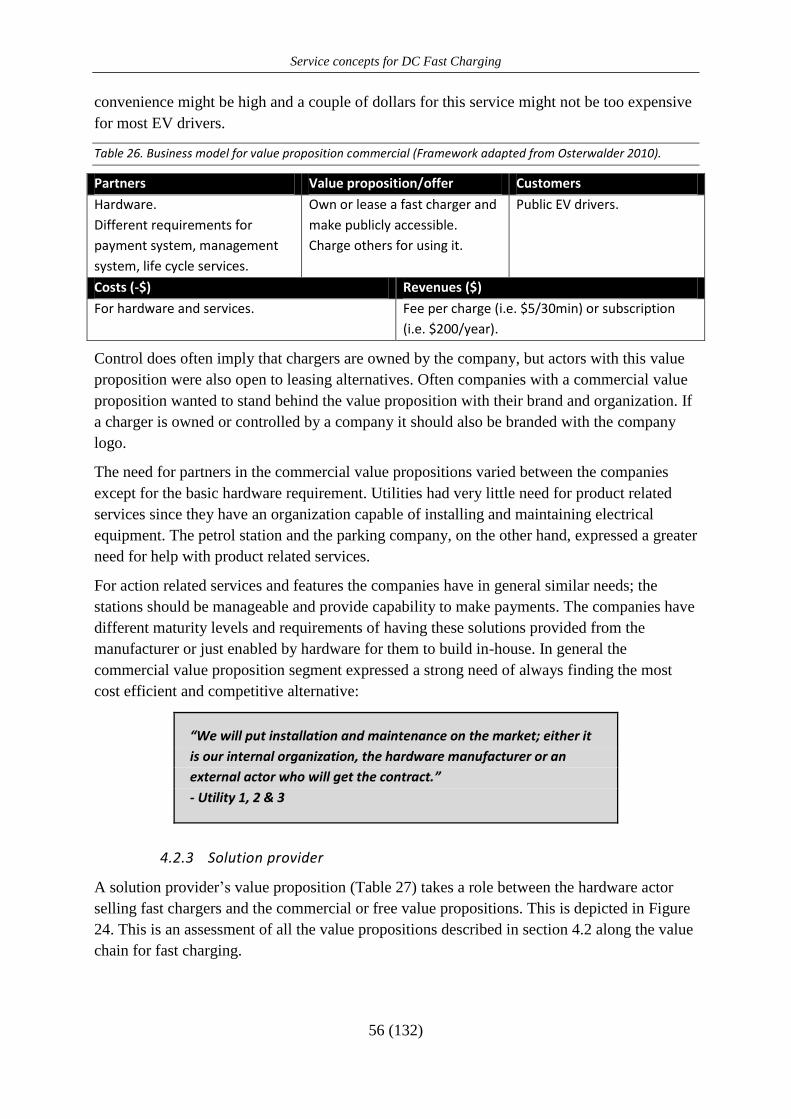
Service concepts for DC Fast Charging
56 (132)
convenience might be high and a couple of dollars for this service might not be too expensive
for most EV drivers.
Table 26. Business model for value proposition commercial (Framework adapted from Osterwalder 2010).
Partners Value proposition/offer Customers
Hardware.
Different requirements for
payment system, management
system, life cycle services.
Own or lease a fast charger and
make publicly accessible.
Charge others for using it.
Public EV drivers.
Costs (-$) Revenues ($)
For hardware and services. Fee per charge (i.e. $5/30min) or subscription
(i.e. $200/year).
Control does often imply that chargers are owned by the company, but actors with this value
proposition were also open to leasing alternatives. Often companies with a commercial value
proposition wanted to stand behind the value proposition with their brand and organization. If
a charger is owned or controlled by a company it should also be branded with the company
logo.
The need for partners in the commercial value propositions varied between the companies
except for the basic hardware requirement. Utilities had very little need for product related
services since they have an organization capable of installing and maintaining electrical
equipment. The petrol station and the parking company, on the other hand, expressed a greater
need for help with product related services.
For action related services and features the companies have in general similar needs; the
stations should be manageable and provide capability to make payments. The companies have
different maturity levels and requirements of having these solutions provided from the
manufacturer or just enabled by hardware for them to build in-house. In general the
commercial value proposition segment expressed a strong need of always finding the most
cost efficient and competitive alternative:
“We will put installation and maintenance on the market; either it
is our internal organization, the hardware manufacturer or an
external actor who will get the contract.”
- Utility 1, 2 & 3
4.2.3 Solution provider
A solution provider’s value proposition (Table 27) takes a role between the hardware actor
selling fast chargers and the commercial or free value propositions. This is depicted in Figure
24. This is an assessment of all the value propositions described in section 4.2 along the value
chain for fast charging.
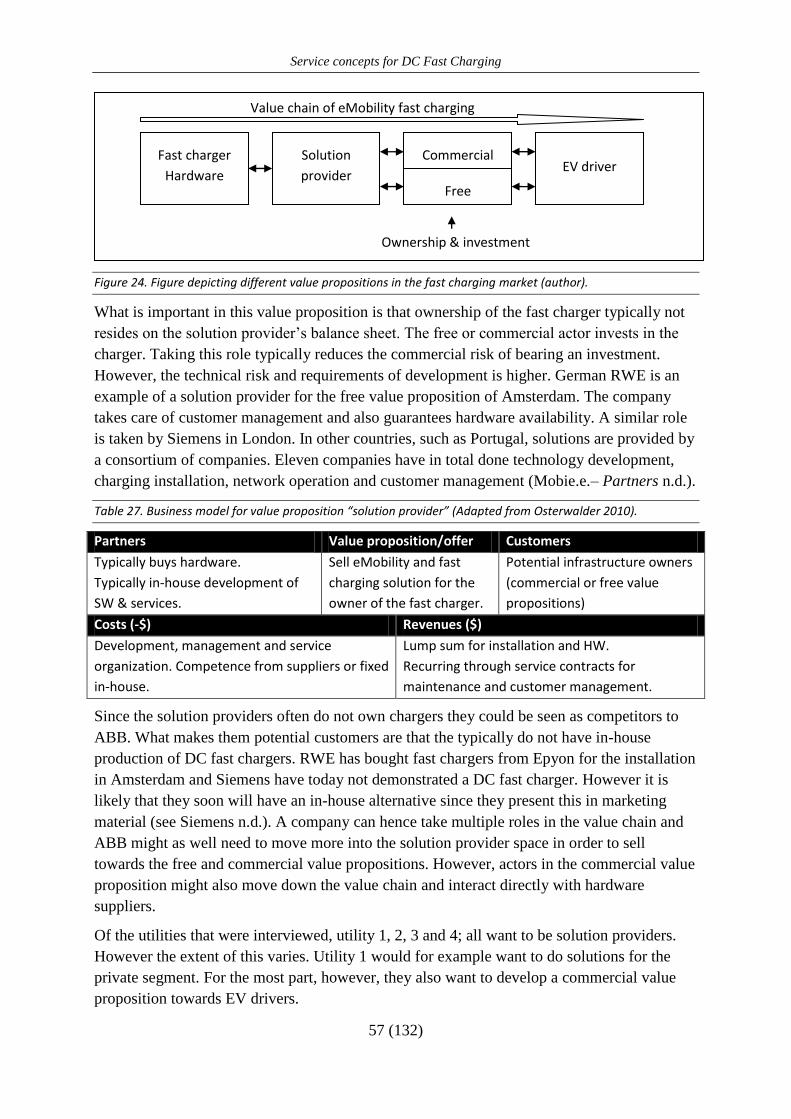
Service concepts for DC Fast Charging
57 (132)
Figure 24. Figure depicting different value propositions in the fast charging market (author).
What is important in this value proposition is that ownership of the fast charger typically not
resides on the solution provider’s balance sheet. The free or commercial actor invests in the
charger. Taking this role typically reduces the commercial risk of bearing an investment.
However, the technical risk and requirements of development is higher. German RWE is an
example of a solution provider for the free value proposition of Amsterdam. The company
takes care of customer management and also guarantees hardware availability. A similar role
is taken by Siemens in London. In other countries, such as Portugal, solutions are provided by
a consortium of companies. Eleven companies have in total done technology development,
charging installation, network operation and customer management (Mobie.e.– Partners n.d.).
Table 27. Business model for value proposition “solution provider” (Adapted from Osterwalder 2010).
Partners Value proposition/offer Customers
Typically buys hardware.
Typically in-house development of
SW & services.
Sell eMobility and fast
charging solution for the
owner of the fast charger.
Potential infrastructure owners
(commercial or free value
propositions)
Costs (-$) Revenues ($)
Development, management and service
organization. Competence from suppliers or fixed
in-house.
Lump sum for installation and HW.
Recurring through service contracts for
maintenance and customer management.
Since the solution providers often do not own chargers they could be seen as competitors to
ABB. What makes them potential customers are that the typically do not have in-house
production of DC fast chargers. RWE has bought fast chargers from Epyon for the installation
in Amsterdam and Siemens have today not demonstrated a DC fast charger. However it is
likely that they soon will have an in-house alternative since they present this in marketing
material (see Siemens n.d.). A company can hence take multiple roles in the value chain and
ABB might as well need to move more into the solution provider space in order to sell
towards the free and commercial value propositions. However, actors in the commercial value
proposition might also move down the value chain and interact directly with hardware
suppliers.
Of the utilities that were interviewed, utility 1, 2, 3 and 4; all want to be solution providers.
However the extent of this varies. Utility 1 would for example want to do solutions for the
private segment. For the most part, however, they also want to develop a commercial value
proposition towards EV drivers.
Fast charger
Hardware
Solution
provider
Commercial
Free
EV driver
Ownership & investment
Value chain of eMobility fast charging
Service concepts for DC Fast Charging
58 (132)
“We think that the private segment for taxis and fleets will take off
first and we will be there with solutions.” – Utility 1
The Dutch utility 4 does not want to own any chargers at all and they position as a solution
provider. The same is true for utility 3, which believes that fast charging could only be
profitable together with other businesses and extended offerings (selling coffee or having a
shop next to the charger for example). Hence utility 3 aims to provide solutions for the
commercial segment of shop owners that have other business as well. Utility 3 could also
potentially own fast chargers and share revenues together with the commercial actor who has
a nearby shop. This is in line with the value proposition ECOtality is adopting for its network
in USA (see chapter 5.4.5). The thought is to let small commercial actors take the hardware
investment and then share revenues with them in exchange for servicing and operating the
network.
Utility 2 is the Swedish utility that might have come furthest in eMobility. The company has
four legacy fast chargers from the nineties and is today experimenting with Chademo
charging and ultra fast charging (250kW). The company has not formed a clear value
proposition for fast charging yet but would like to provide solutions for commercial actors as
well as putting up own controlled chargers.
The requirements for partners are similar to the commercial segment. For product related
services the solution providers as well plan to choose either internal or external providers
depending on that is most cost efficient. However many solution providers are in general
utilities that have high capabilities. For installation, utilities are often by law the only
companies who are allowed to work with high voltage equipment, which further reduces the
need for help. Utility 4 however expressed installation to be a natural service that the
hardware supplier should take care of.
For action related services or features there is however a smaller need for help compared to
the commercial segment. The solution providers themselves have to develop a core
competence in some area and often this is done within a management and payment systems.
RWE and Siemens have done this as well as utility 2. The Others are likely to do something
similar. However, not all of them have done this to date. Utility 1 and 3, for example, includes
a payment system as an example of an area where help is needed and where it could be
attractive to have solutions from a supplier such as ABB.
4.2.4 Fleet
The fleet segment is characterized by having transport as the central part in its value
proposition (Table 28). When electrical vehicles enter the market many believe that this will
be the segment that adopts them first (e.g. utility 1 expressed this). One reason for this is that
the fleet segment drives a lot and hence reaches breakeven faster for when investment in an
EV is better than in a petrol vehicle (
).
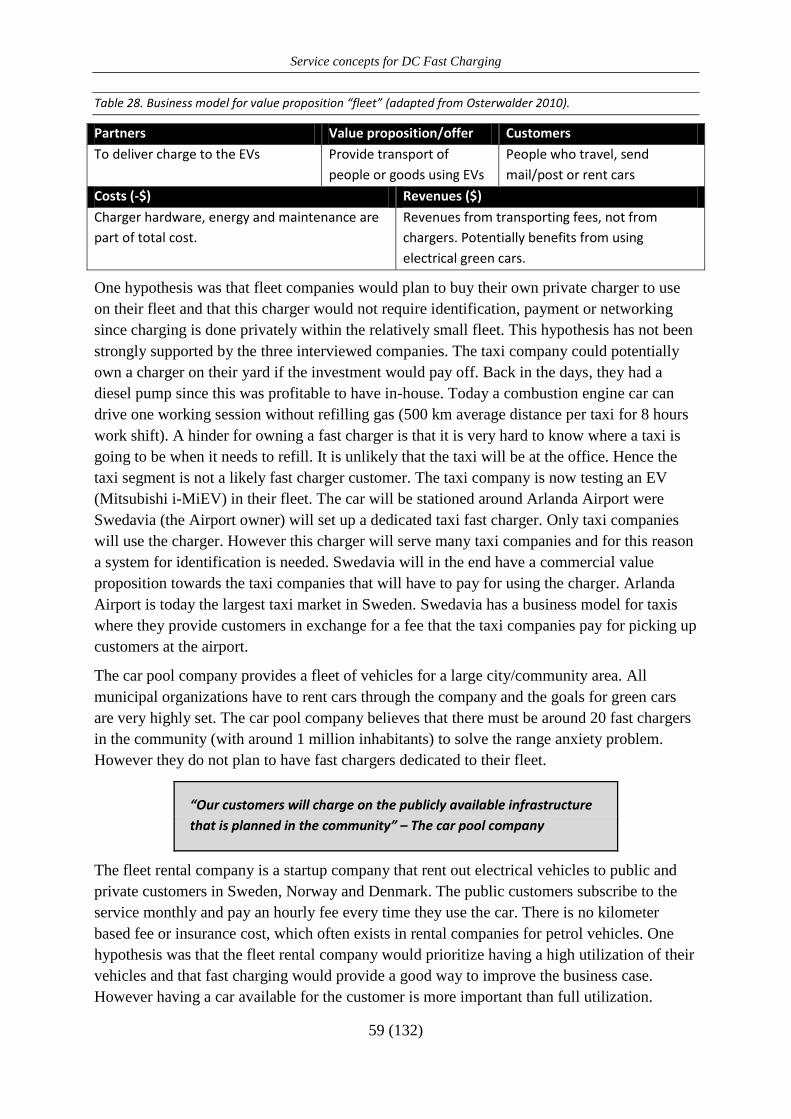
Service concepts for DC Fast Charging
59 (132)
Table 28. Business model for value proposition “fleet” (adapted from Osterwalder 2010).
Partners Value proposition/offer Customers
To deliver charge to the EVs Provide transport of
people or goods using EVs
People who travel, send
mail/post or rent cars
Costs (-$) Revenues ($)
Charger hardware, energy and maintenance are
part of total cost.
Revenues from transporting fees, not from
chargers. Potentially benefits from using
electrical green cars.
One hypothesis was that fleet companies would plan to buy their own private charger to use
on their fleet and that this charger would not require identification, payment or networking
since charging is done privately within the relatively small fleet. This hypothesis has not been
strongly supported by the three interviewed companies. The taxi company could potentially
own a charger on their yard if the investment would pay off. Back in the days, they had a
diesel pump since this was profitable to have in-house. Today a combustion engine car can
drive one working session without refilling gas (500 km average distance per taxi for 8 hours
work shift). A hinder for owning a fast charger is that it is very hard to know where a taxi is
going to be when it needs to refill. It is unlikely that the taxi will be at the office. Hence the
taxi segment is not a likely fast charger customer. The taxi company is now testing an EV
(Mitsubishi i-MiEV) in their fleet. The car will be stationed around Arlanda Airport were
Swedavia (the Airport owner) will set up a dedicated taxi fast charger. Only taxi companies
will use the charger. However this charger will serve many taxi companies and for this reason
a system for identification is needed. Swedavia will in the end have a commercial value
proposition towards the taxi companies that will have to pay for using the charger. Arlanda
Airport is today the largest taxi market in Sweden. Swedavia has a business model for taxis
where they provide customers in exchange for a fee that the taxi companies pay for picking up
customers at the airport.
The car pool company provides a fleet of vehicles for a large city/community area. All
municipal organizations have to rent cars through the company and the goals for green cars
are very highly set. The car pool company believes that there must be around 20 fast chargers
in the community (with around 1 million inhabitants) to solve the range anxiety problem.
However they do not plan to have fast chargers dedicated to their fleet.
“Our customers will charge on the publicly available infrastructure
that is planned in the community” – The car pool company
The fleet rental company is a startup company that rent out electrical vehicles to public and
private customers in Sweden, Norway and Denmark. The public customers subscribe to the
service monthly and pay an hourly fee every time they use the car. There is no kilometer
based fee or insurance cost, which often exists in rental companies for petrol vehicles. One
hypothesis was that the fleet rental company would prioritize having a high utilization of their
vehicles and that fast charging would provide a good way to improve the business case.
However having a car available for the customer is more important than full utilization.
Service concepts for DC Fast Charging
60 (132)
Keeping the current availability/utilization is done with slow AC charging 16A/230V/3.7kW.
Cars run on average 40 km per day which is within their range. Their CEO however put
forward that fast charging would be interesting if the price is right.
The fleet rental company is the only fleet company interviewed that potentially would be
interested in owning fast chargers. The company has a fleet management system that is
integrated in their cars. From this system the company can monitor where the cars are, if they
are being used and what battery capacity that still remains. The rental customer books cars
through the system. The customers enter how far they plan to go and for how long the car will
be reserved. The system makes sure a car can be picked up and that enough charge exists to
drive the required distance. A potential fast charger sold to the fleet rental company would
hence not require an advanced payment or identification system. However, they put forward
that the charger should be able to heat the car cabinet when it is cold and be used for smart
grid services. For life cycles services the fleet rental company could potentially need expertise
in installing and maintaining the charger.
4.3 SERVICE BENCHMARKING
This section addresses research question number 1.3 in idea generation; what service ideas
and success factors for service can be found from service benchmarks?
4.3.1 Key success factors in network services7
Ericsson Managed Services is a company within Ericsson that performs operation and field
service of base stations and operation of entire networks. This is the big bulk of work in
managed services, but Ericsson Managed Services also does planning, design, building,
rollout (installation, commissioning and training) and support of networks. Ericsson Managed
Services would like to be seen as the competence for operating networks.
“Ericsson should be seen as the ‘man in the van’ to network owners
who do not need to acquire competence to operate networks.” –
Elin Aldén, Ericsson Managed Services
Ericsson has separated the organizations for hardware sales and network operation. Ericsson
Managed Services has no requirement to recommend Ericsson equipment to be installed when
upgrades need to be done. The customer buys hardware separately and Ericsson’s network
operation service only recommends what type of equipment to buy, not the vendor. This way
of organizing service and product has been put forward as a key success factor in literature
and it could be something for ABB to follow. ABB does not necessarily require an own
product in order to build a service organization, this could be done independently. Splitting
the service organization also implies that service is sold on its own and not given away for
7 The section is from a phone interview 2011-02-23 with Elin Aldén, Informer at Ericsson Managed Services.
Service concepts for DC Fast Charging
61 (132)
free with the product. Both the service and product organizations then compete on the same
terms with others, which is an important factor for gaining trust. When service contracts are
being written; trust, openness and tangibility are important to let the customer see the value of
the contract.
In the mobile network service industry, standards enable Ericsson to service a network from
any vendor following a particular standard (CDMA or 3G). Agreements between the different
hardware providers enable spare parts to any service supplier.
“We operate all kinds of network. It does not matter what the
technology is. We buy the competence. Economics of scale is the
important thing. No magical recipe, we service as everyone else,
but we are big. In service, utilization of staff is a key success
factor.” – Elin Aldén, Ericsson Managed Services
A typical setup of a service contract from Ericsson Managed Services is to utilize key
performance indicators with the customer who should be followed for a fixed yearly price.
Incentives are built into the contract for Ericsson to take a share of the cost savings that could
be achieved by the customer. Normally, cost savings are in the range of 10-15%.
“There is no need to have five parallel networks in a country being
serviced by different organizations when they can be serviced by
one at a lower cost.” – Elin Aldén, Ericsson Managed Services
Outside of the service contract, Ericsson typically can supply different consulting services.
One example is on how the network best should be strengthened with new equipment in order
to achieve certain performance targets.
To reach the goals of the service contract, Ericsson typically demands their “toolkit” to be
used by the customer. This toolkit involves software that is installed into the network for
Ericsson to use in monitoring its status. If this is not done, Ericsson cannot use its normal
processes and benefit from scale that can be reached in service centers. Normally, these tools
have to be paid for by the customer with a lump sum in the beginning of the service contract.
Doing this creates a lock-in for the customer to use Ericsson when the next service contract is
to be signed after the current has expired.
The most recent trend is to set key performance indicators and service level agreements from
a customer perspective and not from a product perspective. Coverage and speed are two
examples of requirements that are related to the end customer; the number of nodes that are
active is on the other hand a product related measurement (the network of nodes is the
product). Many nodes could be down and customers could still get a good coverage and
speed. Hence it is more relevant to use customer related measurements. If these (such as
coverage) cannot be fulfilled with the existing equipment, Ericsson recommends what should
be done to solve the problem with upgrades. If this way of reasoning is applied to the fast
charger it does not count how often servicing has been done; the total uptime is more
Service concepts for DC Fast Charging
62 (132)
important. Another measure would be to minimize how many customers that have seen that
the charger is broken which might be correlated with a total service goodwill measure.
L.M. Ericsson stared as a repair shop for telephones. The service culture was early part of the
company. When the mobile network market opened up, hardware was naturally becoming the
most important business. After over 100 years of building mobile networks, the coverage in
the world is today rather good and the importance of services is increasing. The managed
service business model started 15 years ago when a customer, who had been part of a training
activity on his new network, asked Ericsson to not hand over the operation of the network.
Ericsson was already managing the network during the training course and made it so well
that the customer wanted Ericsson to continue. Ericsson benefits from having superior
knowledge in technology and a global service organization that can be leveraged to do
network service and operation cost efficiently. Today, it is very hard for a hardware
organization to differentiate without services. Everything is standardized and good margins
are therefore hard to achieve for pure hardware.
Ericsson has 45’000 service employees where 10’000 are part of global service centers and
35’000 local representatives on site. The service organization is structured according to
competence and, as for ABB, according to product/business unit. If a certain customer or
product requires a competence, this is collected from a competence area. This way of
organizing eliminates the fight over competences from different business units within the
company. This fight and lack of cooperation is a big problem within ABB and the current
drive from management is to solve this and become “one ABB”.
4.3.2 Models for service contracts8
Ericsson is one example of a successful organization in the service industry. The company is
at the very end of Olivia and Kallenberg’s (2003) continuum of classifying the level of service
offering in an organization. ABB has a similar setup at ABB Robotics where the service
department also has taken over end user operation. In some manufacturing cells, ABB
Robotics has service level agreements based on providing a predefined output with the
customer’s robots. ABB Robotics also has focus on contracts for maintaining robots and
“protect your investment to a fixed cost”. For other customers, to who this is not attractive,
reactive service options also exist to repair equipment that has been broken. This is charged
for by the hour. In ABB Robotics’ market, downtime is very costly for customers which is
one reason that has led many customers to buy service contracts to prevent faults from
occurring instead of being surprised and repair when they occur.
Similar to Ericsson, ABB Robotics has a global service organization spread over more than 50
countries. This is according to Isaksson a success factor for efficient service delivery. Each
local office makes close customer contacts after every sale. To execute on the service
8 This section is based on telephone interviews with Brith Isaksson, Head of Service ABB Robotics Sweden,
2011-02-11; Luigi Malinverno, Service development Solar Inverters ABB Finland, 2011-02-18 and Christian
Stich, ABB Corporate Research Germany, 2011-02-17.
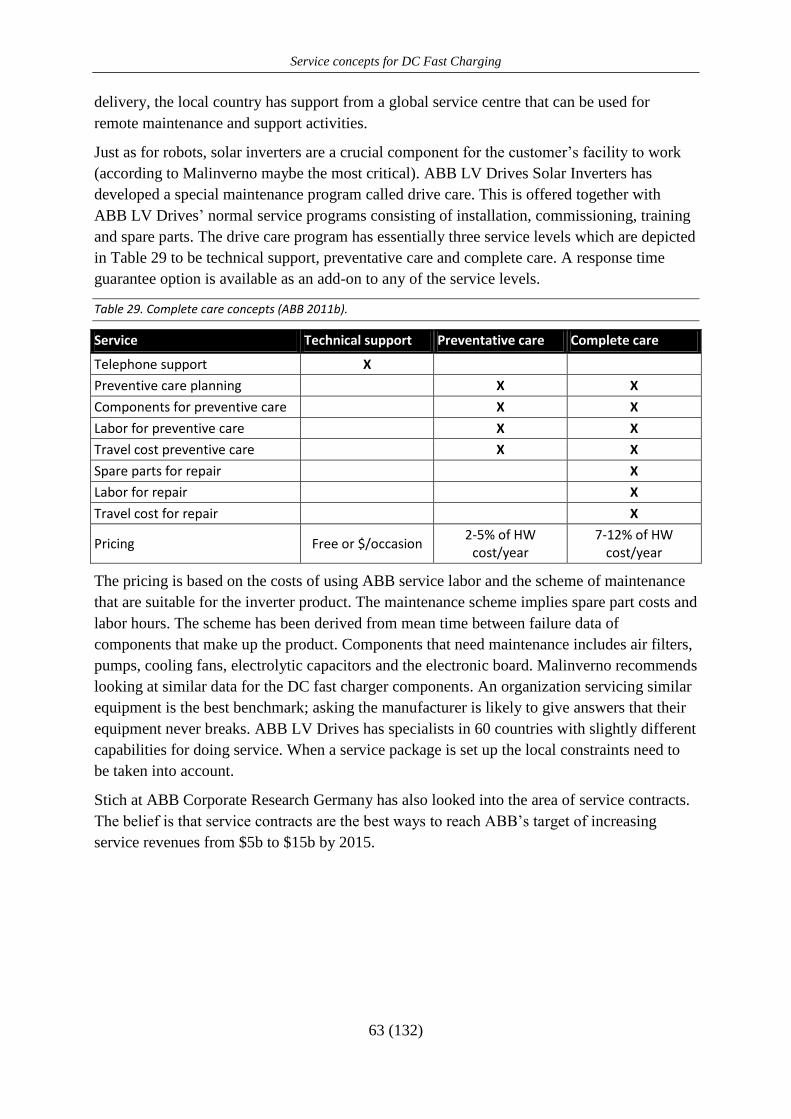
Service concepts for DC Fast Charging
63 (132)
delivery, the local country has support from a global service centre that can be used for
remote maintenance and support activities.
Just as for robots, solar inverters are a crucial component for the customer’s facility to work
(according to Malinverno maybe the most critical). ABB LV Drives Solar Inverters has
developed a special maintenance program called drive care. This is offered together with
ABB LV Drives’ normal service programs consisting of installation, commissioning, training
and spare parts. The drive care program has essentially three service levels which are depicted
in Table 29 to be technical support, preventative care and complete care. A response time
guarantee option is available as an add-on to any of the service levels.
Table 29. Complete care concepts (ABB 2011b).
Service Technical support Preventative care Complete care
Telephone support X Preventive care planning X X
Components for preventive care X X
Labor for preventive care X X
Travel cost preventive care X X
Spare parts for repair X
Labor for repair X
Travel cost for repair X
Pricing Free or $/occasion 2-5% of HW
cost/year 7-12% of HW
cost/year
The pricing is based on the costs of using ABB service labor and the scheme of maintenance
that are suitable for the inverter product. The maintenance scheme implies spare part costs and
labor hours. The scheme has been derived from mean time between failure data of
components that make up the product. Components that need maintenance includes air filters,
pumps, cooling fans, electrolytic capacitors and the electronic board. Malinverno recommends
looking at similar data for the DC fast charger components. An organization servicing similar
equipment is the best benchmark; asking the manufacturer is likely to give answers that their
equipment never breaks. ABB LV Drives has specialists in 60 countries with slightly different
capabilities for doing service. When a service package is set up the local constraints need to
be taken into account.
Stich at ABB Corporate Research Germany has also looked into the area of service contracts.
The belief is that service contracts are the best ways to reach ABB’s target of increasing
service revenues from $5b to $15b by 2015.
Service concepts for DC Fast Charging
64 (132)
“The challenge is to link customers to ABB over a life cycle and not
just at the sale occasion. One way of doing this is through life cycle
service contracts. The business model for the customer is to
minimize risk and guarantee uptime in the most efficient way.
Some customers know nothing about technology and here is an
opportunity. ABB’s offer could be to guarantee uptime to 99% and
operate the product.”
- Christian Stich, ABB Corporate Research Germany
The customer benefits from service contracts guaranteeing performance includes9:
Reduced life cycle costs – A well maintained product will have a longer working life
cycle with fewer break downs.
Predicted life cycle costs – A service contract with a fixed yearly payment will insure
the customer from unexpected events.
Removed peaks in cash flow – Unexpected events require available cash flow to
cover repairs and damages. A service contract transfers the risk for handling these
events from the customer to the supplier.
Less requirements of specialized technical knowledge –The customers can focus on
their core business, which might be unrelated to servicing the product in question.
During the interview with Stich, a discussion was also held on what can be done for
customers, such as utilities, which have technical knowledge to service the hardware in-house.
One option is to create training certificates that must be taken by all service staff who works
on the product for warranties to be valid. Another option is to have certain areas where only
ABB people are allowed to do service. This strategy might however be hard to sell to a
customer with a proprietary service organization that is likely to screen suppliers on this
criterion.
4.3.3 Refurbishment, repair or buy & re-sell10
ABB Robotics has a program for refurbishing, repairing or buy and resell robots. The
company has 41 front end units that interact with the customers to solve their problem. In the
backend there are spare part centers in China, Japan and in Sweden. In Mexico and Czech
Republic there are factories that additionally can do repairs and refurbishment. Refurbishment
implies that a customer can send a worn (but working) product to these centers to get it back
in shape again. Repair means that the product (or a part of it) is fixed after being damaged.
The customers can also sell or give their product to ABB who refurbish it and sells it to
customers at a second hand market. After the robot has left the process it is “as good as new”,
which implies that a one year warranty period is given. It takes between two and three weeks
to refurbish a product. The strength of letting ABB do the refurbishment and repairs is that
9 Christian Stich, ABB Corporate Research Germany, 2011-02-17.
10 ABB (2010d) and ABB (2011d)
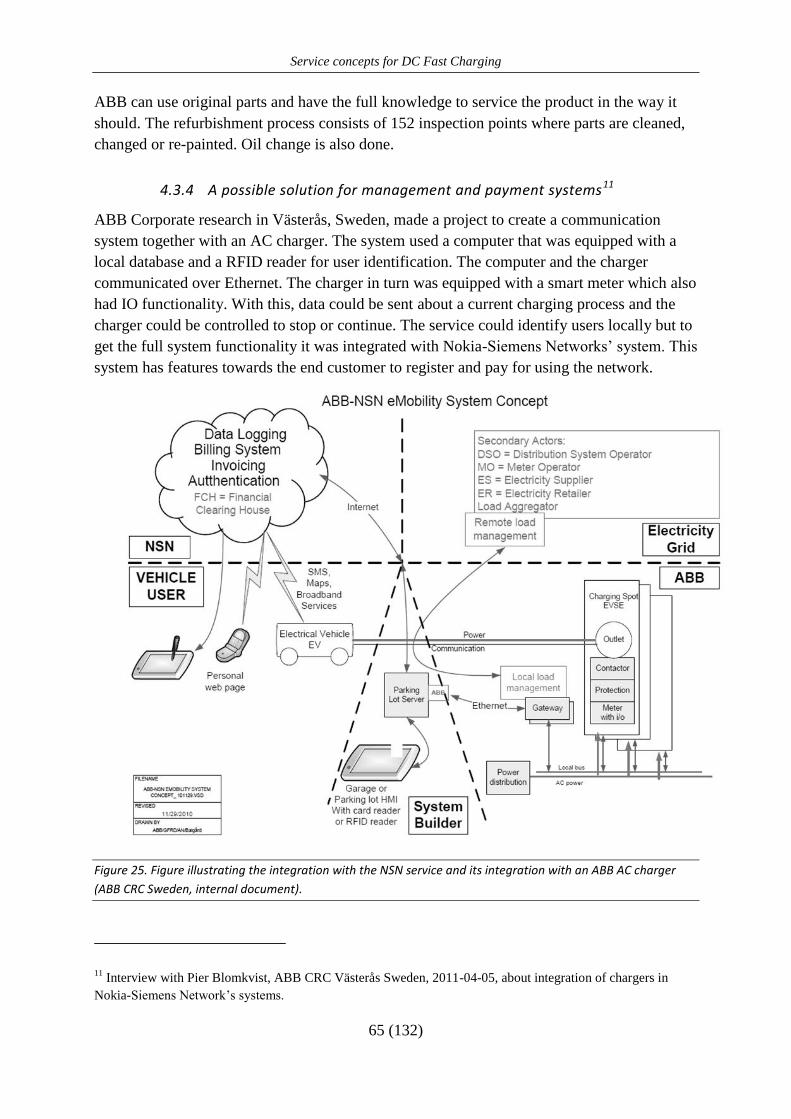
Service concepts for DC Fast Charging
65 (132)
ABB can use original parts and have the full knowledge to service the product in the way it
should. The refurbishment process consists of 152 inspection points where parts are cleaned,
changed or re-painted. Oil change is also done.
4.3.4 A possible solution for management and payment systems11
ABB Corporate research in Västerås, Sweden, made a project to create a communication
system together with an AC charger. The system used a computer that was equipped with a
local database and a RFID reader for user identification. The computer and the charger
communicated over Ethernet. The charger in turn was equipped with a smart meter which also
had IO functionality. With this, data could be sent about a current charging process and the
charger could be controlled to stop or continue. The service could identify users locally but to
get the full system functionality it was integrated with Nokia-Siemens Networks’ system. This
system has features towards the end customer to register and pay for using the network.
Figure 25. Figure illustrating the integration with the NSN service and its integration with an ABB AC charger
(ABB CRC Sweden, internal document).
11 Interview with Pier Blomkvist, ABB CRC Västerås Sweden, 2011-04-05, about integration of chargers in
Nokia-Siemens Network’s systems.
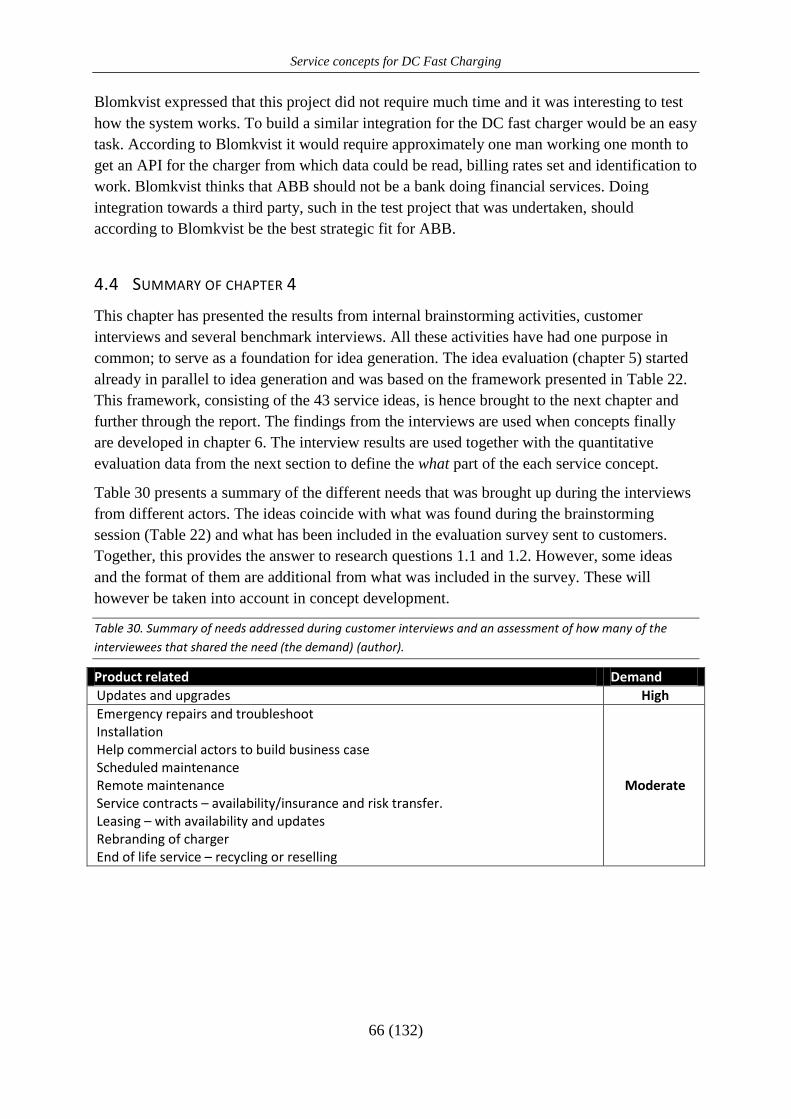
Service concepts for DC Fast Charging
66 (132)
Blomkvist expressed that this project did not require much time and it was interesting to test
how the system works. To build a similar integration for the DC fast charger would be an easy
task. According to Blomkvist it would require approximately one man working one month to
get an API for the charger from which data could be read, billing rates set and identification to
work. Blomkvist thinks that ABB should not be a bank doing financial services. Doing
integration towards a third party, such in the test project that was undertaken, should
according to Blomkvist be the best strategic fit for ABB.
4.4 SUMMARY OF CHAPTER 4
This chapter has presented the results from internal brainstorming activities, customer
interviews and several benchmark interviews. All these activities have had one purpose in
common; to serve as a foundation for idea generation. The idea evaluation (chapter 5) started
already in parallel to idea generation and was based on the framework presented in Table 22.
This framework, consisting of the 43 service ideas, is hence brought to the next chapter and
further through the report. The findings from the interviews are used when concepts finally
are developed in chapter 6. The interview results are used together with the quantitative
evaluation data from the next section to define the what part of the each service concept.
Table 30 presents a summary of the different needs that was brought up during the interviews
from different actors. The ideas coincide with what was found during the brainstorming
session (Table 22) and what has been included in the evaluation survey sent to customers.
Together, this provides the answer to research questions 1.1 and 1.2. However, some ideas
and the format of them are additional from what was included in the survey. These will
however be taken into account in concept development.
Table 30. Summary of needs addressed during customer interviews and an assessment of how many of the
interviewees that shared the need (the demand) (author).
Product related Demand
Updates and upgrades High
Emergency repairs and troubleshoot Installation Help commercial actors to build business case Scheduled maintenance Remote maintenance Service contracts – availability/insurance and risk transfer. Leasing – with availability and updates Rebranding of charger End of life service – recycling or reselling
Moderate
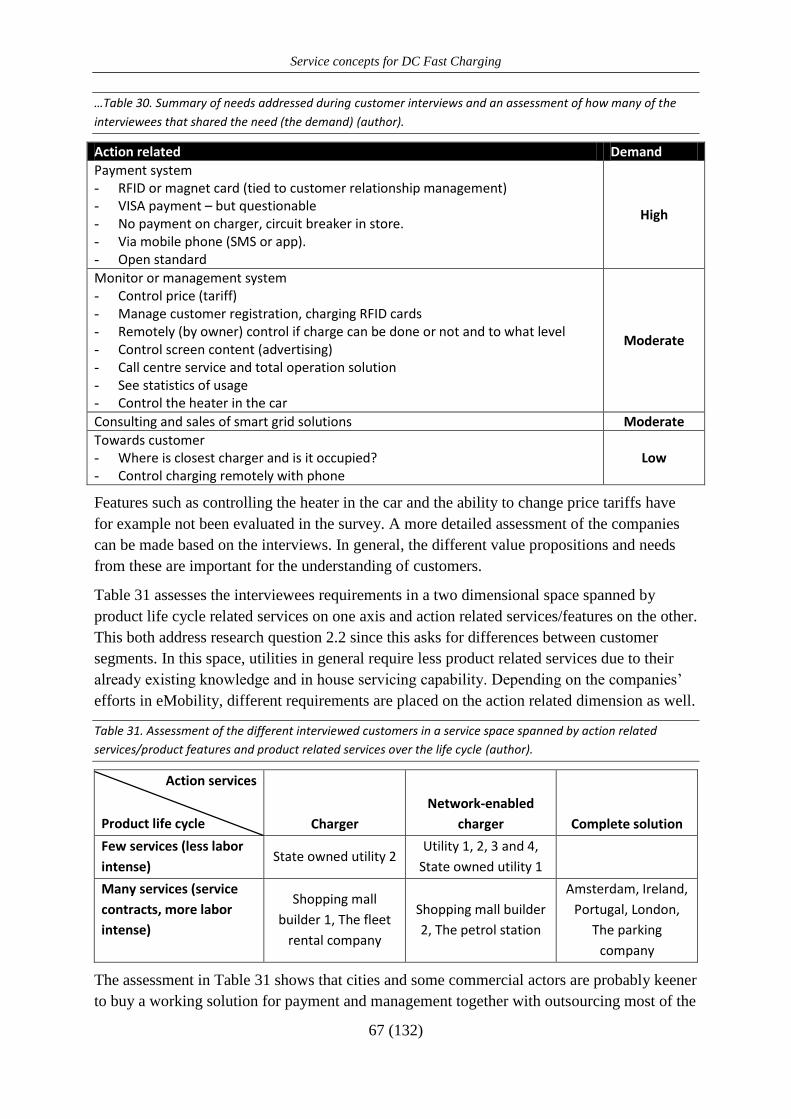
Service concepts for DC Fast Charging
67 (132)
…Table 30. Summary of needs addressed during customer interviews and an assessment of how many of the
interviewees that shared the need (the demand) (author).
Action related Demand
Payment system - RFID or magnet card (tied to customer relationship management) - VISA payment – but questionable - No payment on charger, circuit breaker in store. - Via mobile phone (SMS or app). - Open standard
High
Monitor or management system - Control price (tariff) - Manage customer registration, charging RFID cards - Remotely (by owner) control if charge can be done or not and to what level - Control screen content (advertising) - Call centre service and total operation solution - See statistics of usage - Control the heater in the car
Moderate
Consulting and sales of smart grid solutions Moderate
Towards customer - Where is closest charger and is it occupied? - Control charging remotely with phone
Low
Features such as controlling the heater in the car and the ability to change price tariffs have
for example not been evaluated in the survey. A more detailed assessment of the companies
can be made based on the interviews. In general, the different value propositions and needs
from these are important for the understanding of customers.
Table 31 assesses the interviewees requirements in a two dimensional space spanned by
product life cycle related services on one axis and action related services/features on the other.
This both address research question 2.2 since this asks for differences between customer
segments. In this space, utilities in general require less product related services due to their
already existing knowledge and in house servicing capability. Depending on the companies’
efforts in eMobility, different requirements are placed on the action related dimension as well.
Table 31. Assessment of the different interviewed customers in a service space spanned by action related
services/product features and product related services over the life cycle (author).
Action services
Product life cycle Charger
Network-enabled
charger Complete solution
Few services (less labor
intense) State owned utility 2
Utility 1, 2, 3 and 4,
State owned utility 1
Many services (service
contracts, more labor
intense)
Shopping mall
builder 1, The fleet
rental company
Shopping mall builder
2, The petrol station
Amsterdam, Ireland,
Portugal, London,
The parking
company
The assessment in Table 31 shows that cities and some commercial actors are probably keener
to buy a working solution for payment and management together with outsourcing most of the
Service concepts for DC Fast Charging
68 (132)
product related services. This has been seen in developments in cities and countries. This
segment is already starting to take off and the solution providing actors in eMobility are
providing offers that fit here. There are however many companies that do not want a complete
working solution and there are possibilities of many different combinations of offers.
Further on, service benchmark findings in this chapter lie as a foundation for further concept
development in chapter 6. The findings are summarized in Table 32. This provides a short
answer to research question 1.3 of what ideas service benchmarks could give for designing
service concepts for this project. The internal interview findings related to service contracts
are used as an input to design the service concept for operational life time services. The Nokia
Siemens Networks benchmark is used as input for the action related service concepts.
Table 32. Summary of key learning points for service benchmarks (author).
FROM ERICSSON
Scale is important to reach utilization of the service organization. Utilization drives profit and competitive advantage.
Services are important for differentiation of a hardware supplier. A network service organization can be run independently of producing hardware but knowledge synergies are an important reason for having both businesses under the same company.
The service offering is developing over time for the hardware producer to take on more risk.
A global service organization is beneficial to be close to customers and tie important relationships for service agreements.
FROM INTERNAL BENCHMARKS
If the client has operations with high output value per time unit, having hardware suppliers guaranteeing uptime is important.
Three levels of contracts are normally used within ABB for operational services; technical support (customer risk), preventative care (shared risk) and complete care (ABB risk).
Service contracts are done by many ABB companies and can provide win-win for customers and ABB. There are four reasons for customer to buy service contracts including; reduced and predicted life cycle costs, removed peaks in cash flow and lower requirements of technical specific knowledge. Pricing is done in relation to total hardware costs per year and is derived from mean time between failure data of product components.
Refurbishment and buy & re-sell are done within ABB Robotics and the main reason for choosing ABB is guaranteed quality due to OEM parts and correct refurbishment process.
Building an API for charger communication requires approximately one man month of work. Building solutions with the API is more cumbersome. Solutions are very important for selling to the “free infrastructure” value proposition.
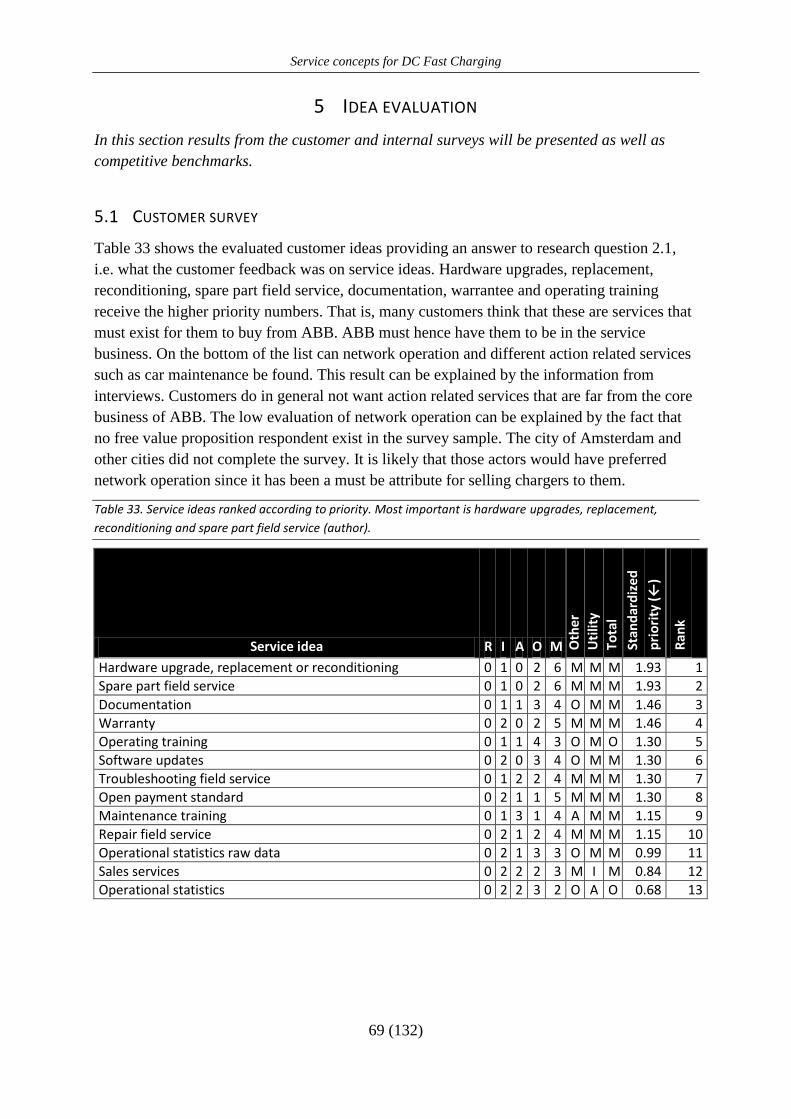
Service concepts for DC Fast Charging
69 (132)
5 IDEA EVALUATION
In this section results from the customer and internal surveys will be presented as well as
competitive benchmarks.
5.1 CUSTOMER SURVEY
Table 33 shows the evaluated customer ideas providing an answer to research question 2.1,
i.e. what the customer feedback was on service ideas. Hardware upgrades, replacement,
reconditioning, spare part field service, documentation, warrantee and operating training
receive the higher priority numbers. That is, many customers think that these are services that
must exist for them to buy from ABB. ABB must hence have them to be in the service
business. On the bottom of the list can network operation and different action related services
such as car maintenance be found. This result can be explained by the information from
interviews. Customers do in general not want action related services that are far from the core
business of ABB. The low evaluation of network operation can be explained by the fact that
no free value proposition respondent exist in the survey sample. The city of Amsterdam and
other cities did not complete the survey. It is likely that those actors would have preferred
network operation since it has been a must be attribute for selling chargers to them.
Table 33. Service ideas ranked according to priority. Most important is hardware upgrades, replacement,
reconditioning and spare part field service (author).
Service idea R I A O M Oth
er
Uti
lity
Tota
l
Stan
dar
diz
ed
pri
ori
ty (
←)
Ran
k Hardware upgrade, replacement or reconditioning 0 1 0 2 6 M M M 1.93 1
Spare part field service 0 1 0 2 6 M M M 1.93 2
Documentation 0 1 1 3 4 O M M 1.46 3
Warranty 0 2 0 2 5 M M M 1.46 4
Operating training 0 1 1 4 3 O M O 1.30 5
Software updates 0 2 0 3 4 O M M 1.30 6
Troubleshooting field service 0 1 2 2 4 M M M 1.30 7
Open payment standard 0 2 1 1 5 M M M 1.30 8
Maintenance training 0 1 3 1 4 A M M 1.15 9
Repair field service 0 2 1 2 4 M M M 1.15 10
Operational statistics raw data 0 2 1 3 3 O M M 0.99 11
Sales services 0 2 2 2 3 M I M 0.84 12
Operational statistics 0 2 2 3 2 O A O 0.68 13

Service concepts for DC Fast Charging
70 (132)
…Table 33. Service ideas ranked according to priority. Most important is hardware upgrades, replacement, reconditioning and spare part field service (author).
Service idea R I A O M Oth
er
Uti
lity
Tota
l
Stan
dar
diz
ed
pri
ori
ty (
←)
Ran
k
Unit availability (where is the next charger?) 0 1 5 3 0 A O A 0.22 14
User remote charging control 0 0 7 2 0 A A A 0.22 15
Processed statistics 0 2 3 4 0 O O O 0.22 16
Balance of plant 0 3 4 0 2 A A A 0.06 17
End of life recycling 0 4 2 1 2 I M I 0.06 18
System optimization consulting during operation 0 2 4 3 0 O A A 0.06 19
Service contracts with different levels of service 0 2 5 1 1 A A A 0.06 20
Smart payment service (subscription, cash or credit) 1 3 0 3 2 M O O 0.06 21
Commissioning 0 4 2 2 1 I M I -0.09 22
Consulting unit sizing 0 4 3 1 1 I A I -0.25 23
End of life re buy and reselling 0 2 6 1 0 A A A -0.25 24
Consulting network design 0 4 2 3 0 O A I -0.25 25
Consulting cost of connection minimization 1 1 4 3 0 A O A -0.25 26
Remote control of display content 0 6 0 2 1 I I I -0.40 27
Remote system for advertising 0 6 1 1 1 I I I -0.56 28
Installation 1 2 5 1 0 A A A -0.72 29
Preventative (scheduled) maintenance 1 3 3 2 0 A I A -0.72 30
Pre and post grid analysis 0 5 3 1 0 I A I -0.72 31
Openly accessible stats API 2 1 3 3 0 A O O -0.72 32
Wi-Fi services to smart phones in the area 0 5 4 0 0 I A I -0.87 33
Media distribution/sales 0 5 4 0 0 A I I -0.87 34
Consulting location analysis 1 4 3 1 0 A I I -1.03 35
Smart grid service storing power 0 6 3 0 0 I A I -1.03 36
Statistics/information to end user 1 2 4 1 0 A A A -1.03 37
Location specific adoptions (civil engineering) 1 4 4 0 0 I A A -1.18 38
Predictive maintenance (using remote) 1 4 4 0 0 A A A -1.18 39
Financial services 1 5 2 1 0 A I I -1.18 40
Reward system for charging at your stations 0 7 2 0 0 I I I -1.18 41
Car maintenance (software updates to cars) 2 4 2 1 0 A I I -1.49 42
Network operation 3 3 2 1 0 R I I -1.80 43
The classification of attributes can be depicted with the satisfaction and dissatisfaction scores.
Figure 26 shows this evaluation. Figure 26 also groups the service ideas into their total
classification as either must be, one dimensional, attractive or indifferent. Reward system for
charging and remote control of the display are examples of ideas that are most indifferent with
this way of analyzing. Network operation and the different consulting services are on the
border line to be attractive.
The most attractive service is “user remote charging control”, where the user can log in to the
charger and see status whole for example being away drinking coffee. The strongest must be
service is to have hardware upgrades, replacements and reconditioning. Field service,
documentation and warrantee are also very important to have.
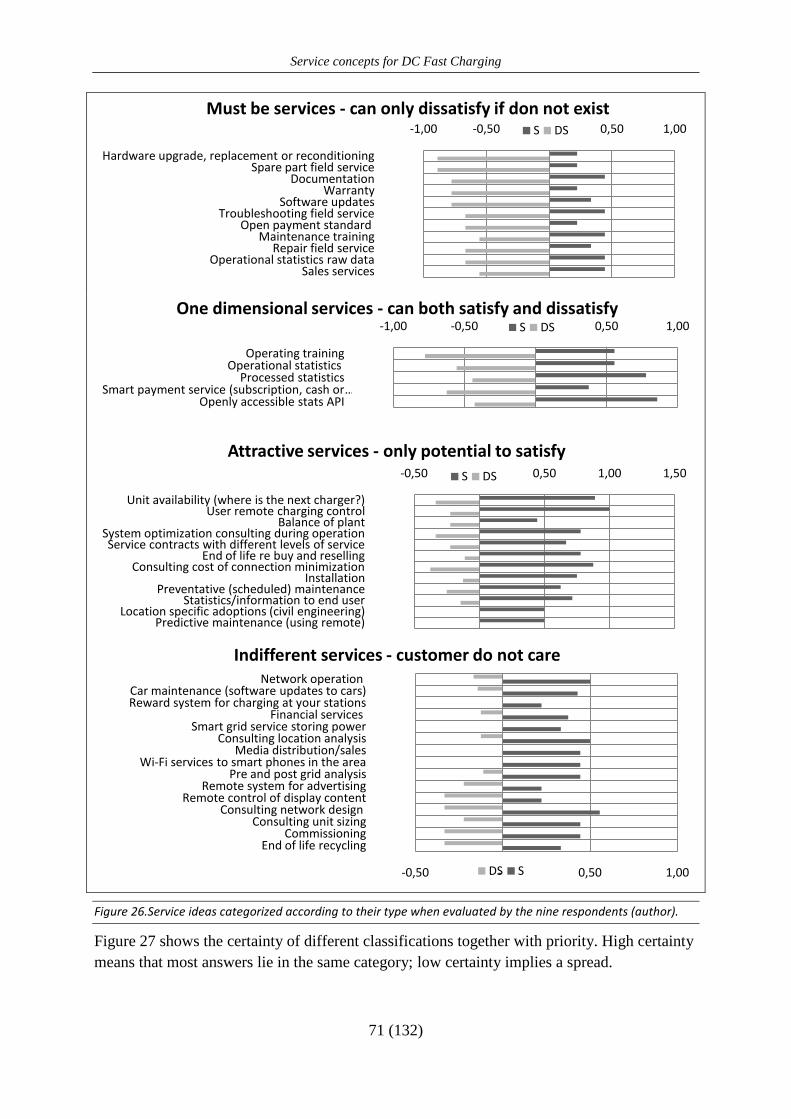
Service concepts for DC Fast Charging
71 (132)
Figure 26.Service ideas categorized according to their type when evaluated by the nine respondents (author).
Figure 27 shows the certainty of different classifications together with priority. High certainty
means that most answers lie in the same category; low certainty implies a spread.
-1,00 -0,50 - 0,50 1,00
Hardware upgrade, replacement or reconditioningSpare part field service
DocumentationWarranty
Software updatesTroubleshooting field service
Open payment standard Maintenance training
Repair field serviceOperational statistics raw data
Sales services
Must be services - can only dissatisfy if don not existS DS
-1,00 -0,50 - 0,50 1,00
Operating trainingOperational statistics
Processed statisticsSmart payment service (subscription, cash or …
Openly accessible stats API
One dimensional services - can both satisfy and dissatisfyS DS
-0,50 - 0,50 1,00 1,50
Unit availability (where is the next charger?)User remote charging control
Balance of plantSystem optimization consulting during operationService contracts with different levels of service
End of life re buy and resellingConsulting cost of connection minimization
InstallationPreventative (scheduled) maintenance
Statistics/information to end userLocation specific adoptions (civil engineering)
Predictive maintenance (using remote)
Attractive services - only potential to satisfy
S DS
-0,50 - 0,50 1,00
End of life recyclingCommissioning
Consulting unit sizingConsulting network design
Remote control of display contentRemote system for advertising
Pre and post grid analysisWi-Fi services to smart phones in the area
Media distribution/salesConsulting location analysis
Smart grid service storing powerFinancial services
Reward system for charging at your stationsCar maintenance (software updates to cars)
Network operation
Indifferent services - customer do not care
DS S
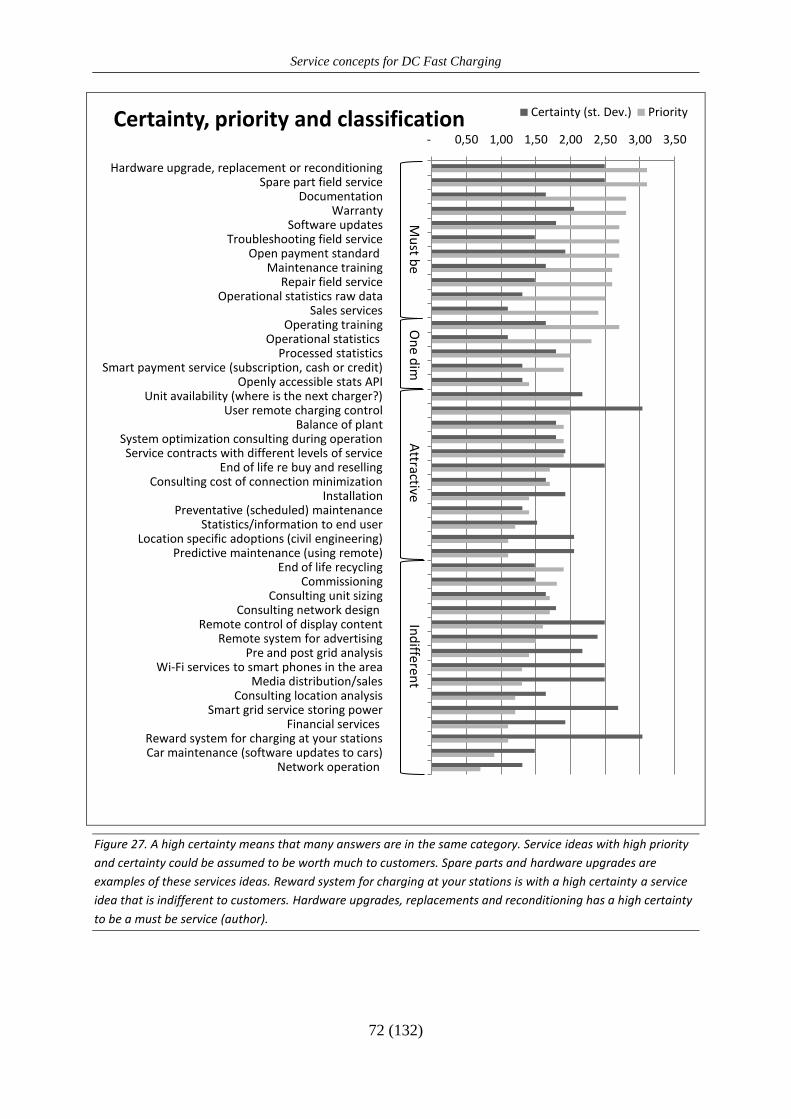
Service concepts for DC Fast Charging
72 (132)
Figure 27. A high certainty means that many answers are in the same category. Service ideas with high priority
and certainty could be assumed to be worth much to customers. Spare parts and hardware upgrades are
examples of these services ideas. Reward system for charging at your stations is with a high certainty a service
idea that is indifferent to customers. Hardware upgrades, replacements and reconditioning has a high certainty
to be a must be service (author).
- 0,50 1,00 1,50 2,00 2,50 3,00 3,50
Hardware upgrade, replacement or reconditioningSpare part field service
DocumentationWarranty
Software updatesTroubleshooting field service
Open payment standard Maintenance training
Repair field serviceOperational statistics raw data
Sales servicesOperating training
Operational statistics Processed statistics
Smart payment service (subscription, cash or credit)Openly accessible stats API
Unit availability (where is the next charger?)User remote charging control
Balance of plantSystem optimization consulting during operationService contracts with different levels of service
End of life re buy and resellingConsulting cost of connection minimization
InstallationPreventative (scheduled) maintenance
Statistics/information to end userLocation specific adoptions (civil engineering)
Predictive maintenance (using remote)End of life recycling
CommissioningConsulting unit sizing
Consulting network design Remote control of display content
Remote system for advertisingPre and post grid analysis
Wi-Fi services to smart phones in the areaMedia distribution/sales
Consulting location analysisSmart grid service storing power
Financial services Reward system for charging at your stationsCar maintenance (software updates to cars)
Network operation
Certainty, priority and classification Certainty (st. Dev.) Priority
Mu
st be O
ne d
im A
ttractiveIn
differen
t
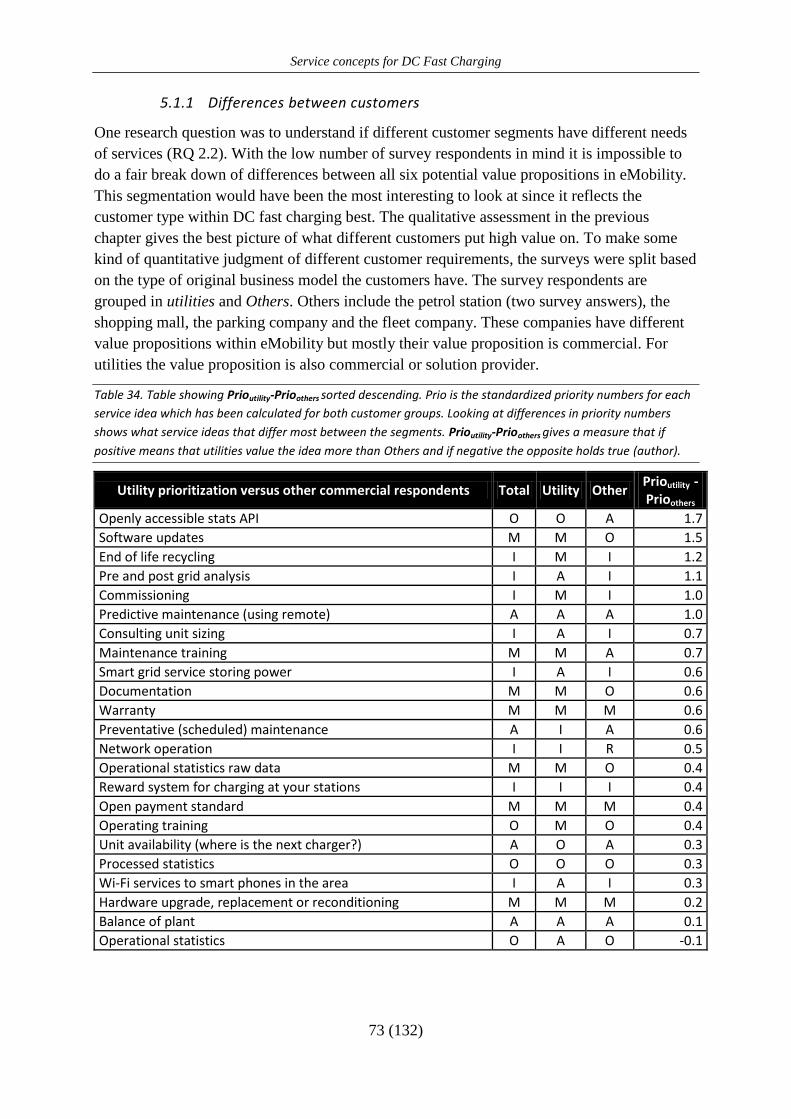
Service concepts for DC Fast Charging
73 (132)
5.1.1 Differences between customers
One research question was to understand if different customer segments have different needs
of services (RQ 2.2). With the low number of survey respondents in mind it is impossible to
do a fair break down of differences between all six potential value propositions in eMobility.
This segmentation would have been the most interesting to look at since it reflects the
customer type within DC fast charging best. The qualitative assessment in the previous
chapter gives the best picture of what different customers put high value on. To make some
kind of quantitative judgment of different customer requirements, the surveys were split based
on the type of original business model the customers have. The survey respondents are
grouped in utilities and Others. Others include the petrol station (two survey answers), the
shopping mall, the parking company and the fleet company. These companies have different
value propositions within eMobility but mostly their value proposition is commercial. For
utilities the value proposition is also commercial or solution provider.
Table 34. Table showing Prioutility-Prioothers sorted descending. Prio is the standardized priority numbers for each
service idea which has been calculated for both customer groups. Looking at differences in priority numbers
shows what service ideas that differ most between the segments. Prioutility-Prioothers gives a measure that if
positive means that utilities value the idea more than Others and if negative the opposite holds true (author).
Utility prioritization versus other commercial respondents Total Utility Other Prioutility - Prioothers
Openly accessible stats API O O A 1.7
Software updates M M O 1.5
End of life recycling I M I 1.2
Pre and post grid analysis I A I 1.1
Commissioning I M I 1.0
Predictive maintenance (using remote) A A A 1.0
Consulting unit sizing I A I 0.7
Maintenance training M M A 0.7
Smart grid service storing power I A I 0.6
Documentation M M O 0.6
Warranty M M M 0.6
Preventative (scheduled) maintenance A I A 0.6
Network operation I I R 0.5
Operational statistics raw data M M O 0.4
Reward system for charging at your stations I I I 0.4
Open payment standard M M M 0.4
Operating training O M O 0.4
Unit availability (where is the next charger?) A O A 0.3
Processed statistics O O O 0.3
Wi-Fi services to smart phones in the area I A I 0.3
Hardware upgrade, replacement or reconditioning M M M 0.2
Balance of plant A A A 0.1
Operational statistics O A O -0.1
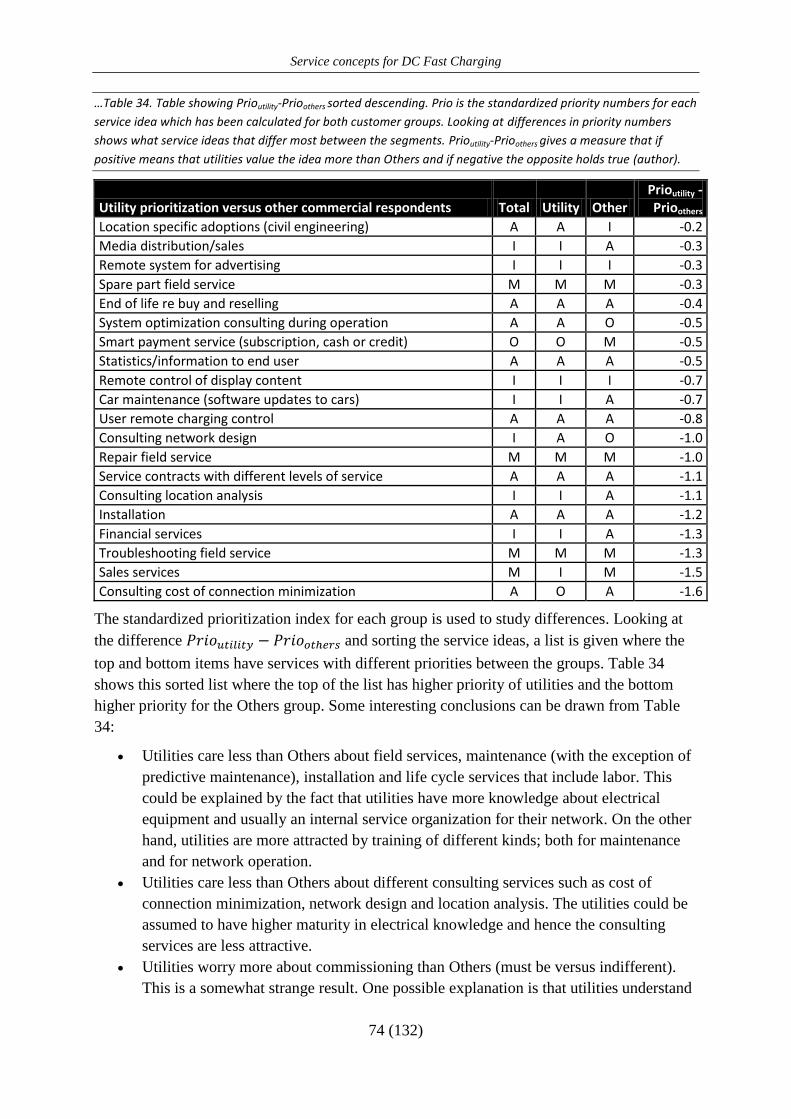
Service concepts for DC Fast Charging
74 (132)
…Table 34. Table showing Prioutility-Prioothers sorted descending. Prio is the standardized priority numbers for each
service idea which has been calculated for both customer groups. Looking at differences in priority numbers
shows what service ideas that differ most between the segments. Prioutility-Prioothers gives a measure that if
positive means that utilities value the idea more than Others and if negative the opposite holds true (author).
Utility prioritization versus other commercial respondents Total Utility Other Prioutility -Prioothers
Location specific adoptions (civil engineering) A A I -0.2
Media distribution/sales I I A -0.3
Remote system for advertising I I I -0.3
Spare part field service M M M -0.3
End of life re buy and reselling A A A -0.4
System optimization consulting during operation A A O -0.5
Smart payment service (subscription, cash or credit) O O M -0.5
Statistics/information to end user A A A -0.5
Remote control of display content I I I -0.7
Car maintenance (software updates to cars) I I A -0.7
User remote charging control A A A -0.8
Consulting network design I A O -1.0
Repair field service M M M -1.0
Service contracts with different levels of service A A A -1.1
Consulting location analysis I I A -1.1
Installation A A A -1.2
Financial services I I A -1.3
Troubleshooting field service M M M -1.3
Sales services M I M -1.5
Consulting cost of connection minimization A O A -1.6
The standardized prioritization index for each group is used to study differences. Looking at
the difference and sorting the service ideas, a list is given where the
top and bottom items have services with different priorities between the groups. Table 34
shows this sorted list where the top of the list has higher priority of utilities and the bottom
higher priority for the Others group. Some interesting conclusions can be drawn from Table
34:
Utilities care less than Others about field services, maintenance (with the exception of
predictive maintenance), installation and life cycle services that include labor. This
could be explained by the fact that utilities have more knowledge about electrical
equipment and usually an internal service organization for their network. On the other
hand, utilities are more attracted by training of different kinds; both for maintenance
and for network operation.
Utilities care less than Others about different consulting services such as cost of
connection minimization, network design and location analysis. The utilities could be
assumed to have higher maturity in electrical knowledge and hence the consulting
services are less attractive.
Utilities worry more about commissioning than Others (must be versus indifferent).
This is a somewhat strange result. One possible explanation is that utilities understand
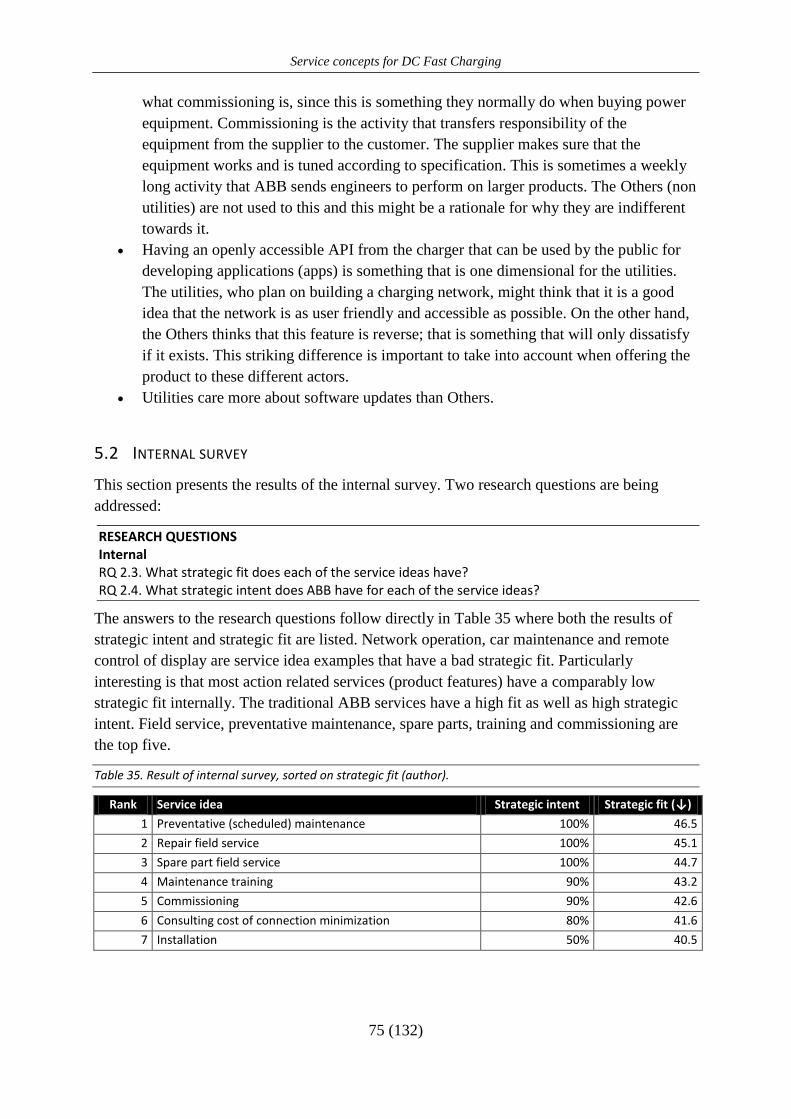
Service concepts for DC Fast Charging
75 (132)
what commissioning is, since this is something they normally do when buying power
equipment. Commissioning is the activity that transfers responsibility of the
equipment from the supplier to the customer. The supplier makes sure that the
equipment works and is tuned according to specification. This is sometimes a weekly
long activity that ABB sends engineers to perform on larger products. The Others (non
utilities) are not used to this and this might be a rationale for why they are indifferent
towards it.
Having an openly accessible API from the charger that can be used by the public for
developing applications (apps) is something that is one dimensional for the utilities.
The utilities, who plan on building a charging network, might think that it is a good
idea that the network is as user friendly and accessible as possible. On the other hand,
the Others thinks that this feature is reverse; that is something that will only dissatisfy
if it exists. This striking difference is important to take into account when offering the
product to these different actors.
Utilities care more about software updates than Others.
5.2 INTERNAL SURVEY
This section presents the results of the internal survey. Two research questions are being
addressed:
RESEARCH QUESTIONS Internal RQ 2.3. What strategic fit does each of the service ideas have? RQ 2.4. What strategic intent does ABB have for each of the service ideas?
The answers to the research questions follow directly in Table 35 where both the results of
strategic intent and strategic fit are listed. Network operation, car maintenance and remote
control of display are service idea examples that have a bad strategic fit. Particularly
interesting is that most action related services (product features) have a comparably low
strategic fit internally. The traditional ABB services have a high fit as well as high strategic
intent. Field service, preventative maintenance, spare parts, training and commissioning are
the top five.
Table 35. Result of internal survey, sorted on strategic fit (author).
Rank Service idea Strategic intent Strategic fit (↓)
1 Preventative (scheduled) maintenance 100% 46.5
2 Repair field service 100% 45.1
3 Spare part field service 100% 44.7
4 Maintenance training 90% 43.2
5 Commissioning 90% 42.6
6 Consulting cost of connection minimization 80% 41.6
7 Installation 50% 40.5
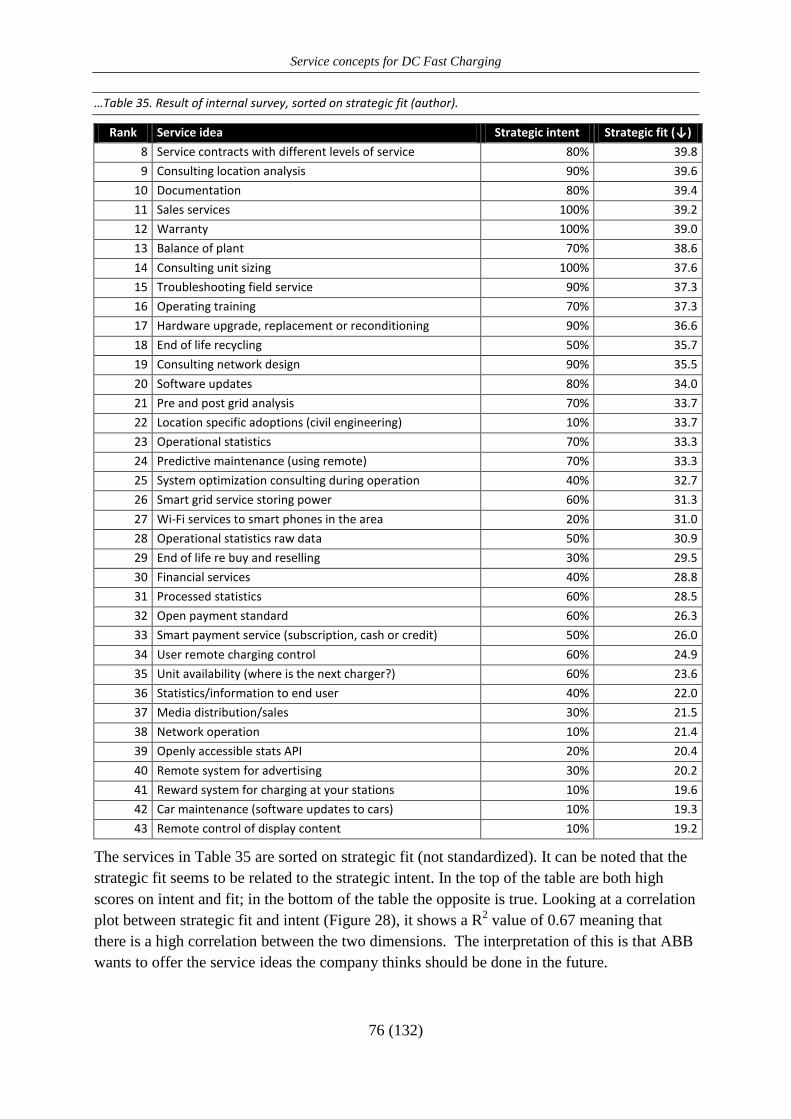
Service concepts for DC Fast Charging
76 (132)
…Table 35. Result of internal survey, sorted on strategic fit (author).
Rank Service idea Strategic intent Strategic fit (↓)
8 Service contracts with different levels of service 80% 39.8
9 Consulting location analysis 90% 39.6
10 Documentation 80% 39.4
11 Sales services 100% 39.2
12 Warranty 100% 39.0
13 Balance of plant 70% 38.6
14 Consulting unit sizing 100% 37.6
15 Troubleshooting field service 90% 37.3
16 Operating training 70% 37.3
17 Hardware upgrade, replacement or reconditioning 90% 36.6
18 End of life recycling 50% 35.7
19 Consulting network design 90% 35.5
20 Software updates 80% 34.0
21 Pre and post grid analysis 70% 33.7
22 Location specific adoptions (civil engineering) 10% 33.7
23 Operational statistics 70% 33.3
24 Predictive maintenance (using remote) 70% 33.3
25 System optimization consulting during operation 40% 32.7
26 Smart grid service storing power 60% 31.3
27 Wi-Fi services to smart phones in the area 20% 31.0
28 Operational statistics raw data 50% 30.9
29 End of life re buy and reselling 30% 29.5
30 Financial services 40% 28.8
31 Processed statistics 60% 28.5
32 Open payment standard 60% 26.3
33 Smart payment service (subscription, cash or credit) 50% 26.0
34 User remote charging control 60% 24.9
35 Unit availability (where is the next charger?) 60% 23.6
36 Statistics/information to end user 40% 22.0
37 Media distribution/sales 30% 21.5
38 Network operation 10% 21.4
39 Openly accessible stats API 20% 20.4
40 Remote system for advertising 30% 20.2
41 Reward system for charging at your stations 10% 19.6
42 Car maintenance (software updates to cars) 10% 19.3
43 Remote control of display content 10% 19.2
The services in Table 35 are sorted on strategic fit (not standardized). It can be noted that the
strategic fit seems to be related to the strategic intent. In the top of the table are both high
scores on intent and fit; in the bottom of the table the opposite is true. Looking at a correlation
plot between strategic fit and intent (Figure 28), it shows a R2 value of 0.67 meaning that
there is a high correlation between the two dimensions. The interpretation of this is that ABB
wants to offer the service ideas the company thinks should be done in the future.
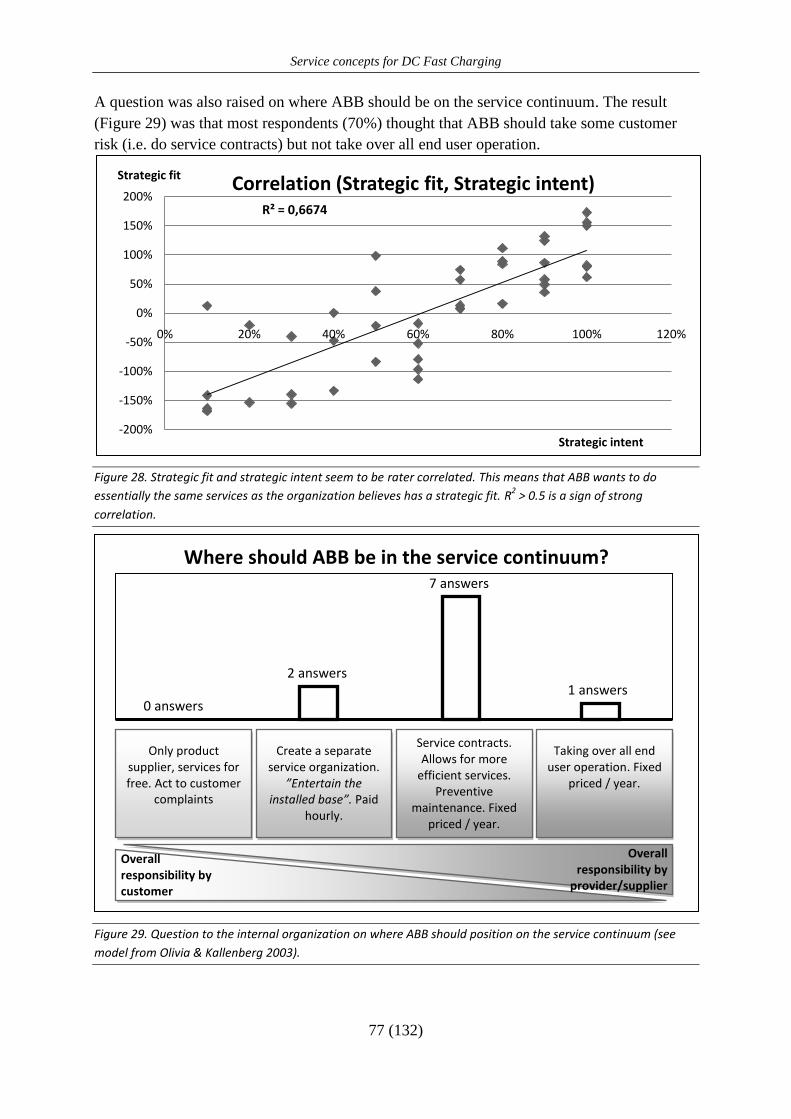
Service concepts for DC Fast Charging
77 (132)
A question was also raised on where ABB should be on the service continuum. The result
(Figure 29) was that most respondents (70%) thought that ABB should take some customer
risk (i.e. do service contracts) but not take over all end user operation.
Figure 28. Strategic fit and strategic intent seem to be rater correlated. This means that ABB wants to do
essentially the same services as the organization believes has a strategic fit. R2 > 0.5 is a sign of strong
correlation.
Figure 29. Question to the internal organization on where ABB should position on the service continuum (see
model from Olivia & Kallenberg 2003).
R² = 0,6674
-200%
-150%
-100%
-50%
0%
50%
100%
150%
200%
0% 20% 40% 60% 80% 100% 120%
Strategic fit
Strategic intent
Correlation (Strategic fit, Strategic intent)
Only product supplier, services for free. Act to customer
complaints
Create a separate service organization.
”Entertain the installed base”. Paid
hourly.
Service contracts. Allows for more
efficient services. Preventive
maintenance. Fixed priced / year.
Taking over all end user operation. Fixed
priced / year.
Overall responsibility by customer
Overall responsibility by
provider/supplier
0 answers
2 answers
7 answers
1 answers
Where should ABB be in the service continuum?
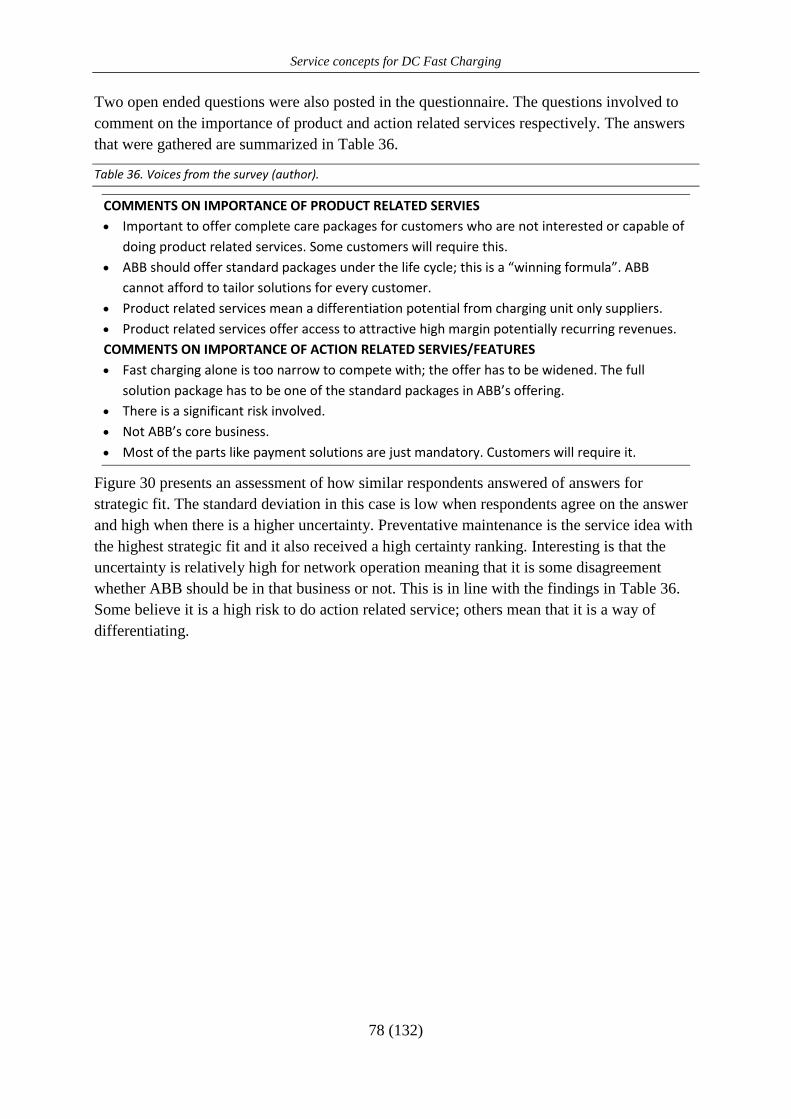
Service concepts for DC Fast Charging
78 (132)
Two open ended questions were also posted in the questionnaire. The questions involved to
comment on the importance of product and action related services respectively. The answers
that were gathered are summarized in Table 36.
Table 36. Voices from the survey (author).
COMMENTS ON IMPORTANCE OF PRODUCT RELATED SERVIES
Important to offer complete care packages for customers who are not interested or capable of
doing product related services. Some customers will require this.
ABB should offer standard packages under the life cycle; this is a “winning formula”. ABB
cannot afford to tailor solutions for every customer.
Product related services mean a differentiation potential from charging unit only suppliers.
Product related services offer access to attractive high margin potentially recurring revenues.
COMMENTS ON IMPORTANCE OF ACTION RELATED SERVIES/FEATURES
Fast charging alone is too narrow to compete with; the offer has to be widened. The full
solution package has to be one of the standard packages in ABB’s offering.
There is a significant risk involved.
Not ABB’s core business.
Most of the parts like payment solutions are just mandatory. Customers will require it.
Figure 30 presents an assessment of how similar respondents answered of answers for
strategic fit. The standard deviation in this case is low when respondents agree on the answer
and high when there is a higher uncertainty. Preventative maintenance is the service idea with
the highest strategic fit and it also received a high certainty ranking. Interesting is that the
uncertainty is relatively high for network operation meaning that it is some disagreement
whether ABB should be in that business or not. This is in line with the findings in Table 36.
Some believe it is a high risk to do action related service; others mean that it is a way of
differentiating.
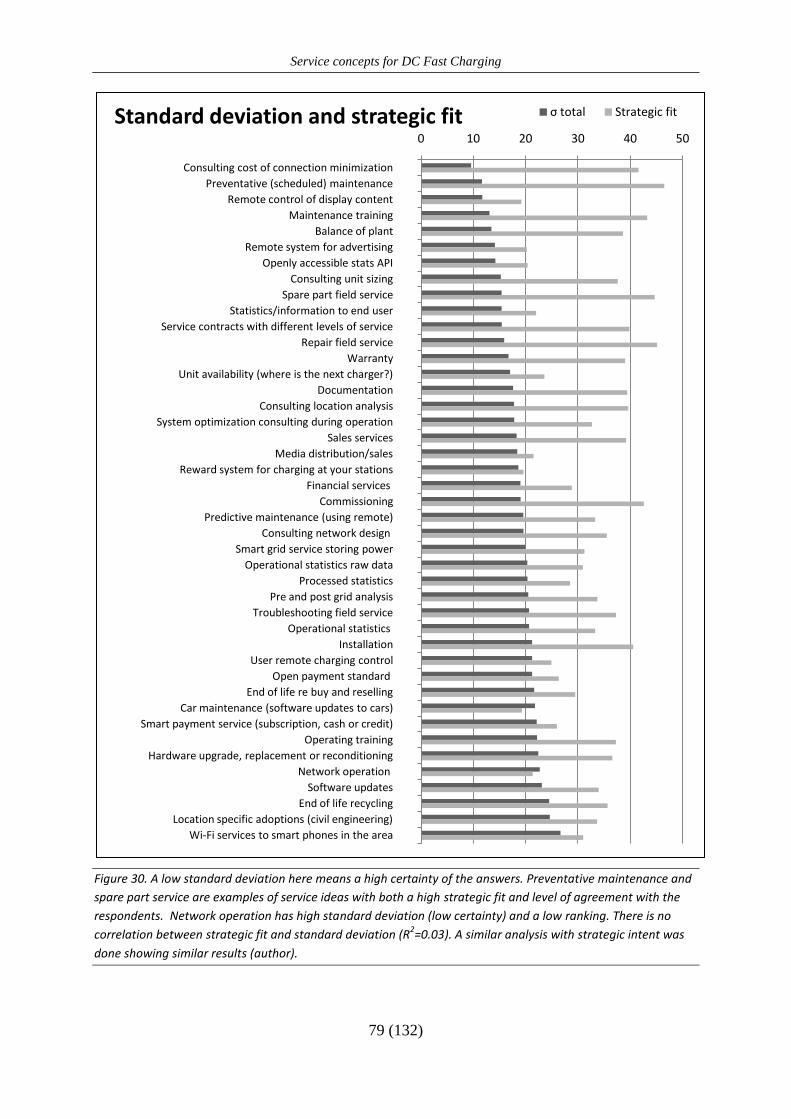
Service concepts for DC Fast Charging
79 (132)
Figure 30. A low standard deviation here means a high certainty of the answers. Preventative maintenance and
spare part service are examples of service ideas with both a high strategic fit and level of agreement with the
respondents. Network operation has high standard deviation (low certainty) and a low ranking. There is no
correlation between strategic fit and standard deviation (R2=0.03). A similar analysis with strategic intent was
done showing similar results (author).
0 10 20 30 40 50
Consulting cost of connection minimization
Preventative (scheduled) maintenance
Remote control of display content
Maintenance training
Balance of plant
Remote system for advertising
Openly accessible stats API
Consulting unit sizing
Spare part field service
Statistics/information to end user
Service contracts with different levels of service
Repair field service
Warranty
Unit availability (where is the next charger?)
Documentation
Consulting location analysis
System optimization consulting during operation
Sales services
Media distribution/sales
Reward system for charging at your stations
Financial services
Commissioning
Predictive maintenance (using remote)
Consulting network design
Smart grid service storing power
Operational statistics raw data
Processed statistics
Pre and post grid analysis
Troubleshooting field service
Operational statistics
Installation
User remote charging control
Open payment standard
End of life re buy and reselling
Car maintenance (software updates to cars)
Smart payment service (subscription, cash or credit)
Operating training
Hardware upgrade, replacement or reconditioning
Network operation
Software updates
End of life recycling
Location specific adoptions (civil engineering)
Wi-Fi services to smart phones in the area
Standard deviation and strategic fit σ total Strategic fit
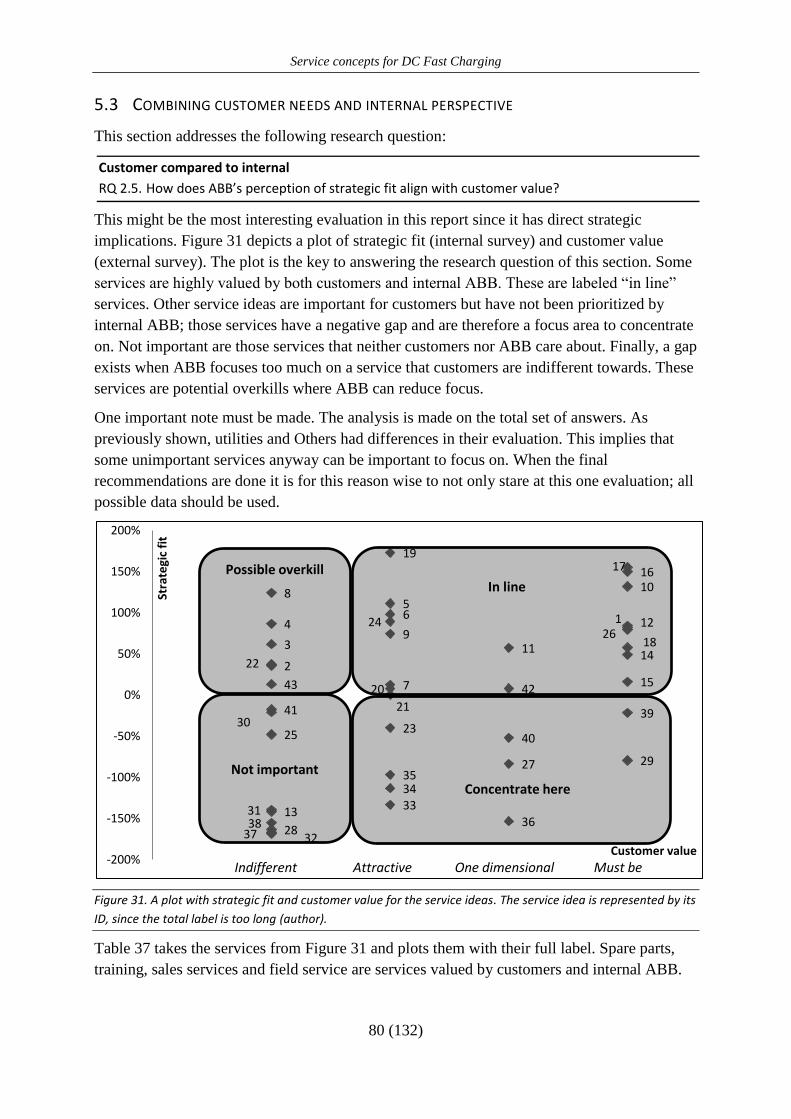
Service concepts for DC Fast Charging
80 (132)
5.3 COMBINING CUSTOMER NEEDS AND INTERNAL PERSPECTIVE
This section addresses the following research question:
Customer compared to internal
RQ 2.5. How does ABB’s perception of strategic fit align with customer value?
This might be the most interesting evaluation in this report since it has direct strategic
implications. Figure 31 depicts a plot of strategic fit (internal survey) and customer value
(external survey). The plot is the key to answering the research question of this section. Some
services are highly valued by both customers and internal ABB. These are labeled “in line”
services. Other service ideas are important for customers but have not been prioritized by
internal ABB; those services have a negative gap and are therefore a focus area to concentrate
on. Not important are those services that neither customers nor ABB care about. Finally, a gap
exists when ABB focuses too much on a service that customers are indifferent towards. These
services are potential overkills where ABB can reduce focus.
One important note must be made. The analysis is made on the total set of answers. As
previously shown, utilities and Others had differences in their evaluation. This implies that
some unimportant services anyway can be important to focus on. When the final
recommendations are done it is for this reason wise to not only stare at this one evaluation; all
possible data should be used.
Figure 31. A plot with strategic fit and customer value for the service ideas. The service idea is represented by its
ID, since the total label is too long (author).
Table 37 takes the services from Figure 31 and plots them with their full label. Spare parts,
training, sales services and field service are services valued by customers and internal ABB.
1
2
3
4
56
7
8
9
10
11
12
13
14
15
1617
18
19
20
21
22
23
24
25
26
27
28
29
30
31
32
333435
363738
39
40
41
4243
-200%
-150%
-100%
-50%
0%
50%
100%
150%
200%
Stra
tegi
c fi
t
Customer value
Concentrate here
Indifferent Attractive One dimensional Must be
Possible overkill
Not important
In line
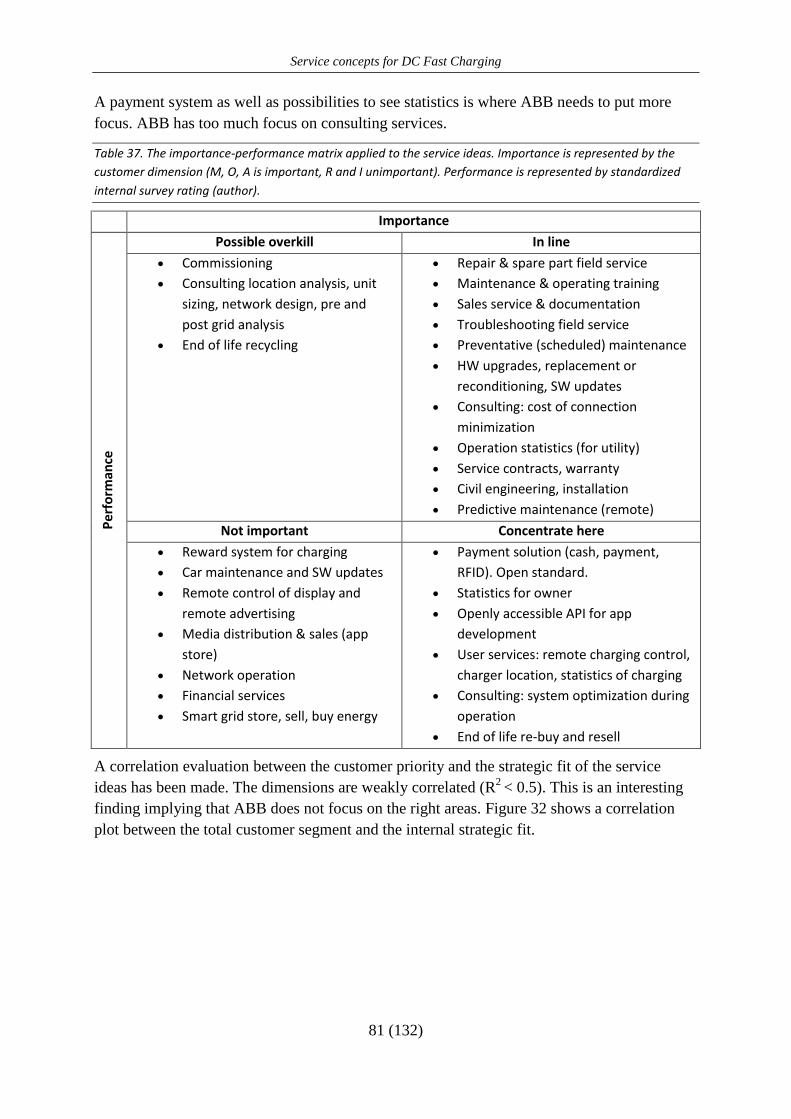
Service concepts for DC Fast Charging
81 (132)
A payment system as well as possibilities to see statistics is where ABB needs to put more
focus. ABB has too much focus on consulting services.
Table 37. The importance-performance matrix applied to the service ideas. Importance is represented by the
customer dimension (M, O, A is important, R and I unimportant). Performance is represented by standardized
internal survey rating (author).
Importance
Pe
rfo
rman
ce
Possible overkill In line
Commissioning
Consulting location analysis, unit
sizing, network design, pre and
post grid analysis
End of life recycling
Repair & spare part field service
Maintenance & operating training
Sales service & documentation
Troubleshooting field service
Preventative (scheduled) maintenance
HW upgrades, replacement or
reconditioning, SW updates
Consulting: cost of connection
minimization
Operation statistics (for utility)
Service contracts, warranty
Civil engineering, installation
Predictive maintenance (remote)
Not important Concentrate here
Reward system for charging
Car maintenance and SW updates
Remote control of display and
remote advertising
Media distribution & sales (app
store)
Network operation
Financial services
Smart grid store, sell, buy energy
Payment solution (cash, payment,
RFID). Open standard.
Statistics for owner
Openly accessible API for app
development
User services: remote charging control,
charger location, statistics of charging
Consulting: system optimization during
operation
End of life re-buy and resell
A correlation evaluation between the customer priority and the strategic fit of the service
ideas has been made. The dimensions are weakly correlated (R2
< 0.5). This is an interesting
finding implying that ABB does not focus on the right areas. Figure 32 shows a correlation
plot between the total customer segment and the internal strategic fit.
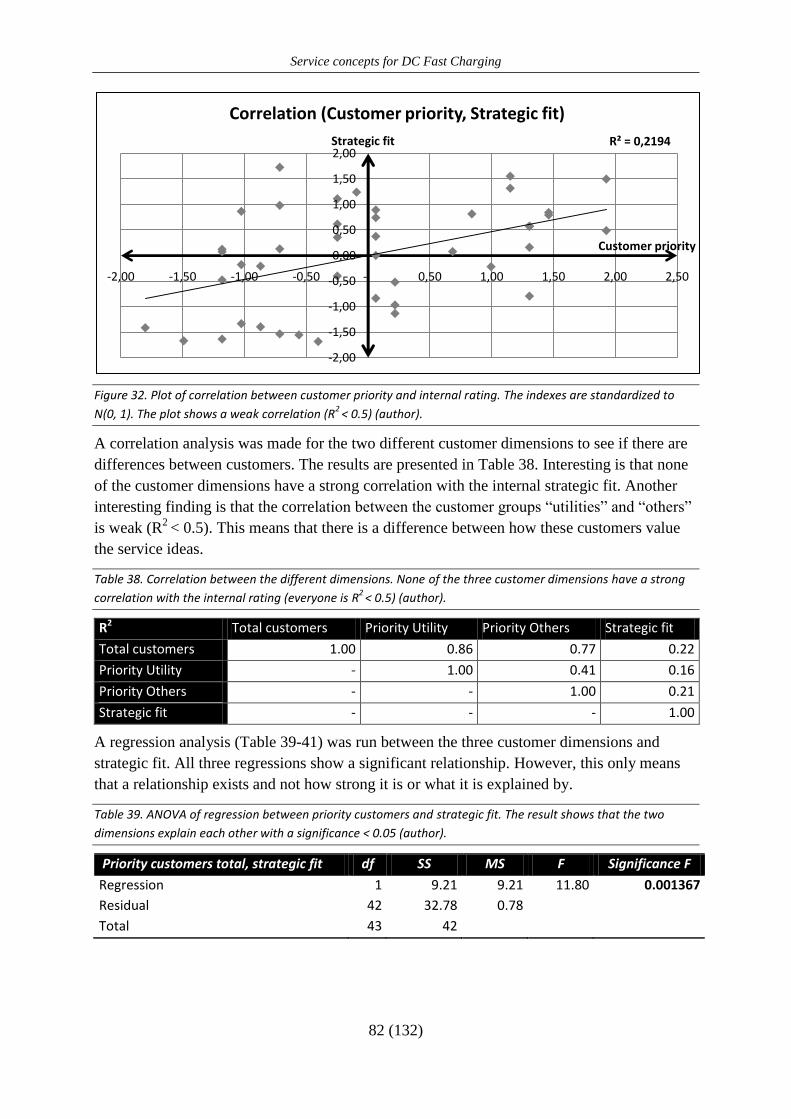
Service concepts for DC Fast Charging
82 (132)
Figure 32. Plot of correlation between customer priority and internal rating. The indexes are standardized to
N(0, 1). The plot shows a weak correlation (R2
< 0.5) (author).
A correlation analysis was made for the two different customer dimensions to see if there are
differences between customers. The results are presented in Table 38. Interesting is that none
of the customer dimensions have a strong correlation with the internal strategic fit. Another
interesting finding is that the correlation between the customer groups “utilities” and “others”
is weak (R2
< 0.5). This means that there is a difference between how these customers value
the service ideas.
Table 38. Correlation between the different dimensions. None of the three customer dimensions have a strong
correlation with the internal rating (everyone is R2
< 0.5) (author).
R2 Total customers Priority Utility Priority Others Strategic fit
Total customers 1.00 0.86 0.77 0.22
Priority Utility - 1.00 0.41 0.16
Priority Others - - 1.00 0.21
Strategic fit - - - 1.00
A regression analysis (Table 39-41) was run between the three customer dimensions and
strategic fit. All three regressions show a significant relationship. However, this only means
that a relationship exists and not how strong it is or what it is explained by.
Table 39. ANOVA of regression between priority customers and strategic fit. The result shows that the two
dimensions explain each other with a significance < 0.05 (author).
Priority customers total, strategic fit df SS MS F Significance F
Regression 1 9.21 9.21 11.80 0.001367
Residual 42 32.78 0.78
Total 43 42
R² = 0,2194
-2,00
-1,50
-1,00
-0,50
0,00
0,50
1,00
1,50
2,00
-2,00 -1,50 -1,00 -0,50 - 0,50 1,00 1,50 2,00 2,50
Strategic fit
Customer priority
Correlation (Customer priority, Strategic fit)
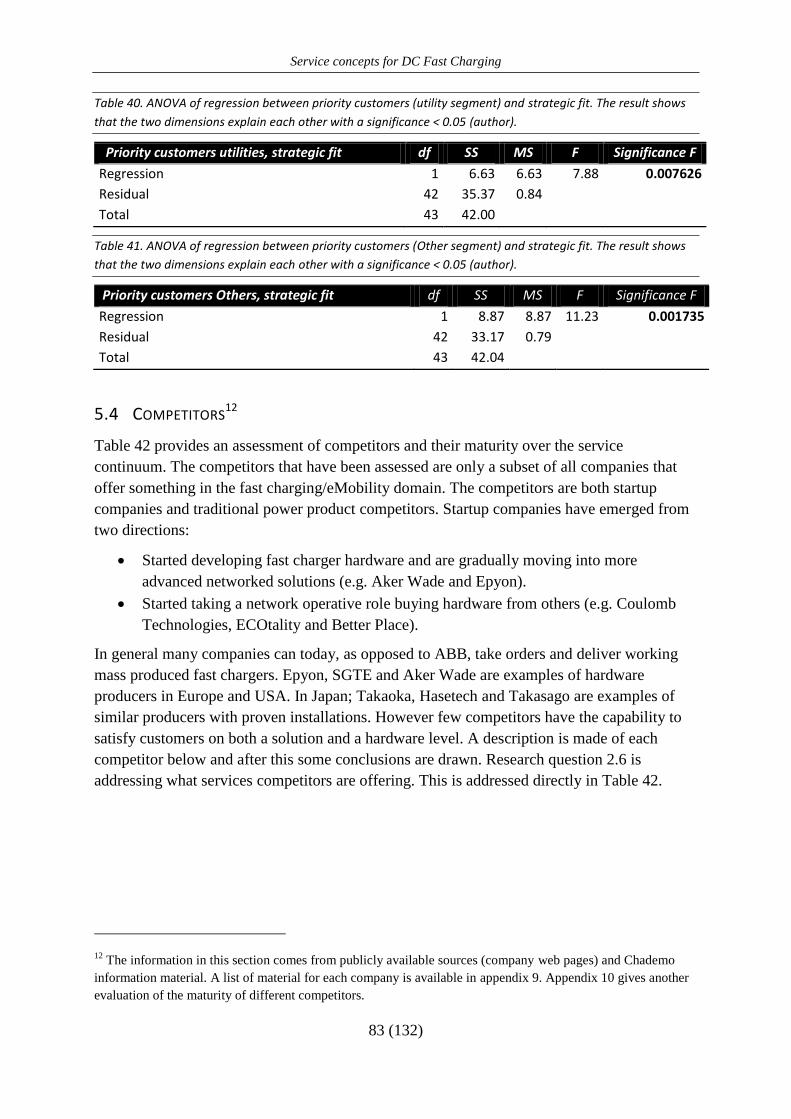
Service concepts for DC Fast Charging
83 (132)
Table 40. ANOVA of regression between priority customers (utility segment) and strategic fit. The result shows
that the two dimensions explain each other with a significance < 0.05 (author).
Priority customers utilities, strategic fit df SS MS F Significance F
Regression 1 6.63 6.63 7.88 0.007626
Residual 42 35.37 0.84
Total 43 42.00
Table 41. ANOVA of regression between priority customers (Other segment) and strategic fit. The result shows
that the two dimensions explain each other with a significance < 0.05 (author).
Priority customers Others, strategic fit df SS MS F Significance F
Regression 1 8.87 8.87 11.23 0.001735
Residual 42 33.17 0.79
Total 43 42.04
5.4 COMPETITORS12
Table 42 provides an assessment of competitors and their maturity over the service
continuum. The competitors that have been assessed are only a subset of all companies that
offer something in the fast charging/eMobility domain. The competitors are both startup
companies and traditional power product competitors. Startup companies have emerged from
two directions:
Started developing fast charger hardware and are gradually moving into more
advanced networked solutions (e.g. Aker Wade and Epyon).
Started taking a network operative role buying hardware from others (e.g. Coulomb
Technologies, ECOtality and Better Place).
In general many companies can today, as opposed to ABB, take orders and deliver working
mass produced fast chargers. Epyon, SGTE and Aker Wade are examples of hardware
producers in Europe and USA. In Japan; Takaoka, Hasetech and Takasago are examples of
similar producers with proven installations. However few competitors have the capability to
satisfy customers on both a solution and a hardware level. A description is made of each
competitor below and after this some conclusions are drawn. Research question 2.6 is
addressing what services competitors are offering. This is addressed directly in Table 42.
12 The information in this section comes from publicly available sources (company web pages) and Chademo
information material. A list of material for each company is available in appendix 9. Appendix 10 gives another
evaluation of the maturity of different competitors.
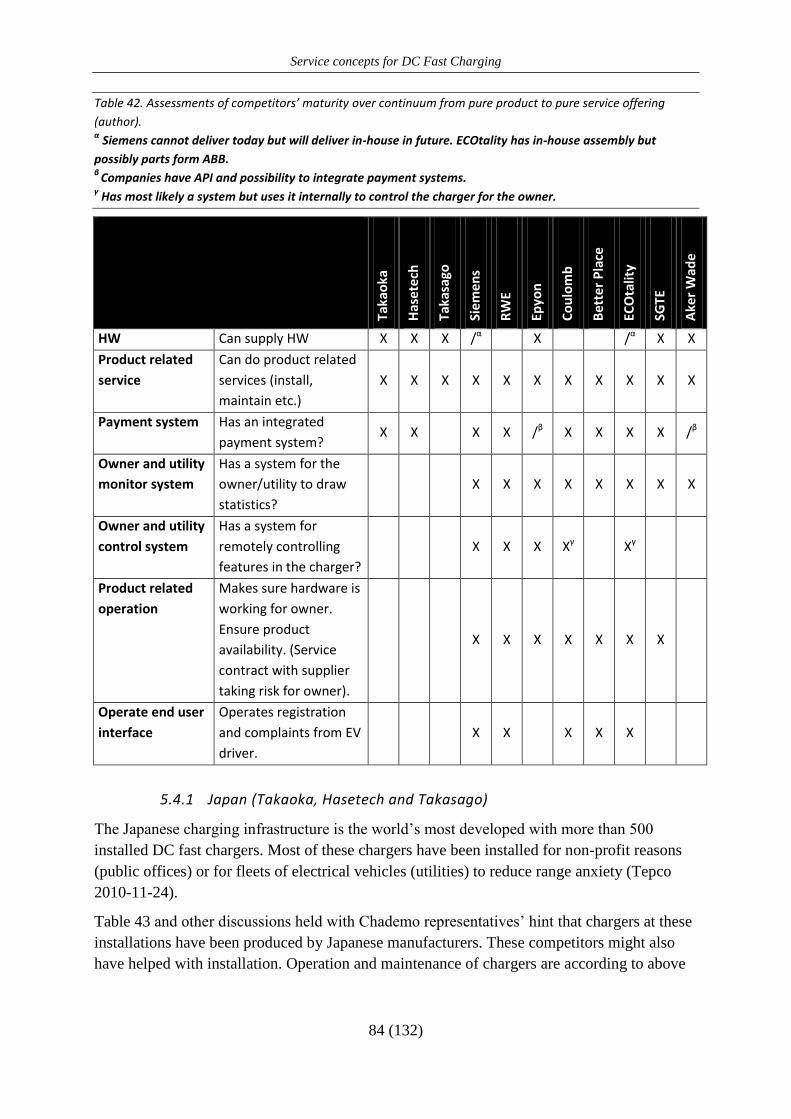
Service concepts for DC Fast Charging
84 (132)
Table 42. Assessments of competitors’ maturity over continuum from pure product to pure service offering
(author). α Siemens cannot deliver today but will deliver in-house in future. ECOtality has in-house assembly but
possibly parts form ABB. β
Companies have API and possibility to integrate payment systems. γ Has most likely a system but uses it internally to control the charger for the owner.
Taka
oka
Has
ete
ch
Taka
sago
Siem
en
s
RW
E
Epyo
n
Co
ulo
mb
Bet
ter
Pla
ce
ECO
talit
y
SGTE
Ake
r W
ade
HW Can supply HW X X X /α
X
/α X X
Product related
service
Can do product related
services (install,
maintain etc.)
X X X X X X X X X X X
Payment system Has an integrated
payment system? X X
X X /β X X X X /β
Owner and utility
monitor system
Has a system for the
owner/utility to draw
statistics?
X X X X X X X X
Owner and utility
control system
Has a system for
remotely controlling
features in the charger?
X X X Xγ
Xγ
Product related
operation
Makes sure hardware is
working for owner.
Ensure product
availability. (Service
contract with supplier
taking risk for owner).
X X X X X X X
Operate end user
interface
Operates registration
and complaints from EV
driver.
X X
X X X
5.4.1 Japan (Takaoka, Hasetech and Takasago)
The Japanese charging infrastructure is the world’s most developed with more than 500
installed DC fast chargers. Most of these chargers have been installed for non-profit reasons
(public offices) or for fleets of electrical vehicles (utilities) to reduce range anxiety (Tepco
2010-11-24).
Table 43 and other discussions held with Chademo representatives’ hint that chargers at these
installations have been produced by Japanese manufacturers. These competitors might also
have helped with installation. Operation and maintenance of chargers are according to above
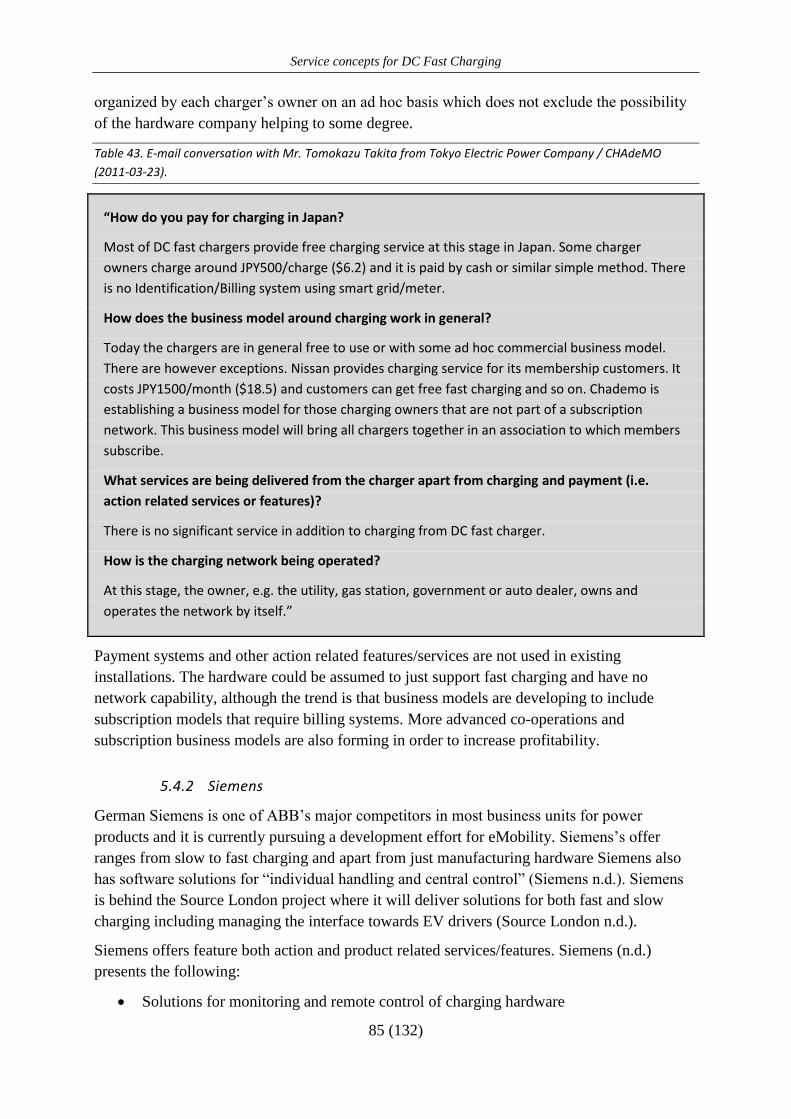
Service concepts for DC Fast Charging
85 (132)
organized by each charger’s owner on an ad hoc basis which does not exclude the possibility
of the hardware company helping to some degree.
Table 43. E-mail conversation with Mr. Tomokazu Takita from Tokyo Electric Power Company / CHAdeMO
(2011-03-23).
“How do you pay for charging in Japan?
Most of DC fast chargers provide free charging service at this stage in Japan. Some charger
owners charge around JPY500/charge ($6.2) and it is paid by cash or similar simple method. There
is no Identification/Billing system using smart grid/meter.
How does the business model around charging work in general?
Today the chargers are in general free to use or with some ad hoc commercial business model.
There are however exceptions. Nissan provides charging service for its membership customers. It
costs JPY1500/month ($18.5) and customers can get free fast charging and so on. Chademo is
establishing a business model for those charging owners that are not part of a subscription
network. This business model will bring all chargers together in an association to which members
subscribe.
What services are being delivered from the charger apart from charging and payment (i.e.
action related services or features)?
There is no significant service in addition to charging from DC fast charger.
How is the charging network being operated?
At this stage, the owner, e.g. the utility, gas station, government or auto dealer, owns and
operates the network by itself.”
Payment systems and other action related features/services are not used in existing
installations. The hardware could be assumed to just support fast charging and have no
network capability, although the trend is that business models are developing to include
subscription models that require billing systems. More advanced co-operations and
subscription business models are also forming in order to increase profitability.
5.4.2 Siemens
German Siemens is one of ABB’s major competitors in most business units for power
products and it is currently pursuing a development effort for eMobility. Siemens’s offer
ranges from slow to fast charging and apart from just manufacturing hardware Siemens also
has software solutions for “individual handling and central control” (Siemens n.d.). Siemens
is behind the Source London project where it will deliver solutions for both fast and slow
charging including managing the interface towards EV drivers (Source London n.d.).
Siemens offers feature both action and product related services/features. Siemens (n.d.)
presents the following:
Solutions for monitoring and remote control of charging hardware
Service concepts for DC Fast Charging
86 (132)
Infrastructure maintenance solutions
Energy and load management solutions (smart grid integration)
Back-office ERP, CRM, billing solutions
Portal and service desk solutions
Security, identity and access management
Battery asset management
Vehicle integration and charging interaction
Fleet management
Ecosystem and business case simulation
No information has been found on how Siemens can help with installation, upgrades or
different levels of consulting. Since Siemens is doing all these services on its normal products
range it could be assumed that it also have the capability within eMobility. This is also
reasonable to believe since it offers packages to handle a customer’s complete operations.
To date the author has no knowledge of whether Siemens takes orders or not. Siemens is still
not listed as a Chademo compliant partner although it claims to be able to deliver fast
chargers (Siemens n.d.). It is likely that a fast charger soon is presented since the company has
an agreement with London where this is included and also uses the product in marketing.
5.4.3 RWE13
RWE is the biggest utility in Germany, second biggest in the Netherlands and third biggest in
UK (2009). The company has revenues of €48b (2009), 70’000 employees and 16 million
customers. Table 44 presents RWE’s current service offer. The company states that “all of the
services are subject to standard service level agreements (SLAs), i.e. binding definitions of
the service quality” (RWE n.d. a).
As found in interviews with Amsterdam, RWE does full operation and customer management
of charging networks. The company claims that its equipment is smart grid enabled for
vehicle to grid operation and that it has a system for grid friendly load management charging
(RWE n.d. b).
RWE has today no proprietary production of DC fast chargers. The highest output supplied
from its chargers are 44 kW AC. However the company has integrated DC fast chargers from
Epyon in their systems for the city of Amsterdam.
13 Information taken from interview with RWE trade fair representative at Geneva Motor Show 2011, marketing
material from Geneva Motor show 2011 and RWE (n.d. a).
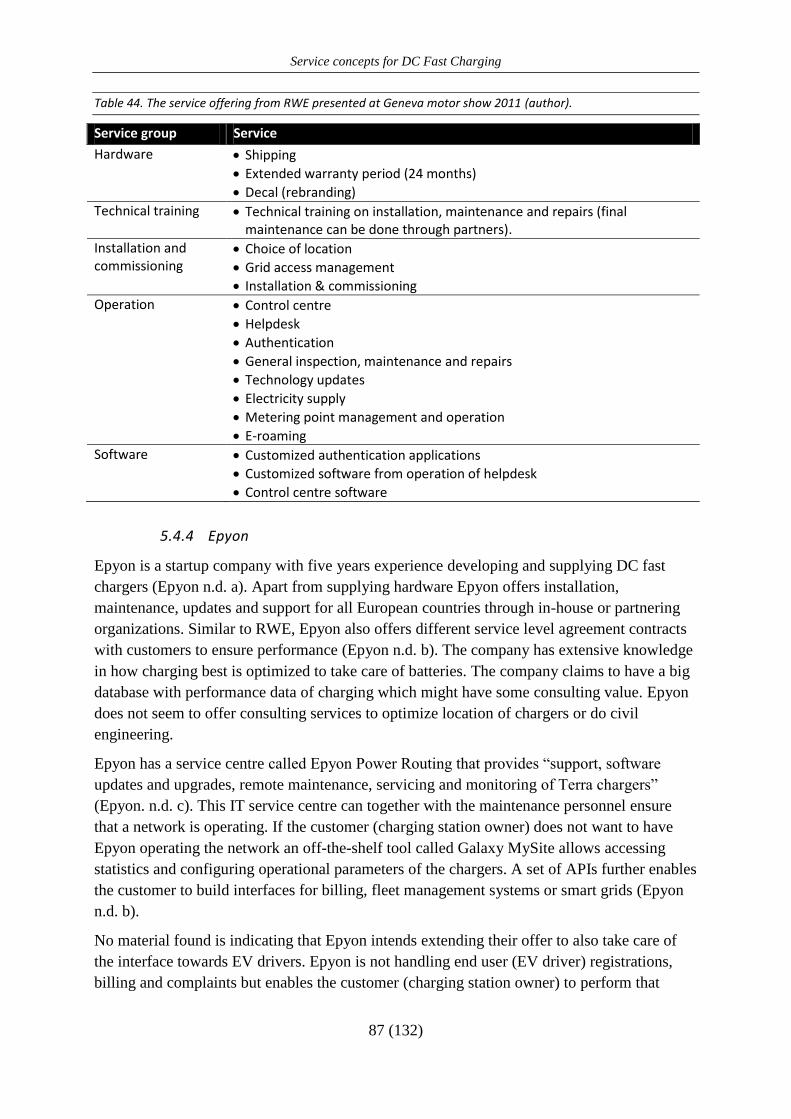
Service concepts for DC Fast Charging
87 (132)
Table 44. The service offering from RWE presented at Geneva motor show 2011 (author).
Service group Service
Hardware Shipping
Extended warranty period (24 months)
Decal (rebranding)
Technical training Technical training on installation, maintenance and repairs (final maintenance can be done through partners).
Installation and commissioning
Choice of location
Grid access management
Installation & commissioning
Operation Control centre
Helpdesk
Authentication
General inspection, maintenance and repairs
Technology updates
Electricity supply
Metering point management and operation
E-roaming
Software Customized authentication applications
Customized software from operation of helpdesk
Control centre software
5.4.4 Epyon
Epyon is a startup company with five years experience developing and supplying DC fast
chargers (Epyon n.d. a). Apart from supplying hardware Epyon offers installation,
maintenance, updates and support for all European countries through in-house or partnering
organizations. Similar to RWE, Epyon also offers different service level agreement contracts
with customers to ensure performance (Epyon n.d. b). The company has extensive knowledge
in how charging best is optimized to take care of batteries. The company claims to have a big
database with performance data of charging which might have some consulting value. Epyon
does not seem to offer consulting services to optimize location of chargers or do civil
engineering.
Epyon has a service centre called Epyon Power Routing that provides “support, software
updates and upgrades, remote maintenance, servicing and monitoring of Terra chargers”
(Epyon. n.d. c). This IT service centre can together with the maintenance personnel ensure
that a network is operating. If the customer (charging station owner) does not want to have
Epyon operating the network an off-the-shelf tool called Galaxy MySite allows accessing
statistics and configuring operational parameters of the chargers. A set of APIs further enables
the customer to build interfaces for billing, fleet management systems or smart grids (Epyon
n.d. b).
No material found is indicating that Epyon intends extending their offer to also take care of
the interface towards EV drivers. Epyon is not handling end user (EV driver) registrations,
billing and complaints but enables the customer (charging station owner) to perform that
Service concepts for DC Fast Charging
88 (132)
activity. This is different from what RWE and Siemens are offering but it is for example in
line with ABB’s strategy.
5.4.5 Coulomb Technologies, ECOtality and Better Place
Coulomb Technologies, ECOtality and Better Place are US based startup companies with
similar strategies. They all want to take a role as infrastructure operator for different investors
(typical solution providers). Without owning the infrastructure, they plan to provide systems
for handling the end user (EV driver) interface providing registration, identification and
payment models (fee based or typically subscriptions). Also part of the model is to provide
services for maintaining and operating the chargers for the owner. Revenues are shared with
the owner of the charging stations.
On a hardware level the companies are sourcing products from hardware suppliers. SGTE and
Aker Wade are supplying to Coulomb Technologies and Better Place. ABB is working
together with ECOtality and is the company’s preferred supplier of power electronics.
ECOtality however does assembly in-house.
5.4.6 SGTE14
SGTE is a French power conversion specialist (AC DC) that has supplied fast charging
since 1995. The company had a product ready for the electrical vehicle hype that took place
during the 90s. SGTE is together, with Epyon, probably Europe’s most mature supplier of fast
chargers with internal manufacturing and design. The product related service offering
includes consulting pre-studies, design, installation, commissioning and maintenance.
Products can also be rebranded.14
SGTE has supplied chargers to Nissan (during trade such as
Geneva Motor Show 2011 charging is done on SGTE fast chargers), Tepco (as only non
Japanese manufacturer), Better Place, Coulomb Technologies and Total Belgium (petrol
station).
SGTE has little information of its action related service capabilities. However its brochure
tells that remote communication management systems exist and that the chargers are pre-
equipped for payment. In an interview with Chademo15
, it was found that SGTE has supplied
chargers with RFID payment systems. SGTE also integrated a management system with the
charger for the petrol station Total Belgium. The custom developed system should comply
with the DOMS-standard for remote management of petrol station prices.
Although SGTE does not have official material about action related service packages it is
evident that they are capable of finding solutions to the customers’ requirements in this area.
In relation to Siemens and RWE, there is no indication that SGTE intends to operate the
14 SGTE Power. (n.d.). Universal DC Quick Charger for EVs. Marketing Material Supplied at Geneva Motor
Show 2011.
15 Elie Bougourd (2011-03-11) at Geneva Motor Show
Service concepts for DC Fast Charging
89 (132)
chargers for the owner. SGTE neither provides operative staff for managing end user (EV
drivers) registrations or billing.
5.4.7 Aker Wade
Aker Wade is a startup company from year 2000 with facilities in Charlottesville, USA. Aker
Wade supplies fast charging systems for electrical vehicles (Aker Wade n.d.). Initially, the
company was founded to supply chargers for the electrical car effort during the 90s. However
GM together with all other car manufacturers closed their development programs (Aker Wade
2009). In year 2009, Aker Wade had more than 8000 installations of DC fast chargers over
the world (Aker Wade 2009). These chargers are mainly industrial installations for trucks and
trolleys in distribution centers and manufacturing facilities.
It is uncertain what Aker Wade is offering in the product related service area. Probably
similar service can be provided as for the industrial chargers but what this service offer is has
not been found. Action related services and features include networking capability and a
software to monitor and manage power levels and see statistics.
It is clear that Aker Wade does not want to operate the end customer (EV driver) interface or
the network of chargers towards the owner. However, from the vision within fast charging
and supply agreement to Better Place, it is evident that the charging equipment is capable of
these services on either a hardware or full solution level.
5.4.8 Conclusion of competitive benchmarks
There are few companies which manufacturer DC fast chargers and supply the entire span of
action and product related services. Siemens seems to be taking the most complete role in the
value chain with in house production, product related services, EV driver interfaces
(operation) and management solutions towards the hardware owners and utilities. However,
today Siemens is still not Chademo members so it is hard to assess if the company can deliver
and how much of the offer that is just strategies on paper.
Apart from Siemens, there are two typical competitors. The category is hardware suppliers
that are moving toward becoming solution providers. SGTE, Epyon and Aker Wade are three
good examples of companies where Epyon might have come furthest since it offers services
for operation. Yet, none of these companies have taken the step to interface directly with the
end infrastructure user, the EV driver. It might be likely that these competitors also chose to
not move into this domain. The second category is companies such as RWE, ECOtality,
Better Place and Coulomb Technologies. These actors do not, with some exceptions, produce
their own fast chargers but have chosen to compete by managing the end EV driver interface
for charging owners. Due to this, these actors could potentially be customers of ABB
hardware.

Service concepts for DC Fast Charging
90 (132)

Service concepts for DC Fast Charging
91 (132)
6 CONCEPT DEVELOPMENT AND EVALUATION
Based on the above evaluation of different service ideas this section presents six service
concepts. The six concepts follow from clustering the service ideas with a common
denominator together. For each concept; what, how and a business case is presented under
separated topics. This answers the research questions (3.1-3) for concept development and
evaluation.
6.1 DEFINING THE SERVICE CONCEPTS
The service ideas have been evaluated based on customer preferences, internal fit and
competitive benchmarks. Doing this, the ideas have been independently assessed. However
when the ideas were generated they got structured according to a framework that was
presented in Table 10 (reproduced below). Ideas were sorted in a category during the life
cycle (product related ideas) or related to what the customer can do around the product (action
related ideas). The same structure of ideas is still valid when moving on to defining mutually
exclusive concepts.
Reproduced Table 10. Framework used to structure service ideas (author based on theoretical classifications).
Pro
du
ct
rela
ted
se
rvic
es Life cycle – When does the service occur?
Sales and pre Project management Operation End of life
Idea...
…
Idea...
…
Idea...
…
Idea...
…
Act
ion
rela
ted
se
rvic
es Customer – towards who is the service?
Utility Owner or operator EV driver
Idea...
…
Idea...
…
Idea...
…
These concepts have been created using theory of categorizing services, the framework in
Table 10 and the author’s judgment. What is important is that all concepts are mutually
exclusive. The service concepts differ among each other since they are executed during
different points in time. They also use different operational procedures. The service concepts
are:
Action related services – All service ideas related to what the EV driver, charging
station owner or utility can do with the product.
Sales service – Selling and promoting the product.
Consulting services – These services are outside the framework in Table 10 but still
mutually exclusive from the other concepts. It therefore makes sense to address them
individually.
Project management services – Services related to preparing the location and
installing the product.
Services during the product’s operational life – Different maintenance alternatives.
End of life services – Services related to refurbishing or taking care of a worn fast
charger.

Service concepts for DC Fast Charging
92 (132)
6.2 ACTION RELATED SERVICES
6.2.1 What
The action related service ideas are summarized in Table 45. The importance-performance
classification varies a lot between the ideas. In general, the wild or costly ideas have been less
prioritized by customers or internal ABB. For example, it is not important to be able to
advertise via a screen on the charger or control the display content remotely. Focus should be
on ideas tied to core features and services of the product.
Table 45. Summary of evaluation measures for service ideas within action related services (author).
Service idea Uti
lity
Oth
ers
Tota
l
Cu
sto
me
r ra
nki
ng
Pri
ou
tilit
y -
Pri
oo
the
rs
Inte
rnal
ran
kin
g
Importance -
performance Co
mp
eti
tio
n
Stra
tegi
c in
ten
t
Open payment standard M M M 8 0.4 32 Concentrate here High 60%
Operational statistics raw data owner M O M 11 0.4 28 Concentrate here Mod 50%
Operational statistics utilities A O O 13 -0.1 23 Concentrate here Mod 70%
Processed statistics owner O O O 16 0.3 31 Concentrate here Mod 60%
User remote charging control A A A 15 -0.8 34 Concentrate here Mod 60%
Smart payment service O M O 21 -0.5 33 Concentrate here High 50%
Unit availability for EV driver O A A 14 0.3 35 Concentrate here High 60%
Openly accessible stats API for
developers O A O 32 1.7 39
Concentrate here / not
important Mod 20%
Remote control of display content
(owner) I I I 27 -0.7 43 Not important Mod 10%
Remote system for advertising I I I 28 -0.3 40 Not important Mod 30%
Wi-Fi service from charger (EV driver) A I I 33 0.3 27 Not important High 20%
Media distribution/App-store in
charger (EV driver) I A I 34 -0.3 37 Not important High 30%
Smart grid service storing power A I I 36 0.6 26 Not important Low 60%
Reward system for charging I I I 41 0.4 41 Not important Low 10%
Statistics for EV driver (display in on
charger) A A A 37 -0.5 36 Not important High 40%
Car maintenance (software update to
cars) I A I 42 -0.7 42 Not important Low 10%
Average (majority rule for
classification) A A I 26 0.03 34
Concentrate here/not
important Mod 40%
Interesting to note is that there is no service which is in-line between customers and internal
ABB. Either ABB internally has too little focus on a service idea (classified “concentrate
here”) or ABB and customers share the evaluation that the service is unimportant (classified
“not important”).
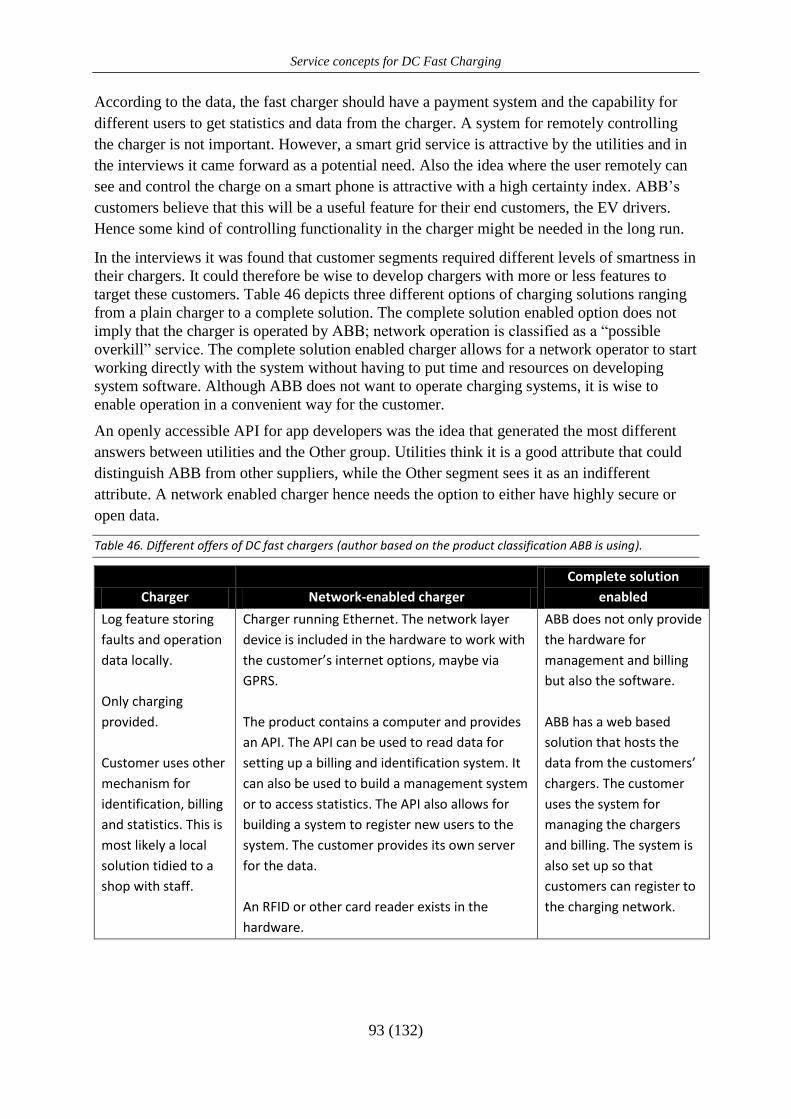
Service concepts for DC Fast Charging
93 (132)
According to the data, the fast charger should have a payment system and the capability for
different users to get statistics and data from the charger. A system for remotely controlling
the charger is not important. However, a smart grid service is attractive by the utilities and in
the interviews it came forward as a potential need. Also the idea where the user remotely can
see and control the charge on a smart phone is attractive with a high certainty index. ABB’s
customers believe that this will be a useful feature for their end customers, the EV drivers.
Hence some kind of controlling functionality in the charger might be needed in the long run.
In the interviews it was found that customer segments required different levels of smartness in
their chargers. It could therefore be wise to develop chargers with more or less features to
target these customers. Table 46 depicts three different options of charging solutions ranging
from a plain charger to a complete solution. The complete solution enabled option does not
imply that the charger is operated by ABB; network operation is classified as a “possible
overkill” service. The complete solution enabled charger allows for a network operator to start
working directly with the system without having to put time and resources on developing
system software. Although ABB does not want to operate charging systems, it is wise to
enable operation in a convenient way for the customer.
An openly accessible API for app developers was the idea that generated the most different
answers between utilities and the Other group. Utilities think it is a good attribute that could
distinguish ABB from other suppliers, while the Other segment sees it as an indifferent
attribute. A network enabled charger hence needs the option to either have highly secure or
open data.
Table 46. Different offers of DC fast chargers (author based on the product classification ABB is using).
Charger Network-enabled charger
Complete solution
enabled
Log feature storing
faults and operation
data locally.
Only charging
provided.
Customer uses other
mechanism for
identification, billing
and statistics. This is
most likely a local
solution tidied to a
shop with staff.
Charger running Ethernet. The network layer
device is included in the hardware to work with
the customer’s internet options, maybe via
GPRS.
The product contains a computer and provides
an API. The API can be used to read data for
setting up a billing and identification system. It
can also be used to build a management system
or to access statistics. The API also allows for
building a system to register new users to the
system. The customer provides its own server
for the data.
An RFID or other card reader exists in the
hardware.
ABB does not only provide
the hardware for
management and billing
but also the software.
ABB has a web based
solution that hosts the
data from the customers’
chargers. The customer
uses the system for
managing the chargers
and billing. The system is
also set up so that
customers can register to
the charging network.
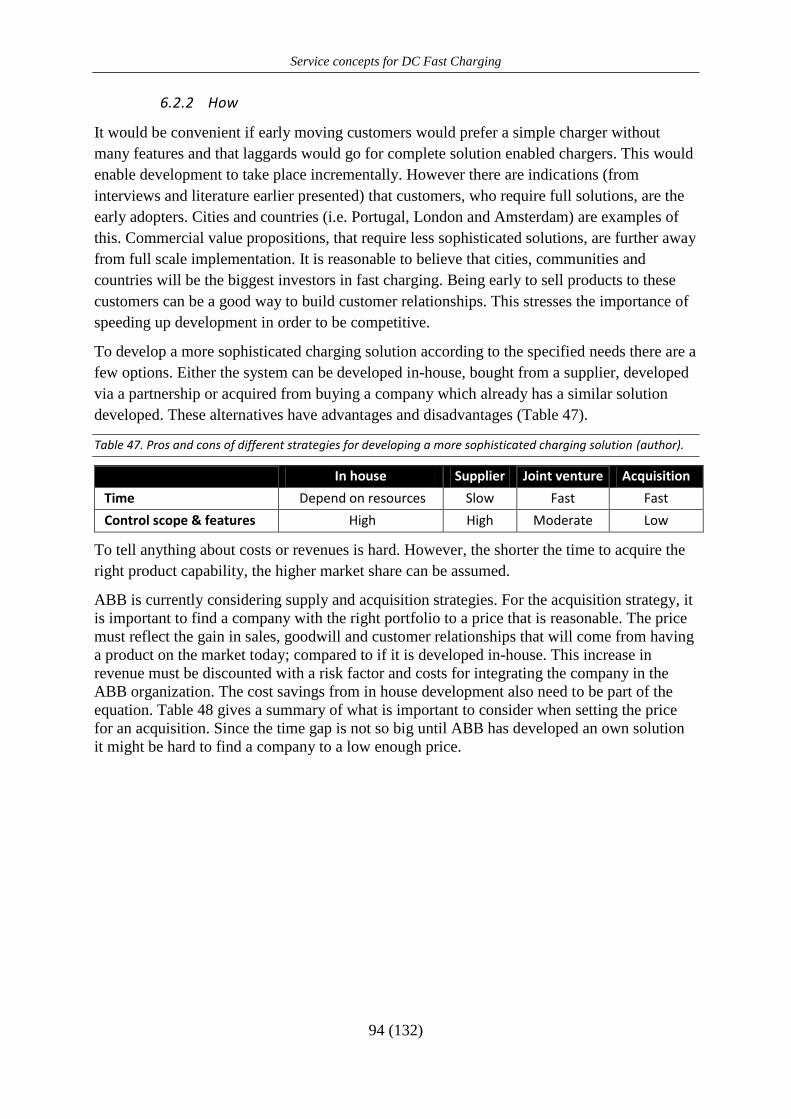
Service concepts for DC Fast Charging
94 (132)
6.2.2 How
It would be convenient if early moving customers would prefer a simple charger without
many features and that laggards would go for complete solution enabled chargers. This would
enable development to take place incrementally. However there are indications (from
interviews and literature earlier presented) that customers, who require full solutions, are the
early adopters. Cities and countries (i.e. Portugal, London and Amsterdam) are examples of
this. Commercial value propositions, that require less sophisticated solutions, are further away
from full scale implementation. It is reasonable to believe that cities, communities and
countries will be the biggest investors in fast charging. Being early to sell products to these
customers can be a good way to build customer relationships. This stresses the importance of
speeding up development in order to be competitive.
To develop a more sophisticated charging solution according to the specified needs there are a
few options. Either the system can be developed in-house, bought from a supplier, developed
via a partnership or acquired from buying a company which already has a similar solution
developed. These alternatives have advantages and disadvantages (Table 47).
Table 47. Pros and cons of different strategies for developing a more sophisticated charging solution (author).
In house Supplier Joint venture Acquisition
Time Depend on resources Slow Fast Fast
Control scope & features High High Moderate Low
To tell anything about costs or revenues is hard. However, the shorter the time to acquire the
right product capability, the higher market share can be assumed.
ABB is currently considering supply and acquisition strategies. For the acquisition strategy, it
is important to find a company with the right portfolio to a price that is reasonable. The price
must reflect the gain in sales, goodwill and customer relationships that will come from having
a product on the market today; compared to if it is developed in-house. This increase in
revenue must be discounted with a risk factor and costs for integrating the company in the
ABB organization. The cost savings from in house development also need to be part of the
equation. Table 48 gives a summary of what is important to consider when setting the price
for an acquisition. Since the time gap is not so big until ABB has developed an own solution
it might be hard to find a company to a low enough price.
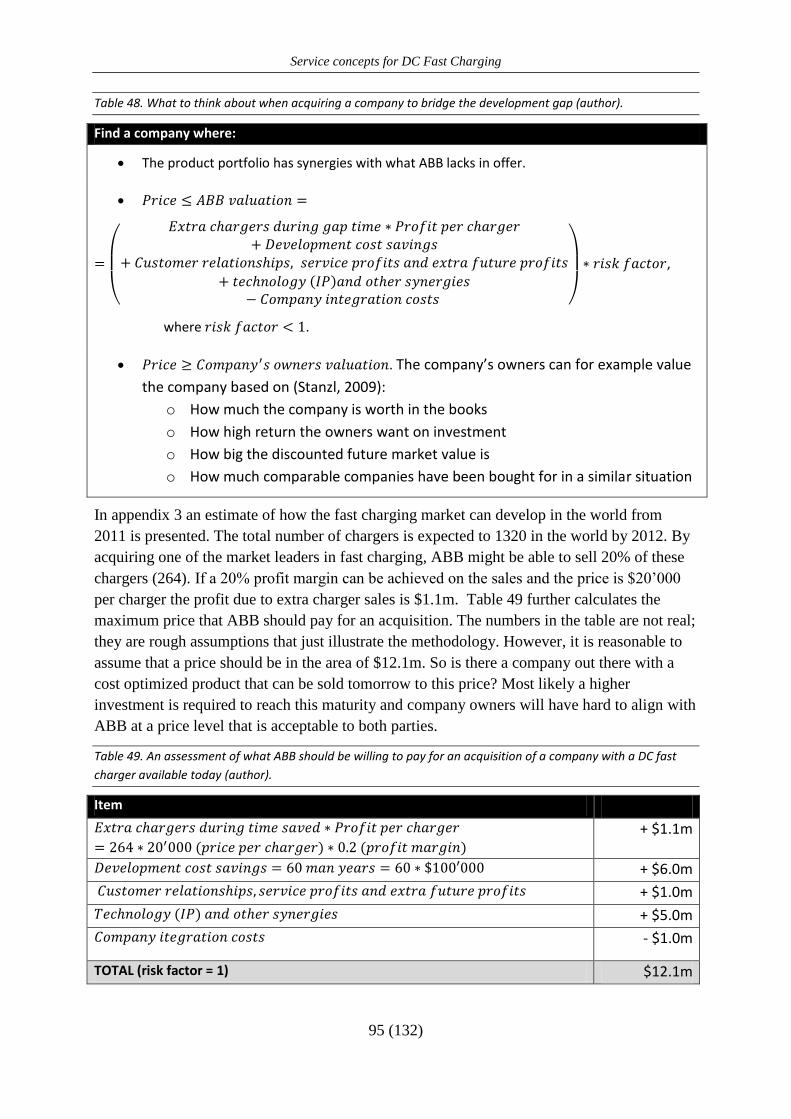
Service concepts for DC Fast Charging
95 (132)
Table 48. What to think about when acquiring a company to bridge the development gap (author).
Find a company where:
The product portfolio has synergies with what ABB lacks in offer.
,
where .
. The company’s owners can for example value
the company based on (Stanzl, 2009):
o How much the company is worth in the books
o How high return the owners want on investment
o How big the discounted future market value is
o How much comparable companies have been bought for in a similar situation
In appendix 3 an estimate of how the fast charging market can develop in the world from
2011 is presented. The total number of chargers is expected to 1320 in the world by 2012. By
acquiring one of the market leaders in fast charging, ABB might be able to sell 20% of these
chargers (264). If a 20% profit margin can be achieved on the sales and the price is $20’000
per charger the profit due to extra charger sales is $1.1m. Table 49 further calculates the
maximum price that ABB should pay for an acquisition. The numbers in the table are not real;
they are rough assumptions that just illustrate the methodology. However, it is reasonable to
assume that a price should be in the area of $12.1m. So is there a company out there with a
cost optimized product that can be sold tomorrow to this price? Most likely a higher
investment is required to reach this maturity and company owners will have hard to align with
ABB at a price level that is acceptable to both parties.
Table 49. An assessment of what ABB should be willing to pay for an acquisition of a company with a DC fast
charger available today (author).
Item
+ $1.1m
+ $6.0m
+ $1.0m
+ $5.0m
- $1.0m
TOTAL (risk factor = 1) $12.1m
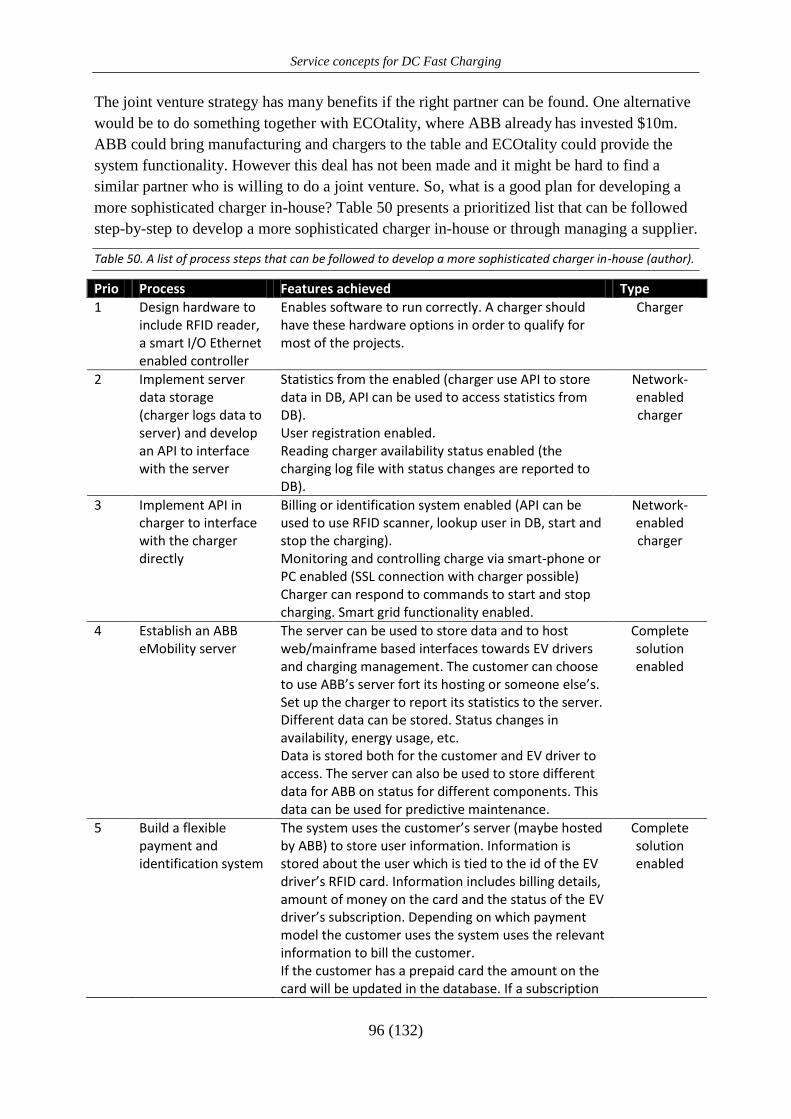
Service concepts for DC Fast Charging
96 (132)
The joint venture strategy has many benefits if the right partner can be found. One alternative
would be to do something together with ECOtality, where ABB already has invested $10m.
ABB could bring manufacturing and chargers to the table and ECOtality could provide the
system functionality. However this deal has not been made and it might be hard to find a
similar partner who is willing to do a joint venture. So, what is a good plan for developing a
more sophisticated charger in-house? Table 50 presents a prioritized list that can be followed
step-by-step to develop a more sophisticated charger in-house or through managing a supplier.
Table 50. A list of process steps that can be followed to develop a more sophisticated charger in-house (author).
Prio Process Features achieved Type
1 Design hardware to include RFID reader, a smart I/O Ethernet enabled controller
Enables software to run correctly. A charger should have these hardware options in order to qualify for most of the projects.
Charger
2 Implement server data storage (charger logs data to server) and develop an API to interface with the server
Statistics from the enabled (charger use API to store data in DB, API can be used to access statistics from DB). User registration enabled. Reading charger availability status enabled (the charging log file with status changes are reported to DB).
Network-enabled charger
3 Implement API in charger to interface with the charger directly
Billing or identification system enabled (API can be used to use RFID scanner, lookup user in DB, start and stop the charging). Monitoring and controlling charge via smart-phone or PC enabled (SSL connection with charger possible) Charger can respond to commands to start and stop charging. Smart grid functionality enabled.
Network-enabled charger
4 Establish an ABB eMobility server
The server can be used to store data and to host web/mainframe based interfaces towards EV drivers and charging management. The customer can choose to use ABB’s server fort its hosting or someone else’s. Set up the charger to report its statistics to the server. Different data can be stored. Status changes in availability, energy usage, etc. Data is stored both for the customer and EV driver to access. The server can also be used to store different data for ABB on status for different components. This data can be used for predictive maintenance.
Complete solution enabled
5 Build a flexible payment and identification system
The system uses the customer’s server (maybe hosted by ABB) to store user information. Information is stored about the user which is tied to the id of the EV driver’s RFID card. Information includes billing details, amount of money on the card and the status of the EV driver’s subscription. Depending on which payment model the customer uses the system uses the relevant information to bill the customer. If the customer has a prepaid card the amount on the card will be updated in the database. If a subscription
Complete solution enabled
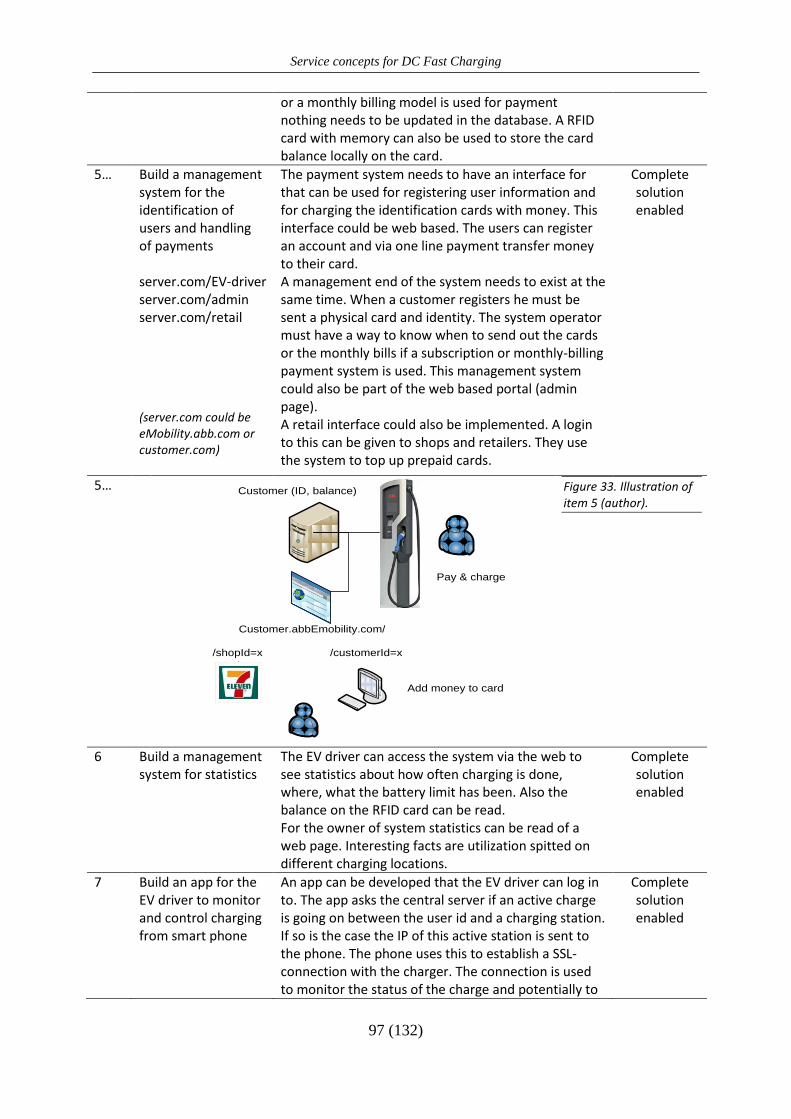
Service concepts for DC Fast Charging
97 (132)
or a monthly billing model is used for payment nothing needs to be updated in the database. A RFID card with memory can also be used to store the card balance locally on the card.
5… Build a management system for the identification of users and handling of payments server.com/EV-driver server.com/admin server.com/retail (server.com could be eMobility.abb.com or customer.com)
The payment system needs to have an interface for that can be used for registering user information and for charging the identification cards with money. This interface could be web based. The users can register an account and via one line payment transfer money to their card. A management end of the system needs to exist at the same time. When a customer registers he must be sent a physical card and identity. The system operator must have a way to know when to send out the cards or the monthly bills if a subscription or monthly-billing payment system is used. This management system could also be part of the web based portal (admin page). A retail interface could also be implemented. A login to this can be given to shops and retailers. They use the system to top up prepaid cards.
Complete solution enabled
5… Customer (ID, balance)
Customer.abbEmobility.com/
/shopId=x /customerId=x
Add money to card
Pay & charge
Figure 33. Illustration of item 5 (author).
6 Build a management system for statistics
The EV driver can access the system via the web to see statistics about how often charging is done, where, what the battery limit has been. Also the balance on the RFID card can be read. For the owner of system statistics can be read of a web page. Interesting facts are utilization spitted on different charging locations.
Complete solution enabled
7 Build an app for the EV driver to monitor and control charging from smart phone
An app can be developed that the EV driver can log in to. The app asks the central server if an active charge is going on between the user id and a charging station. If so is the case the IP of this active station is sent to the phone. The phone uses this to establish a SSL-connection with the charger. The connection is used to monitor the status of the charge and potentially to
Complete solution enabled
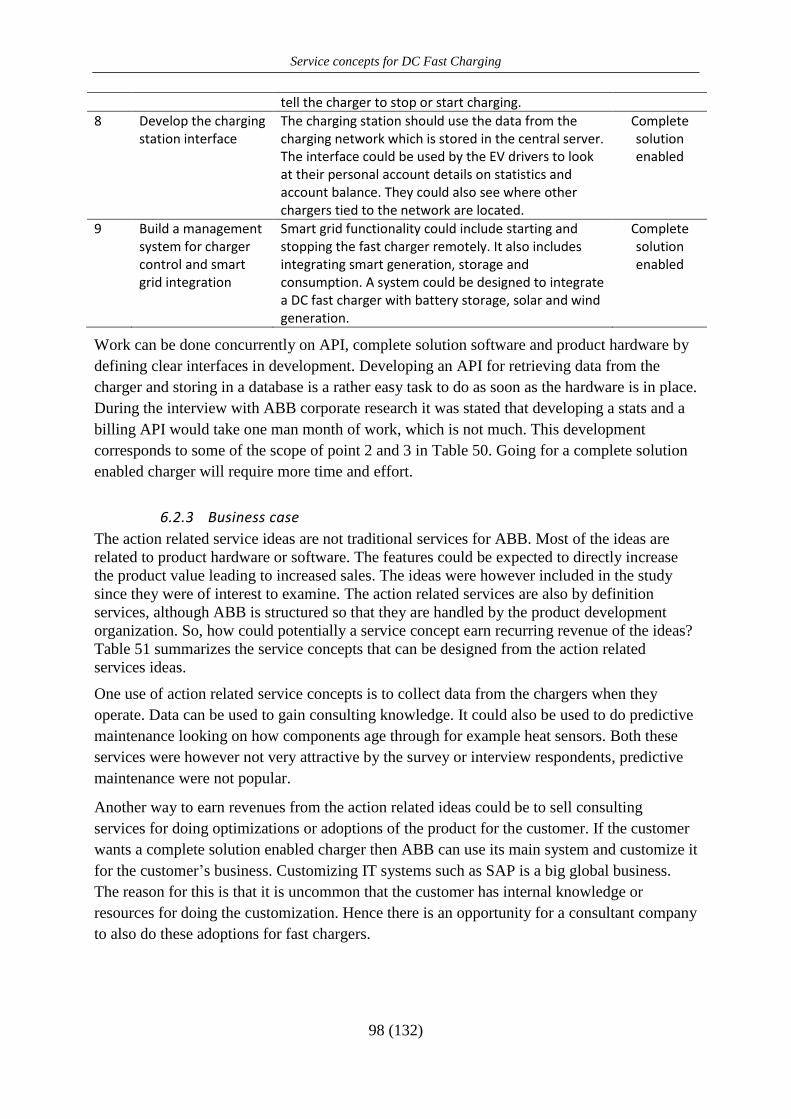
Service concepts for DC Fast Charging
98 (132)
tell the charger to stop or start charging.
8 Develop the charging station interface
The charging station should use the data from the charging network which is stored in the central server. The interface could be used by the EV drivers to look at their personal account details on statistics and account balance. They could also see where other chargers tied to the network are located.
Complete solution enabled
9 Build a management system for charger control and smart grid integration
Smart grid functionality could include starting and stopping the fast charger remotely. It also includes integrating smart generation, storage and consumption. A system could be designed to integrate a DC fast charger with battery storage, solar and wind generation.
Complete solution enabled
Work can be done concurrently on API, complete solution software and product hardware by
defining clear interfaces in development. Developing an API for retrieving data from the
charger and storing in a database is a rather easy task to do as soon as the hardware is in place.
During the interview with ABB corporate research it was stated that developing a stats and a
billing API would take one man month of work, which is not much. This development
corresponds to some of the scope of point 2 and 3 in Table 50. Going for a complete solution
enabled charger will require more time and effort.
6.2.3 Business case
The action related service ideas are not traditional services for ABB. Most of the ideas are
related to product hardware or software. The features could be expected to directly increase
the product value leading to increased sales. The ideas were however included in the study
since they were of interest to examine. The action related services are also by definition
services, although ABB is structured so that they are handled by the product development
organization. So, how could potentially a service concept earn recurring revenue of the ideas?
Table 51 summarizes the service concepts that can be designed from the action related
services ideas.
One use of action related service concepts is to collect data from the chargers when they
operate. Data can be used to gain consulting knowledge. It could also be used to do predictive
maintenance looking on how components age through for example heat sensors. Both these
services were however not very attractive by the survey or interview respondents, predictive
maintenance were not popular.
Another way to earn revenues from the action related ideas could be to sell consulting
services for doing optimizations or adoptions of the product for the customer. If the customer
wants a complete solution enabled charger then ABB can use its main system and customize it
for the customer’s business. Customizing IT systems such as SAP is a big global business.
The reason for this is that it is uncommon that the customer has internal knowledge or
resources for doing the customization. Hence there is an opportunity for a consultant company
to also do these adoptions for fast chargers.
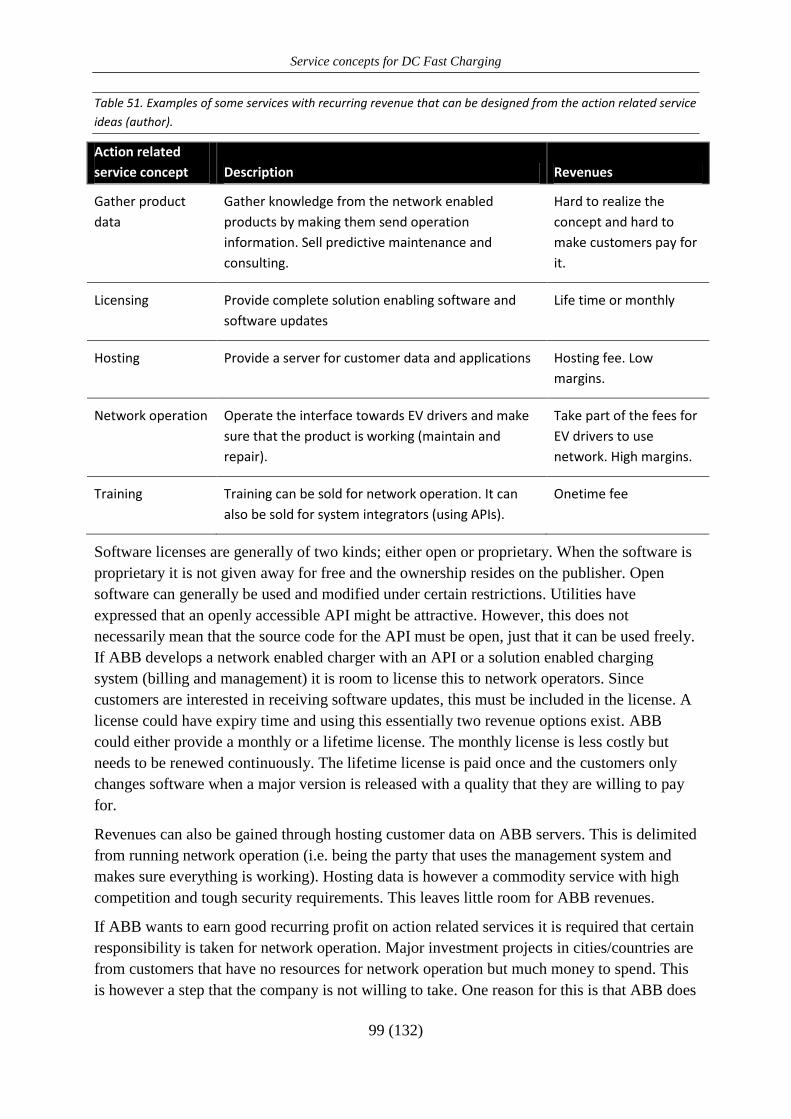
Service concepts for DC Fast Charging
99 (132)
Table 51. Examples of some services with recurring revenue that can be designed from the action related service
ideas (author).
Action related
service concept Description Revenues
Gather product
data
Gather knowledge from the network enabled
products by making them send operation
information. Sell predictive maintenance and
consulting.
Hard to realize the
concept and hard to
make customers pay for
it.
Licensing Provide complete solution enabling software and
software updates
Life time or monthly
Hosting Provide a server for customer data and applications Hosting fee. Low
margins.
Network operation Operate the interface towards EV drivers and make
sure that the product is working (maintain and
repair).
Take part of the fees for
EV drivers to use
network. High margins.
Training Training can be sold for network operation. It can
also be sold for system integrators (using APIs).
Onetime fee
Software licenses are generally of two kinds; either open or proprietary. When the software is
proprietary it is not given away for free and the ownership resides on the publisher. Open
software can generally be used and modified under certain restrictions. Utilities have
expressed that an openly accessible API might be attractive. However, this does not
necessarily mean that the source code for the API must be open, just that it can be used freely.
If ABB develops a network enabled charger with an API or a solution enabled charging
system (billing and management) it is room to license this to network operators. Since
customers are interested in receiving software updates, this must be included in the license. A
license could have expiry time and using this essentially two revenue options exist. ABB
could either provide a monthly or a lifetime license. The monthly license is less costly but
needs to be renewed continuously. The lifetime license is paid once and the customers only
changes software when a major version is released with a quality that they are willing to pay
for.
Revenues can also be gained through hosting customer data on ABB servers. This is delimited
from running network operation (i.e. being the party that uses the management system and
makes sure everything is working). Hosting data is however a commodity service with high
competition and tough security requirements. This leaves little room for ABB revenues.
If ABB wants to earn good recurring profit on action related services it is required that certain
responsibility is taken for network operation. Major investment projects in cities/countries are
from customers that have no resources for network operation but much money to spend. This
is however a step that the company is not willing to take. One reason for this is that ABB does

Service concepts for DC Fast Charging
100 (132)
not want to deal with B2C activity. Taking the role as network operator does however not
necessarily imply much extra work than maintenance and field service which ABB wants to
do. Much of the activities are easy to outsource to suppliers once the complete solution
enabled software has been developed. Table 52 depicts the main actions that need to be taken
to develop a network operation service. An internal team is required to manage the project
towards the customer and this team can also be used to manage the EV driver interaction by
setting up partnerships or outsourcing agreements. Finding win-win solutions with partners
should not be hard for the activities below; giving the partner part of the revenues for each
sale/transaction is one option that is used for public transport systems.
Table 52. Action related activities needed to do network operation for a customer (city, community or country).
The product related activities to maintain and field service the products are not included since ABB already aim
to be doing them. The table illustrates that it is not much extra effort required to set up a complete operation
once software is in place to run the operation (author).
Activity Action
EV driver registration Use web based software and partner with Seven Eleven or/and other local
shops. Set up a system where local shops can sell RFID cards. A third party
logistics centre can handle sending RFID cards to customers who register
online.
EV driver help desk Outsource call center to for example India.
EV driver retention and
marketing
Partner with the customer that the system is operated for.
Adding money to the
RFID card
Use a web based management software or partners (shops).
Manage system
towards owner
The internal ABB project management team can monitor statistics from
the system and provide reports from this to the owner. Just like Ericsson
Managed Services recommendations can be given for upgrades in the
network based on operational data (utilization in certain busy areas etc).
To do network operation is can be profitable since it adds much value to the customer. In
Amsterdam, for example, a model has been set up where the solution provider RWE has sold
chargers to the city and operates these on behalf of the city. All revenues from the chargers go
to RWE to cover the operation. Amsterdam city benefits from having a company which takes
cares of transitioning to a cleaner city. The only investment made is in the charging
infrastructure which is put in place for the sake of the public. RWE, on the other hand, covers
the cost for their chargers and has a good chance to earn high service margins on the network
operation.
6.3 SALES SERVICE
6.3.1 What
Some customers find it hard to understand what a fast charger can do, why the ABB charger
is the best or how a good business can be built around a fast charger. The sales service has
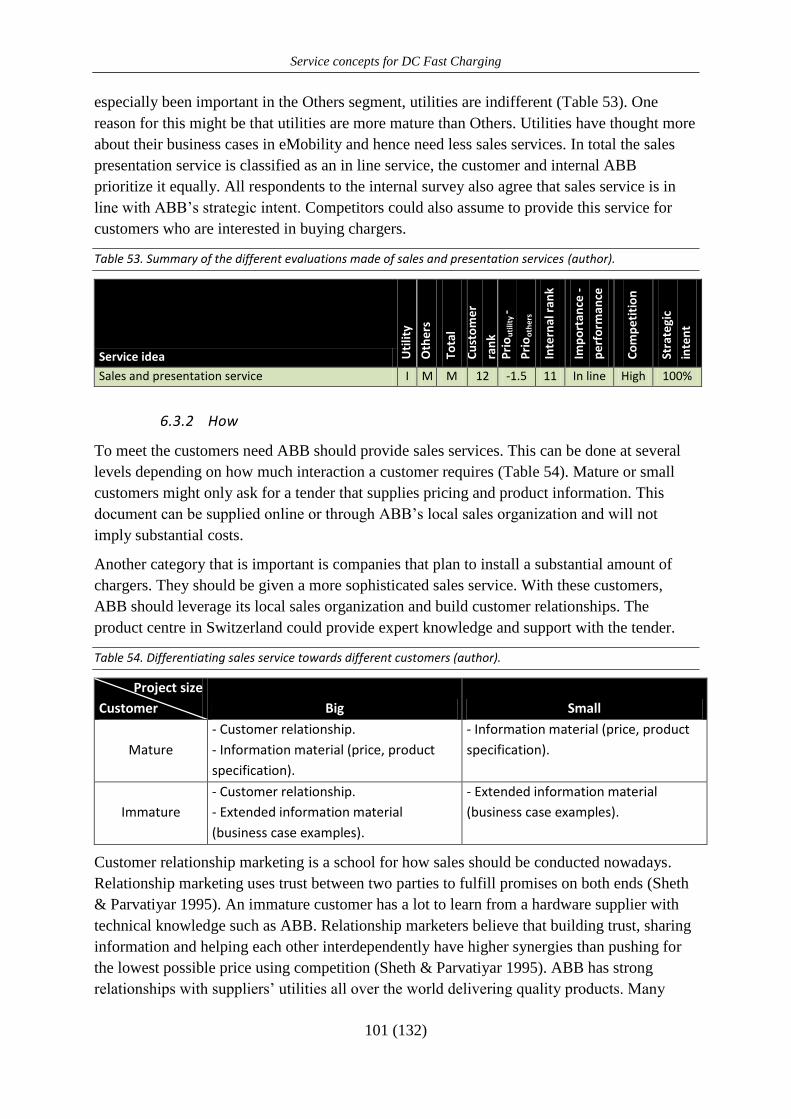
Service concepts for DC Fast Charging
101 (132)
especially been important in the Others segment, utilities are indifferent (Table 53). One
reason for this might be that utilities are more mature than Others. Utilities have thought more
about their business cases in eMobility and hence need less sales services. In total the sales
presentation service is classified as an in line service, the customer and internal ABB
prioritize it equally. All respondents to the internal survey also agree that sales service is in
line with ABB’s strategic intent. Competitors could also assume to provide this service for
customers who are interested in buying chargers.
Table 53. Summary of the different evaluations made of sales and presentation services (author).
Service idea Uti
lity
Oth
ers
Tota
l
Cu
sto
me
r
ran
k P
rio
uti
lity
-
Pri
oo
the
rs
Inte
rnal
ran
k
Imp
ort
ance
-
pe
rfo
rman
ce
Co
mp
eti
tio
n
Stra
tegi
c
inte
nt
Sales and presentation service I M M 12 -1.5 11 In line High 100%
6.3.2 How
To meet the customers need ABB should provide sales services. This can be done at several
levels depending on how much interaction a customer requires (Table 54). Mature or small
customers might only ask for a tender that supplies pricing and product information. This
document can be supplied online or through ABB’s local sales organization and will not
imply substantial costs.
Another category that is important is companies that plan to install a substantial amount of
chargers. They should be given a more sophisticated sales service. With these customers,
ABB should leverage its local sales organization and build customer relationships. The
product centre in Switzerland could provide expert knowledge and support with the tender.
Table 54. Differentiating sales service towards different customers (author).
Project size
Customer Big Small
Mature
- Customer relationship.
- Information material (price, product
specification).
- Information material (price, product
specification).
Immature
- Customer relationship.
- Extended information material
(business case examples).
- Extended information material
(business case examples).
Customer relationship marketing is a school for how sales should be conducted nowadays.
Relationship marketing uses trust between two parties to fulfill promises on both ends (Sheth
& Parvatiyar 1995). An immature customer has a lot to learn from a hardware supplier with
technical knowledge such as ABB. Relationship marketers believe that building trust, sharing
information and helping each other interdependently have higher synergies than pushing for
the lowest possible price using competition (Sheth & Parvatiyar 1995). ABB has strong
relationships with suppliers’ utilities all over the world delivering quality products. Many

Service concepts for DC Fast Charging
102 (132)
interviewees put forward ABB to be a well known brand and reliable supplier. The trust from
these relationships can be utilized for eMobility since customers know that ABB will deliver
good products. Emphasizing size and reliability is a key advantage for ABB.
6.3.3 Business case
The business case of sales service activities is good. Table 55 depicts an assessment of the
two how parts of the service concept; customer relationships and information material. Both
these services are something that customers in most markets expect to get for free. It is up to
the suppliers to provide sales information if they wish to sell products. Sales services however
impacts revenues indirect. Without a sales service the customers will buy from someone else
or not at all.
Table 55. Profit evaluation for sales and presentation services (author).
Costs Revenues
Service concept Fixed Variable Direct Indirect
Customer relationships No Yes No, free Yes
Information material (online or printed) Yes No No, free Yes
The cost of providing sales services depends on the extent of the offer. Creating sales material
is a fixed cost which can range from a few dollars per leaflet to a complete marketing kit
prepared by a professional design firm. Competitors such as RWE are spending substantial
amounts on television advertisements in Germany. However most competitors have a simple
leaflet and are present at trade fairs. This is also in line with what ABB is doing at the
moment, which might be an appropriate level for marketing.
When it comes to building customer relationships this cost is more variable. It is about
dedicating sales people to interact and be available for the customers. This part of the sales
service offer is a major ABB strength towards most competitors. ABB is present in 90
countries all over the world and have a very good capability to meet the vast majority of
customers. A challenge is however to assist the local sales organization towards the
customers. To do this an internal information package should be developed that can be
supplied to internal ABB offices.
6.4 CONSULTING SERVICES
6.4.1 What
Consulting services are useful when the customer has less knowledge than ABB and where
ABB’s knowledge can help the customer to create value. During the brainstorming activity
six different consulting service ideas were generated which have been evaluated (Table 56).
These ideas were mainly based on what could be done with ABB’s competence around the
fast charger.

Service concepts for DC Fast Charging
103 (132)
The evaluation showed that customers found unit sizing confusing; the certainty is low and
answers are spreading. This is indeed true, how can you sell a consultant service for sizing a
unit that does only have one size today (according to the 50kW DC Chademo standard)? This
service was directed towards customers ABB intend to sell charging assemblies to. This
segment has not answered the survey. It could however be assumed that a consulting service
in this area would be needed if the product range widens in the future. This service could
however be hard to charge the customer for; it must be seen as something that is included with
a sales service.
Table 56. Summary of the different evaluations made of consulting services (author).
* Balance of plant is put together with commissioning in the project management service concept.
** System optimization consulting during operation is recommended as something that could be sold
together with a service contract to the customer during the products operational lifetime (including for
example cleaning and updating software).
Service idea Uti
lity
Oth
ers
Tota
l
Cu
sto
me
r ra
nk
Pri
ou
tilit
y -
Pri
oo
the
rs
Inte
rnal
ran
k
Imp
ort
ance
-
pe
rfo
rman
ce
Co
mp
eti
tio
n
Stra
tegi
c in
ten
t
Consulting unit sizing A I I 23 0.7 14 Possible overkill High 100%
Consulting network design A O I 25 -1.0 19 Possible overkill / in
line Low 90%
Consulting cost of connection
minimization O A A 26 -1.6 6 In line High 80%
Consulting location analysis I A I 35 -1.1 9 Possible overkill Low 90%
Balance of plant* A A A 17 0.1 13 In line Low 70%
System optimization consulting
during operation** A O A 19 -0.5 25 Concentrate here Low 40%
Pre and post grid analysis A I I 31 1.1 21 Possible overkill / not
important Low 70%
Average (majority rule for
classification) A O O 25 -0.33 15 Possible overkill Low 77%
Location analysis is a consulting service that has been classified as a “possible overkill”, since
it is indifferent to both customer categories. The internal ranking of the service is however
high. At the moment ABB is working on projects to build a program for optimizing locations
of chargers for electrical buses. There are logical reasons for location analysis to be
indifferent to the surveyed customers. The utilities most likely want to decide the location
themselves. They have the most information about the grid and are likely to want to put
chargers where the grid can cope best. The segment of Others only has certain locations
where their stores, parking lots or petrol stations are. With respect to this it is not much for a
consultant to analyze. One customer segment that is likely to be very attracted by a location
optimization service is cities or communities. They have access to all locations and are likely
to be willing to get the best balance for all interests (convenience for EV drivers and for the
grid owner). Cities such as Amsterdam could benefit from an independent study of good
Service concepts for DC Fast Charging
104 (132)
charging locations. In the interview with Amsterdam the location was brought up as an
important issue for the fast charging project. The solution that was being implemented was to
build fast chargers along the cities ring road. This might be a good approach when it comes to
availability, convenience and grid coverage but having an independent actor look at the
problem does seem better than an ad-hoc solution.
The network design consulting service idea is related to the location analysis but the scope is
broader. It can also include deciding where AC charge points should be installed, how many
to cover a certain availability, what extra grid-components are required to support the
charging networks etc. If ABB should take a role of consulting on charging locations it might
as well be better to include a wider network study which is attractive for more customers and
can be assumed to be easier to charge for.
The cost of connection minimization service is less attractive for utilities than in the Others
segment. Actually this service idea has the largest difference in customer priority index
between the segments (-1.6). Utilities know where their network is weak and where it is
easiest to connect chargers without buying other grid equipment while the Others segment
needs help. Although this is a segment that ABB thinks the strategic fit is high (rank 6
internally), it is probably more likely that this service is supplied from a utility. Today you
can actually already get information from utilities about costs to connect equipment with
certain power levels in certain areas.16
The balance of plant and system optimization during operation is actually very similar
concepts. Balance of plant is another word for tweaking settings before a product is taken into
operation while system optimization during operation concerns the same thing but after the
product is taken into operation. These services are both something that customers require and
that ABB should do. Customers want their equipment to run as efficiently as possible and
look as good as possible. This consultation service is however closely related to
commissioning, maintenance, upgrades and replacement, which later will be presented as
concepts.
To summarize, the only consulting services that there is a need for ABB to do, that not are
tied to other service concepts and that could be charged for are network design and location
analysis.
6.4.2 How
ABB has a long history within electrical engineering and extensive knowledge beyond just
charging technology. ABB does power networks, systems and grid studies. A profitable
business model within ABB is to sell equipment that strengthens the power quality. One
customer example is aluminum smelters, which have an unstable consumption that causes
harmonic overtones in the network. Penalties from utilities apply on smelters if they impact
16 Network fees in Sweden is about $10’000 for 50kW per year. See:
http://eon.se/templates/Eon2TextPage.aspx?id=48593&epslanguage=SV
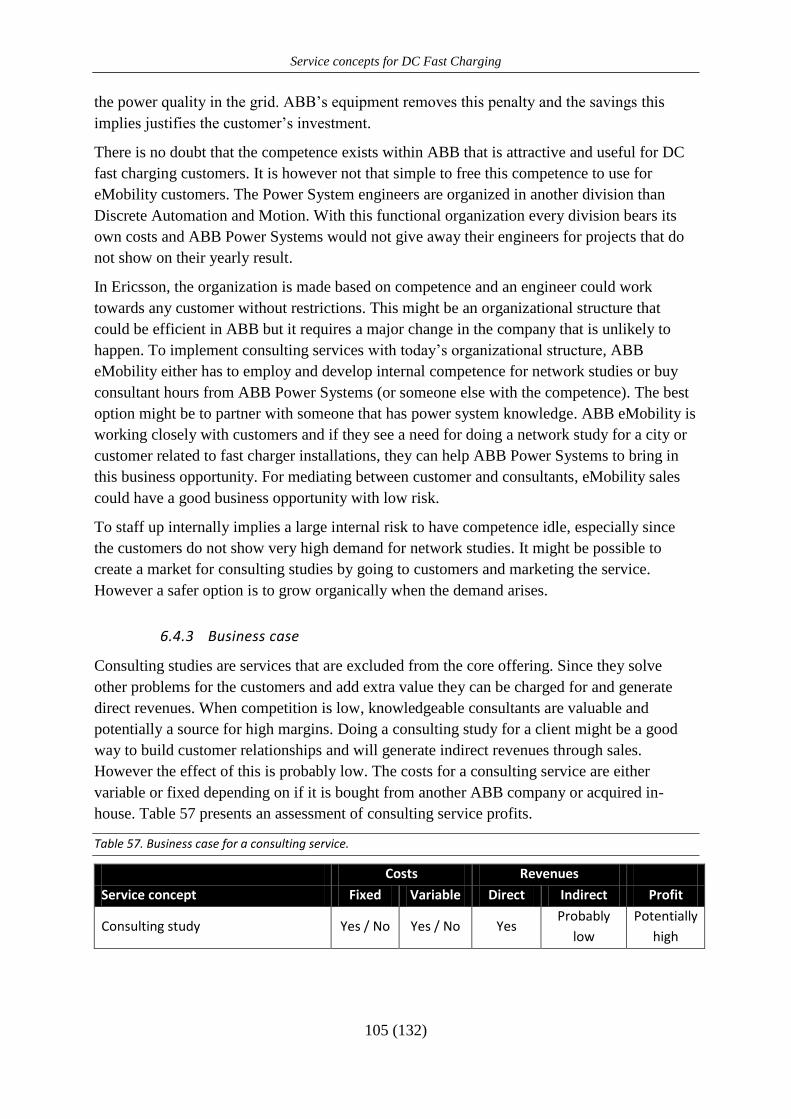
Service concepts for DC Fast Charging
105 (132)
the power quality in the grid. ABB’s equipment removes this penalty and the savings this
implies justifies the customer’s investment.
There is no doubt that the competence exists within ABB that is attractive and useful for DC
fast charging customers. It is however not that simple to free this competence to use for
eMobility customers. The Power System engineers are organized in another division than
Discrete Automation and Motion. With this functional organization every division bears its
own costs and ABB Power Systems would not give away their engineers for projects that do
not show on their yearly result.
In Ericsson, the organization is made based on competence and an engineer could work
towards any customer without restrictions. This might be an organizational structure that
could be efficient in ABB but it requires a major change in the company that is unlikely to
happen. To implement consulting services with today’s organizational structure, ABB
eMobility either has to employ and develop internal competence for network studies or buy
consultant hours from ABB Power Systems (or someone else with the competence). The best
option might be to partner with someone that has power system knowledge. ABB eMobility is
working closely with customers and if they see a need for doing a network study for a city or
customer related to fast charger installations, they can help ABB Power Systems to bring in
this business opportunity. For mediating between customer and consultants, eMobility sales
could have a good business opportunity with low risk.
To staff up internally implies a large internal risk to have competence idle, especially since
the customers do not show very high demand for network studies. It might be possible to
create a market for consulting studies by going to customers and marketing the service.
However a safer option is to grow organically when the demand arises.
6.4.3 Business case
Consulting studies are services that are excluded from the core offering. Since they solve
other problems for the customers and add extra value they can be charged for and generate
direct revenues. When competition is low, knowledgeable consultants are valuable and
potentially a source for high margins. Doing a consulting study for a client might be a good
way to build customer relationships and will generate indirect revenues through sales.
However the effect of this is probably low. The costs for a consulting service are either
variable or fixed depending on if it is bought from another ABB company or acquired in-
house. Table 57 presents an assessment of consulting service profits.
Table 57. Business case for a consulting service.
Costs Revenues
Service concept Fixed Variable Direct Indirect Profit
Consulting study Yes / No Yes / No Yes Probably
low
Potentially
high
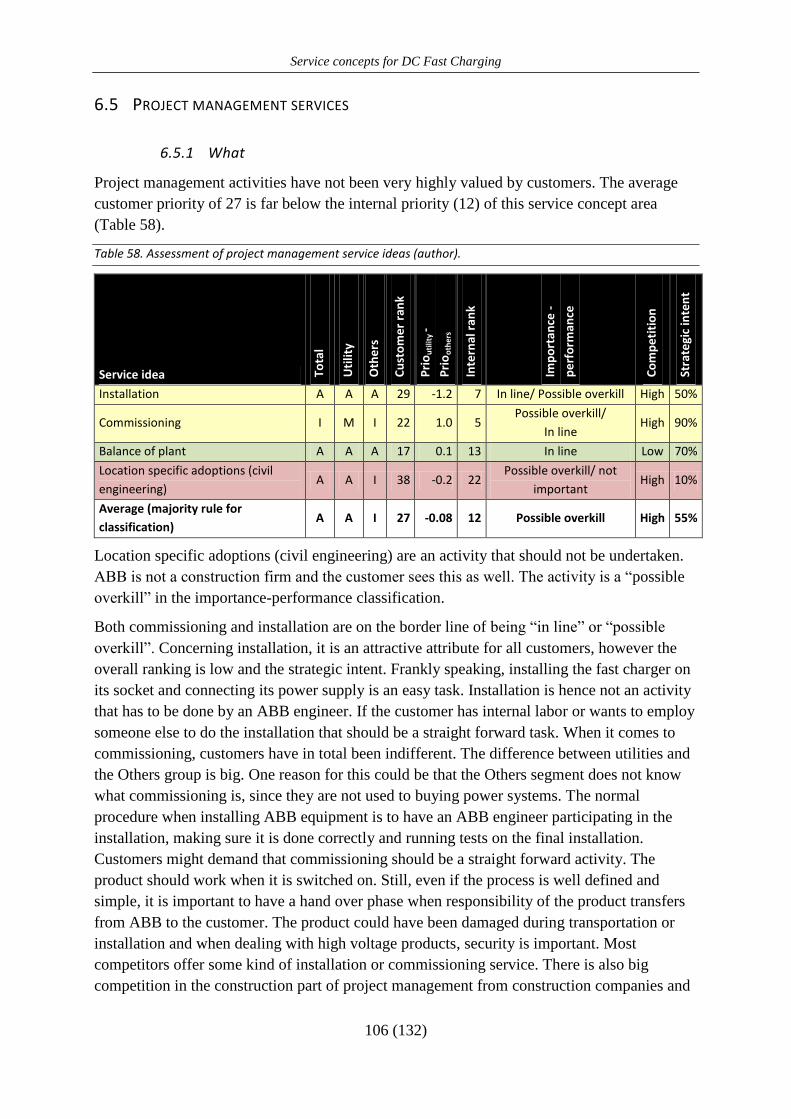
Service concepts for DC Fast Charging
106 (132)
6.5 PROJECT MANAGEMENT SERVICES
6.5.1 What
Project management activities have not been very highly valued by customers. The average
customer priority of 27 is far below the internal priority (12) of this service concept area
(Table 58).
Table 58. Assessment of project management service ideas (author).
Service idea Tota
l
Uti
lity
Oth
ers
Cu
sto
me
r ra
nk
Pri
ou
tilit
y -
Pri
oo
the
rs
Inte
rnal
ran
k
Imp
ort
ance
-
pe
rfo
rman
ce
Co
mp
eti
tio
n
Stra
tegi
c in
ten
t
Installation A A A 29 -1.2 7 In line/ Possible overkill High 50%
Commissioning I M I 22 1.0 5 Possible overkill/
In line High 90%
Balance of plant A A A 17 0.1 13 In line Low 70%
Location specific adoptions (civil
engineering) A A I 38 -0.2 22
Possible overkill/ not
important High 10%
Average (majority rule for
classification) A A I 27 -0.08 12 Possible overkill High 55%
Location specific adoptions (civil engineering) are an activity that should not be undertaken.
ABB is not a construction firm and the customer sees this as well. The activity is a “possible
overkill” in the importance-performance classification.
Both commissioning and installation are on the border line of being “in line” or “possible
overkill”. Concerning installation, it is an attractive attribute for all customers, however the
overall ranking is low and the strategic intent. Frankly speaking, installing the fast charger on
its socket and connecting its power supply is an easy task. Installation is hence not an activity
that has to be done by an ABB engineer. If the customer has internal labor or wants to employ
someone else to do the installation that should be a straight forward task. When it comes to
commissioning, customers have in total been indifferent. The difference between utilities and
the Others group is big. One reason for this could be that the Others segment does not know
what commissioning is, since they are not used to buying power systems. The normal
procedure when installing ABB equipment is to have an ABB engineer participating in the
installation, making sure it is done correctly and running tests on the final installation.
Customers might demand that commissioning should be a straight forward activity. The
product should work when it is switched on. Still, even if the process is well defined and
simple, it is important to have a hand over phase when responsibility of the product transfers
from ABB to the customer. The product could have been damaged during transportation or
installation and when dealing with high voltage products, security is important. Most
competitors offer some kind of installation or commissioning service. There is also big
competition in the construction part of project management from construction companies and
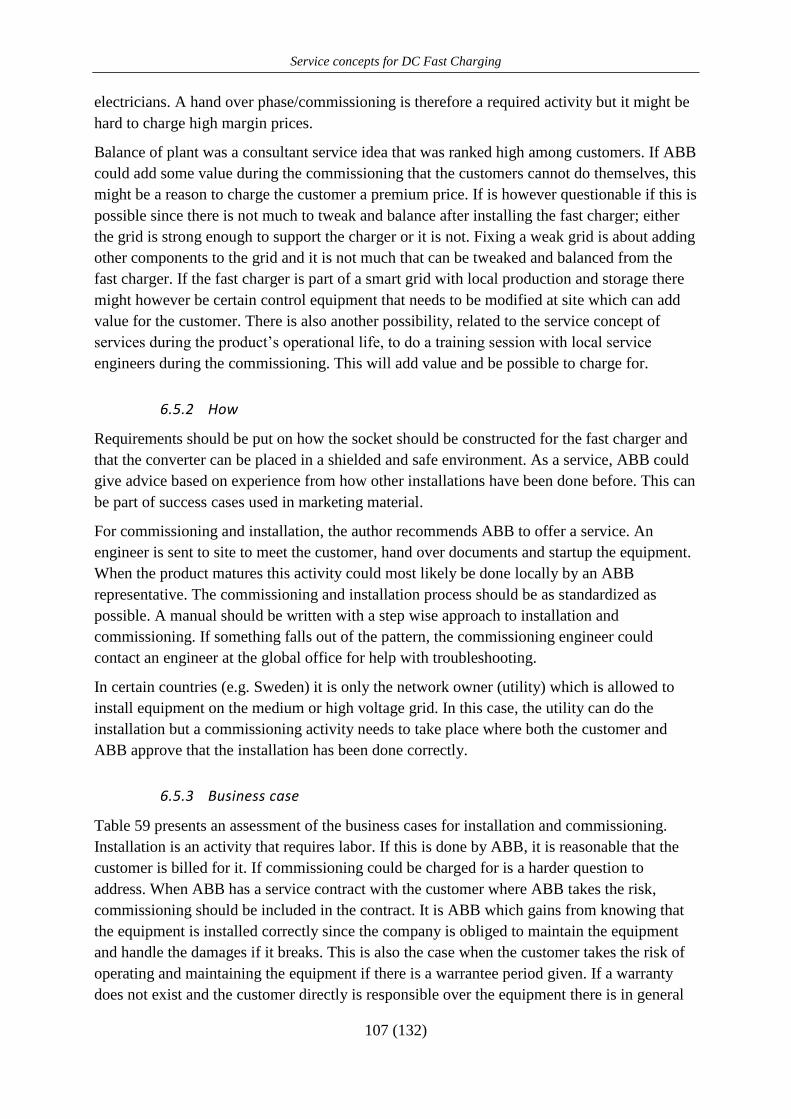
Service concepts for DC Fast Charging
107 (132)
electricians. A hand over phase/commissioning is therefore a required activity but it might be
hard to charge high margin prices.
Balance of plant was a consultant service idea that was ranked high among customers. If ABB
could add some value during the commissioning that the customers cannot do themselves, this
might be a reason to charge the customer a premium price. If is however questionable if this is
possible since there is not much to tweak and balance after installing the fast charger; either
the grid is strong enough to support the charger or it is not. Fixing a weak grid is about adding
other components to the grid and it is not much that can be tweaked and balanced from the
fast charger. If the fast charger is part of a smart grid with local production and storage there
might however be certain control equipment that needs to be modified at site which can add
value for the customer. There is also another possibility, related to the service concept of
services during the product’s operational life, to do a training session with local service
engineers during the commissioning. This will add value and be possible to charge for.
6.5.2 How
Requirements should be put on how the socket should be constructed for the fast charger and
that the converter can be placed in a shielded and safe environment. As a service, ABB could
give advice based on experience from how other installations have been done before. This can
be part of success cases used in marketing material.
For commissioning and installation, the author recommends ABB to offer a service. An
engineer is sent to site to meet the customer, hand over documents and startup the equipment.
When the product matures this activity could most likely be done locally by an ABB
representative. The commissioning and installation process should be as standardized as
possible. A manual should be written with a step wise approach to installation and
commissioning. If something falls out of the pattern, the commissioning engineer could
contact an engineer at the global office for help with troubleshooting.
In certain countries (e.g. Sweden) it is only the network owner (utility) which is allowed to
install equipment on the medium or high voltage grid. In this case, the utility can do the
installation but a commissioning activity needs to take place where both the customer and
ABB approve that the installation has been done correctly.
6.5.3 Business case
Table 59 presents an assessment of the business cases for installation and commissioning.
Installation is an activity that requires labor. If this is done by ABB, it is reasonable that the
customer is billed for it. If commissioning could be charged for is a harder question to
address. When ABB has a service contract with the customer where ABB takes the risk,
commissioning should be included in the contract. It is ABB which gains from knowing that
the equipment is installed correctly since the company is obliged to maintain the equipment
and handle the damages if it breaks. This is also the case when the customer takes the risk of
operating and maintaining the equipment if there is a warrantee period given. If a warranty
does not exist and the customer directly is responsible over the equipment there is in general
Service concepts for DC Fast Charging
108 (132)
no reason for ABB to do commissioning apart from goodwill. In this case the customer might
be interested in a commissioning activity where an ABB responsible person switches on the
equipment and takes the responsibility for checking that the installation has been done
correctly. This risk could be worth paying for but most customers might demand that it is
included in the product price. The direct revenues of commissioning therefore depend on the
situation and so does also the indirect revenues (or cost savings). If ABB has a service
contract taking the product risk, it is good to minimize the number of occasions where the
product breaks due to a faulty installation. In this case commissioning will minimize the costs
of replacement due to breakdown at startup.
Table 59. Assessment of business case for installation and commissioning (author).
Costs Revenues
Service concept Fixed Variable Direct Indirect Profit
Commissioning No Yes – labor Maybe Maybe Low
Installation No Yes – labor Yes No Low
6.6 SERVICES DURING THE PRODUCT’S OPERATIONAL LIFE
6.6.1 What
By compiling the data on the different service ideas a good view can be given on customer
needs for maintenance and services related to product operation (Table 60).
The service ideas have a R2 of 0.49 between the internal and external perspective. This is a
high value compared to the overall correlation of service ideas between internal and external
perspectives ( ); however, it is not a strong correlation. There is in particular one
misfit (preventative maintenance) that accounts for the low correlation scores. Internally, this
is ranked highest, but the customer rank is only 19.
Interesting to note is also that services further to the right of Olivia and Kallenberg’s (2003)
service continuum are less attractive. Network operation is one such example as well as
preventative and predictive maintenance. Receiving updates, spare parts, training and other
services where the supplier takes less responsibility (i.e. to the left of Olivia and Kallenberg’s
(2003) service continuum) of the product is more in line. One reason for this is that customers
are scared of all services that will add to the recurring costs of the product. Since the
commercial business case of DC fast chargers is week, it is important to be lean with costs.
Service contracts is a service idea that is in line and an activity that should be done. This
possibility includes a large responsibility from the supplier to guarantee a risk free operation
for the customer. Hardware upgrades is the service that customers value the most. ABB could
easily deliver equipment for ultra fast charging or an upgraded version of the Chademo
standard. However, the best way to solve this is to sell a new product to the customer or
change the interior of the charger (either on site or in production).
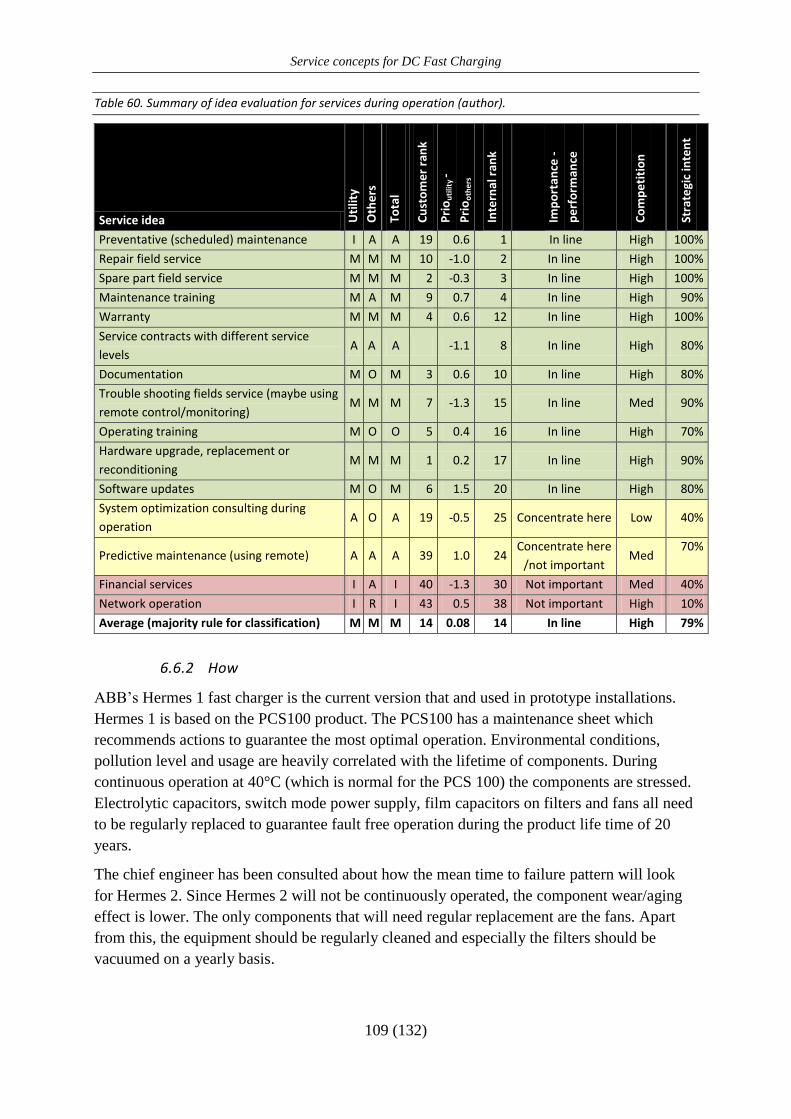
Service concepts for DC Fast Charging
109 (132)
Table 60. Summary of idea evaluation for services during operation (author).
Service idea Uti
lity
Oth
ers
Tota
l
Cu
sto
me
r ra
nk
Pri
ou
tilit
y -
Pri
oo
the
rs
Inte
rnal
ran
k
Imp
ort
ance
-
pe
rfo
rman
ce
Co
mp
eti
tio
n
Stra
tegi
c in
ten
t
Preventative (scheduled) maintenance I A A 19 0.6 1 In line High 100%
Repair field service M M M 10 -1.0 2 In line High 100%
Spare part field service M M M 2 -0.3 3 In line High 100%
Maintenance training M A M 9 0.7 4 In line High 90%
Warranty M M M 4 0.6 12 In line High 100%
Service contracts with different service
levels A A A -1.1 8 In line High 80%
Documentation M O M 3 0.6 10 In line High 80%
Trouble shooting fields service (maybe using
remote control/monitoring) M M M 7 -1.3 15 In line Med 90%
Operating training M O O 5 0.4 16 In line High 70%
Hardware upgrade, replacement or
reconditioning M M M 1 0.2 17 In line High 90%
Software updates M O M 6 1.5 20 In line High 80%
System optimization consulting during
operation A O A 19 -0.5 25 Concentrate here Low 40%
Predictive maintenance (using remote) A A A 39 1.0 24 Concentrate here
/not important Med
70%
Financial services I A I 40 -1.3 30 Not important Med 40%
Network operation I R I 43 0.5 38 Not important High 10%
Average (majority rule for classification) M M M 14 0.08 14 In line High 79%
6.6.2 How
ABB’s Hermes 1 fast charger is the current version that and used in prototype installations.
Hermes 1 is based on the PCS100 product. The PCS100 has a maintenance sheet which
recommends actions to guarantee the most optimal operation. Environmental conditions,
pollution level and usage are heavily correlated with the lifetime of components. During
continuous operation at 40°C (which is normal for the PCS 100) the components are stressed.
Electrolytic capacitors, switch mode power supply, film capacitors on filters and fans all need
to be regularly replaced to guarantee fault free operation during the product life time of 20
years.
The chief engineer has been consulted about how the mean time to failure pattern will look
for Hermes 2. Since Hermes 2 will not be continuously operated, the component wear/aging
effect is lower. The only components that will need regular replacement are the fans. Apart
from this, the equipment should be regularly cleaned and especially the filters should be
vacuumed on a yearly basis.

Service concepts for DC Fast Charging
110 (132)
The PCS 100 is an industrial product that is locked up securely inside a factory. It has low
customer exposure. This is different from the DC fast charger that will be exposed to the
public. This makes it subject to potential vandalism and wear from customers. Since the fast
charger can be placed outside, weather is also a factor impacting the product quality. In
Denmark, a DC fast charger prototype is installed in central Copenhagen next to a gas station
and a car rental company. Right next to the installation, an AC charging station is full of
graffiti (Figure 34). The DC fast charger has a robust aluminum/steel exterior. The power
cable, connector and touch screen are however all vulnerable to damage, theft or customer
wear and tear (Figure 35). The power converter and power electronics are placed in a separate
locker which is shielded from vandalism and does not have any parts that the customer
interacts with.
Figure 34. AC Slow Chargers installed 20 meters from the DC fast charger in Copenhagen (no security cameras
for protection) (author).
Figure 35. The DC Fast Charging prototype installation in Copenhagen. The picture also shows the components
that are subject to wear and tear (author).
Cable
Display and
protective
glass
Plug
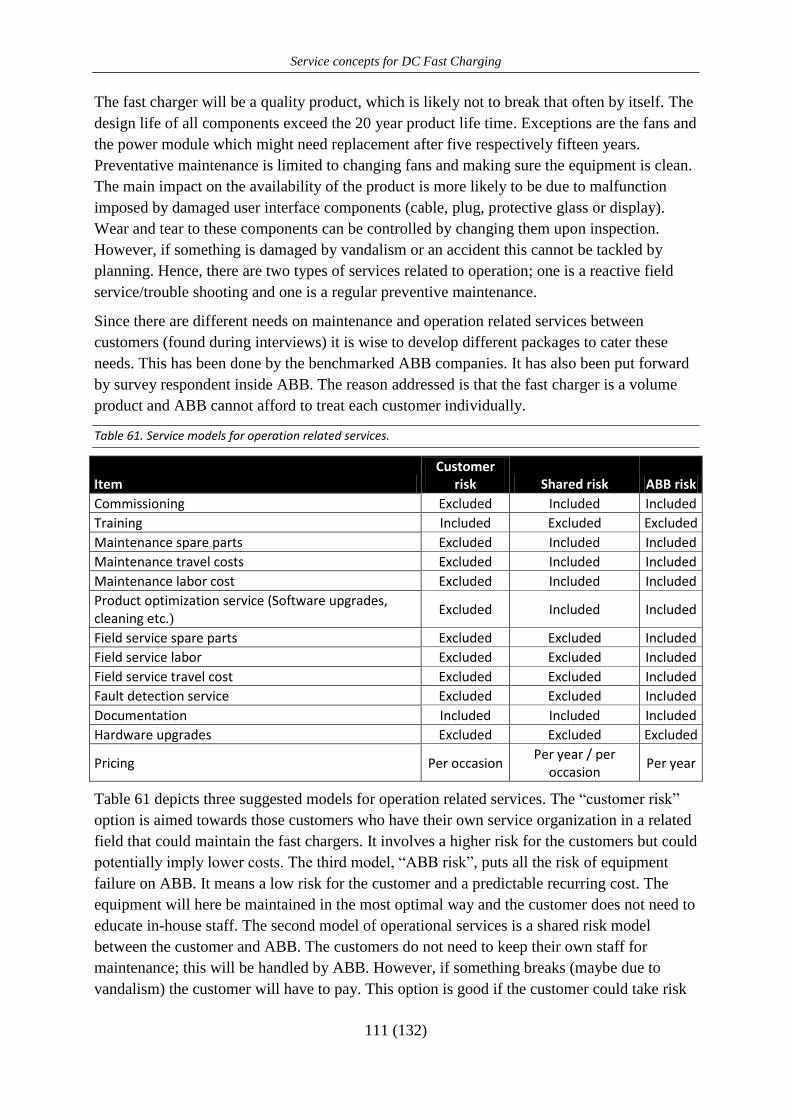
Service concepts for DC Fast Charging
111 (132)
The fast charger will be a quality product, which is likely not to break that often by itself. The
design life of all components exceed the 20 year product life time. Exceptions are the fans and
the power module which might need replacement after five respectively fifteen years.
Preventative maintenance is limited to changing fans and making sure the equipment is clean.
The main impact on the availability of the product is more likely to be due to malfunction
imposed by damaged user interface components (cable, plug, protective glass or display).
Wear and tear to these components can be controlled by changing them upon inspection.
However, if something is damaged by vandalism or an accident this cannot be tackled by
planning. Hence, there are two types of services related to operation; one is a reactive field
service/trouble shooting and one is a regular preventive maintenance.
Since there are different needs on maintenance and operation related services between
customers (found during interviews) it is wise to develop different packages to cater these
needs. This has been done by the benchmarked ABB companies. It has also been put forward
by survey respondent inside ABB. The reason addressed is that the fast charger is a volume
product and ABB cannot afford to treat each customer individually.
Table 61. Service models for operation related services.
Item
Customer risk Shared risk ABB risk
Commissioning Excluded Included Included
Training Included Excluded Excluded
Maintenance spare parts Excluded Included Included
Maintenance travel costs Excluded Included Included
Maintenance labor cost Excluded Included Included
Product optimization service (Software upgrades, cleaning etc.)
Excluded Included Included
Field service spare parts Excluded Excluded Included
Field service labor Excluded Excluded Included
Field service travel cost Excluded Excluded Included
Fault detection service Excluded Excluded Included
Documentation Included Included Included
Hardware upgrades Excluded Excluded Excluded
Pricing Per occasion Per year / per
occasion Per year
Table 61 depicts three suggested models for operation related services. The “customer risk”
option is aimed towards those customers who have their own service organization in a related
field that could maintain the fast chargers. It involves a higher risk for the customers but could
potentially imply lower costs. The third model, “ABB risk”, puts all the risk of equipment
failure on ABB. It means a low risk for the customer and a predictable recurring cost. The
equipment will here be maintained in the most optimal way and the customer does not need to
educate in-house staff. The second model of operational services is a shared risk model
between the customer and ABB. The customers do not need to keep their own staff for
maintenance; this will be handled by ABB. However, if something breaks (maybe due to
vandalism) the customer will have to pay. This option is good if the customer could take risk
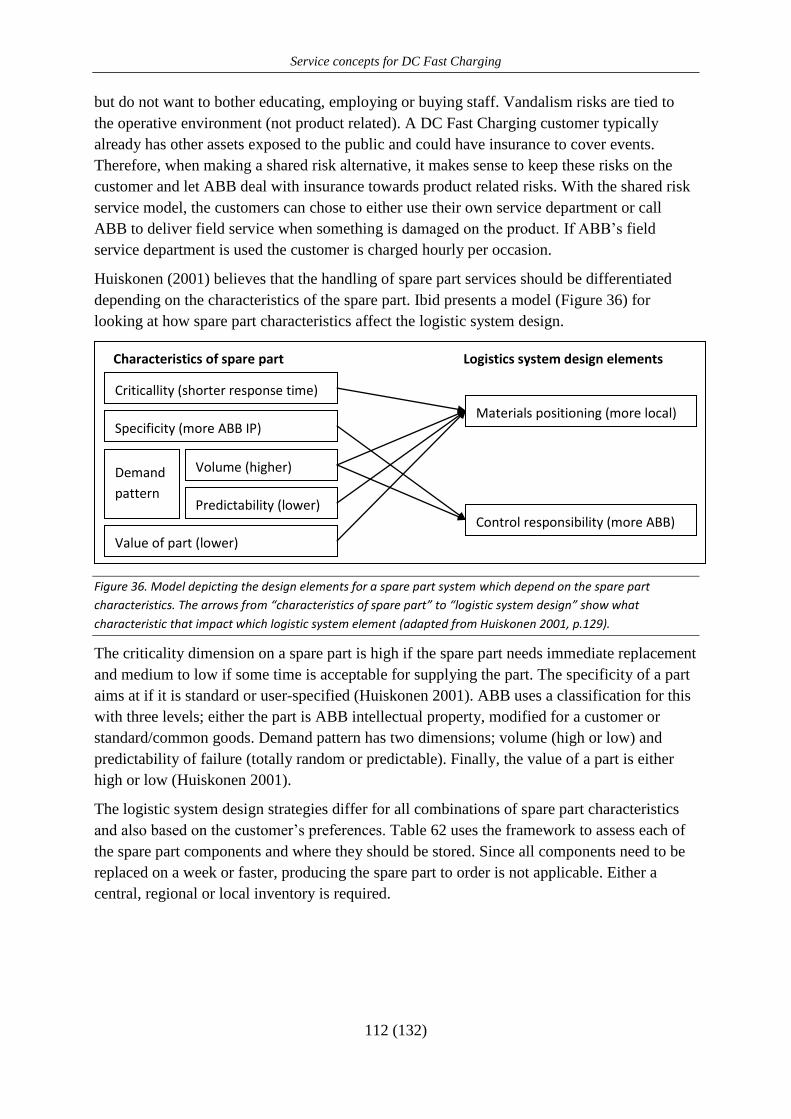
Service concepts for DC Fast Charging
112 (132)
but do not want to bother educating, employing or buying staff. Vandalism risks are tied to
the operative environment (not product related). A DC Fast Charging customer typically
already has other assets exposed to the public and could have insurance to cover events.
Therefore, when making a shared risk alternative, it makes sense to keep these risks on the
customer and let ABB deal with insurance towards product related risks. With the shared risk
service model, the customers can chose to either use their own service department or call
ABB to deliver field service when something is damaged on the product. If ABB’s field
service department is used the customer is charged hourly per occasion.
Huiskonen (2001) believes that the handling of spare part services should be differentiated
depending on the characteristics of the spare part. Ibid presents a model (Figure 36) for
looking at how spare part characteristics affect the logistic system design.
Figure 36. Model depicting the design elements for a spare part system which depend on the spare part
characteristics. The arrows from “characteristics of spare part” to “logistic system design” show what
characteristic that impact which logistic system element (adapted from Huiskonen 2001, p.129).
The criticality dimension on a spare part is high if the spare part needs immediate replacement
and medium to low if some time is acceptable for supplying the part. The specificity of a part
aims at if it is standard or user-specified (Huiskonen 2001). ABB uses a classification for this
with three levels; either the part is ABB intellectual property, modified for a customer or
standard/common goods. Demand pattern has two dimensions; volume (high or low) and
predictability of failure (totally random or predictable). Finally, the value of a part is either
high or low (Huiskonen 2001).
The logistic system design strategies differ for all combinations of spare part characteristics
and also based on the customer’s preferences. Table 62 uses the framework to assess each of
the spare part components and where they should be stored. Since all components need to be
replaced on a week or faster, producing the spare part to order is not applicable. Either a
central, regional or local inventory is required.
Characteristics of spare part Logistics system design elements
Criticallity (shorter response time)
) Specificity (more ABB IP)
Demand
pattern
Value of part (lower)
Materials positioning (more local)
Control responsibility (more ABB) Predictability (lower)
Volume (higher)
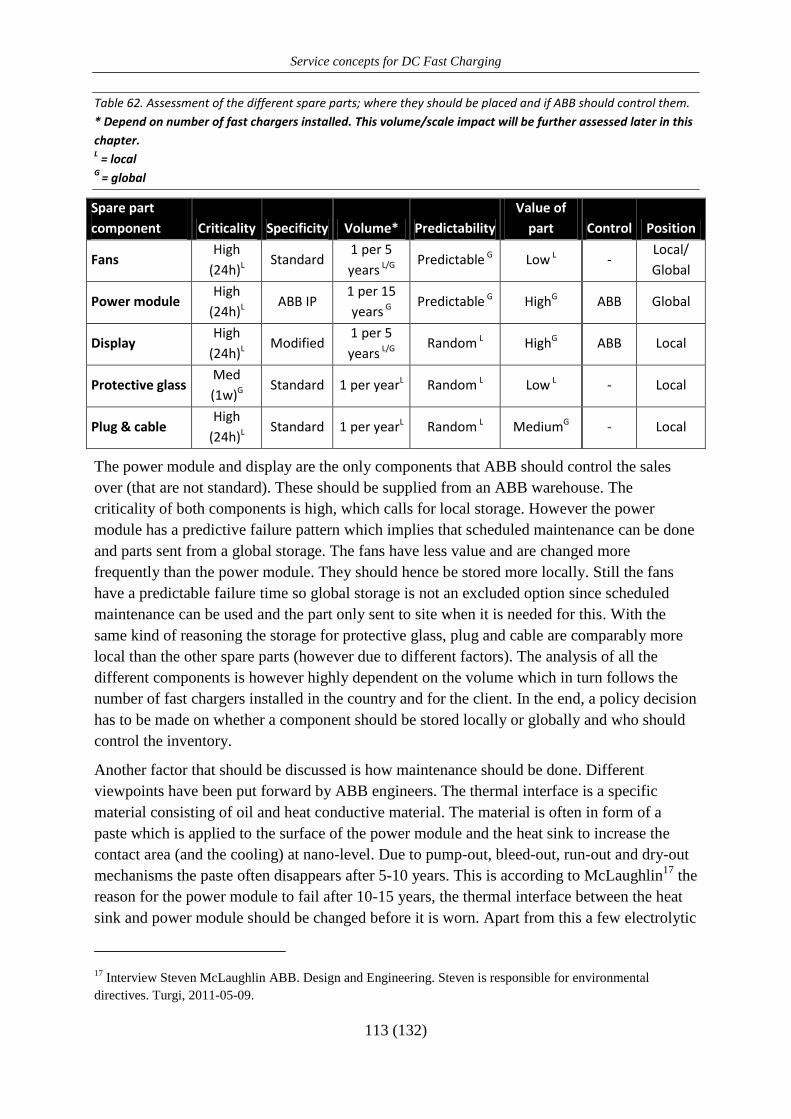
Service concepts for DC Fast Charging
113 (132)
Table 62. Assessment of the different spare parts; where they should be placed and if ABB should control them.
* Depend on number of fast chargers installed. This volume/scale impact will be further assessed later in this
chapter. L = local
G = global
Spare part
component Criticality Specificity Volume* Predictability
Value of
part Control Position
Fans High
(24h)L Standard
1 per 5
years L/G Predictable G Low L -
Local/
Global
Power module High
(24h)L ABB IP
1 per 15
years G Predictable G HighG ABB Global
Display High
(24h)L Modified
1 per 5
years L/G Random L HighG ABB Local
Protective glass Med
(1w)G Standard 1 per yearL Random L Low L - Local
Plug & cable High
(24h)L Standard 1 per yearL Random L MediumG - Local
The power module and display are the only components that ABB should control the sales
over (that are not standard). These should be supplied from an ABB warehouse. The
criticality of both components is high, which calls for local storage. However the power
module has a predictive failure pattern which implies that scheduled maintenance can be done
and parts sent from a global storage. The fans have less value and are changed more
frequently than the power module. They should hence be stored more locally. Still the fans
have a predictable failure time so global storage is not an excluded option since scheduled
maintenance can be used and the part only sent to site when it is needed for this. With the
same kind of reasoning the storage for protective glass, plug and cable are comparably more
local than the other spare parts (however due to different factors). The analysis of all the
different components is however highly dependent on the volume which in turn follows the
number of fast chargers installed in the country and for the client. In the end, a policy decision
has to be made on whether a component should be stored locally or globally and who should
control the inventory.
Another factor that should be discussed is how maintenance should be done. Different
viewpoints have been put forward by ABB engineers. The thermal interface is a specific
material consisting of oil and heat conductive material. The material is often in form of a
paste which is applied to the surface of the power module and the heat sink to increase the
contact area (and the cooling) at nano-level. Due to pump-out, bleed-out, run-out and dry-out
mechanisms the paste often disappears after 5-10 years. This is according to McLaughlin17
the
reason for the power module to fail after 10-15 years, the thermal interface between the heat
sink and power module should be changed before it is worn. Apart from this a few electrolytic
17 Interview Steven McLaughlin ABB. Design and Engineering. Steven is responsible for environmental
directives. Turgi, 2011-05-09.
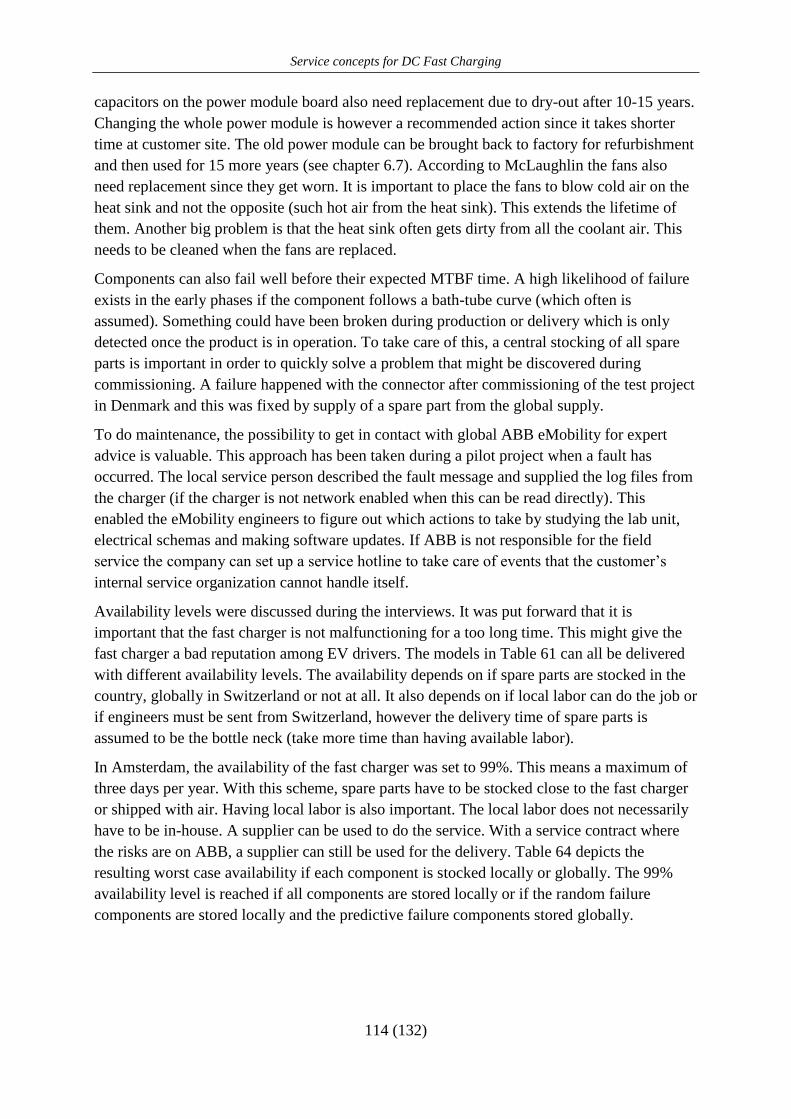
Service concepts for DC Fast Charging
114 (132)
capacitors on the power module board also need replacement due to dry-out after 10-15 years.
Changing the whole power module is however a recommended action since it takes shorter
time at customer site. The old power module can be brought back to factory for refurbishment
and then used for 15 more years (see chapter 6.7). According to McLaughlin the fans also
need replacement since they get worn. It is important to place the fans to blow cold air on the
heat sink and not the opposite (such hot air from the heat sink). This extends the lifetime of
them. Another big problem is that the heat sink often gets dirty from all the coolant air. This
needs to be cleaned when the fans are replaced.
Components can also fail well before their expected MTBF time. A high likelihood of failure
exists in the early phases if the component follows a bath-tube curve (which often is
assumed). Something could have been broken during production or delivery which is only
detected once the product is in operation. To take care of this, a central stocking of all spare
parts is important in order to quickly solve a problem that might be discovered during
commissioning. A failure happened with the connector after commissioning of the test project
in Denmark and this was fixed by supply of a spare part from the global supply.
To do maintenance, the possibility to get in contact with global ABB eMobility for expert
advice is valuable. This approach has been taken during a pilot project when a fault has
occurred. The local service person described the fault message and supplied the log files from
the charger (if the charger is not network enabled when this can be read directly). This
enabled the eMobility engineers to figure out which actions to take by studying the lab unit,
electrical schemas and making software updates. If ABB is not responsible for the field
service the company can set up a service hotline to take care of events that the customer’s
internal service organization cannot handle itself.
Availability levels were discussed during the interviews. It was put forward that it is
important that the fast charger is not malfunctioning for a too long time. This might give the
fast charger a bad reputation among EV drivers. The models in Table 61 can all be delivered
with different availability levels. The availability depends on if spare parts are stocked in the
country, globally in Switzerland or not at all. It also depends on if local labor can do the job or
if engineers must be sent from Switzerland, however the delivery time of spare parts is
assumed to be the bottle neck (take more time than having available labor).
In Amsterdam, the availability of the fast charger was set to 99%. This means a maximum of
three days per year. With this scheme, spare parts have to be stocked close to the fast charger
or shipped with air. Having local labor is also important. The local labor does not necessarily
have to be in-house. A supplier can be used to do the service. With a service contract where
the risks are on ABB, a supplier can still be used for the delivery. Table 64 depicts the
resulting worst case availability if each component is stocked locally or globally. The 99%
availability level is reached if all components are stored locally or if the random failure
components are stored locally and the predictive failure components stored globally.
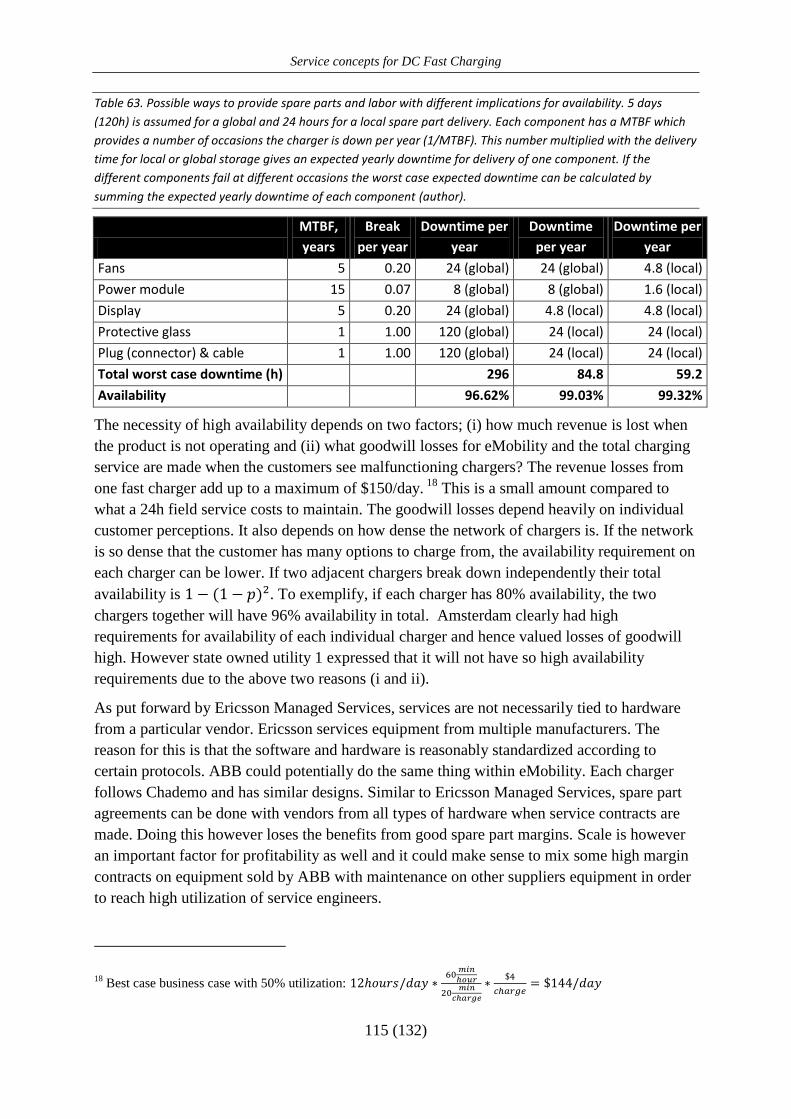
Service concepts for DC Fast Charging
115 (132)
Table 63. Possible ways to provide spare parts and labor with different implications for availability. 5 days
(120h) is assumed for a global and 24 hours for a local spare part delivery. Each component has a MTBF which
provides a number of occasions the charger is down per year (1/MTBF). This number multiplied with the delivery
time for local or global storage gives an expected yearly downtime for delivery of one component. If the
different components fail at different occasions the worst case expected downtime can be calculated by
summing the expected yearly downtime of each component (author).
MTBF,
years
Break
per year
Downtime per
year
Downtime
per year
Downtime per
year
Fans 5 0.20 24 (global) 24 (global) 4.8 (local)
Power module 15 0.07 8 (global) 8 (global) 1.6 (local)
Display 5 0.20 24 (global) 4.8 (local) 4.8 (local)
Protective glass 1 1.00 120 (global) 24 (local) 24 (local)
Plug (connector) & cable 1 1.00 120 (global) 24 (local) 24 (local)
Total worst case downtime (h) 296 84.8 59.2
Availability 96.62% 99.03% 99.32%
The necessity of high availability depends on two factors; (i) how much revenue is lost when
the product is not operating and (ii) what goodwill losses for eMobility and the total charging
service are made when the customers see malfunctioning chargers? The revenue losses from
one fast charger add up to a maximum of $150/day. 18
This is a small amount compared to
what a 24h field service costs to maintain. The goodwill losses depend heavily on individual
customer perceptions. It also depends on how dense the network of chargers is. If the network
is so dense that the customer has many options to charge from, the availability requirement on
each charger can be lower. If two adjacent chargers break down independently their total
availability is . To exemplify, if each charger has 80% availability, the two
chargers together will have 96% availability in total. Amsterdam clearly had high
requirements for availability of each individual charger and hence valued losses of goodwill
high. However state owned utility 1 expressed that it will not have so high availability
requirements due to the above two reasons (i and ii).
As put forward by Ericsson Managed Services, services are not necessarily tied to hardware
from a particular vendor. Ericsson services equipment from multiple manufacturers. The
reason for this is that the software and hardware is reasonably standardized according to
certain protocols. ABB could potentially do the same thing within eMobility. Each charger
follows Chademo and has similar designs. Similar to Ericsson Managed Services, spare part
agreements can be done with vendors from all types of hardware when service contracts are
made. Doing this however loses the benefits from good spare part margins. Scale is however
an important factor for profitability as well and it could make sense to mix some high margin
contracts on equipment sold by ABB with maintenance on other suppliers equipment in order
to reach high utilization of service engineers.
18 Best case business case with 50% utilization:
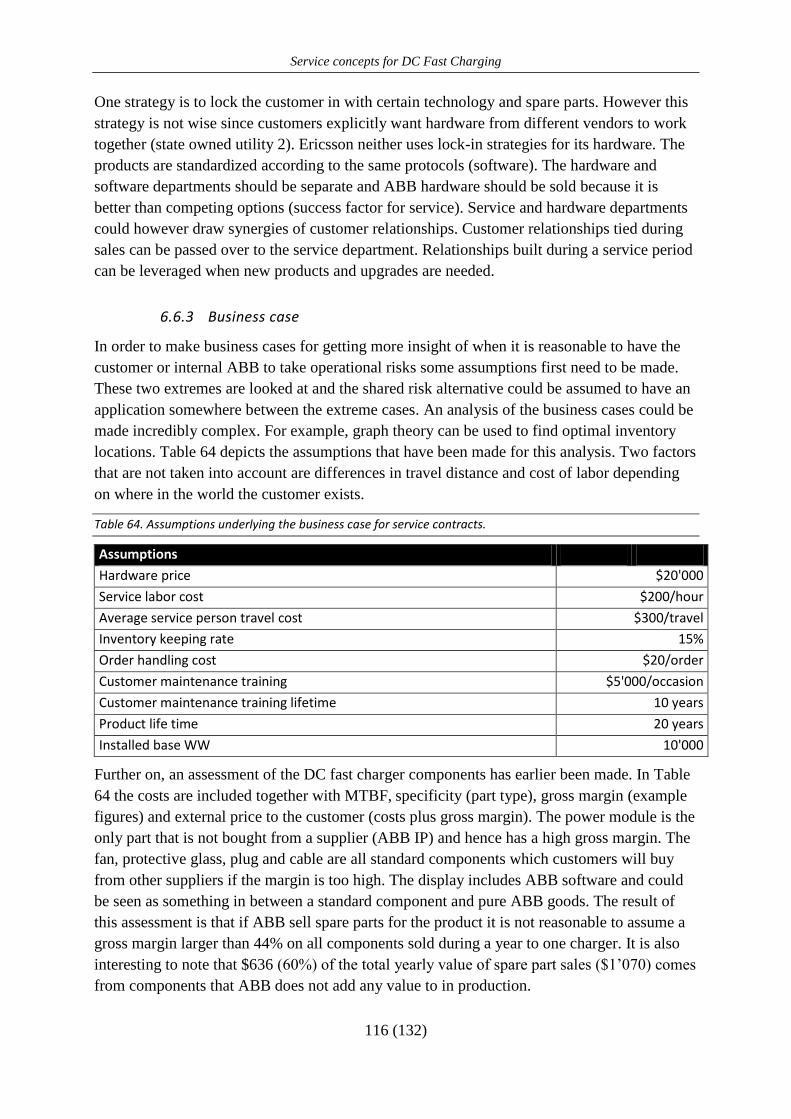
Service concepts for DC Fast Charging
116 (132)
One strategy is to lock the customer in with certain technology and spare parts. However this
strategy is not wise since customers explicitly want hardware from different vendors to work
together (state owned utility 2). Ericsson neither uses lock-in strategies for its hardware. The
products are standardized according to the same protocols (software). The hardware and
software departments should be separate and ABB hardware should be sold because it is
better than competing options (success factor for service). Service and hardware departments
could however draw synergies of customer relationships. Customer relationships tied during
sales can be passed over to the service department. Relationships built during a service period
can be leveraged when new products and upgrades are needed.
6.6.3 Business case
In order to make business cases for getting more insight of when it is reasonable to have the
customer or internal ABB to take operational risks some assumptions first need to be made.
These two extremes are looked at and the shared risk alternative could be assumed to have an
application somewhere between the extreme cases. An analysis of the business cases could be
made incredibly complex. For example, graph theory can be used to find optimal inventory
locations. Table 64 depicts the assumptions that have been made for this analysis. Two factors
that are not taken into account are differences in travel distance and cost of labor depending
on where in the world the customer exists.
Table 64. Assumptions underlying the business case for service contracts.
Assumptions
Hardware price $20'000
Service labor cost $200/hour
Average service person travel cost $300/travel
Inventory keeping rate 15%
Order handling cost $20/order
Customer maintenance training $5'000/occasion
Customer maintenance training lifetime 10 years
Product life time 20 years
Installed base WW 10'000
Further on, an assessment of the DC fast charger components has earlier been made. In Table
64 the costs are included together with MTBF, specificity (part type), gross margin (example
figures) and external price to the customer (costs plus gross margin). The power module is the
only part that is not bought from a supplier (ABB IP) and hence has a high gross margin. The
fan, protective glass, plug and cable are all standard components which customers will buy
from other suppliers if the margin is too high. The display includes ABB software and could
be seen as something in between a standard component and pure ABB goods. The result of
this assessment is that if ABB sell spare parts for the product it is not reasonable to assume a
gross margin larger than 44% on all components sold during a year to one charger. It is also
interesting to note that $636 (60%) of the total yearly value of spare part sales ($1’070) comes
from components that ABB does not add any value to in production.
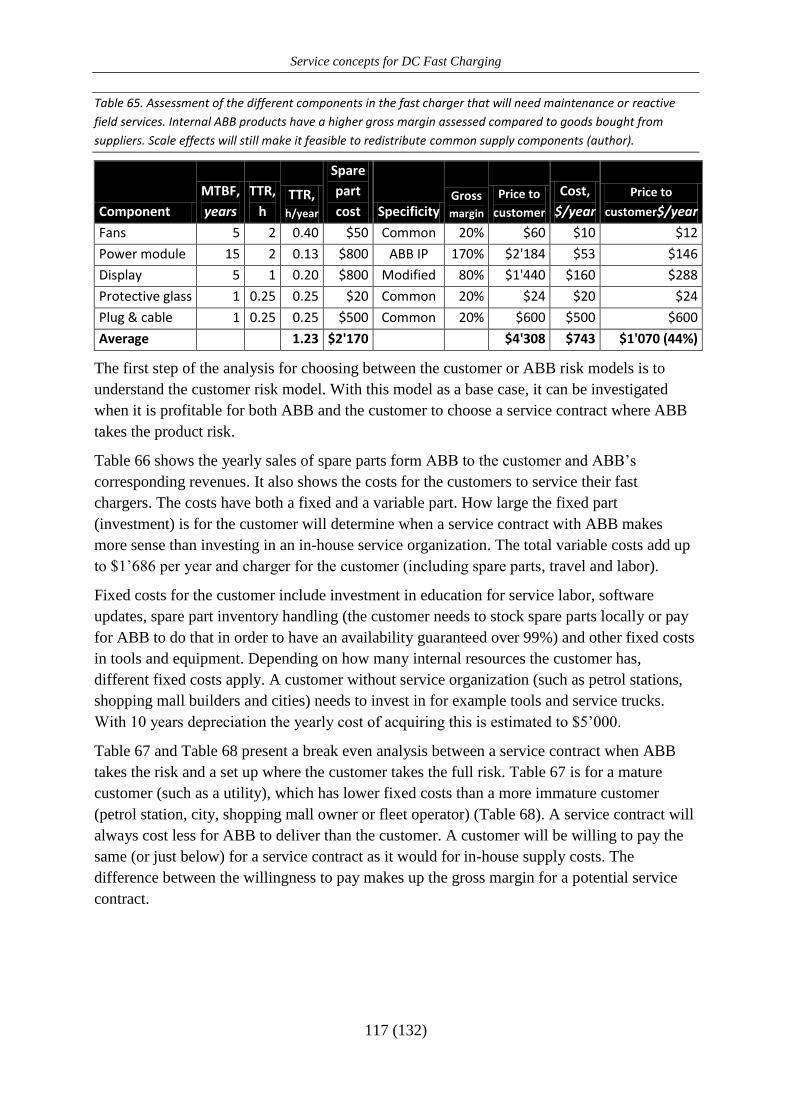
Service concepts for DC Fast Charging
117 (132)
Table 65. Assessment of the different components in the fast charger that will need maintenance or reactive
field services. Internal ABB products have a higher gross margin assessed compared to goods bought from
suppliers. Scale effects will still make it feasible to redistribute common supply components (author).
Component
MTBF,
years
TTR,
h TTR,
h/year
Spare
part
cost Specificity Gross
margin
Price to
customer
Cost,
$/year
Price to
customer$/year
Fans 5 2 0.40 $50 Common 20% $60 $10 $12
Power module 15 2 0.13 $800 ABB IP 170% $2'184 $53 $146
Display 5 1 0.20 $800 Modified 80% $1'440 $160 $288
Protective glass 1 0.25 0.25 $20 Common 20% $24 $20 $24
Plug & cable 1 0.25 0.25 $500 Common 20% $600 $500 $600
Average
1.23 $2'170
$4'308 $743 $1'070 (44%)
The first step of the analysis for choosing between the customer or ABB risk models is to
understand the customer risk model. With this model as a base case, it can be investigated
when it is profitable for both ABB and the customer to choose a service contract where ABB
takes the product risk.
Table 66 shows the yearly sales of spare parts form ABB to the customer and ABB’s
corresponding revenues. It also shows the costs for the customers to service their fast
chargers. The costs have both a fixed and a variable part. How large the fixed part
(investment) is for the customer will determine when a service contract with ABB makes
more sense than investing in an in-house service organization. The total variable costs add up
to $1’686 per year and charger for the customer (including spare parts, travel and labor).
Fixed costs for the customer include investment in education for service labor, software
updates, spare part inventory handling (the customer needs to stock spare parts locally or pay
for ABB to do that in order to have an availability guaranteed over 99%) and other fixed costs
in tools and equipment. Depending on how many internal resources the customer has,
different fixed costs apply. A customer without service organization (such as petrol stations,
shopping mall builders and cities) needs to invest in for example tools and service trucks.
With 10 years depreciation the yearly cost of acquiring this is estimated to $5’000.
Table 67 and Table 68 present a break even analysis between a service contract when ABB
takes the risk and a set up where the customer takes the full risk. Table 67 is for a mature
customer (such as a utility), which has lower fixed costs than a more immature customer
(petrol station, city, shopping mall owner or fleet operator) (Table 68). A service contract will
always cost less for ABB to deliver than the customer. A customer will be willing to pay the
same (or just below) for a service contract as it would for in-house supply costs. The
difference between the willingness to pay makes up the gross margin for a potential service
contract.
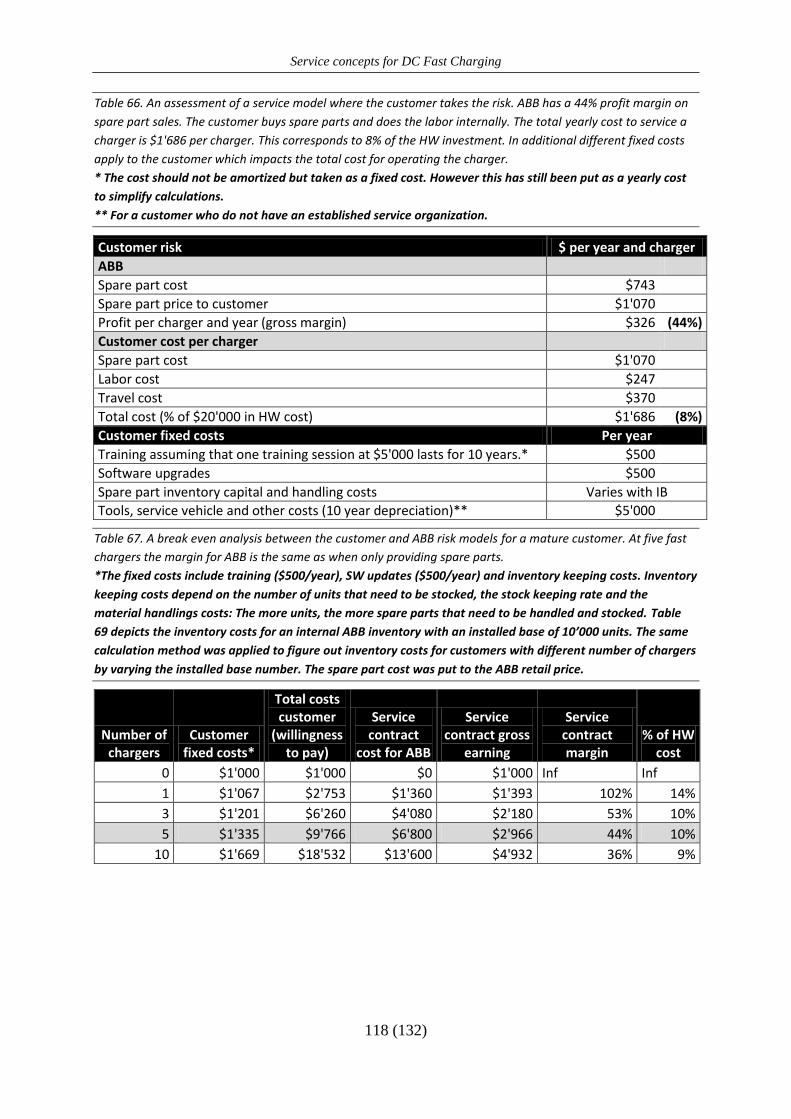
Service concepts for DC Fast Charging
118 (132)
Table 66. An assessment of a service model where the customer takes the risk. ABB has a 44% profit margin on
spare part sales. The customer buys spare parts and does the labor internally. The total yearly cost to service a
charger is $1'686 per charger. This corresponds to 8% of the HW investment. In additional different fixed costs
apply to the customer which impacts the total cost for operating the charger.
* The cost should not be amortized but taken as a fixed cost. However this has still been put as a yearly cost
to simplify calculations.
** For a customer who do not have an established service organization.
Customer risk $ per year and charger
ABB
Spare part cost $743
Spare part price to customer $1'070
Profit per charger and year (gross margin) $326 (44%)
Customer cost per charger
Spare part cost $1'070
Labor cost $247
Travel cost $370
Total cost (% of $20'000 in HW cost) $1'686 (8%)
Customer fixed costs Per year
Training assuming that one training session at $5'000 lasts for 10 years.* $500
Software upgrades $500 Spare part inventory capital and handling costs Varies with IB
Tools, service vehicle and other costs (10 year depreciation)** $5'000
Table 67. A break even analysis between the customer and ABB risk models for a mature customer. At five fast
chargers the margin for ABB is the same as when only providing spare parts.
*The fixed costs include training ($500/year), SW updates ($500/year) and inventory keeping costs. Inventory
keeping costs depend on the number of units that need to be stocked, the stock keeping rate and the
material handlings costs: The more units, the more spare parts that need to be handled and stocked. Table
69 depicts the inventory costs for an internal ABB inventory with an installed base of 10’000 units. The same
calculation method was applied to figure out inventory costs for customers with different number of chargers
by varying the installed base number. The spare part cost was put to the ABB retail price.
Number of chargers
Customer fixed costs*
Total costs customer
(willingness to pay)
Service contract
cost for ABB
Service contract gross
earning
Service contract margin
% of HW cost
0 $1'000 $1'000 $0 $1'000 Inf Inf
1 $1'067 $2'753 $1'360 $1'393 102% 14%
3 $1'201 $6'260 $4'080 $2'180 53% 10%
5 $1'335 $9'766 $6'800 $2'966 44% 10%
10 $1'669 $18'532 $13'600 $4'932 36% 9%
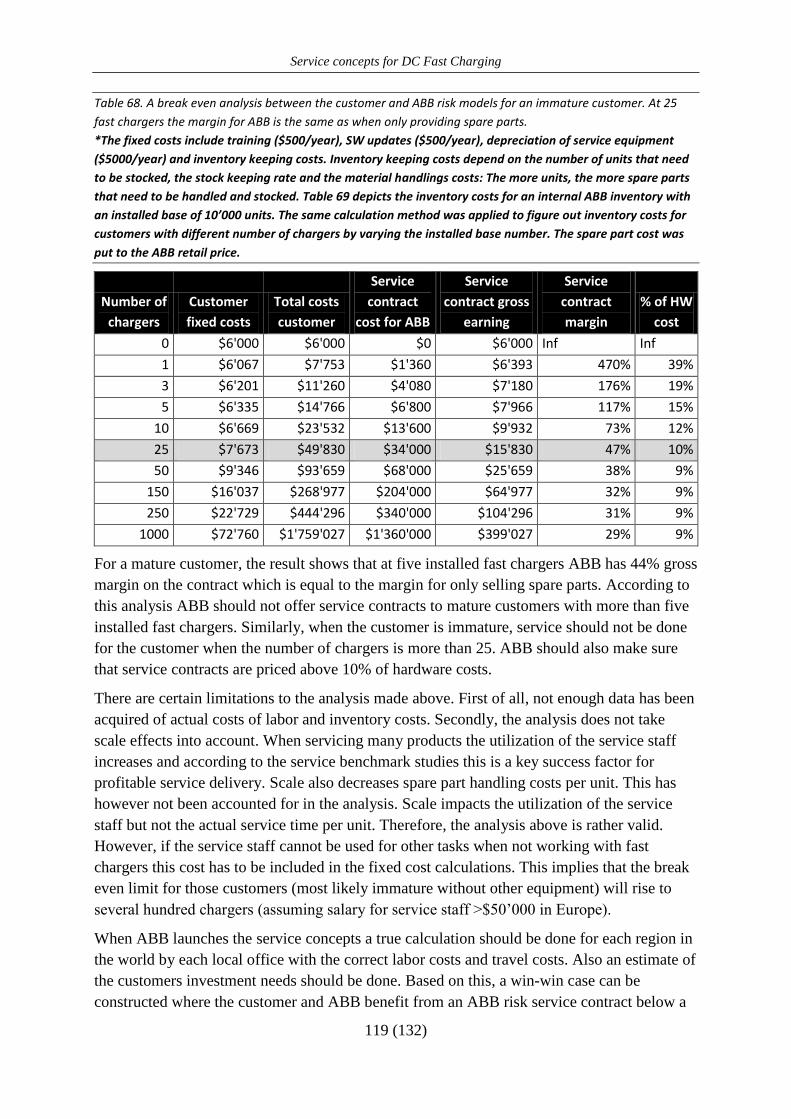
Service concepts for DC Fast Charging
119 (132)
Table 68. A break even analysis between the customer and ABB risk models for an immature customer. At 25
fast chargers the margin for ABB is the same as when only providing spare parts.
*The fixed costs include training ($500/year), SW updates ($500/year), depreciation of service equipment
($5000/year) and inventory keeping costs. Inventory keeping costs depend on the number of units that need
to be stocked, the stock keeping rate and the material handlings costs: The more units, the more spare parts
that need to be handled and stocked. Table 69 depicts the inventory costs for an internal ABB inventory with
an installed base of 10’000 units. The same calculation method was applied to figure out inventory costs for
customers with different number of chargers by varying the installed base number. The spare part cost was
put to the ABB retail price.
Number of
chargers
Customer
fixed costs
Total costs
customer
Service
contract
cost for ABB
Service
contract gross
earning
Service
contract
margin
% of HW
cost
0 $6'000 $6'000 $0 $6'000 Inf Inf
1 $6'067 $7'753 $1'360 $6'393 470% 39%
3 $6'201 $11'260 $4'080 $7'180 176% 19%
5 $6'335 $14'766 $6'800 $7'966 117% 15%
10 $6'669 $23'532 $13'600 $9'932 73% 12%
25 $7'673 $49'830 $34'000 $15'830 47% 10%
50 $9'346 $93'659 $68'000 $25'659 38% 9%
150 $16'037 $268'977 $204'000 $64'977 32% 9%
250 $22'729 $444'296 $340'000 $104'296 31% 9%
1000 $72'760 $1'759'027 $1'360'000 $399'027 29% 9%
For a mature customer, the result shows that at five installed fast chargers ABB has 44% gross
margin on the contract which is equal to the margin for only selling spare parts. According to
this analysis ABB should not offer service contracts to mature customers with more than five
installed fast chargers. Similarly, when the customer is immature, service should not be done
for the customer when the number of chargers is more than 25. ABB should also make sure
that service contracts are priced above 10% of hardware costs.
There are certain limitations to the analysis made above. First of all, not enough data has been
acquired of actual costs of labor and inventory costs. Secondly, the analysis does not take
scale effects into account. When servicing many products the utilization of the service staff
increases and according to the service benchmark studies this is a key success factor for
profitable service delivery. Scale also decreases spare part handling costs per unit. This has
however not been accounted for in the analysis. Scale impacts the utilization of the service
staff but not the actual service time per unit. Therefore, the analysis above is rather valid.
However, if the service staff cannot be used for other tasks when not working with fast
chargers this cost has to be included in the fixed cost calculations. This implies that the break
even limit for those customers (most likely immature without other equipment) will rise to
several hundred chargers (assuming salary for service staff >$50’000 in Europe).
When ABB launches the service concepts a true calculation should be done for each region in
the world by each local office with the correct labor costs and travel costs. Also an estimate of
the customers investment needs should be done. Based on this, a win-win case can be
constructed where the customer and ABB benefit from an ABB risk service contract below a
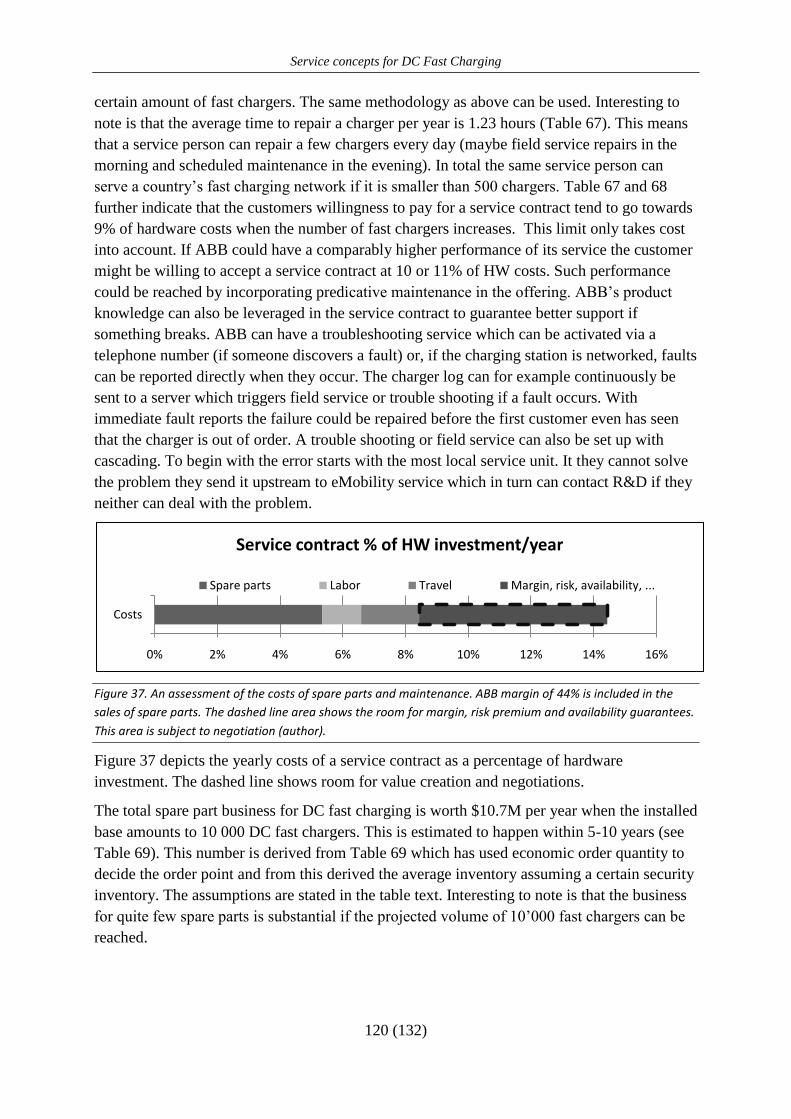
Service concepts for DC Fast Charging
120 (132)
certain amount of fast chargers. The same methodology as above can be used. Interesting to
note is that the average time to repair a charger per year is 1.23 hours (Table 67). This means
that a service person can repair a few chargers every day (maybe field service repairs in the
morning and scheduled maintenance in the evening). In total the same service person can
serve a country’s fast charging network if it is smaller than 500 chargers. Table 67 and 68
further indicate that the customers willingness to pay for a service contract tend to go towards
9% of hardware costs when the number of fast chargers increases. This limit only takes cost
into account. If ABB could have a comparably higher performance of its service the customer
might be willing to accept a service contract at 10 or 11% of HW costs. Such performance
could be reached by incorporating predicative maintenance in the offering. ABB’s product
knowledge can also be leveraged in the service contract to guarantee better support if
something breaks. ABB can have a troubleshooting service which can be activated via a
telephone number (if someone discovers a fault) or, if the charging station is networked, faults
can be reported directly when they occur. The charger log can for example continuously be
sent to a server which triggers field service or trouble shooting if a fault occurs. With
immediate fault reports the failure could be repaired before the first customer even has seen
that the charger is out of order. A trouble shooting or field service can also be set up with
cascading. To begin with the error starts with the most local service unit. It they cannot solve
the problem they send it upstream to eMobility service which in turn can contact R&D if they
neither can deal with the problem.
Figure 37. An assessment of the costs of spare parts and maintenance. ABB margin of 44% is included in the
sales of spare parts. The dashed line area shows the room for margin, risk premium and availability guarantees.
This area is subject to negotiation (author).
Figure 37 depicts the yearly costs of a service contract as a percentage of hardware
investment. The dashed line shows room for value creation and negotiations.
The total spare part business for DC fast charging is worth $10.7M per year when the installed
base amounts to 10 000 DC fast chargers. This is estimated to happen within 5-10 years (see
Table 69). This number is derived from Table 69 which has used economic order quantity to
decide the order point and from this derived the average inventory assuming a certain security
inventory. The assumptions are stated in the table text. Interesting to note is that the business
for quite few spare parts is substantial if the projected volume of 10’000 fast chargers can be
reached.
0% 2% 4% 6% 8% 10% 12% 14% 16%
Costs
Service contract % of HW investment/year
Spare parts Labor Travel Margin, risk, availability, ...
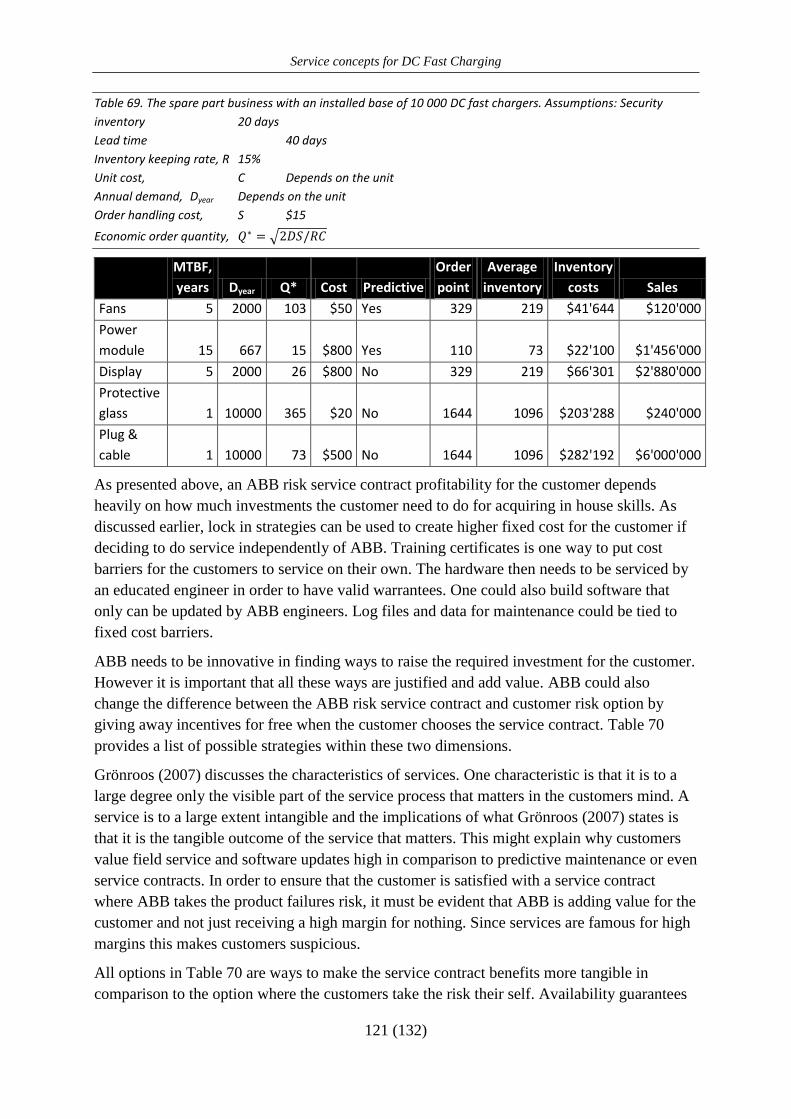
Service concepts for DC Fast Charging
121 (132)
Table 69. The spare part business with an installed base of 10 000 DC fast chargers. Assumptions: Security
inventory 20 days
Lead time 40 days
Inventory keeping rate, R 15%
Unit cost, C Depends on the unit
Annual demand, Dyear Depends on the unit
Order handling cost, S $15
Economic order quantity,
MTBF,
years Dyear Q* Cost Predictive
Order
point
Average
inventory
Inventory
costs Sales
Fans 5 2000 103 $50 Yes 329 219 $41'644 $120'000
Power
module 15 667 15 $800 Yes 110 73 $22'100 $1'456'000
Display 5 2000 26 $800 No 329 219 $66'301 $2'880'000
Protective
glass 1 10000 365 $20 No 1644 1096 $203'288 $240'000
Plug &
cable 1 10000 73 $500 No 1644 1096 $282'192 $6'000'000
As presented above, an ABB risk service contract profitability for the customer depends
heavily on how much investments the customer need to do for acquiring in house skills. As
discussed earlier, lock in strategies can be used to create higher fixed cost for the customer if
deciding to do service independently of ABB. Training certificates is one way to put cost
barriers for the customers to service on their own. The hardware then needs to be serviced by
an educated engineer in order to have valid warrantees. One could also build software that
only can be updated by ABB engineers. Log files and data for maintenance could be tied to
fixed cost barriers.
ABB needs to be innovative in finding ways to raise the required investment for the customer.
However it is important that all these ways are justified and add value. ABB could also
change the difference between the ABB risk service contract and customer risk option by
giving away incentives for free when the customer chooses the service contract. Table 70
provides a list of possible strategies within these two dimensions.
Grönroos (2007) discusses the characteristics of services. One characteristic is that it is to a
large degree only the visible part of the service process that matters in the customers mind. A
service is to a large extent intangible and the implications of what Grönroos (2007) states is
that it is the tangible outcome of the service that matters. This might explain why customers
value field service and software updates high in comparison to predictive maintenance or even
service contracts. In order to ensure that the customer is satisfied with a service contract
where ABB takes the product failures risk, it must be evident that ABB is adding value for the
customer and not just receiving a high margin for nothing. Since services are famous for high
margins this makes customers suspicious.
All options in Table 70 are ways to make the service contract benefits more tangible in
comparison to the option where the customers take the risk their self. Availability guarantees
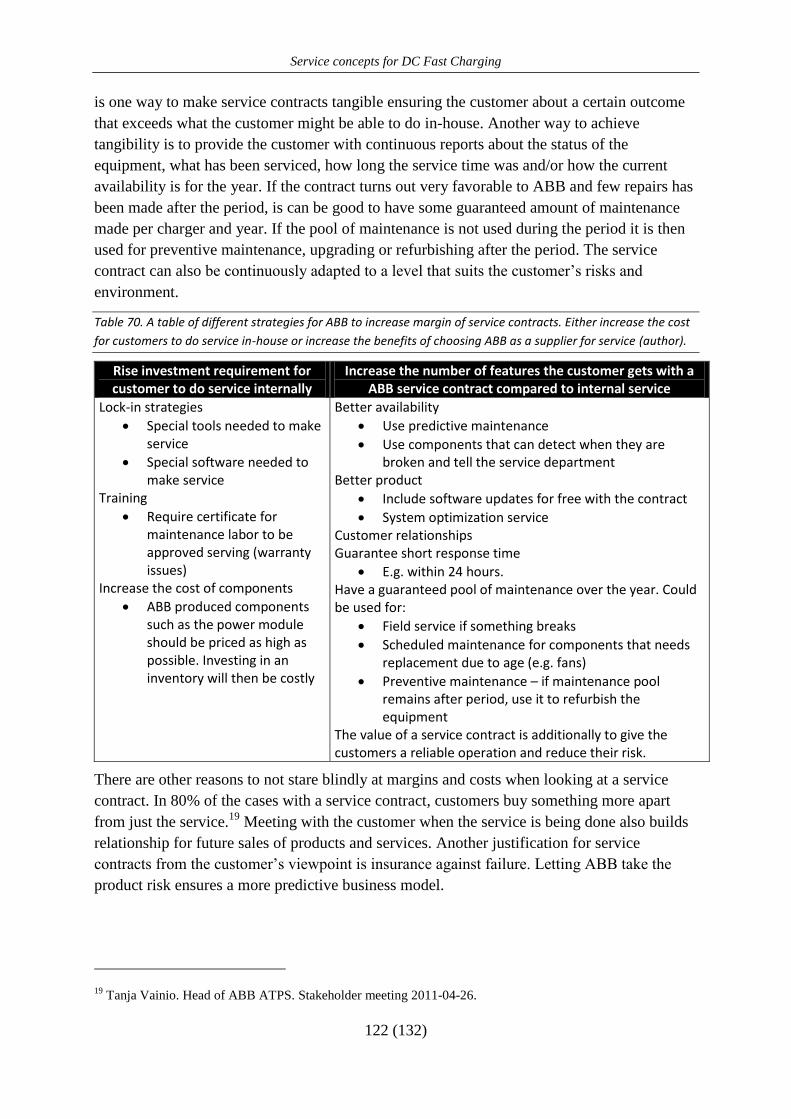
Service concepts for DC Fast Charging
122 (132)
is one way to make service contracts tangible ensuring the customer about a certain outcome
that exceeds what the customer might be able to do in-house. Another way to achieve
tangibility is to provide the customer with continuous reports about the status of the
equipment, what has been serviced, how long the service time was and/or how the current
availability is for the year. If the contract turns out very favorable to ABB and few repairs has
been made after the period, is can be good to have some guaranteed amount of maintenance
made per charger and year. If the pool of maintenance is not used during the period it is then
used for preventive maintenance, upgrading or refurbishing after the period. The service
contract can also be continuously adapted to a level that suits the customer’s risks and
environment.
Table 70. A table of different strategies for ABB to increase margin of service contracts. Either increase the cost
for customers to do service in-house or increase the benefits of choosing ABB as a supplier for service (author).
Rise investment requirement for customer to do service internally
Increase the number of features the customer gets with a ABB service contract compared to internal service
Lock-in strategies
Special tools needed to make service
Special software needed to make service
Training
Require certificate for maintenance labor to be approved serving (warranty issues)
Increase the cost of components
ABB produced components such as the power module should be priced as high as possible. Investing in an inventory will then be costly
Better availability
Use predictive maintenance
Use components that can detect when they are broken and tell the service department
Better product
Include software updates for free with the contract
System optimization service Customer relationships Guarantee short response time
E.g. within 24 hours. Have a guaranteed pool of maintenance over the year. Could be used for:
Field service if something breaks
Scheduled maintenance for components that needs replacement due to age (e.g. fans)
Preventive maintenance – if maintenance pool remains after period, use it to refurbish the equipment
The value of a service contract is additionally to give the customers a reliable operation and reduce their risk.
There are other reasons to not stare blindly at margins and costs when looking at a service
contract. In 80% of the cases with a service contract, customers buy something more apart
from just the service.19
Meeting with the customer when the service is being done also builds
relationship for future sales of products and services. Another justification for service
contracts from the customer’s viewpoint is insurance against failure. Letting ABB take the
product risk ensures a more predictive business model.
19 Tanja Vainio. Head of ABB ATPS. Stakeholder meeting 2011-04-26.
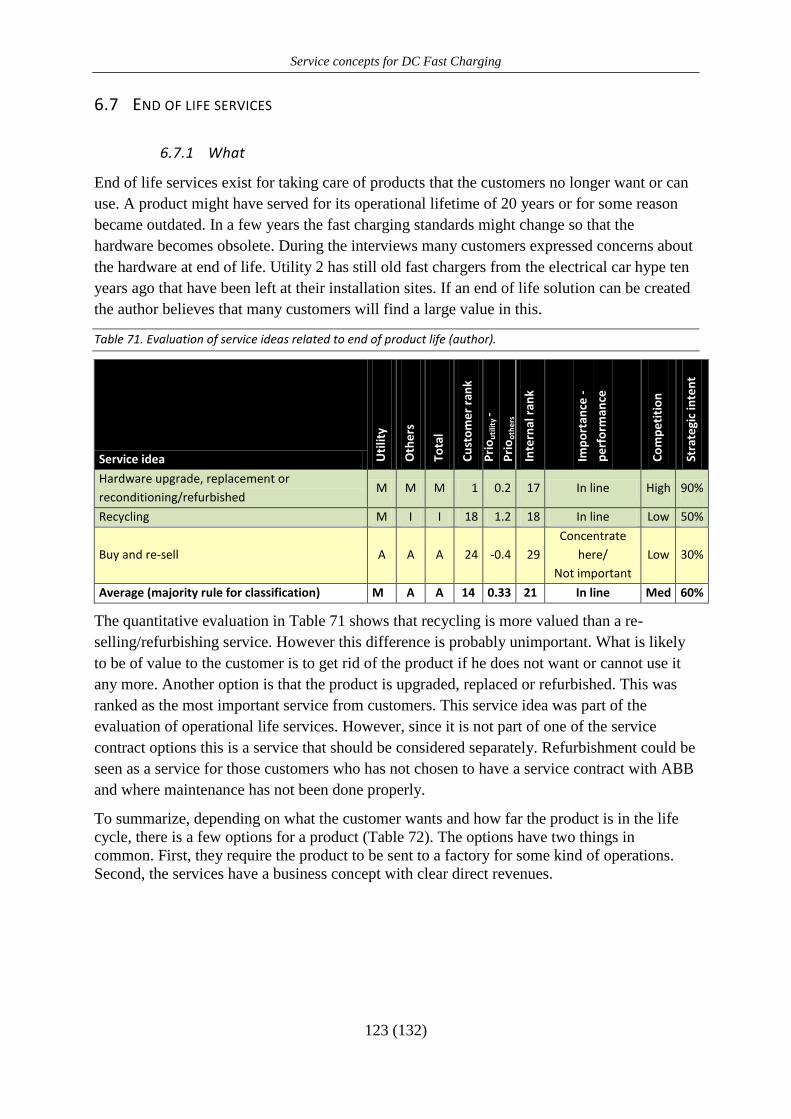
Service concepts for DC Fast Charging
123 (132)
6.7 END OF LIFE SERVICES
6.7.1 What
End of life services exist for taking care of products that the customers no longer want or can
use. A product might have served for its operational lifetime of 20 years or for some reason
became outdated. In a few years the fast charging standards might change so that the
hardware becomes obsolete. During the interviews many customers expressed concerns about
the hardware at end of life. Utility 2 has still old fast chargers from the electrical car hype ten
years ago that have been left at their installation sites. If an end of life solution can be created
the author believes that many customers will find a large value in this.
Table 71. Evaluation of service ideas related to end of product life (author).
Service idea Uti
lity
Oth
ers
Tota
l
Cu
sto
me
r ra
nk
Pri
ou
tilit
y -
Pri
oo
the
rs
Inte
rnal
ran
k
Imp
ort
ance
-
pe
rfo
rman
ce
Co
mp
eti
tio
n
Stra
tegi
c in
ten
t
Hardware upgrade, replacement or
reconditioning/refurbished M M M 1 0.2 17 In line High 90%
Recycling M I I 18 1.2 18 In line Low 50%
Buy and re-sell A A A 24 -0.4 29
Concentrate
here/
Not important
Low 30%
Average (majority rule for classification) M A A 14 0.33 21 In line Med 60%
The quantitative evaluation in Table 71 shows that recycling is more valued than a re-
selling/refurbishing service. However this difference is probably unimportant. What is likely
to be of value to the customer is to get rid of the product if he does not want or cannot use it
any more. Another option is that the product is upgraded, replaced or refurbished. This was
ranked as the most important service from customers. This service idea was part of the
evaluation of operational life services. However, since it is not part of one of the service
contract options this is a service that should be considered separately. Refurbishment could be
seen as a service for those customers who has not chosen to have a service contract with ABB
and where maintenance has not been done properly.
To summarize, depending on what the customer wants and how far the product is in the life
cycle, there is a few options for a product (Table 72). The options have two things in
common. First, they require the product to be sent to a factory for some kind of operations.
Second, the services have a business concept with clear direct revenues.
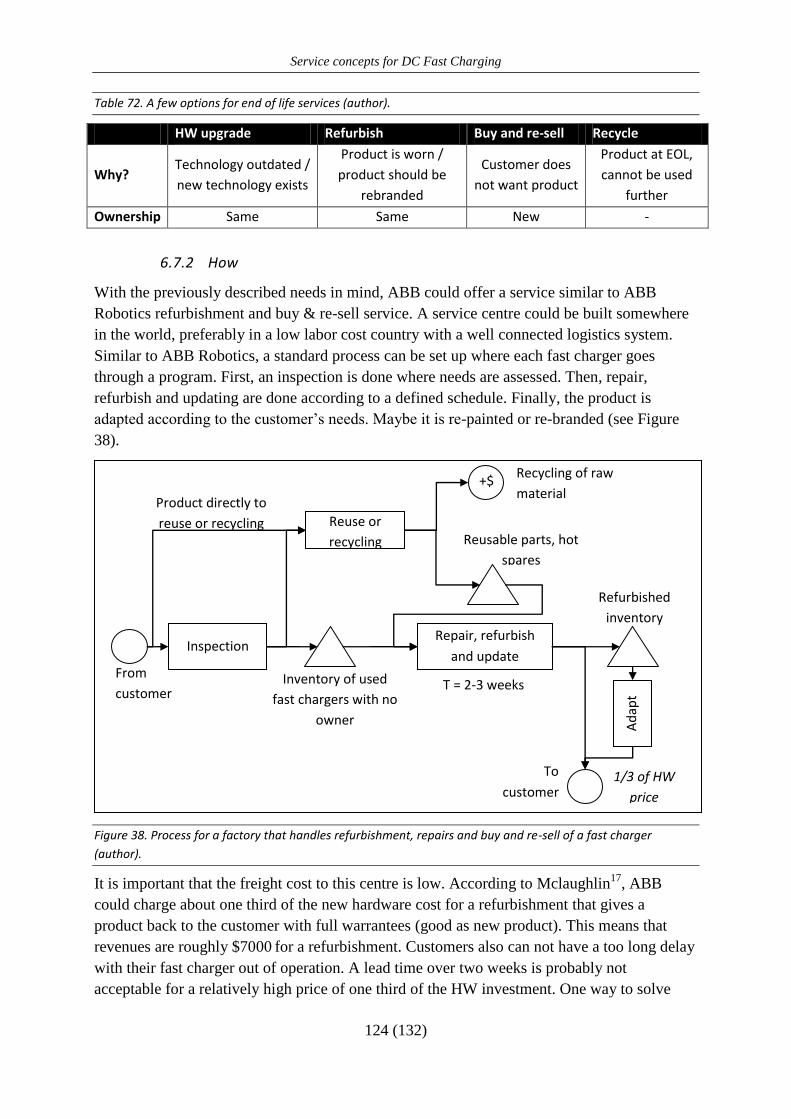
Service concepts for DC Fast Charging
124 (132)
Table 72. A few options for end of life services (author).
HW upgrade Refurbish Buy and re-sell Recycle
Why? Technology outdated /
new technology exists
Product is worn /
product should be
rebranded
Customer does
not want product
Product at EOL,
cannot be used
further
Ownership Same Same New -
6.7.2 How
With the previously described needs in mind, ABB could offer a service similar to ABB
Robotics refurbishment and buy & re-sell service. A service centre could be built somewhere
in the world, preferably in a low labor cost country with a well connected logistics system.
Similar to ABB Robotics, a standard process can be set up where each fast charger goes
through a program. First, an inspection is done where needs are assessed. Then, repair,
refurbish and updating are done according to a defined schedule. Finally, the product is
adapted according to the customer’s needs. Maybe it is re-painted or re-branded (see Figure
38).
Figure 38. Process for a factory that handles refurbishment, repairs and buy and re-sell of a fast charger
(author).
It is important that the freight cost to this centre is low. According to Mclaughlin17
, ABB
could charge about one third of the new hardware cost for a refurbishment that gives a
product back to the customer with full warrantees (good as new product). This means that
revenues are roughly $7000 for a refurbishment. Customers also can not have a too long delay
with their fast charger out of operation. A lead time over two weeks is probably not
acceptable for a relatively high price of one third of the HW investment. One way to solve
Inspection Repair, refurbish
and update
Inventory of used
fast chargers with no
owner
Reusable parts, hot
spares
Reuse or
recycling
To
customer
Refurbished
inventory A
dap
t
From
customer T = 2-3 weeks
Recycling of raw
material
1/3 of HW
price
+$
Product directly to
reuse or recycling

Service concepts for DC Fast Charging
125 (132)
this is to use so called “hot spares”. This means that key components that need maintenance
and refurbishment are changed on site to new or previously refurbished components
(premium or standard refurbishment). The old components are brought back to the
refurbishment factory to be cleaned, maintained and potentially upgraded. After the
refurbishment, the same warrantee as for new products is given. Since the customer roughly
pays one third of the initial HW price (depending on type of refurbishment) a warrantee is a
necessary incentive. Keeping the product on site for refurbishing has the benefit that a long
lead time is allowed for refurbishment of the components. Another benefit is that
transportation costs of the components (or assemblies) that need refurbishment are lower than
sending the whole unit. Mclaughlin17
has never experienced that a customers have complained
to not get their particular components back after refurbishment. The customer is only
concerned about that the product works and trusts ABB that the hot spare part is as good as
the old spare part that was exchanged. ABB also guarantees this by giving a warrantee which
is a good receipt for building trust.
To buy a customer’s charger and resell it could most likely be priced higher than doing a
refurbishment for a customer. This is since the new customer buying the second hand charger
will receive a whole new unit.
Recycling can also be included in this process. Components that are fresh can be taken care of
and used for repairs of other products. In ABB Robotics, the customer can chose between
using new or used original parts when repairing and this can be done also for the fast charger.
Parts that are not possible to refurbish should be recycled. The parts to recycle are sent to a
junkyard customer who is willing to pay the highest price.
By 2020, the chargers sold today might start to create a demand for refurbishing and gradually
also for recycling. ABB have, time to prepare for the business by building operations. Already
today, it is worth thinking about designing for recycling. Design for recycling is defined as
constructing the product with two goals in mind; do not use hazardous or toxic materials in
the design and discourage non-recyclable materials or production techniques that make a
product non recyclable (Institute of Scrap Recycling Industries, 2005).
There are certain regulations that have to be followed by electronic equipment for consumers.
RoHS (Restriction of Hazardous Substances Directive) and WEEE (Waste Electrical and
Electronic Equipment Directive) have become EU law. RoHS limits the use of certain
materials, such as led, mercury and cadmium. Either the materials are prohibited or they are
allowed to a percentage of the total product weight. The WEEE directive dictates that
manufacturers are mandated to take care of their products and recycle them when they have
reached end of life. Only certain categories of companies have to consider the directive today
(WEEE Register Society n.d.). Industrial equipment is so far not under the law until 2020 but
due to lobbying this date might be put earlier.17
All ABB’s products that are being developed
today supports these directives including the DC fast charger Hermes 2.17
By the time when
recycling will be done of the fast chargers, it is very likely that ABB will be obliged to take
care of it.17
Today, most electronic manufacturers (that are under the RoHS and WEEE
already) have free programs for returning/recycling their old products17
. Apple and Dell are
two examples of this. This can be set up as well by ABB and used in marketing. Since the
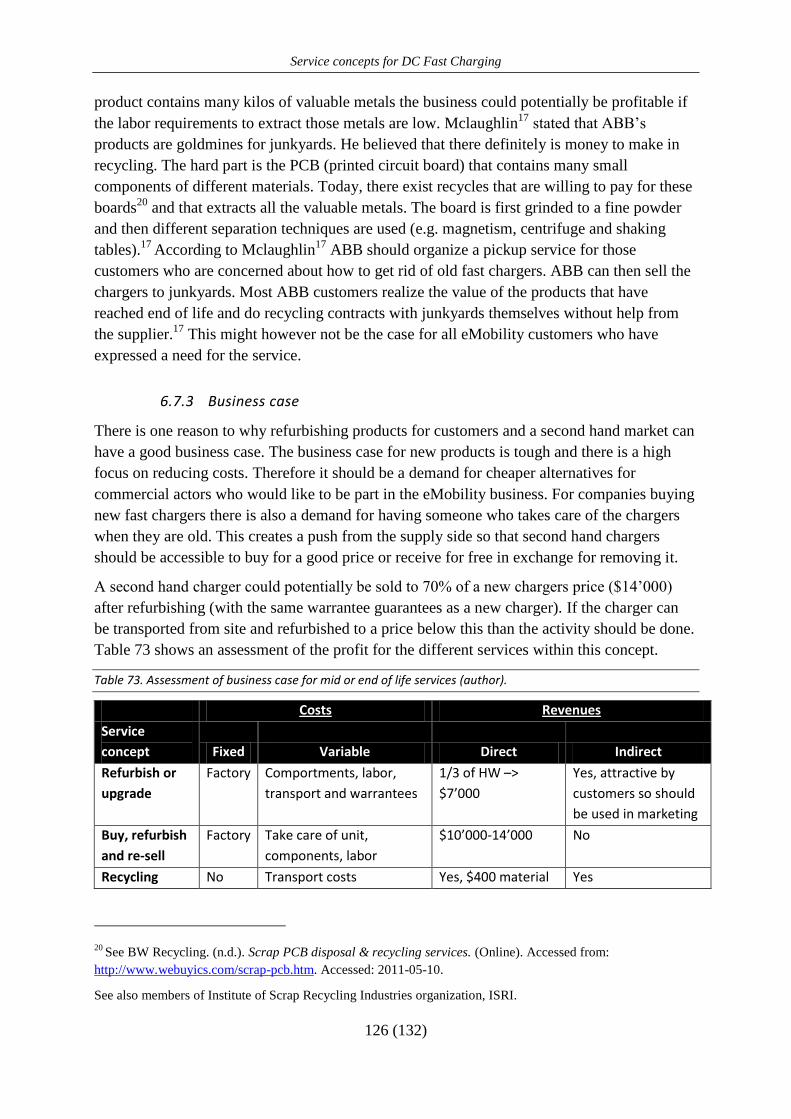
Service concepts for DC Fast Charging
126 (132)
product contains many kilos of valuable metals the business could potentially be profitable if
the labor requirements to extract those metals are low. Mclaughlin17
stated that ABB’s
products are goldmines for junkyards. He believed that there definitely is money to make in
recycling. The hard part is the PCB (printed circuit board) that contains many small
components of different materials. Today, there exist recycles that are willing to pay for these
boards20
and that extracts all the valuable metals. The board is first grinded to a fine powder
and then different separation techniques are used (e.g. magnetism, centrifuge and shaking
tables).17
According to Mclaughlin17
ABB should organize a pickup service for those
customers who are concerned about how to get rid of old fast chargers. ABB can then sell the
chargers to junkyards. Most ABB customers realize the value of the products that have
reached end of life and do recycling contracts with junkyards themselves without help from
the supplier.17
This might however not be the case for all eMobility customers who have
expressed a need for the service.
6.7.3 Business case
There is one reason to why refurbishing products for customers and a second hand market can
have a good business case. The business case for new products is tough and there is a high
focus on reducing costs. Therefore it should be a demand for cheaper alternatives for
commercial actors who would like to be part in the eMobility business. For companies buying
new fast chargers there is also a demand for having someone who takes care of the chargers
when they are old. This creates a push from the supply side so that second hand chargers
should be accessible to buy for a good price or receive for free in exchange for removing it.
A second hand charger could potentially be sold to 70% of a new chargers price ($14’000)
after refurbishing (with the same warrantee guarantees as a new charger). If the charger can
be transported from site and refurbished to a price below this than the activity should be done.
Table 73 shows an assessment of the profit for the different services within this concept.
Table 73. Assessment of business case for mid or end of life services (author).
Costs Revenues
Service
concept Fixed Variable Direct Indirect
Refurbish or
upgrade
Factory Comportments, labor,
transport and warrantees
1/3 of HW –>
$7’000
Yes, attractive by
customers so should
be used in marketing
Buy, refurbish
and re-sell
Factory Take care of unit,
components, labor
$10’000-14’000 No
Recycling No Transport costs Yes, $400 material Yes
20 See BW Recycling. (n.d.). Scrap PCB disposal & recycling services. (Online). Accessed from:
http://www.webuyics.com/scrap-pcb.htm. Accessed: 2011-05-10.
See also members of Institute of Scrap Recycling Industries organization, ISRI.

Service concepts for DC Fast Charging
127 (132)
Refurbishing and upgrading chargers is also an activity that should have a good business case.
To have the activity will for sure generate indirect revenues. It is also reasonable that direct
revenues can be taken since there is a clear value that the customer is paying for. Since it is
only ABB that has the full knowledge of manufacturing and servicing the product, there is a
big competitive advantage in doing refurbishing/upgrades. Hence the margin should be high
for this activity.

Service concepts for DC Fast Charging
128 (132)
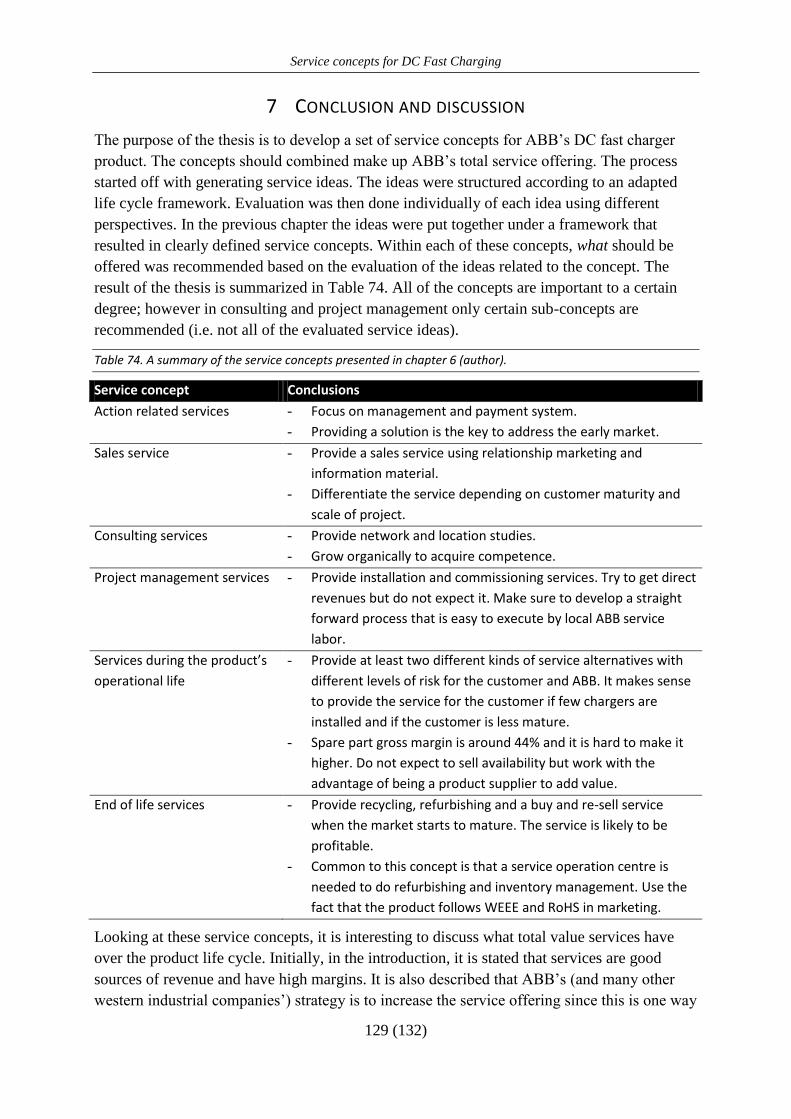
Service concepts for DC Fast Charging
129 (132)
7 CONCLUSION AND DISCUSSION
The purpose of the thesis is to develop a set of service concepts for ABB’s DC fast charger
product. The concepts should combined make up ABB’s total service offering. The process
started off with generating service ideas. The ideas were structured according to an adapted
life cycle framework. Evaluation was then done individually of each idea using different
perspectives. In the previous chapter the ideas were put together under a framework that
resulted in clearly defined service concepts. Within each of these concepts, what should be
offered was recommended based on the evaluation of the ideas related to the concept. The
result of the thesis is summarized in Table 74. All of the concepts are important to a certain
degree; however in consulting and project management only certain sub-concepts are
recommended (i.e. not all of the evaluated service ideas).
Table 74. A summary of the service concepts presented in chapter 6 (author).
Service concept Conclusions
Action related services - Focus on management and payment system.
- Providing a solution is the key to address the early market.
Sales service - Provide a sales service using relationship marketing and
information material.
- Differentiate the service depending on customer maturity and
scale of project.
Consulting services - Provide network and location studies.
- Grow organically to acquire competence.
Project management services - Provide installation and commissioning services. Try to get direct
revenues but do not expect it. Make sure to develop a straight
forward process that is easy to execute by local ABB service
labor.
Services during the product’s
operational life
- Provide at least two different kinds of service alternatives with
different levels of risk for the customer and ABB. It makes sense
to provide the service for the customer if few chargers are
installed and if the customer is less mature.
- Spare part gross margin is around 44% and it is hard to make it
higher. Do not expect to sell availability but work with the
advantage of being a product supplier to add value.
End of life services - Provide recycling, refurbishing and a buy and re-sell service
when the market starts to mature. The service is likely to be
profitable.
- Common to this concept is that a service operation centre is
needed to do refurbishing and inventory management. Use the
fact that the product follows WEEE and RoHS in marketing.
Looking at these service concepts, it is interesting to discuss what total value services have
over the product life cycle. Initially, in the introduction, it is stated that services are good
sources of revenue and have high margins. It is also described that ABB’s (and many other
western industrial companies’) strategy is to increase the service offering since this is one way
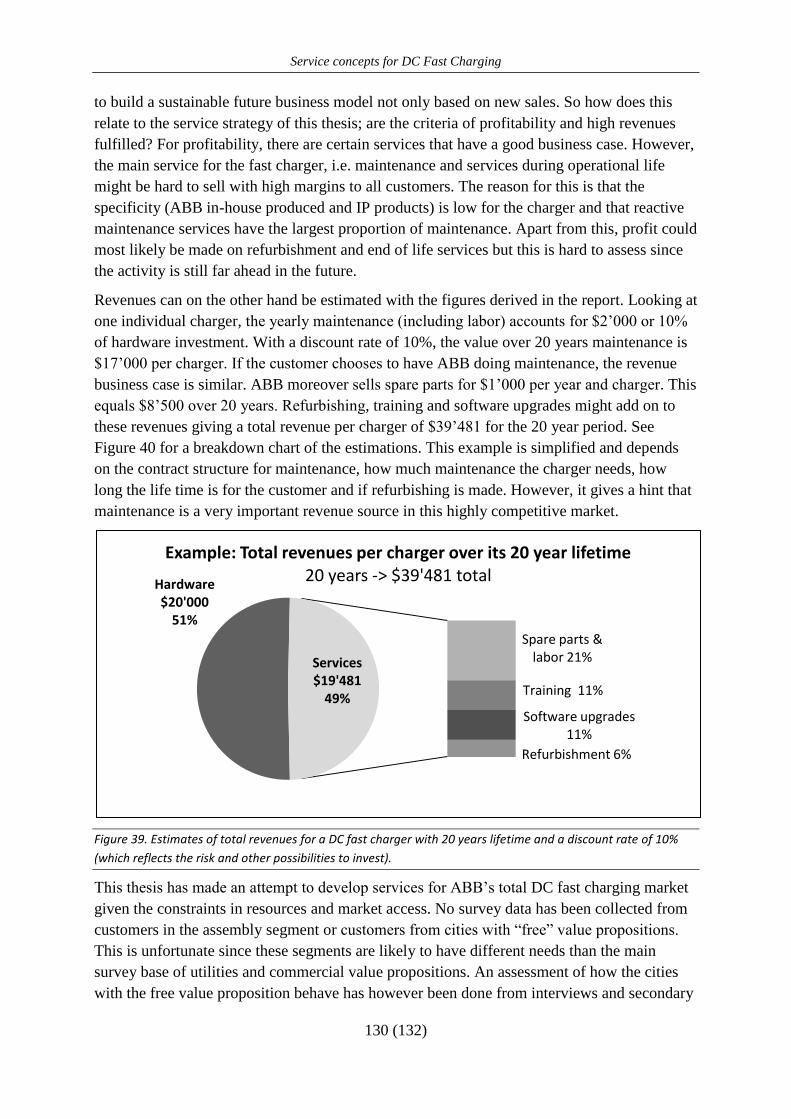
Service concepts for DC Fast Charging
130 (132)
to build a sustainable future business model not only based on new sales. So how does this
relate to the service strategy of this thesis; are the criteria of profitability and high revenues
fulfilled? For profitability, there are certain services that have a good business case. However,
the main service for the fast charger, i.e. maintenance and services during operational life
might be hard to sell with high margins to all customers. The reason for this is that the
specificity (ABB in-house produced and IP products) is low for the charger and that reactive
maintenance services have the largest proportion of maintenance. Apart from this, profit could
most likely be made on refurbishment and end of life services but this is hard to assess since
the activity is still far ahead in the future.
Revenues can on the other hand be estimated with the figures derived in the report. Looking at
one individual charger, the yearly maintenance (including labor) accounts for $2’000 or 10%
of hardware investment. With a discount rate of 10%, the value over 20 years maintenance is
$17’000 per charger. If the customer chooses to have ABB doing maintenance, the revenue
business case is similar. ABB moreover sells spare parts for $1’000 per year and charger. This
equals $8’500 over 20 years. Refurbishing, training and software upgrades might add on to
these revenues giving a total revenue per charger of $39’481 for the 20 year period. See
Figure 40 for a breakdown chart of the estimations. This example is simplified and depends
on the contract structure for maintenance, how much maintenance the charger needs, how
long the life time is for the customer and if refurbishing is made. However, it gives a hint that
maintenance is a very important revenue source in this highly competitive market.
Figure 39. Estimates of total revenues for a DC fast charger with 20 years lifetime and a discount rate of 10%
(which reflects the risk and other possibilities to invest).
This thesis has made an attempt to develop services for ABB’s total DC fast charging market
given the constraints in resources and market access. No survey data has been collected from
customers in the assembly segment or customers from cities with “free” value propositions.
This is unfortunate since these segments are likely to have different needs than the main
survey base of utilities and commercial value propositions. An assessment of how the cities
with the free value proposition behave has however been done from interviews and secondary
Hardware$20'000
51%
Spare parts & labor 21%
Training 11%
Software upgrades11%
Refurbishment 6%
Services$19'481
49%
Example: Total revenues per charger over its 20 year lifetime20 years -> $39'481 total
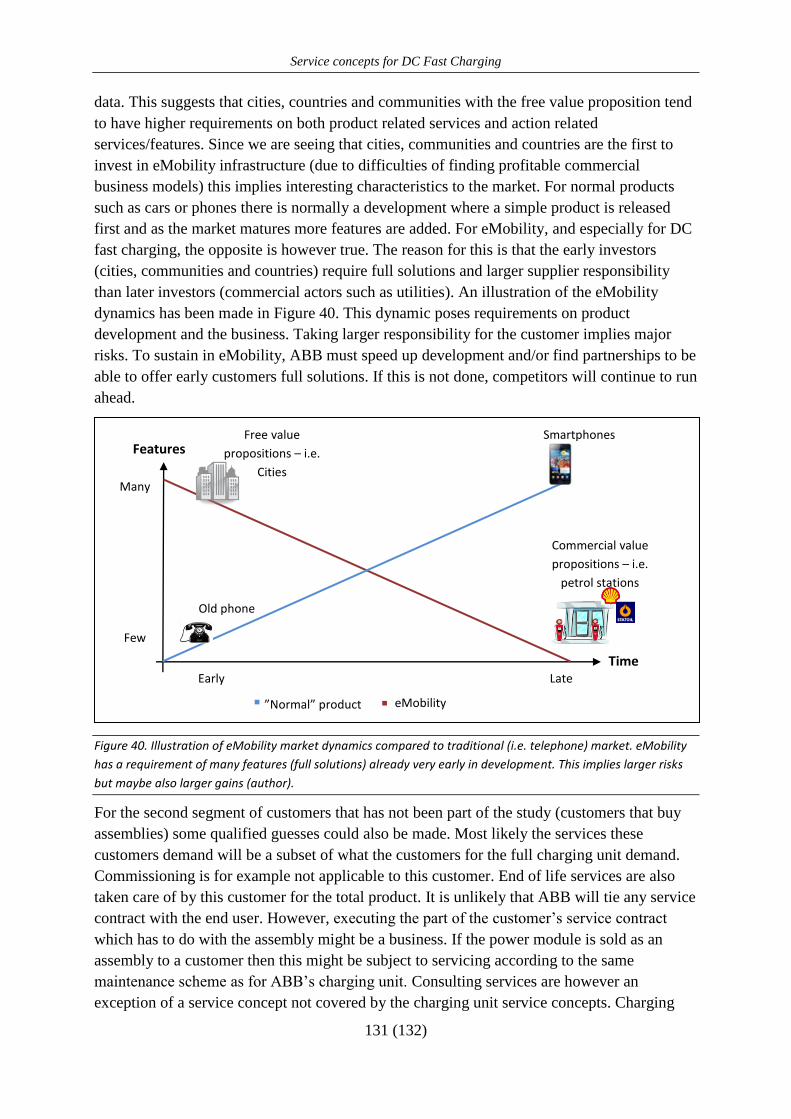
Service concepts for DC Fast Charging
131 (132)
data. This suggests that cities, countries and communities with the free value proposition tend
to have higher requirements on both product related services and action related
services/features. Since we are seeing that cities, communities and countries are the first to
invest in eMobility infrastructure (due to difficulties of finding profitable commercial
business models) this implies interesting characteristics to the market. For normal products
such as cars or phones there is normally a development where a simple product is released
first and as the market matures more features are added. For eMobility, and especially for DC
fast charging, the opposite is however true. The reason for this is that the early investors
(cities, communities and countries) require full solutions and larger supplier responsibility
than later investors (commercial actors such as utilities). An illustration of the eMobility
dynamics has been made in Figure 40. This dynamic poses requirements on product
development and the business. Taking larger responsibility for the customer implies major
risks. To sustain in eMobility, ABB must speed up development and/or find partnerships to be
able to offer early customers full solutions. If this is not done, competitors will continue to run
ahead.
Figure 40. Illustration of eMobility market dynamics compared to traditional (i.e. telephone) market. eMobility
has a requirement of many features (full solutions) already very early in development. This implies larger risks
but maybe also larger gains (author).
For the second segment of customers that has not been part of the study (customers that buy
assemblies) some qualified guesses could also be made. Most likely the services these
customers demand will be a subset of what the customers for the full charging unit demand.
Commissioning is for example not applicable to this customer. End of life services are also
taken care of by this customer for the total product. It is unlikely that ABB will tie any service
contract with the end user. However, executing the part of the customer’s service contract
which has to do with the assembly might be a business. If the power module is sold as an
assembly to a customer then this might be subject to servicing according to the same
maintenance scheme as for ABB’s charging unit. Consulting services are however an
exception of a service concept not covered by the charging unit service concepts. Charging
Commercial value
propositions – i.e.
petrol stations
Free value
propositions – i.e.
Cities
Smartphones
Old phone
Time Early Late
Features
Few
Many
eMobility ”Normal” product
Service concepts for DC Fast Charging
132 (132)
assembly customers might be interested in a consulting service for how to design the entire
unit in an efficient way.
In total, the author believes that the study took a good approach to service development in this
project. Cooperation with customers has been done closely by listening to their plans and
subsequent product requirements for eMobility. Although many of the interviewed customers
to this day have not bought fast chargers and see this in a ten year perspective, their input is
still valuable for development. Many of the customers were commercial actors with the key
concern of finding profitable business models that could be a foundation for investments in
DC fast chargers. Finding profitable business models relies heavily on how fast and when
customers start to adopt electrical vehicle technology. As written in the introduction, it is no
doubt that the transition will come and that fast charging has a role to play in the future
infrastructure for eMobility.
This report gives a valuable contribution to research in the service area for eMobility
infrastructure to date. As far as the author knows, no study has been made in this area before.
The studies of product development are also mostly focused on market projections. The
market is however constantly evolving. As discussed in the theory chapter customer
perceptions develop over time. Attributes that are indifferent to customers tend to get
attractive when they are profitable. Attractive attributes turn into must be attributes that the
customer cannot be without. One example of such a development that might be expected is
for remote monitoring and controlling tied to unit servicing. Many of Other segment found
this a potential overkill if they bought a fast charger today. In ten years however this might be
required in order for the customers (or suppliers) maintenance organization to work
efficiently.
Future research in this field and ABB could benefit from longitudinally studying how the
market develops its requirements. It would also be interesting to look at a broader sample in
other regions of the world. Suppliers of fast chargers should make sure to use their customers
as a resource in service and product development. Send them surveys, let them be involved
and show them that their requests get priority and help to create great products and services.
At a higher level of aggregation, this study has shown how service development can be done
in a systematical way. Mixing qualitative and quantitative research is a good way to get rich
information, both broad and in-depth, that can be used to make informed decisions.
Introducing new services involves high risks since they normally involve employing staff.
Making sure that the services introduced have a valid market is therefore of high value. The
next step in the service development process for ABB is to construct process maps for how to
execute the suggested services in detail.
Service concepts for DC Fast Charging
i
REFERENCES
350Green (n.d.). The Approach. (Online). Accessed from: http://350green.com/approach/.
Accessed 2011-03-15.
ABB. (2010a). Introducing ABB. ABB Group Presentation. (Internal power point presentation).
ABB. (2010b). BU Power Electronics and MV Drives. (internal power point presentation).
ABB. (2010c). Annual report 2009. (Online). Accessed from:
http://search.abb.com/library/Download.aspx?DocumentID=9AKK105152A3258&Langu
ageCode=en&DocumentPartId=&Action=Launch.
ABB. (2010d). ABB Robotics Service RRC – Parts Repair & Robot Reconditioning. (online).
Accessed from:
http://www05.abb.com/global/scot/scot241.nsf/veritydisplay/891070cdec771c23c12577ce
002bccea/$file/abb%20%20certified%20robot%20reconditioning%20and%20parts%20re
pair%20center%20october%202010%20customers%20version.pdf. Accessed 2011-05-09.
ABB. (2011a). About ABB. (online) Accessed from:
http://www.abb.com/cawp/abbzh250/465edb9c3107c700c1256bb9004a4796.aspx.
Accessed 2011-01-18.
ABB. (2011b). ABB Drive care. (online). Accessed from:
http://www.abb.se/product/ap/seitp322/A90BA15299AF8458C1257744002F5C6C.aspx?.
Accessed: 2011-03-22.
ABB. (2011c). ABB enters US market for electric vehicle infrastructure with ECOtality stake.
Accessed from:
http://www.abb.com/cawp/seitp202/aae0a3860be2e578c12578140035faf8.aspx. Accessed
2011-04-28.
ABB. (2011d). ABB certified robot refurbishment – used robot offer. (online). Accessed from:
http://www05.abb.com/global/scot/scot241.nsf/veritydisplay/2d2943d032180694c125768
6002ddf5e/$file/rob0144en_a%20hr.pdf. Accessed 2011-05-05.
Aker Wade (2009). Aker Wade and EV Fast Charging. (online). Accessed from
http://www.slideshare.net/bretaker/aker-wade-and-ev-fast-charging. Accessed 2011-03-24
Aker Wade. (n.d.). Our company. (online) Accessed from:
http://www.akerwade.com/v.php?pg=8. Accessed 2011-03-24.
Alam, I. (2006). Process of Customer Interaction in new Service Development. IN Edvardsson,
B., Gustafsson, A., Kristensson, P., Magnusson, P. & Matthing, J. (2006). Involving
Customers in new Service Development. Karlstad University, Imperial Collage Press:
Karlstad.
Anegawa, T. (2008-10-01). Development of the most suitable infrastructure for commuter electric
vehicles. TEPCO. Accessed from: http://www.iea.org/work/2008/transport/TEPCO.pdf
Accessed: 2011-03-15.
Aoki, H. (2010-11-05). DC Fast Charging Alternative Gas station convenience for EVs?
Combination of AC slow and DC fast. TEPCO. Accessed from:
http://climate.dialogue.org.hk/files/res/69/en_HiroyukiAoki.pdf. Accessed: 2011-03-15.
Service concepts for DC Fast Charging
ii
Bergman, B. Klefsjö, B. (2010) Quality from Customer Needs to Customer Satisfaction.
Studentlitteratur: Lund.
Bitman, W.R. & Sharif, N., (2008). A conceptual framework for ranking R&D projects. IEEE
Transactions on Engineering Management. 55(2). pp.267-278.
Browers, M. (1986). New Product Development in Service Industries. Ph.D. Dissertation, Texas
A & M University, Collage Station. IN Scheuing, E.E. & Johnson, E.M. (1989). A
proposed model for new service development. The Journal of Services Marketing. 3 (2).
pp.25-34.
Brown, M., Atherton, P. & Lawson, J. (2009). All Hail the Electric Car – But where will we plug
them in? Citigroup Global Markets. 23 September 2009.
Bureau of Transportation Statistics. (n.d.). Table 1-11: Number of U.S. Aircraft, Vehicles, Vessels,
and Other Conveyances. Accessed from:
http://www.bts.gov/publications/national_transportation_statistics/html/table_01_11.html.
Accessed: 2011-02-01.
California Air Resolutions Board. (2001-03-26). "Public hearing to consider proposed
amendments to the California zero emission vehicle regulations regarding treatment of
majority owned small or intermediate volume manufacturers and infrastructure
standardization". (Online). Accessed from:
http://www.arb.ca.gov/board/books/010628/01-5-1.pdf. Accessed 2011-03-14.
Chademo. (2011-03-11). Chademo – DC Fast Charge Standard. (Brochure supplied at Geneva
Motor show).
Chevrolet (2011). 2011 Volt. (online). Accessed from: http://www.chevrolet.com/volt/ Accessed
2011-01-31.
Cohen, L., Manion, L. & Morrison, K. (2007). Research Methods in Education. New York:
Routledge.
Darragh, B. (2010-08-29). Portugal Announces National EV Network for 2011 - Coastal Towns
and Highways Welcome Charging Stations. (online). Accessed from:
http://www.greenchipstocks.com/articles/portugal-announces-countrywide-ev-track-for-
2011/1149. Accessed 2011-01-28.
de Brentani, U. & Cooper, R.G. (1992), Developing successful new financial services for
businesses. Industrial Marketing Management. 21(3), pp. 231-42
DePiante-Henriksen, A. & Jensen-Traynor, A. (1999). A Practical R&D Project-Selection Scoring
tool. IEEE Transactions on Engineering Management. 46(2). pp.158-170
Dinger, A., Martin, R., Mosquet, X., Rabl, M., Rizoulis, D., Russo, M. & Sticher, G. (2010).
Batteries for Electrical Cars – Challenges, opportunities and the outlook to 2020. The
Boston Consulting Group. (online). Accessed from
http://www.bcg.com/documents/file36615.pdf Accessed: 2011-01-28.
Edvardsson, B. & Olsson, J. (1996). Key Concepts for New Service Development. The Service
Industries Journal, 16(2). pp.140-164.
Epyon. (n.d. a). Fast Charge Solutions. (online). Accessed form:
http://www.epyonpower.com/about/about.aspx. Accessed: 2011-03-24.
Epyon. (n.d. b). Service & Installation. (online). Accessed from:
http://www.epyonpower.com/Charginginfrastructure/Service_installation.aspx. Accessed:
Service concepts for DC Fast Charging
iii
2011-03-24.
Epyon. (n.d. c). Epyon Power Routing - Intelligent connected charging. (online). Accessed form
http://www.epyonpower.com/Producten_CI/Products-CI-TERRA-charging-stations.aspx.
(TERRA 50.X Base Station.pdf fact sheet marketing material). Accessed 2011-03-24.
Ericsson (2010). Annual Report 2009 – Smart thinking smart living. (online). Accessed from
http://www.ericsson.com/res/investors/docs/2009/ericssonar2009_en.pdf Accessed 2011-
01-27.
Ericsson (2011). Opportunities in Professional Services. (online). Assessed from:
http://www.ericsson.com/thecompany/investors/financial_reports/2009/annual09/market-
and-operations-market-trends-opportunities-in-professional-services.html. Assessed:
2011-01-26
European Automobile Manufacturers’ Association. (2010-02-09). Electric Vehicles: Turning buzz
into reality. (online). Accessed from:
http://www.acea.be/index.php/news/news_detail/electric_vehicles_turning_buzz_into_real
ity/ Accessed 2011-02-01.
Frost & Sullivan. (2009). Thought Leadership Report: Industrial Opportunities in the Electric
Vehicles Segment. M46B-10. September 2009
Garthwaite, J. (2009-03-06). How Will Better Place's Business Model Hold Up in the Downturn?
Gigaom.com. (online). Accessed from http://gigaom.com/cleantech/how-will-better-
places-business-model-hold-up-in-the-downturn/. Accessed 2011-02-01.
Gartner, J. & Wheelock, C. (2010). Electric Vehicle Charging Equipment: Charging Stations,
Grid Interconnection Issues, EV Charging Business Models, and Vehicle-to-Grid
Technology: Market Analysis and Forecasts. Pike Research. Quarter 2.
Gliner, J.A. & Morgan, G.A. (2000). Research methods in applied settings. Mahwah: Lawrence
Erlbaum Associates.
GP. (2011-03-14). Gasen i botten trots dyrare bensin. (online). Accessed from:
http://gp.se/motor/1.571671-gasen-i-botten-trots-dyrare-bensin. Accessed: 2011-03-14.
Griffin, A. and Hauser, J.R. (1993). The voice of the customer. Marketing Science. Winter 1993,
pp. 1-27.
Grönroos, C. (1987). Developing the Service Offering – A Source of Competitive Advantage. IN
Surprenant, C. (eds.). Add Value to Your Service. Chicago: American Marketing
Association.
Grönroos, C. (2007). Service Management and Marketing. John Wiley & Sons: Chichester.
Gummensson, E. (1987). Lip Service – A neglected area in services marketing. Journal of
Services Marketing. 1(1). pp.19-23.
Huiskonen, J. (2001). Maintenance spare parts logistics: Special characteristics and strategic
choices. International Journal of Production Economics. 71. pp.125-133.
Institute of Scrap Recycling Industries. (2005). Design for Recycling® : The Future Is Now.
(online). Accessed from:
http://www.isri.org/Content/NavigationMenu/Advocacy/DesignForRecycling/default.htm.
Accessed: 2011-05-09.
Jobin, P., Yamaguchi, J., Balter, G., Ceraso, C.J., Chan, A., Eggers, D., Ellinghorst, A., Flannery,
M., McNutley, J.P., Pearson, S. and Pitzer, J.W. (2009). Electric Vehicles. Credit Suisse
Service concepts for DC Fast Charging
iv
Equity Research. 1 October 2009.
Kumar, R. (2008). Research Methodology. SB Nangia APH Publishing Corporation: New Delhi.
Lager, T. (2005). The industrial usability of quality function deployment: a literature review and
synthesis on a meta-level, R&D Management, 35(4), pp. 409-426.
Leonard-Barton, D. (1992). Core capabilities and core rigidities: a paradox in managing new
product development. Strategic Management Journal. 13(1). pp.111-125.
Lewitt, T. (1980). Marketing Success through Differentiation – of Anything. Harvard Business
Review. February:1989, pp.83-91. (online). Access from:
https://www.commerce.uct.ac.za/Managementstudies/Courses/BUS2010S/2007/Nicole%2
0Frey/Readings/Journal%20Articles/Classics/Marketing%20success%20through%20diffe
rentiation%20-%20of%20anything.pdf. Accessed 2011-01-20.
Malhotra, Hall, Shaw, & Oppenheim. (2008). Essentials of Marketing Research: An Applied
Orientation. Australia: Pearson Prentice Hall.
Martilla, J.A. & James, J.C. (1977). Importance-Performance Analysis. Journal of Marketing.
41(1). pp.77-79.
Martin, C.R. & Horne, D. (1993). Services Innovation: Successful versus Unsuccessful Firms.
International Journal of Service Industry Management. 4(1). pp.49-65.
Mathieu, v. (2001). Product Services: From a Service Supporting the Product to a Service
Supporting the Client. Journal of Business and Industrial Marketing. 12(5). pp. 39-58.
Matzler, K. &Hinterhuber, H. (1998). How to make product development projects more
successful by integrating Kano’s model of customer satisfaction into quality function
deployment. Technovation. 18(1). pp. 25–38
Matzler, K., Hinterhuber, H., Bailom, F., and Sauerwein, E. (1996). How to delight your
customers, Journal of Product and Brand Management, 5:2, pp 6-18
Meyer-Goldstein, S., Johnston, R., Duffy, J.A. & Rao, J. (2002). The service concept: the missing
link in service design research? Journal of Operations Management. 20 (2002). pp.121–
134
Mobi.e. – Partners (n.d.). Portugal has chosen its path. (online). Accessed form
http://www.mobie.pt/en/parceiros. Accessed 2011-03-21.
Nilsson-Witell, L. & Fundin, A. (2005). Dynamics of service attributes: a test of Kano's theory of
attractive quality. International Journal of Service Industry Management, 16(2), pp.152 -
168
Nissan USA. (n.d.). Answers: Charging. (online). Accessed from: http://www.nissanusa.com/leaf-
electric-car/faq/list/charging#/leaf-electric-car/faq/list/charging. Accessed: 2011-02-01.
Nutek. (2008). De Nya Affärsinnovationerna, B 2008:1. ISBN: 987-91-7318-400-7.
OICA. (n.d.). Production Statistics. (online). Accessed from http://oica.net/category/production-
statistics. Accessed 2011-02-01.
Olivia, R. & Kallenberg, R. (2003). Managing the transition from products to services.
International Journal of Service and Industry Management. 14(2). pp. 160-172.
Osterwalder, A. (2010). Business Model Generation. New Jersey: John Wiley & Sons.
Prahalad, C.K. (1993). The Role of Core Competencies in the Corporation. Research Technology
Management. 36(6). pp.40-47.
Service concepts for DC Fast Charging
v
Raharjo, H. (2010). How should I construct the House of Quality? - A step-by-step guide.
Handout Chalmers University of Technology in course TEK150 – Design for Quality (Q4
2010). Göteborg: Chalmers University of Technology.
Raharjo, H., Bormbacher, A.C., Goh, T.N. & Bergman, B. (2009). On Integrating Kano’s Model
Dynamics into QFD for Multiple Product Design. Quality and Reliability Engineering
International. Special Issue DOI 10.1002/qre.1065.
RWE. (n.d. a). RWE eMobility. (online). Accessed from
http://www.rweMobility.com/web/cms/en/236726/rwemobility/. Accessed 2011-03-23.
RWE. (n.d. b). Smart station. (online). Accessed from:
http://www.rweMobility.com/web/cms/mediablob/en/590670/data/517314/1/rwemobility/
products-services/smart-station/smart-station.pdf. Accessed 2011-03-24.
Scheuing, E.E. & Johnson, E.M. (1989). A proposed model for new service development. The
Journal of Services Marketing. 3 (2). pp.25-34.
Sheth, J. & Parvatiyar, A. (1995). The Evolution of Relationship Marketing. International
Business Review. 4(4). pp.397-418.
Siemens. (n.d.). Moving with energy into a mobile future. (online). Accessed from
http://www.energy.siemens.com/hq/pool/hq/power-
distribution/emobility/Bruchure_electromobility_electric_car_US.pdf. Accessed: 2011-03-
21.
Singh, Y.K. & Bajpai, R.B. (2008). Research Methodology: Techniques and Trends. APH
Publishing Corporation: New Delhi.
Slack, N. (1994). The Importance-Performance Matrix as a Determinant of Improvement Priority.
International Journal of Operations & Production Management. 14(5). pp.59-75.
Source London (n.d.). Source London – The charge point network of London. (online). Accessed
from https://www.sourcelondon.net/source-london. Accessed 2011-03-21.
Stanzl, W. (2009). Corporate Finance II. Yale School of Management. (online). Accessed from:
http://som.yale.edu/~ws69/teaching/mgt541/sessionII.pdf. Accessed 2011-05-02.
Steinmetz, J. & Shanker, R. (2008). Autos & Auto-Related. Plug-in Hybrids: The Next
Automotive Revolution. Morgan Stanley Research. March 11.
Tanaka, S. (2010). Japanese Automobile Industry and Automobile Industry Policy. (online).
Accessed from: http://documents.eu-
japan.eu/seminars/japan/green_cars/presentation_tanaka_en.pdf Accessed: 2011-02-23
Tekes (2003). BestServ Feasibility Study Final Report, Technology Industries of Finland.
(online). Accessed from http://www.bestserv.fi/files/bestserv_taitto.pdf. Accessed 2011-
01-20.
Tepco. (2010-11-24). Report from Working Group on business model of members-only DC
charging service. (Internal material).
The Irish times. (2010-04-13). Electric car buyers to get grants of €5,000. (online). Accessed
from http://www.irishtimes.com/newspaper/ireland/2010/0413/1224268227900.html.
Accessed 2011-01-28.
U.S. Census Bureau. (2009-09-29). 2007 Economic Census. (2007 NAICS Code 447 – Gasoline
Stations). (online). Accessed from:
http://factfinder.census.gov/servlet/IBQTable?_bm=y&-geo_id=&-ds_name=EC0744I1&-
Service concepts for DC Fast Charging
vi
_lang=en. Accessed: 2011-01-31.
Valentine-Urbschat, M., & Bernhart, W. (2009). Powertrain 2020 – The Future Drives Electric.
Roland Berger Strategy Consultants. 09/2009.
Van den Bossche, P. (2010). Electric Vehicle Charging Infrastructure. IN Van den Bossche, P.
(eds.). Electric and Hybrid Vehicles. ISBN 978-0-444-53565-8
WEEE Register Society (n.d.). WEEE Register Society Category Listings 5.3. (online). Accessed
from:
http://www.weeeregister.ie/files/WEEE%20Register%20Category%20Listing%205.3.pdf.
Accessed: 2011-05-10.
Wheelwright, S.C. & Clark, K.B (1992), Revolutionizing Product Development, Free Press.
Wikipedia, Electric Car. (online). Accessed from http://en.wikipedia.org/wiki/Electric_car
Accessed: 2011-01-28.
Wikipedia, European emission standards. (online). Accessed from
http://en.wikipedia.org/wiki/European_emission_standards#Non-
existent_obligatory_vehicle_emission_limits. Accessed 2011-05-17.
Service concepts for DC Fast Charging
vii
FIGURES
Cover Figure 1. ABB Charging station prototype design of the so called “slim pole” (ABB
marketing material). ................................................................................................................... ii
Figure 2. Topology of DC fast charging supply opportunities for industrial companies. ABB
aims to deliver solutions for at least the top three layers (author based on internal business
plan). ........................................................................................................................................... 3
Figure 3. Model of the prerequisites of the service. Adapted from (Edvardsson & Olsson
1996, p. 157). .............................................................................................................................. 4
Figure 4. The framework for breaking down the purpose of this thesis into process steps. Each
step is addressed separately (author based on the frameworks in Table 1). ............................... 5
Figure 5. Disposition of the report (author). .............................................................................. 7
Figure 6. An eMobility market canvas (author). ........................................................................ 8
Figure 7. Initial projections of market take off for electrical vehicles Source: Author based on
Pike Research (Gartner & Wheelock 2010), Credit Suisse (Jobin et al. 2009) and Frost and
Sullivan (2009). ........................................................................................................................ 12
Figure 8. Total DC-fast charging sales worldwide projections. Based on assumptions in
appendix 3 (author). ................................................................................................................. 14
Figure 9. Framework of value transition showing the trend of shifting towards provider
responsibility (Tekes 2003, p.9). .............................................................................................. 18
Figure 10. Interpretation of Olivia and Kallenberg (2003). The figure shows a service
continuum, from a product supplier only to a full service organization who takes over end
user operation (author). ............................................................................................................ 18
Figure 11. The Kano model for customer satisfaction (Matzler et al. 1996). .......................... 21
Figure 12. The business model canvas (Osterwalder 2010, p.18-19). ..................................... 23
Figure 13. The framework for addressing the purpose with method stages (author). .............. 25
Figure 14. Ongoing brainstorming session with team 1 (author). ............................................ 26
Figure 15. Framework for conducting customer interviews (author). ..................................... 28
Figure 16. The three parts of a business model used in interviews to consider customer needs
(simplification of Business model canvas Osterwalder 2010). ................................................ 28
Figure 17. Segmentation of customers for ABB at both charger assembly and unit level
(author). .................................................................................................................................... 29
Figure 18. The distribution of answers with different main business models and value
propositions within eMobility (author). ................................................................................... 34
Service concepts for DC Fast Charging
viii
Figure 19. Satisfaction and dissatisfaction indexes for the Kano model (Matzler &
Hinterhuber 1998, p.33). .......................................................................................................... 35
Figure 20. Simplified framework for developing a scoring model (Adapted from Bitman &
Sharif 2008, p.271). .................................................................................................................. 37
Figure 21. The original version of the importance performance matrix (Martilla & James
1977). ........................................................................................................................................ 41
Figure 22. Illustrating how classification of attributes based on importance-performance has
been done (author). ................................................................................................................... 41
Figure 24. Framework for concept development and evaluation (author). .............................. 44
Figure 25. Figure depicting different value propositions in the fast charging market (author).
.................................................................................................................................................. 57
Figure 26. Figure illustrating the integration with the NSN service and its integration with an
ABB AC charger (ABB CRC Sweden, internal document). .................................................... 65
Figure 27.Service ideas categorized according to their type when evaluated by the nine
respondents (author). ................................................................................................................ 71
Figure 28. A high certainty means that many answers are in the same category. Service ideas
with high priority and certainty could be assumed to be worth much to customers. Spare parts
and hardware upgrades are examples of these services ideas. Reward system for charging at
your stations is with a high certainty a service idea that is indifferent to customers. Hardware
upgrades, replacements and reconditioning has a high certainty to be a must be service
(author). .................................................................................................................................... 72
Figure 29. Strategic fit and strategic intent seem to be rater correlated. This means that ABB
wants to do essentially the same services as the organization believes has a strategic fit. R2 >
0.5 is a sign of strong correlation. ............................................................................................ 77
Figure 30. Question to the internal organization on where ABB should position on the service
continuum (see model from Olivia & Kallenberg 2003). ........................................................ 77
Figure 31. A low standard deviation here means a high certainty of the answers. Preventative
maintenance and spare part service are examples of service ideas with both a high strategic fit
and level of agreement with the respondents. Network operation has high standard deviation
(low certainty) and a low ranking. There is no correlation between strategic fit and standard
deviation (R2=0.03). A similar analysis with strategic intent was done showing similar results
(author). .................................................................................................................................... 79
Figure 32. A plot with strategic fit and customer value for the service ideas. The service idea
is represented by its ID, since the total label is too long (author). ........................................... 80
Figure 33. Plot of correlation between customer priority and internal rating. The indexes are
standardized to N(0, 1). The plot shows a weak correlation (R2
< 0.5) (author)...................... 82
Figure 34. Illustration of item 5 (author). ................................................................................. 97
Service concepts for DC Fast Charging
ix
Figure 35. AC Slow Chargers installed 20 meters from the DC fast charger in Copenhagen
(no security cameras for protection) (author). ........................................................................ 110
Figure 36. The DC Fast Charging prototype installation in Copenhagen. The picture also
shows the components that are subject to wear and tear (author). ......................................... 110
Figure 37. Model depicting the design elements for a spare part system which depend on the
spare part characteristics. The arrows from “characteristics of spare part” to “logistic system
design” show what characteristic that impact which logistic system element (adapted from
Huiskonen 2001, p.129). ........................................................................................................ 112
Figure 38. An assessment of the costs of spare parts and maintenance. ABB margin of 44% is
included in the sales of spare parts. The dashed line area shows the room for margin, risk
premium and availability guarantees. This area is subject to negotiation (author). ............... 120
Figure 39. Process for a factory that handles refurbishment, repairs and buy and re-sell of a
fast charger (author). .............................................................................................................. 124
Figure 40. Estimates of total revenues for a DC fast charger with 20 years lifetime and a
discount rate of 10% (which reflects the risk and other possibilities to invest). .................... 130
Figure 41. Illustration of eMobility market dynamics compared to traditional (i.e. telephone)
market. eMobility has a requirement of many features (full solutions) already very early in
development. This implies larger risks but maybe also larger gains (author). ....................... 131
Figure 42. The chart depicts what the battery price per kWh must be in order for an
investment to break even (unknown exactly how it has been defined in their calculations)
given a certain gasoline price and tax credit/subside (Jobin et al. 2009, p.19). ..................... xvii
Service concepts for DC Fast Charging
x
TABLES
Table 1. A selection of frameworks for service development (author). ..................................... 5
Table 2. Factors influencing the transition to eMobility. Source: Compounded from research
reports by Pike Research (Gartner & Wheelock 2010), Morgan and Stanley (Steinmetz &
Shanker 2008), Credit Suisse (Jobin et al. 2009), Boston Consulting Group (Dinger et al.
2010) and Roland Berger (Valentine-Urbschat & Bernhart 2009). ........................................... 9
Table 3. Projections of the electrical vehicle market from several research institutes (author).
* All cars sold of any propellant technique (OICA n.d.). The research reports in this table can
be found in the reference list. ................................................................................................... 12
Table 4. Adapted from Table 2.2 Gartner & Wheelock (2010, p.9). See also California Air
Resolutions board (2001-03-26)............................................................................................... 13
Table 5. Comparison of the three repowering methods (author). ............................................ 15
Table 6. Frameworks for classifying service and product offerings. Services can be a means
for companies to differentiate (author). .................................................................................... 17
Table 7. Success factors for efficient service development (summarized by author). ............. 19
Table 8. Kano requirements classification (author adopted from Matzler et al. 1996). ........... 21
Table 9. Detailed description of research methodology to address each process stage (author).
.................................................................................................................................................. 25
Table 10. Framework used to structure service ideas (author based on theoretical
classifications). ......................................................................................................................... 27
Table 11. Benchmarks for the study (author). .......................................................................... 30
Table 12. Comparison of some key parameters of Ericsson and ABB (Ericsson 2011; Ericsson
2010; ABB 2010a; ABB 2010b; ABB 2010c). ........................................................................ 31
Table 13. Example of a question in the Kano survey. The example depicts a functional
attribute question table which could fit about 14 attributes to be measured per page. There is
both a functional and dysfunctional question for each service idea (author). .......................... 33
Table 14. Classification table for Kano attributes. The functional and dysfunctional questions
give a classification by following row/column values. (Matzler & Hinterhuber 1998). ......... 34
Table 15. Table to interpret the Satisfaction and dissatisfaction coefficients (Author). .......... 35
Table 16. Illustration of how the standard deviation of answers can be used to show how
certain a classification of a service idea is (Author). ............................................................... 35
Table 17. Attribute weight assignment scheme (Raharjo 2010). ............................................. 36
Table 18. Criteria and measuring scales for strategic fit. Each criterion was assessed for each
of the service ideas to be able to compare the ideas on strategic fit (author). .......................... 38
Table 19. Question for each criteria to decide their relative weight, see last part of
questionnaire in appendix 7 (author). ....................................................................................... 38
Service concepts for DC Fast Charging
xi
Table 20. Criterion and measuring scale for strategic intent. The criterion has answer
alternatives yes or no; these are assigned values 1 and 0 respectively for the quantitative
analysis (author). ...................................................................................................................... 39
Table 21. Framework to assess competitors (author inspired by Olivia and Kallenberg’s
(2003) classification of level of service delivery). ................................................................... 43
Table 22. Service ideas from brainstorming sessions (author). ............................................... 49
Table 23. Generic customer value propositions in eMobility split on interviewees. The
fulfillment of each value proposition is assessed with pie slices; ranging from a full black
circle (100% strategic intent) to a quarter of a black circle (25% strategic intent). Each
company’s strategic intent adds up to 100%. Two interviews/ questionnaires were
conducted/given to the petrol station (author). ......................................................................... 51
Table 24. Business model for free infrastructure value proposition used in cities, communities
or countries. A partner runs the system and the “city” takes the investment (Business model
Framework adapted from Osterwalder 2010). ......................................................................... 51
Table 25. Business model for free charging value proposition used at shopping malls to attract
business (Business model Framework adapted from Osterwalder 2010). ............................... 53
Table 26. Business model for value proposition commercial (Framework adapted from
Osterwalder 2010). ................................................................................................................... 56
Table 27. Business model for value proposition “solution provider” (Adapted from
Osterwalder 2010). ................................................................................................................... 57
Table 28. Business model for value proposition “fleet” (adapted from Osterwalder 2010). ... 59
Table 29. Complete care concepts (ABB 2011b). .................................................................... 63
Table 30. Summary of needs addressed during customer interviews and an assessment of how
many of the interviewees that shared the need (the demand) (author). .................................... 66
Table 31. Assessment of the different interviewed customers in a service space spanned by
action related services/product features and product related services over the life cycle
(author). .................................................................................................................................... 67
Table 32. Summary of key learning points for service benchmarks (author). ......................... 68
Table 33. Service ideas ranked according to priority. Most important is hardware upgrades,
replacement, reconditioning and spare part field service (author). .......................................... 69
Table 34. Table showing Prioutility-Prioothers sorted descending. Prio is the standardized
priority numbers for each service idea which has been calculated for both customer groups.
Looking at differences in priority numbers shows what service ideas that differ most between
the segments. Prioutility-Prioothers gives a measure that if positive means that utilities value the
idea more than Others and if negative the opposite holds true (author). ................................. 73
Table 35. Result of internal survey, sorted on strategic fit (author). ........................................ 75
Table 36. Voices from the survey (author). ............................................................................. 78
Service concepts for DC Fast Charging
xii
Table 37. The importance-performance matrix applied to the service ideas. Importance is
represented by the customer dimension (M, O, A is important, R and I unimportant).
Performance is represented by standardized internal survey rating (author). .......................... 81
Table 38. Correlation between the different dimensions. None of the three customer
dimensions have a strong correlation with the internal rating (everyone is R2
< 0.5) (author).
.................................................................................................................................................. 82
Table 39. ANOVA of regression between priority customers and strategic fit. The result
shows that the two dimensions explain each other with a significance < 0.05 (author). ......... 82
Table 40. ANOVA of regression between priority customers (utility segment) and strategic
fit. The result shows that the two dimensions explain each other with a significance < 0.05
(author). .................................................................................................................................... 83
Table 41. ANOVA of regression between priority customers (Other segment) and strategic fit.
The result shows that the two dimensions explain each other with a significance < 0.05
(author). .................................................................................................................................... 83
Table 42. Assessments of competitors’ maturity over continuum from pure product to pure
service offering (author). α Siemens cannot deliver today but will deliver in-house in
future. ECOtality has in-house assembly but possibly parts form ABB. β
Companies
have API and possibility to integrate payment systems. γ Has most likely a system but
uses it internally to control the charger for the owner. ...................................................... 84
Table 43. E-mail conversation with Mr. Tomokazu Takita from Tokyo Electric Power
Company / CHAdeMO (2011-03-23). ..................................................................................... 85
Table 44. The service offering from RWE presented at Geneva motor show 2011 (author). . 87
Table 45. Summary of evaluation measures for service ideas within action related services
(author). .................................................................................................................................... 92
Table 46. Different offers of DC fast chargers (author based on the product classification
ABB is using). .......................................................................................................................... 93
Table 47. Pros and cons of different strategies for developing a more sophisticated charging
solution (author). ...................................................................................................................... 94
Table 48. What to think about when acquiring a company to bridge the development gap
(author). .................................................................................................................................... 95
Table 49. An assessment of what ABB should be willing to pay for an acquisition of a
company with a DC fast charger available today (author). ...................................................... 95
Table 50. A list of process steps that can be followed to develop a more sophisticated charger
in-house (author). ..................................................................................................................... 96
Table 51. Examples of some services with recurring revenue that can be designed from the
action related service ideas (author). ........................................................................................ 99
Table 52. Action related activities needed to do network operation for a customer (city,
community or country). The product related activities to maintain and field service the
Service concepts for DC Fast Charging
xiii
products are not included since ABB already aim to be doing them. The table illustrates that it
is not much extra effort required to set up a complete operation once software is in place to
run the operation (author). ...................................................................................................... 100
Table 53. Summary of the different evaluations made of sales and presentation services
(author). .................................................................................................................................. 101
Table 54. Differentiating sales service towards different customers (author). ...................... 101
Table 55. Profit evaluation for sales and presentation services (author). .............................. 102
Table 56. Summary of the different evaluations made of consulting services (author). *
Balance of plant is put together with commissioning in the project management service
concept. ** System optimization consulting during operation is recommended as
something that could be sold together with a service contract to the customer during the
products operational lifetime (including for example cleaning and updating software).
................................................................................................................................................ 103
Table 57. Business case for a consulting service. .................................................................. 105
Table 58. Assessment of project management service ideas (author). ................................... 106
Table 59. Assessment of business case for installation and commissioning (author). ........... 108
Table 60. Summary of idea evaluation for services during operation (author). ..................... 109
Table 61. Service models for operation related services. ....................................................... 111
Table 62. Assessment of the different spare parts; where they should be placed and if ABB
should control them. * Depend on number of fast chargers installed. This volume/scale
impact will be further assessed later in this chapter. L = local
G = global ....................... 113
Table 63. Possible ways to provide spare parts and labor with different implications for
availability. 5 days (120h) is assumed for a global and 24 hours for a local spare part delivery.
Each component has a MTBF which provides a number of occasions the charger is down per
year (1/MTBF). This number multiplied with the delivery time for local or global storage
gives an expected yearly downtime for delivery of one component. If the different
components fail at different occasions the worst case expected downtime can be calculated by
summing the expected yearly downtime of each component (author). .................................. 115
Table 64. Assumptions underlying the business case for service contracts. .......................... 116
Table 65. Assessment of the different components in the fast charger that will need
maintenance or reactive field services. Internal ABB products have a higher gross margin
assessed compared to goods bought from suppliers. Scale effects will still make it feasible to
redistribute common supply components (author). ................................................................ 117
Table 66. An assessment of a service model where the customer takes the risk. ABB has a
44% profit margin on spare part sales. The customer buys spare parts and does the labor
internally. The total yearly cost to service a charger is $1'686 per charger. This corresponds to
8% of the HW investment. In additional different fixed costs apply to the customer which
impacts the total cost for operating the charger. * The cost should not be amortized but
Service concepts for DC Fast Charging
xiv
taken as a fixed cost. However this has still been put as a yearly cost to simplify
calculations. ** For a customer who do not have an established service organization. 118
Table 67. A break even analysis between the customer and ABB risk models for a mature
customer. At five fast chargers the margin for ABB is the same as when only providing spare
parts. *The fixed costs include training ($500/year), SW updates ($500/year) and
inventory keeping costs. Inventory keeping costs depend on the number of units that
need to be stocked, the stock keeping rate and the material handlings costs: The more
units, the more spare parts that need to be handled and stocked. Table 68 depicts the
inventory costs for an internal ABB inventory with an installed base of 10’000 units. The
same calculation method was applied to figure out inventory costs for customers with
different number of chargers by varying the installed base number. The spare part cost
was put to the ABB retail price. .......................................................................................... 118
Table 68. A break even analysis between the customer and ABB risk models for an immature
customer. At 25 fast chargers the margin for ABB is the same as when only providing spare
parts. *The fixed costs include training ($500/year), SW updates ($500/year),
depreciation of service equipment ($5000/year) and inventory keeping costs. Inventory
keeping costs depend on the number of units that need to be stocked, the stock keeping
rate and the material handlings costs: The more units, the more spare parts that need to
be handled and stocked. Table 68 depicts the inventory costs for an internal ABB
inventory with an installed base of 10’000 units. The same calculation method was
applied to figure out inventory costs for customers with different number of chargers by
varying the installed base number. The spare part cost was put to the ABB retail price.
................................................................................................................................................ 119
Table 69. The spare part business with an installed base of 10 000 DC fast chargers.
Assumptions: Security inventory 20
days Lead time 40 days Inventory keeping rate, R 15% Unit cost, C Depends on the unit
Annual demand, Dyear Depends on the unit Order handling cost, S $15 Economic order
quantity, 121
Table 70. A table of different strategies for ABB to increase margin of service contracts.
Either increase the cost for customers to do service in-house or increase the benefits of
choosing ABB as a supplier for service (author). .................................................................. 122
Table 71. Evaluation of service ideas related to end of product life (author). ....................... 123
Table 72. A few options for end of life services (author). ..................................................... 124
Table 73. Assessment of business case for mid or end of life services (author). ................... 126
Table 74. A summary of the service concepts presented in chapter 6 (author). .................... 129
Table 75. List of electrical vehicles. Energie Schweiz. (2011). eMobile Ecocars 2011.
(Marketing Material). pp.14-15. .............................................................................................. xvi
Table 76. DC-Fast charging sales. EV sales numbers are based on Credit Suisse market
estimates. Charger price is based on estimates of scale economics and effect of competition
(author). .................................................................................................................................. xvii

Service concepts for DC Fast Charging
xv
Table 77. Assessment of costs for a petrol station (including installation) (Interview with
Petrol station 1, 2011). .......................................................................................................... xviii
Table 78. Product related service ideas tied to life cycle and not. The life cycle ideas are also
split into customer type (author). ....................................................................................... xxxvii
Table 79. Action related service ideas. These services are tied to what the customer wants to
do with the product. They are categorized by customer type (author). ............................. xxxviii
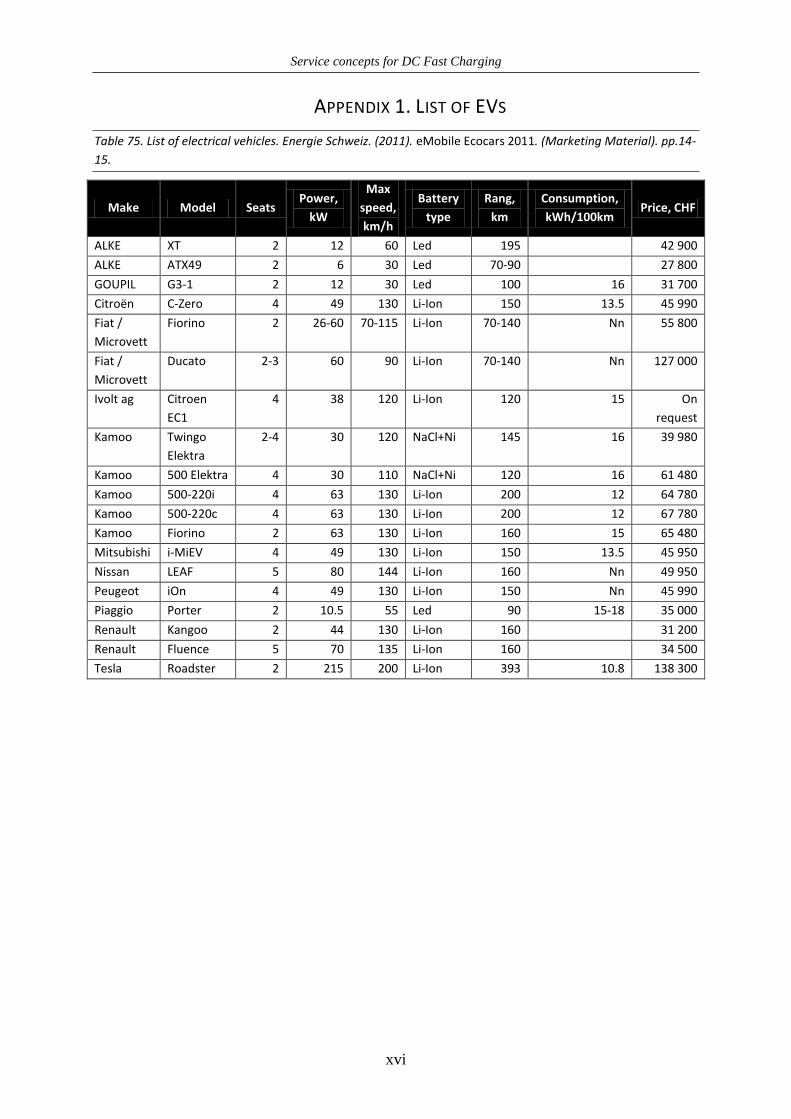
Service concepts for DC Fast Charging
xvi
APPENDIX 1. LIST OF EVS
Table 75. List of electrical vehicles. Energie Schweiz. (2011). eMobile Ecocars 2011. (Marketing Material). pp.14-
15.
Make Model Seats Power,
kW
Max
speed,
km/h
Battery
type
Rang,
km
Consumption,
kWh/100km Price, CHF
ALKE XT 2 12 60 Led 195 42 900
ALKE ATX49 2 6 30 Led 70-90 27 800
GOUPIL G3-1 2 12 30 Led 100 16 31 700
Citroën C-Zero 4 49 130 Li-Ion 150 13.5 45 990
Fiat /
Microvett
Fiorino 2 26-60 70-115 Li-Ion 70-140 Nn 55 800
Fiat /
Microvett
Ducato 2-3 60 90 Li-Ion 70-140 Nn 127 000
Ivolt ag Citroen
EC1
4 38 120 Li-Ion 120 15 On
request
Kamoo Twingo
Elektra
2-4 30 120 NaCl+Ni 145 16 39 980
Kamoo 500 Elektra 4 30 110 NaCl+Ni 120 16 61 480
Kamoo 500-220i 4 63 130 Li-Ion 200 12 64 780
Kamoo 500-220c 4 63 130 Li-Ion 200 12 67 780
Kamoo Fiorino 2 63 130 Li-Ion 160 15 65 480
Mitsubishi i-MiEV 4 49 130 Li-Ion 150 13.5 45 950
Nissan LEAF 5 80 144 Li-Ion 160 Nn 49 950
Peugeot iOn 4 49 130 Li-Ion 150 Nn 45 990
Piaggio Porter 2 10.5 55 Led 90 15-18 35 000
Renault Kangoo 2 44 130 Li-Ion 160 31 200
Renault Fluence 5 70 135 Li-Ion 160 34 500
Tesla Roadster 2 215 200 Li-Ion 393 10.8 138 300
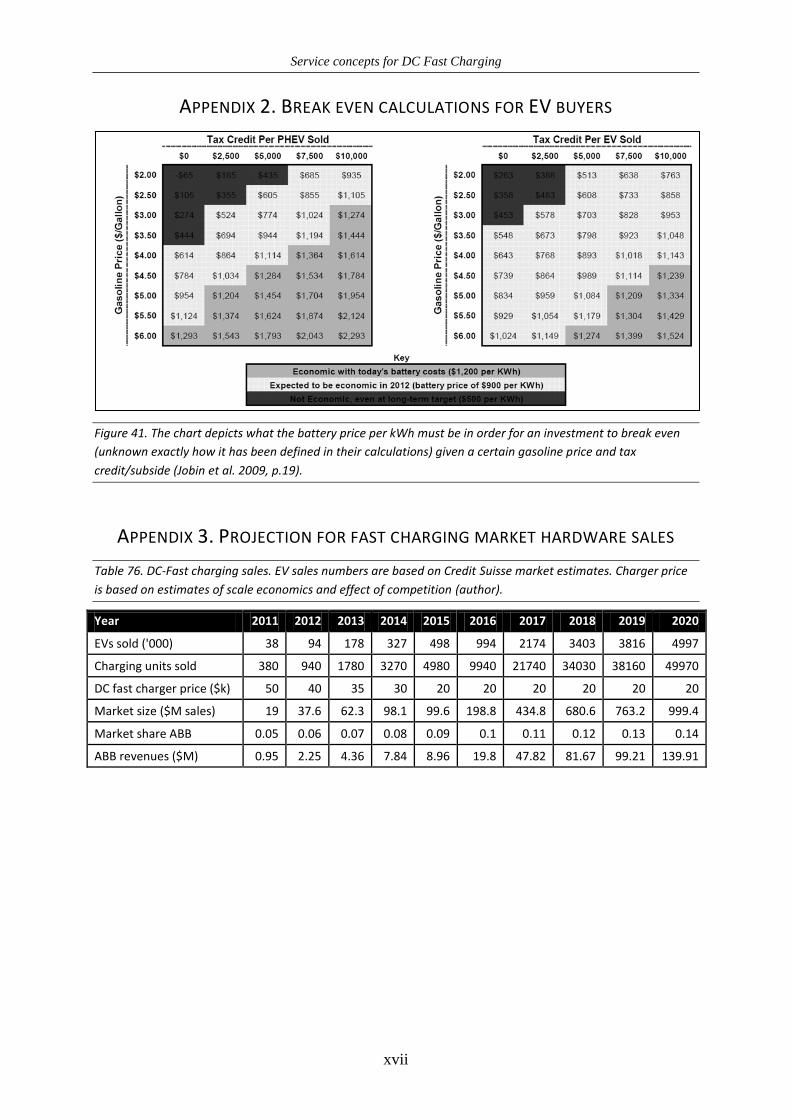
Service concepts for DC Fast Charging
xvii
APPENDIX 2. BREAK EVEN CALCULATIONS FOR EV BUYERS
Figure 41. The chart depicts what the battery price per kWh must be in order for an investment to break even
(unknown exactly how it has been defined in their calculations) given a certain gasoline price and tax
credit/subside (Jobin et al. 2009, p.19).
APPENDIX 3. PROJECTION FOR FAST CHARGING MARKET HARDWARE SALES
Table 76. DC-Fast charging sales. EV sales numbers are based on Credit Suisse market estimates. Charger price
is based on estimates of scale economics and effect of competition (author).
Year 2011 2012 2013 2014 2015 2016 2017 2018 2019 2020
EVs sold ('000) 38 94 178 327 498 994 2174 3403 3816 4997
Charging units sold 380 940 1780 3270 4980 9940 21740 34030 38160 49970
DC fast charger price ($k) 50 40 35 30 20 20 20 20 20 20
Market size ($M sales) 19 37.6 62.3 98.1 99.6 198.8 434.8 680.6 763.2 999.4
Market share ABB 0.05 0.06 0.07 0.08 0.09 0.1 0.11 0.12 0.13 0.14
ABB revenues ($M) 0.95 2.25 4.36 7.84 8.96 19.8 47.82 81.67 99.21 139.91
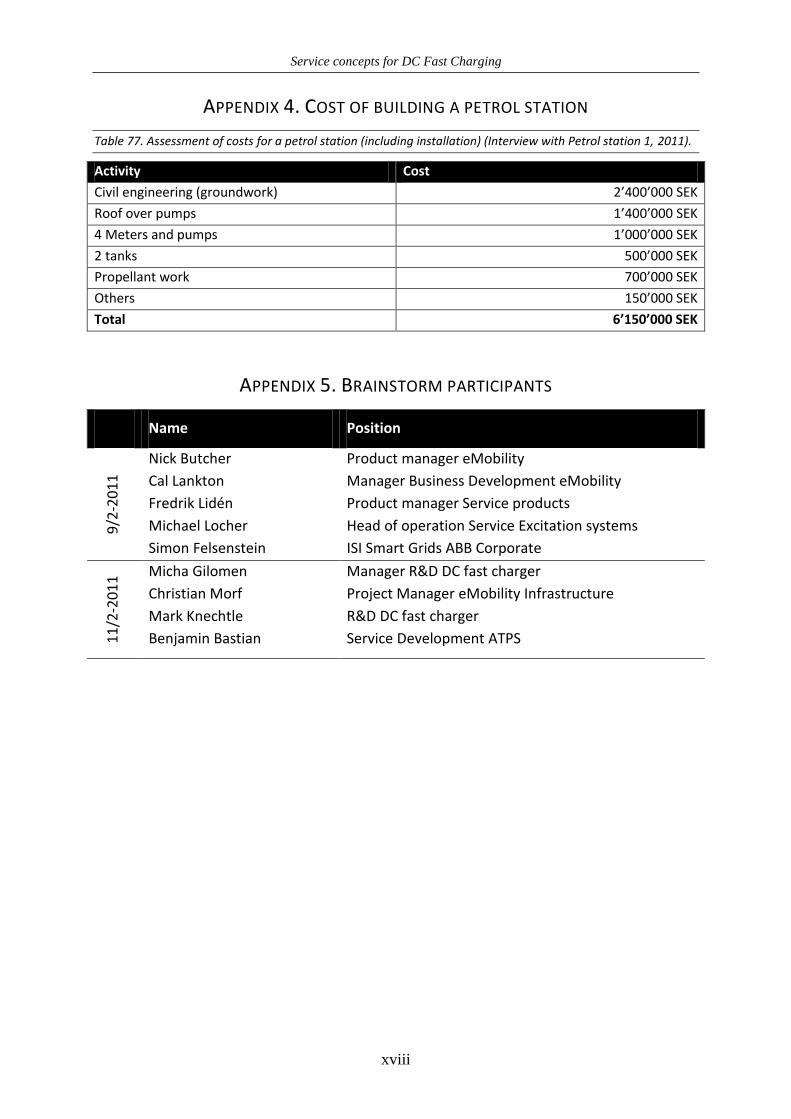
Service concepts for DC Fast Charging
xviii
APPENDIX 4. COST OF BUILDING A PETROL STATION
Table 77. Assessment of costs for a petrol station (including installation) (Interview with Petrol station 1, 2011).
Activity Cost
Civil engineering (groundwork) 2’400’000 SEK
Roof over pumps 1’400’000 SEK
4 Meters and pumps 1’000’000 SEK
2 tanks 500’000 SEK
Propellant work 700’000 SEK
Others 150’000 SEK
Total 6’150’000 SEK
APPENDIX 5. BRAINSTORM PARTICIPANTS
Name Position
9/2
-20
11
Nick Butcher Product manager eMobility
Cal Lankton Manager Business Development eMobility
Fredrik Lidén Product manager Service products
Michael Locher Head of operation Service Excitation systems
Simon Felsenstein ISI Smart Grids ABB Corporate
11
/2-2
01
1 Micha Gilomen Manager R&D DC fast charger
Christian Morf Project Manager eMobility Infrastructure
Mark Knechtle R&D DC fast charger
Benjamin Bastian Service Development ATPS
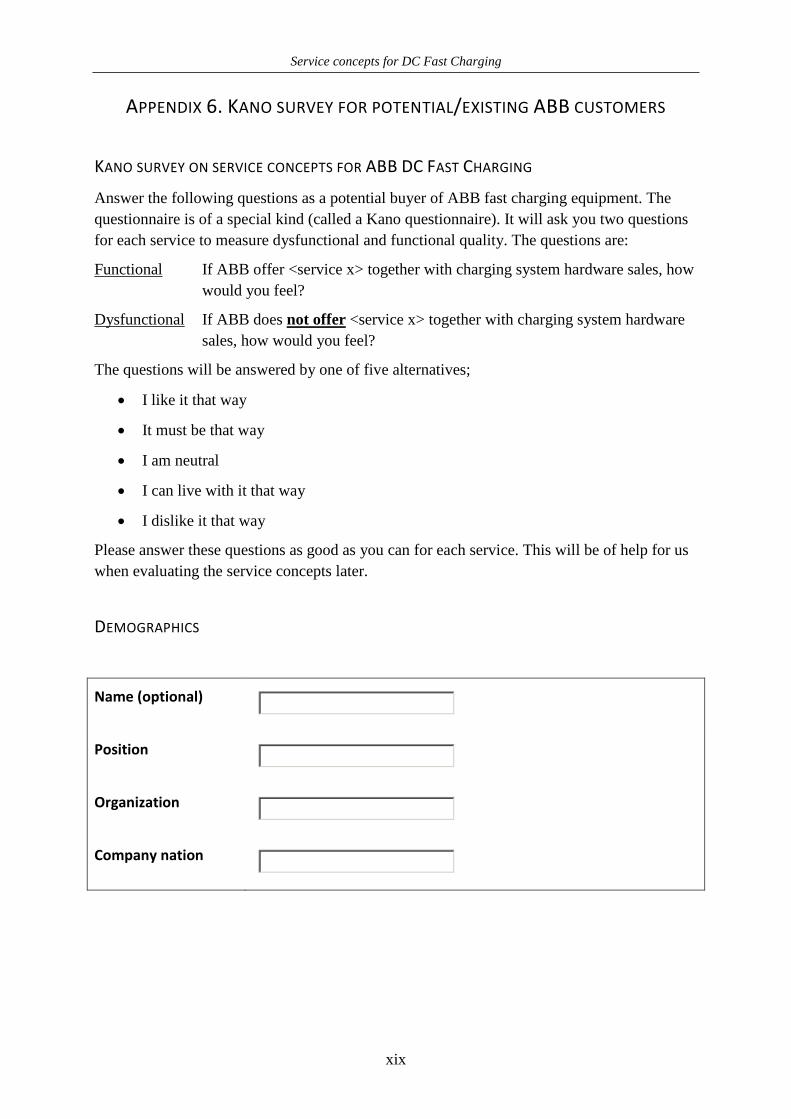
Service concepts for DC Fast Charging
xix
APPENDIX 6. KANO SURVEY FOR POTENTIAL/EXISTING ABB CUSTOMERS
KANO SURVEY ON SERVICE CONCEPTS FOR ABB DC FAST CHARGING
Answer the following questions as a potential buyer of ABB fast charging equipment. The
questionnaire is of a special kind (called a Kano questionnaire). It will ask you two questions
for each service to measure dysfunctional and functional quality. The questions are:
Functional If ABB offer <service x> together with charging system hardware sales, how
would you feel?
Dysfunctional If ABB does not offer <service x> together with charging system hardware
sales, how would you feel?
The questions will be answered by one of five alternatives;
I like it that way
It must be that way
I am neutral
I can live with it that way
I dislike it that way
Please answer these questions as good as you can for each service. This will be of help for us
when evaluating the service concepts later.
DEMOGRAPHICS
Name (optional)
Position
Organization
Company nation
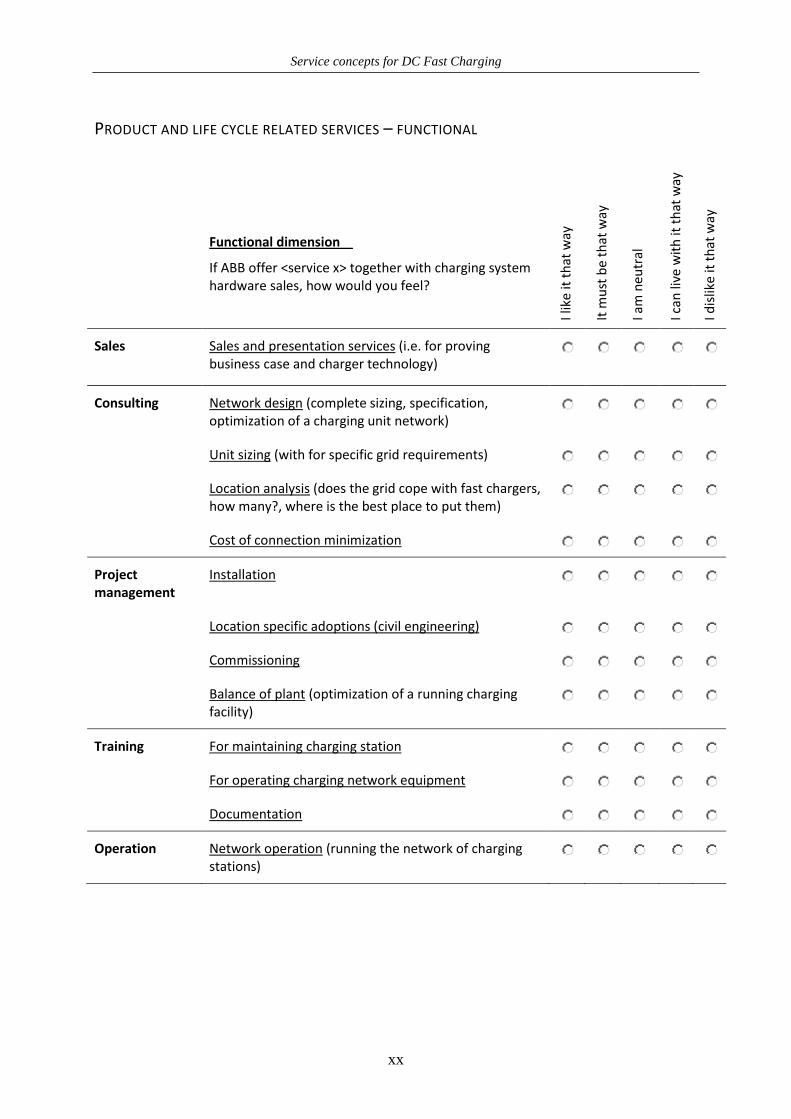
Service concepts for DC Fast Charging
xx
PRODUCT AND LIFE CYCLE RELATED SERVICES – FUNCTIONAL
Functional dimension
If ABB offer <service x> together with charging system hardware sales, how would you feel?
I lik
e it
th
at w
ay
It m
ust
be
that
way
I am
neu
tral
I can
live
wit
h it
th
at w
ay
I dis
like
it t
hat
way
Sales Sales and presentation services (i.e. for proving business case and charger technology)
Consulting Network design (complete sizing, specification, optimization of a charging unit network)
Unit sizing (with for specific grid requirements)
Location analysis (does the grid cope with fast chargers, how many?, where is the best place to put them)
Cost of connection minimization
Project management
Installation
Location specific adoptions (civil engineering)
Commissioning
Balance of plant (optimization of a running charging facility)
Training For maintaining charging station
For operating charging network equipment
Documentation
Operation Network operation (running the network of charging stations)
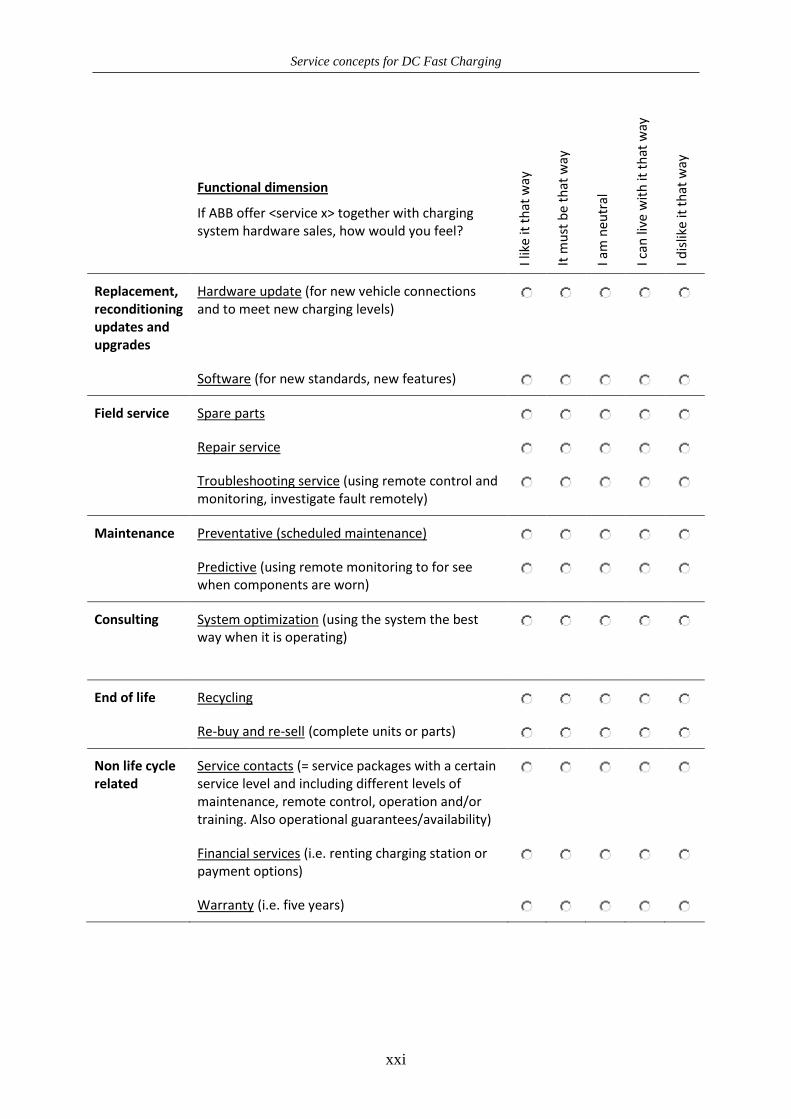
Service concepts for DC Fast Charging
xxi
Functional dimension
If ABB offer <service x> together with charging system hardware sales, how would you feel?
I lik
e it
th
at w
ay
It m
ust
be
that
way
I am
neu
tral
I can
live
wit
h it
th
at w
ay
I dis
like
it t
hat
way
Replacement, reconditioning updates and upgrades
Hardware update (for new vehicle connections and to meet new charging levels)
Software (for new standards, new features)
Field service Spare parts
Repair service
Troubleshooting service (using remote control and monitoring, investigate fault remotely)
Maintenance Preventative (scheduled maintenance)
Predictive (using remote monitoring to for see when components are worn)
Consulting System optimization (using the system the best way when it is operating)
End of life Recycling
Re-buy and re-sell (complete units or parts)
Non life cycle related
Service contacts (= service packages with a certain service level and including different levels of maintenance, remote control, operation and/or training. Also operational guarantees/availability)
Financial services (i.e. renting charging station or payment options)
Warranty (i.e. five years)
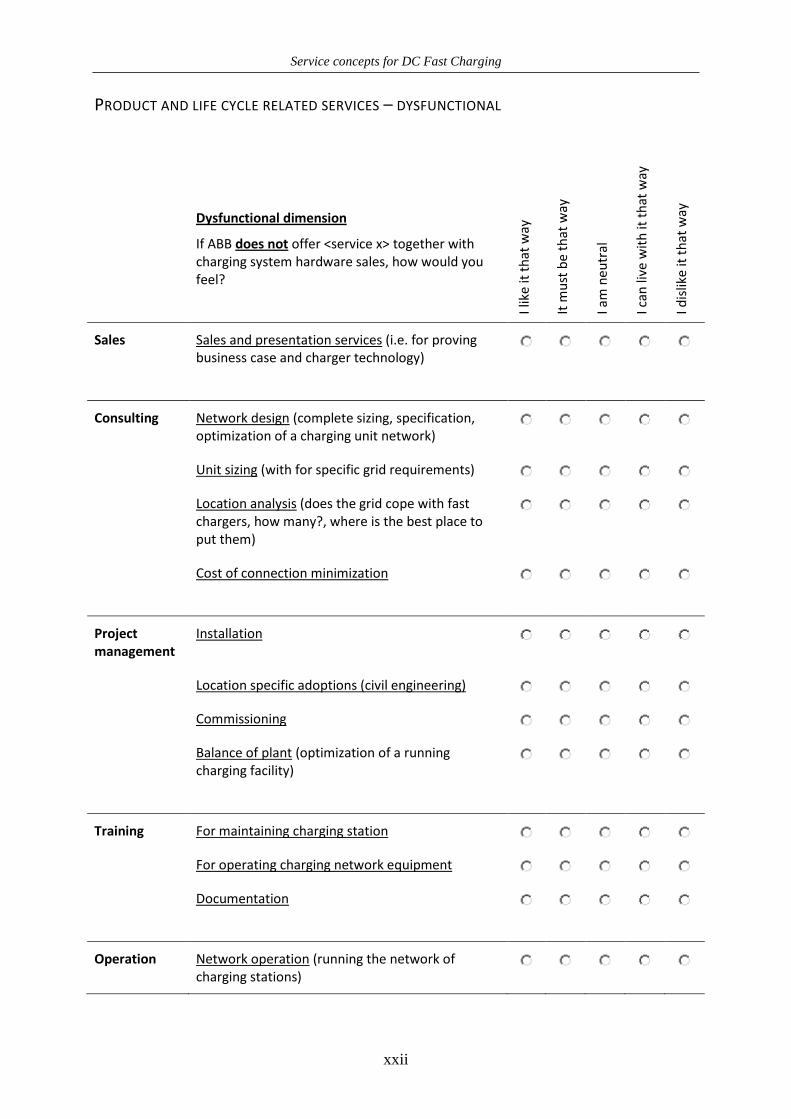
Service concepts for DC Fast Charging
xxii
PRODUCT AND LIFE CYCLE RELATED SERVICES – DYSFUNCTIONAL
Dysfunctional dimension
If ABB does not offer <service x> together with charging system hardware sales, how would you feel?
I lik
e it
th
at w
ay
It m
ust
be
that
way
I am
neu
tral
I can
live
wit
h it
th
at w
ay
I dis
like
it t
hat
way
Sales Sales and presentation services (i.e. for proving business case and charger technology)
Consulting Network design (complete sizing, specification, optimization of a charging unit network)
Unit sizing (with for specific grid requirements)
Location analysis (does the grid cope with fast chargers, how many?, where is the best place to put them)
Cost of connection minimization
Project management
Installation
Location specific adoptions (civil engineering)
Commissioning
Balance of plant (optimization of a running charging facility)
Training For maintaining charging station
For operating charging network equipment
Documentation
Operation Network operation (running the network of charging stations)
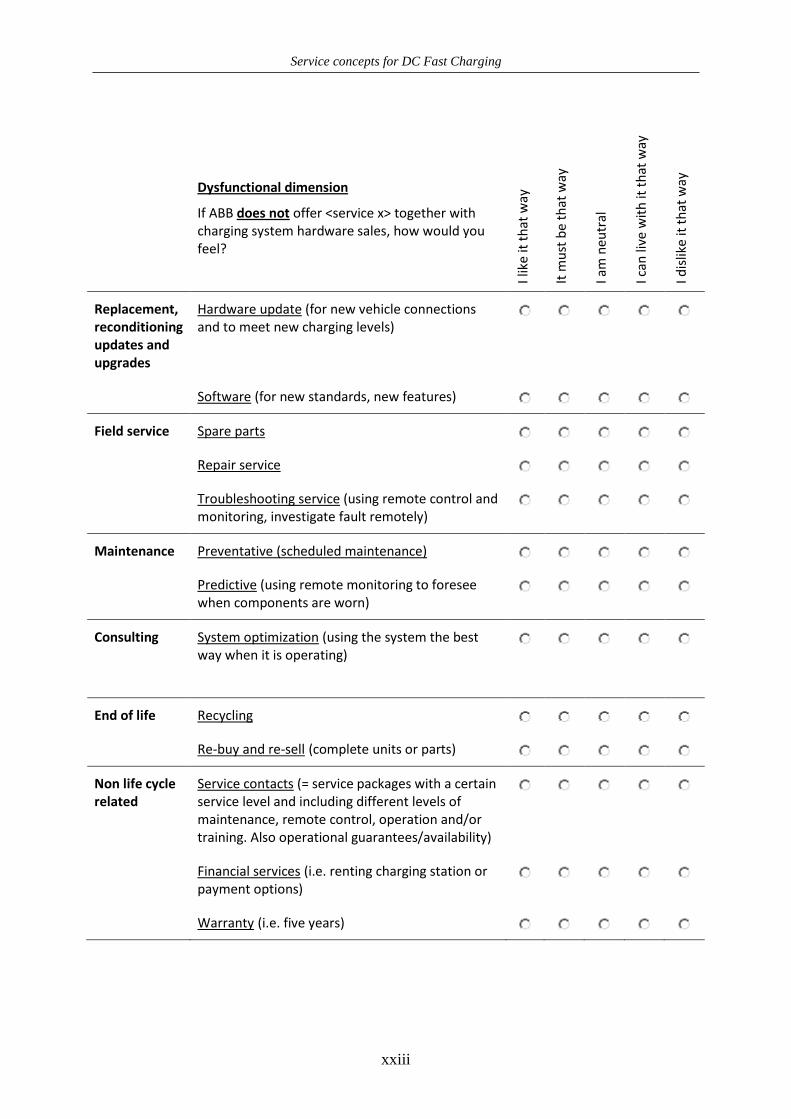
Service concepts for DC Fast Charging
xxiii
Dysfunctional dimension
If ABB does not offer <service x> together with charging system hardware sales, how would you feel?
I lik
e it
th
at w
ay
It m
ust
be
that
way
I am
neu
tral
I can
live
wit
h it
th
at w
ay
I dis
like
it t
hat
way
Replacement, reconditioning updates and upgrades
Hardware update (for new vehicle connections and to meet new charging levels)
Software (for new standards, new features)
Field service Spare parts
Repair service
Troubleshooting service (using remote control and monitoring, investigate fault remotely)
Maintenance Preventative (scheduled maintenance)
Predictive (using remote monitoring to foresee when components are worn)
Consulting System optimization (using the system the best way when it is operating)
End of life Recycling
Re-buy and re-sell (complete units or parts)
Non life cycle related
Service contacts (= service packages with a certain service level and including different levels of maintenance, remote control, operation and/or training. Also operational guarantees/availability)
Financial services (i.e. renting charging station or payment options)
Warranty (i.e. five years)
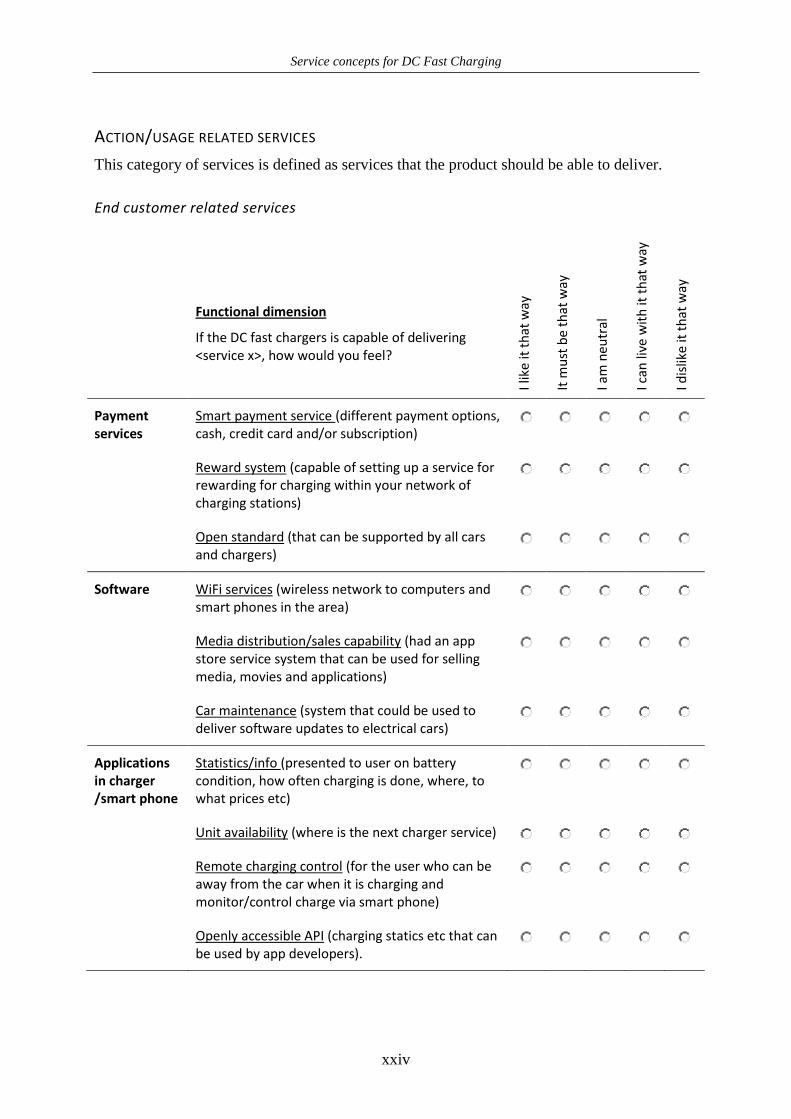
Service concepts for DC Fast Charging
xxiv
ACTION/USAGE RELATED SERVICES
This category of services is defined as services that the product should be able to deliver.
End customer related services
Functional dimension
If the DC fast chargers is capable of delivering <service x>, how would you feel?
I lik
e it
th
at w
ay
It m
ust
be
that
way
I am
neu
tral
I can
live
wit
h it
th
at w
ay
I dis
like
it t
hat
way
Payment services
Smart payment service (different payment options, cash, credit card and/or subscription)
Reward system (capable of setting up a service for rewarding for charging within your network of charging stations)
Open standard (that can be supported by all cars and chargers)
Software WiFi services (wireless network to computers and smart phones in the area)
Media distribution/sales capability (had an app store service system that can be used for selling media, movies and applications)
Car maintenance (system that could be used to deliver software updates to electrical cars)
Applications in charger /smart phone
Statistics/info (presented to user on battery condition, how often charging is done, where, to what prices etc)
Unit availability (where is the next charger service)
Remote charging control (for the user who can be away from the car when it is charging and monitor/control charge via smart phone)
Openly accessible API (charging statics etc that can be used by app developers).
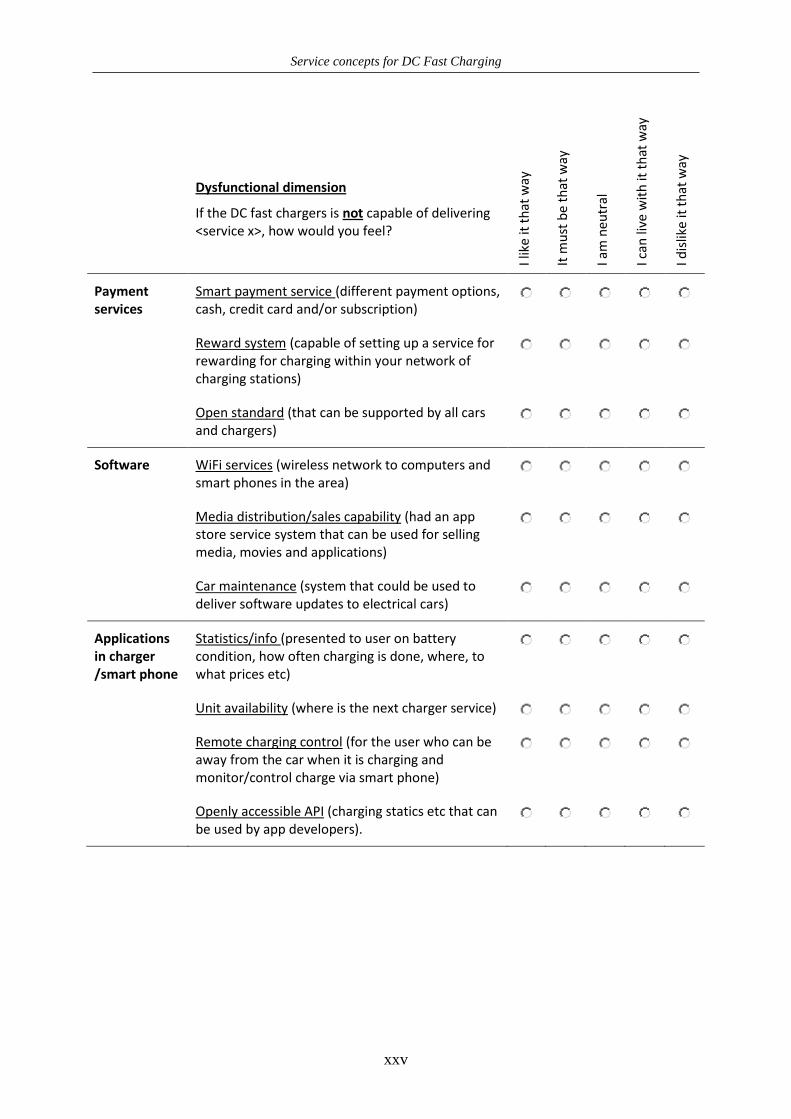
Service concepts for DC Fast Charging
xxv
Dysfunctional dimension
If the DC fast chargers is not capable of delivering <service x>, how would you feel?
I lik
e it
th
at w
ay
It m
ust
be
that
way
I am
neu
tral
I can
live
wit
h it
th
at w
ay
I dis
like
it t
hat
way
Payment services
Smart payment service (different payment options, cash, credit card and/or subscription)
Reward system (capable of setting up a service for rewarding for charging within your network of charging stations)
Open standard (that can be supported by all cars and chargers)
Software WiFi services (wireless network to computers and smart phones in the area)
Media distribution/sales capability (had an app store service system that can be used for selling media, movies and applications)
Car maintenance (system that could be used to deliver software updates to electrical cars)
Applications in charger /smart phone
Statistics/info (presented to user on battery condition, how often charging is done, where, to what prices etc)
Unit availability (where is the next charger service)
Remote charging control (for the user who can be away from the car when it is charging and monitor/control charge via smart phone)
Openly accessible API (charging statics etc that can be used by app developers).
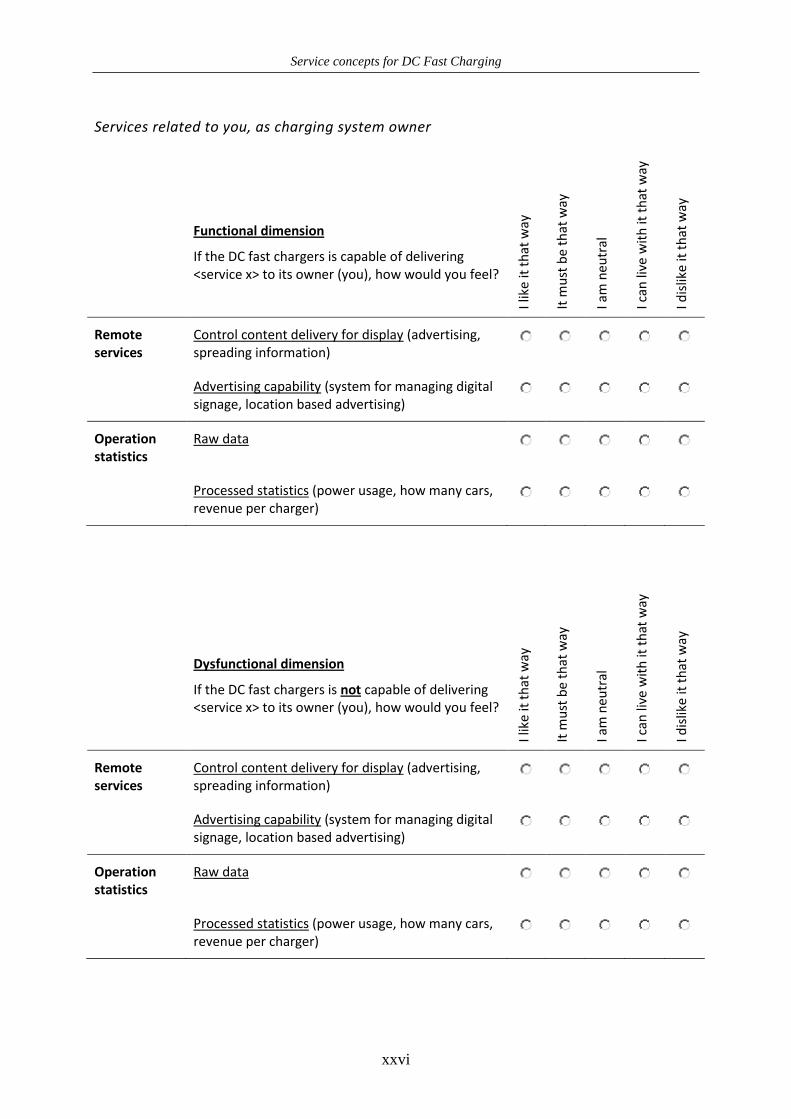
Service concepts for DC Fast Charging
xxvi
Services related to you, as charging system owner
Functional dimension
If the DC fast chargers is capable of delivering <service x> to its owner (you), how would you feel?
I lik
e it
th
at w
ay
It m
ust
be
that
way
I am
neu
tral
I can
live
wit
h it
th
at w
ay
I dis
like
it t
hat
way
Remote services
Control content delivery for display (advertising, spreading information)
Advertising capability (system for managing digital signage, location based advertising)
Operation statistics
Raw data
Processed statistics (power usage, how many cars, revenue per charger)
Dysfunctional dimension
If the DC fast chargers is not capable of delivering <service x> to its owner (you), how would you feel?
I lik
e it
th
at w
ay
It m
ust
be
that
way
I am
neu
tral
I can
live
wit
h it
th
at w
ay
I dis
like
it t
hat
way
Remote services
Control content delivery for display (advertising, spreading information)
Advertising capability (system for managing digital signage, location based advertising)
Operation statistics
Raw data
Processed statistics (power usage, how many cars, revenue per charger)
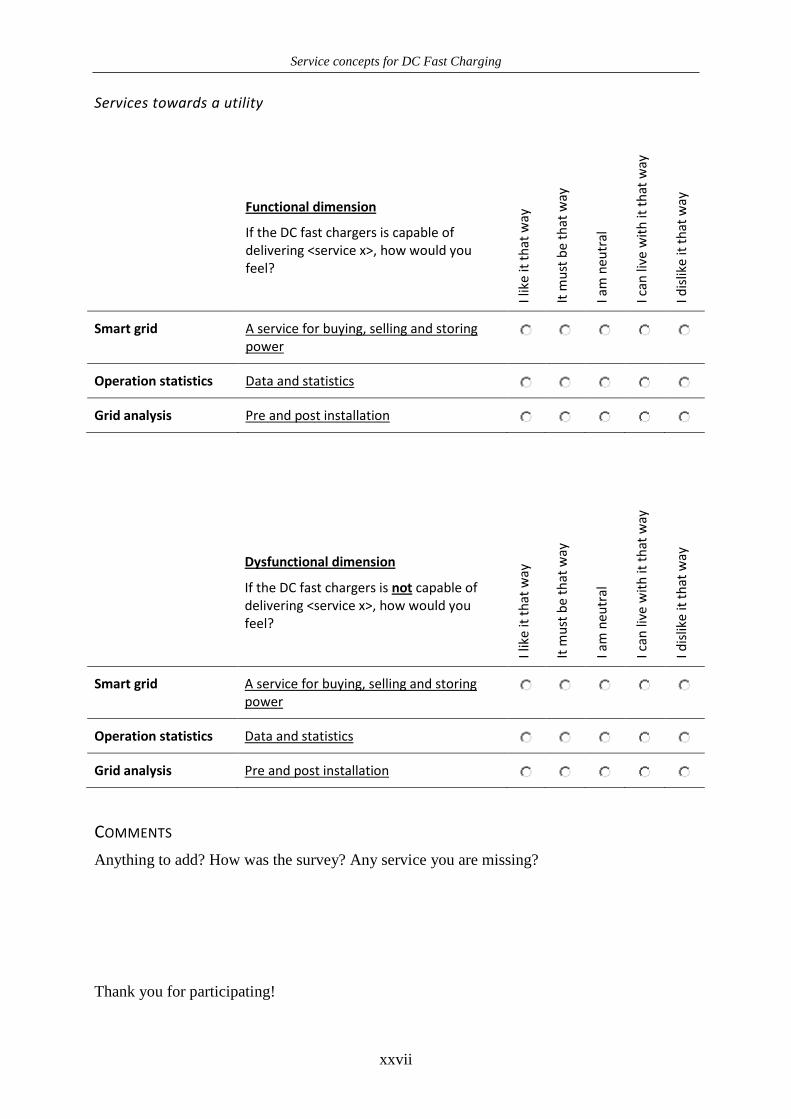
Service concepts for DC Fast Charging
xxvii
Services towards a utility
Functional dimension
If the DC fast chargers is capable of delivering <service x>, how would you feel?
I lik
e it
th
at w
ay
It m
ust
be
that
way
I am
neu
tral
I can
live
wit
h it
th
at w
ay
I dis
like
it t
hat
way
Smart grid A service for buying, selling and storing power
Operation statistics Data and statistics
Grid analysis Pre and post installation
Dysfunctional dimension
If the DC fast chargers is not capable of delivering <service x>, how would you feel?
I lik
e it
th
at w
ay
It m
ust
be
that
way
I am
neu
tral
I can
live
wit
h it
th
at w
ay
I dis
like
it t
hat
way
Smart grid A service for buying, selling and storing
power
Operation statistics Data and statistics
Grid analysis Pre and post installation
COMMENTS
Anything to add? How was the survey? Any service you are missing?
Thank you for participating!
Service concepts for DC Fast Charging
xxviii
APPENDIX 7. INTERNAL QUESTIONNAIRE
Dear ABB employee,
I am doing a project for the DC fast charging product that ABB is developing for electrical
vehicles. The task is to evaluate which service concepts ABB should offer together with the
hardware of the fast charger.
A few service ideas have been identified that potentially could be offered to customers. These
concepts will be evaluated from four perspectives; customer perception, monetary value,
competitive advantage and strategic fit. Strategic fit will be measured by ABB’s internal
perspective; and this is where you come in.
PURPOSE
The purpose of this questionnaire is to get a better view of which services that has a strategic
fit with ABB. For each service I would like to measure three dimensions.
- Fit with current organization (ABB competence/knowledge alignment – measured by
an estimate if ABB has competence to deliver the service)
- Ease of offering (infrastructure and resources for delivery – measured by at which
organizational level the resources and capabilities exists)
- Ease of developing (in terms of hardware adoptions, resources, staff and processes –
measured from very easy to very hard)
The assessment is relative between all the different services and subjective to what you think.
The goal is to be able to relate different services to each other and see which has the best or
worst performance in strategic fit. This will be used as an input when further developing the
full service concepts for ABB.
Questions? Please call +41788332232 questionnaire service hotline and I will assist you.
Once the survey is completed, please save and send it back to [email protected].
Sincerely,
David Gustafsson

Service concepts for DC Fast Charging
xxix
DEMOGRAPHICS
Name (optional)
Position
ABB department
FAQ
WHAT IS OFFERED IN TERMS OF HARDWARE?
A fast charger provides a solution for the so called “range anxiety problem”. When an EV
owner gets into his car he need to be sure that he will get back to his house where the car is
charged over night. 10% of the charging is estimated to be on public fast charging locations
where the driver can fill his/her battery. Charging times varies between 10 to 60 minutes
depending on battery and power.
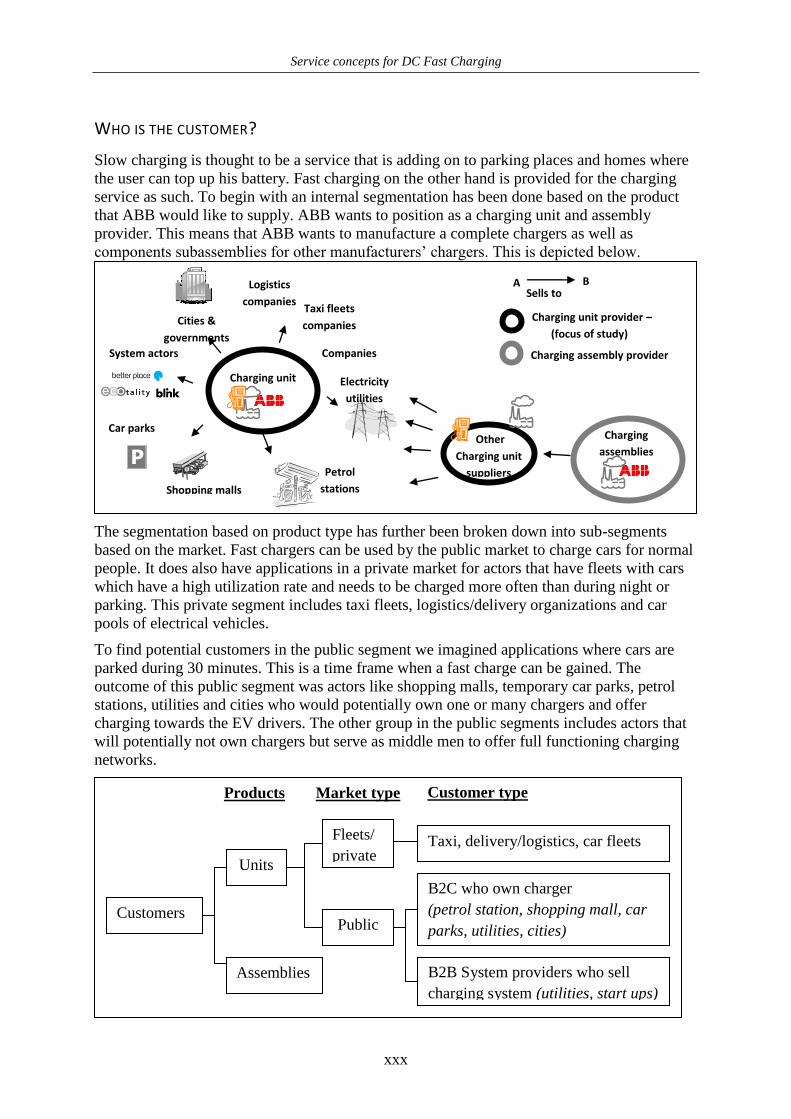
Service concepts for DC Fast Charging
xxx
WHO IS THE CUSTOMER?
Slow charging is thought to be a service that is adding on to parking places and homes where
the user can top up his battery. Fast charging on the other hand is provided for the charging
service as such. To begin with an internal segmentation has been done based on the product
that ABB would like to supply. ABB wants to position as a charging unit and assembly
provider. This means that ABB wants to manufacture a complete chargers as well as
components subassemblies for other manufacturers’ chargers. This is depicted below.
The segmentation based on product type has further been broken down into sub-segments
based on the market. Fast chargers can be used by the public market to charge cars for normal
people. It does also have applications in a private market for actors that have fleets with cars
which have a high utilization rate and needs to be charged more often than during night or
parking. This private segment includes taxi fleets, logistics/delivery organizations and car
pools of electrical vehicles.
To find potential customers in the public segment we imagined applications where cars are
parked during 30 minutes. This is a time frame when a fast charge can be gained. The
outcome of this public segment was actors like shopping malls, temporary car parks, petrol
stations, utilities and cities who would potentially own one or many chargers and offer
charging towards the EV drivers. The other group in the public segments includes actors that
will potentially not own chargers but serve as middle men to offer full functioning charging
networks.
Public
Units
B2C who own charger
(petrol station, shopping mall, car
parks, utilities, cities)
B2B System providers who sell
charging system (utilities, start ups)
Assemblies
Customers
Fleets/
private Taxi, delivery/logistics, car fleets
Market type Products Customer type
Charging unit System actors
Electricity
utilities
Cities &
governments Taxi fleets
companies
Petrol
stations Shopping malls
Companies
Car parks Other
Charging unit
suppliers
Charging
assemblies
Charging unit provider –
(focus of study) Charging assembly provider
Logistics
companies A
Sells to B

Service concepts for DC Fast Charging
xxxi
MEASUREMENT SCALE
The dimensions will be measured with a Likert-scale from 1 to 5.
- Fit with current organization (does ABB’s competences and knowledge align with the
service idea?).
6. no match
7. bad match
8. partly matching
9. good match
10. perfect match
- Ease of offering (has infrastructure and resources for delivering service idea)
6. Through partner
7. Centrally from ABB
8. ATP/eMobility CH
9. Regional service
10. Global/local service
- Ease of developing (“Making” hardware, resources, staff and/or processes)
6. Very hard
7. Hard
8. Moderate
9. Easy
10. very easy
ENABLING MACROS
This questionnaire requires that macros are enabled.
In Word 2003 this is done by:
tools->macros->security. Or selected when the document is opened.
In Word 2007 macros are enabled by:
Click the Microsoft Office Button , and then click Word Options.
Click Trust Center, click Trust Center Settings, and then click Macro Settings.

Service concepts for DC Fast Charging
xxxii
PRODUCT AND LIFE CYCLE RELATED SERVICES
Please answer each of the criteria with a number from 1 to 5 according to the measurement
definition on page 4. Fit
wit
h c
urr
ent
org
aniz
atio
n (
AB
B
com
pet
ence
/kn
ow
led
ge a
lign
men
t)
Ease
of
off
erin
g (i
nfr
astr
uct
ure
an
d
reso
urc
es f
or
del
iver
y)
Ease
of
dev
elo
pin
g (m
akin
g h
ard
war
e,
reso
urc
es, s
taff
an
d p
roce
sses
)
Sho
uld
be
par
t o
f o
ffer
?
Sales Sales and presentation services (i.e. for proving business case and charger technology)
Consulting
Network design (complete sizing, specification, optimization of a charging unit network)
Unit sizing (with for specific grid requirements)
Location analysis (does the grid cope with fast chargers, how many?, where is the best place to put them)
Cost of connection minimization
Project management
Installation
Location specific adoptions (civil engineering)
Commissioning
Balance of plant (optimization of a running charging facility)
Training For maintaining charging station
For operating charging network equipment
Documentation

Service concepts for DC Fast Charging
xxxiii
Please answer each of the criteria with a number from 1 to 5 according to the measurement
definition on page 4. Fit
wit
h c
urr
ent
org
aniz
atio
n
(AB
B c
om
pet
ence
/kn
ow
led
ge
alig
nm
ent)
Ea
se o
f o
ffer
ing
(in
fras
tru
ctu
re
and
res
ou
rces
fo
r d
eliv
ery)
Ease
of
dev
elo
pin
g (m
akin
g h
ard
war
e, r
eso
urc
es, s
taff
an
d
pro
cess
es)
Sho
uld
be
par
t o
f o
ffer
?
Operation Network operation (running the network of charging stations)
Replacement, reconditioning updates and upgrades
Hardware update (for new vehicle connections and to meet new charging levels)
Software (for new standards, new features)
Field service Spare parts
Repair service
Troubleshooting service (using remote control and monitoring, investigate fault remotely)
Maintenance Preventative (scheduled maintenance)
Predictive (using remote monitoring to foresee when components are worn)
Consulting System optimization (using the system the best way when it is operating)
End of life Recycling
Re-buy and re-sell (complete units or parts)
Non life cycle related
Service contacts (packages with a certain service level and including maintenance, remote control, operation and/or training. Also operational guarantees/availability)
Financial services (i.e. renting charging station or payment options)
Warranty (i.e. five years)
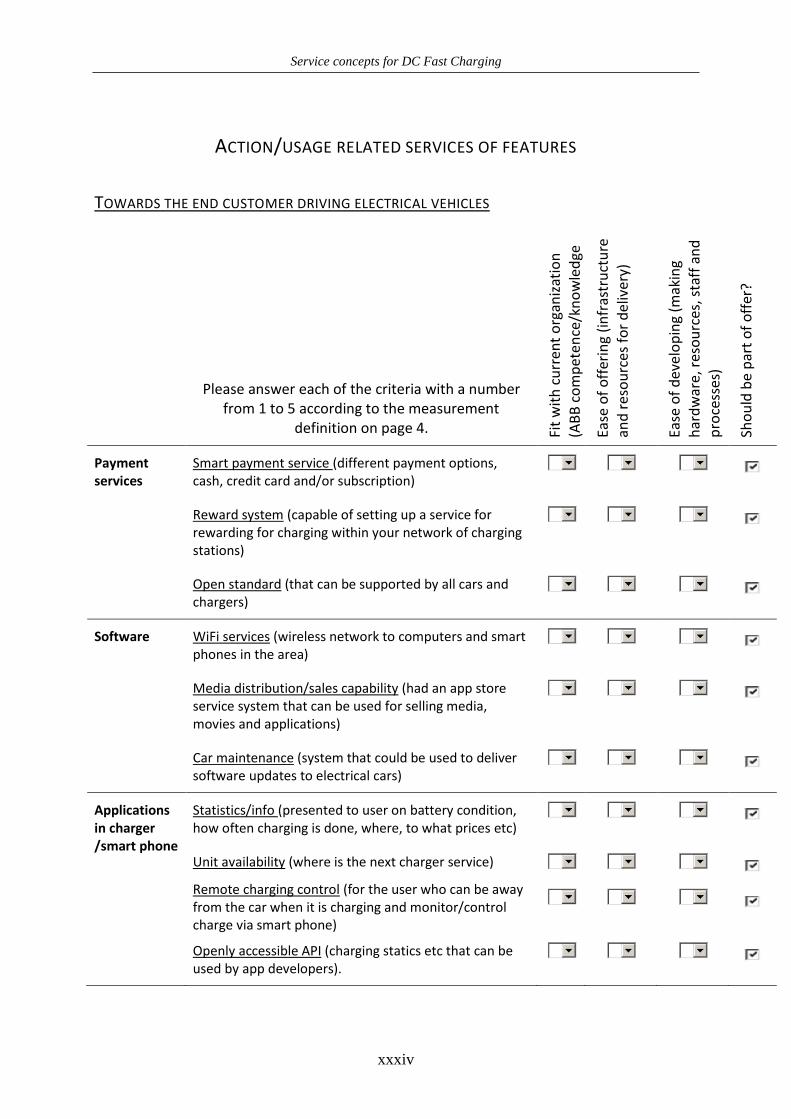
Service concepts for DC Fast Charging
xxxiv
ACTION/USAGE RELATED SERVICES OF FEATURES
TOWARDS THE END CUSTOMER DRIVING ELECTRICAL VEHICLES
Please answer each of the criteria with a number from 1 to 5 according to the measurement
definition on page 4. Fit
wit
h c
urr
ent
org
aniz
atio
n
(AB
B c
om
pet
ence
/kn
ow
led
ge
alig
nm
ent)
Ea
se o
f o
ffer
ing
(in
fras
tru
ctu
re
and
res
ou
rces
fo
r d
eliv
ery)
Ease
of
dev
elo
pin
g (m
akin
g h
ard
war
e, r
eso
urc
es, s
taff
an
d
pro
cess
es)
Sho
uld
be
par
t o
f o
ffer
?
Payment services
Smart payment service (different payment options, cash, credit card and/or subscription)
Reward system (capable of setting up a service for rewarding for charging within your network of charging stations)
Open standard (that can be supported by all cars and chargers)
Software WiFi services (wireless network to computers and smart phones in the area)
Media distribution/sales capability (had an app store service system that can be used for selling media, movies and applications)
Car maintenance (system that could be used to deliver software updates to electrical cars)
Applications in charger /smart phone
Statistics/info (presented to user on battery condition, how often charging is done, where, to what prices etc)
Unit availability (where is the next charger service)
Remote charging control (for the user who can be away from the car when it is charging and monitor/control charge via smart phone)
Openly accessible API (charging statics etc that can be used by app developers).
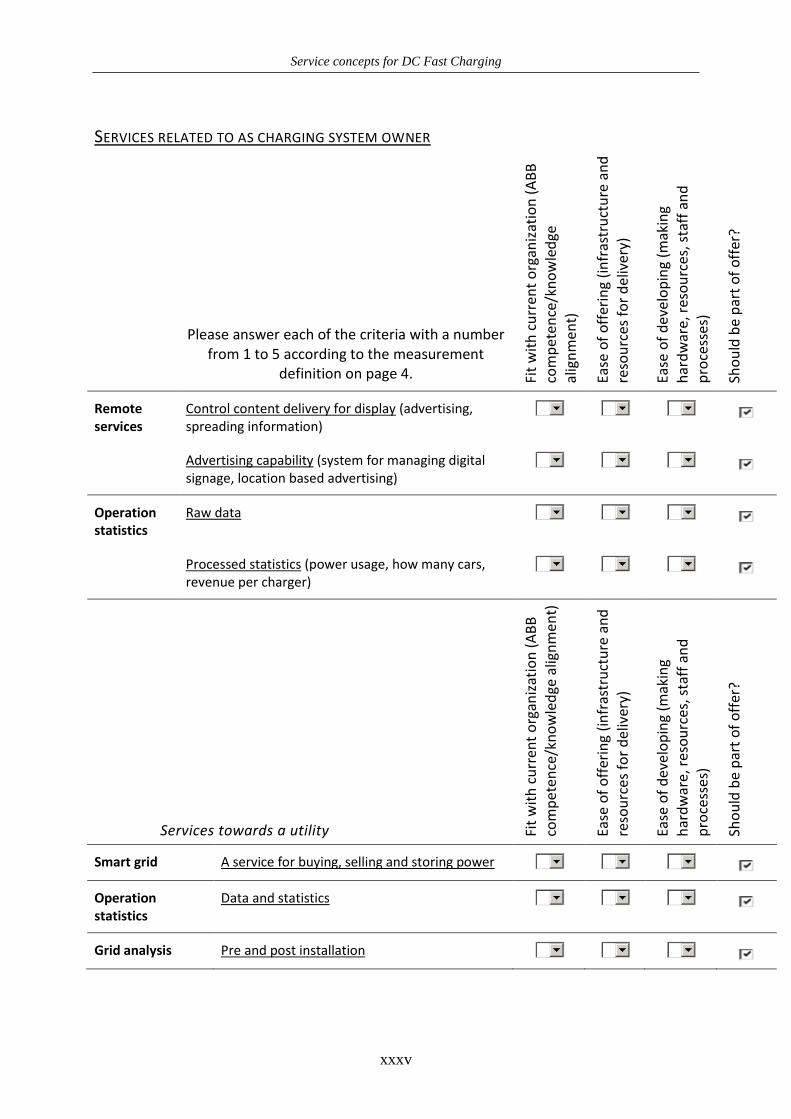
Service concepts for DC Fast Charging
xxxv
SERVICES RELATED TO AS CHARGING SYSTEM OWNER
Please answer each of the criteria with a number from 1 to 5 according to the measurement
definition on page 4. Fit
wit
h c
urr
ent
org
aniz
atio
n (
AB
B
com
pet
ence
/kn
ow
led
ge
alig
nm
ent)
Ease
of
off
erin
g (i
nfr
astr
uct
ure
an
d
reso
urc
es f
or
del
iver
y)
Ease
of
dev
elo
pin
g (m
akin
g h
ard
war
e, r
eso
urc
es, s
taff
an
d
pro
cess
es)
Sho
uld
be
par
t o
f o
ffer
?
Remote services
Control content delivery for display (advertising, spreading information)
Advertising capability (system for managing digital signage, location based advertising)
Operation statistics
Raw data
Processed statistics (power usage, how many cars, revenue per charger)
Services towards a utility Fit
wit
h c
urr
ent
org
aniz
atio
n (
AB
B
com
pet
ence
/kn
ow
led
ge a
lign
men
t)
Ease
of
off
erin
g (i
nfr
astr
uct
ure
an
d
reso
urc
es f
or
del
iver
y)
Ease
of
dev
elo
pin
g (m
akin
g h
ard
war
e, r
eso
urc
es, s
taff
an
d
pro
cess
es)
Sho
uld
be
par
t o
f o
ffer
?
Smart grid A service for buying, selling and storing power
Operation statistics
Data and statistics
Grid analysis Pre and post installation
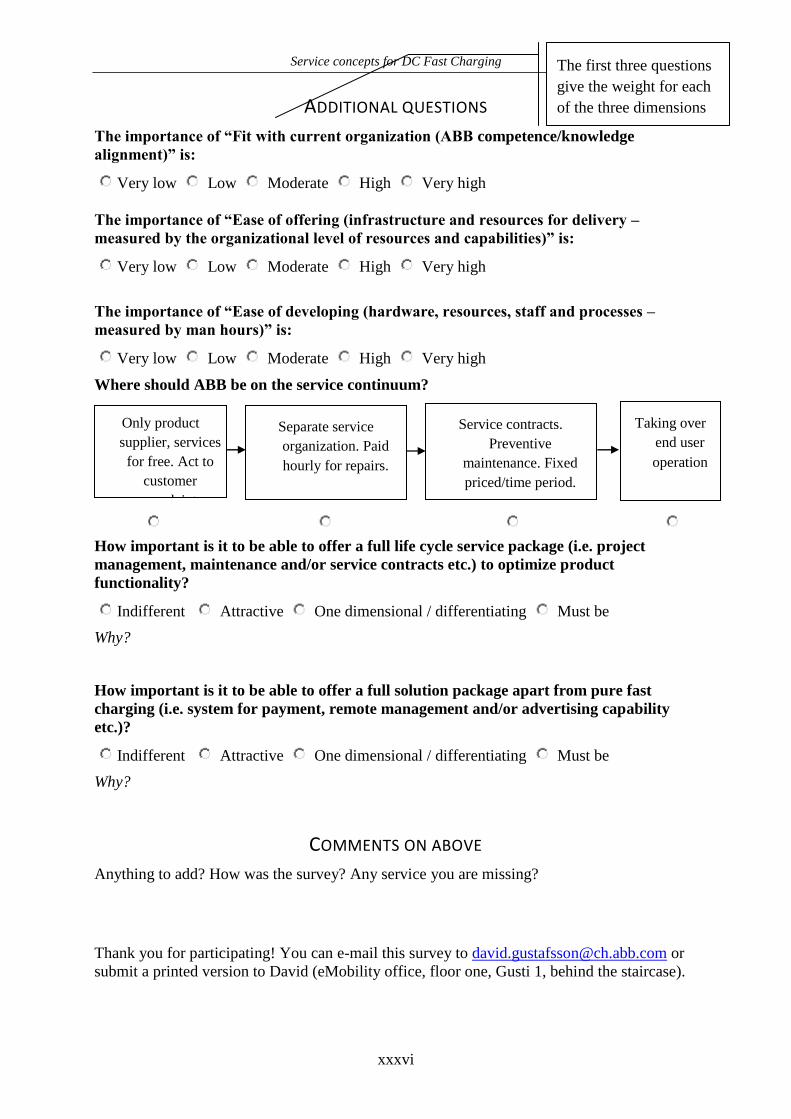
Service concepts for DC Fast Charging
xxxvi
ADDITIONAL QUESTIONS
The importance of “Fit with current organization (ABB competence/knowledge
alignment)” is:
Very low Low Moderate High Very high
The importance of “Ease of offering (infrastructure and resources for delivery –
measured by the organizational level of resources and capabilities)” is:
Very low Low Moderate High Very high
The importance of “Ease of developing (hardware, resources, staff and processes –
measured by man hours)” is:
Very low Low Moderate High Very high
Where should ABB be on the service continuum?
How important is it to be able to offer a full life cycle service package (i.e. project
management, maintenance and/or service contracts etc.) to optimize product
functionality?
Indifferent Attractive One dimensional / differentiating Must be
Why?
How important is it to be able to offer a full solution package apart from pure fast
charging (i.e. system for payment, remote management and/or advertising capability
etc.)?
Indifferent Attractive One dimensional / differentiating Must be
Why?
COMMENTS ON ABOVE
Anything to add? How was the survey? Any service you are missing?
Thank you for participating! You can e-mail this survey to [email protected] or
submit a printed version to David (eMobility office, floor one, Gusti 1, behind the staircase).
Only product
supplier, services
for free. Act to
customer
complaints
Separate service
organization. Paid
hourly for repairs.
Taking over
end user
operation
Service contracts.
Preventive
maintenance. Fixed
priced/time period.
The first three questions
give the weight for each
of the three dimensions
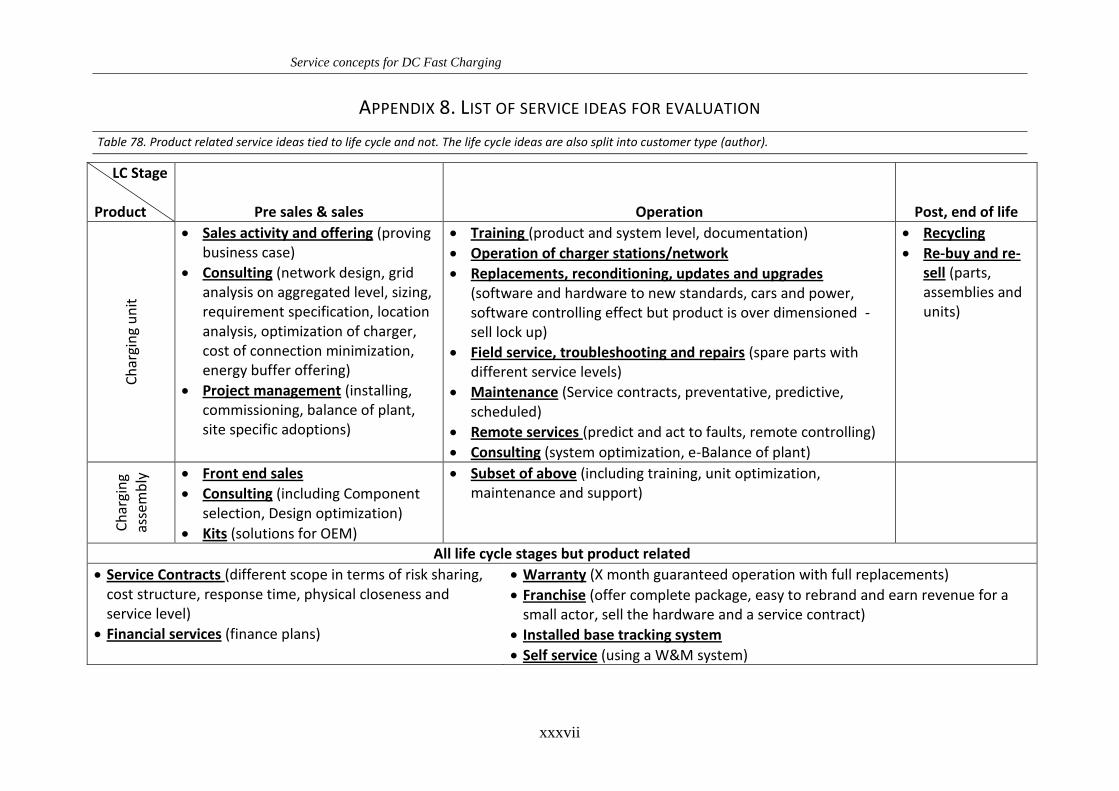
Service concepts for DC Fast Charging
xxxvii
APPENDIX 8. LIST OF SERVICE IDEAS FOR EVALUATION
Table 78. Product related service ideas tied to life cycle and not. The life cycle ideas are also split into customer type (author).
LC Stage Product Pre sales & sales Operation Post, end of life
Ch
argi
ng
un
it
Sales activity and offering (proving business case)
Consulting (network design, grid analysis on aggregated level, sizing, requirement specification, location analysis, optimization of charger, cost of connection minimization, energy buffer offering)
Project management (installing, commissioning, balance of plant, site specific adoptions)
Training (product and system level, documentation)
Operation of charger stations/network
Replacements, reconditioning, updates and upgrades (software and hardware to new standards, cars and power, software controlling effect but product is over dimensioned - sell lock up)
Field service, troubleshooting and repairs (spare parts with different service levels)
Maintenance (Service contracts, preventative, predictive, scheduled)
Remote services (predict and act to faults, remote controlling)
Consulting (system optimization, e-Balance of plant)
Recycling
Re-buy and re-sell (parts, assemblies and units)
Ch
argi
ng
asse
mb
ly Front end sales
Consulting (including Component selection, Design optimization)
Kits (solutions for OEM)
Subset of above (including training, unit optimization, maintenance and support)
All life cycle stages but product related
Service Contracts (different scope in terms of risk sharing, cost structure, response time, physical closeness and service level)
Financial services (finance plans)
Warranty (X month guaranteed operation with full replacements)
Franchise (offer complete package, easy to rebrand and earn revenue for a small actor, sell the hardware and a service contract)
Installed base tracking system
Self service (using a W&M system)
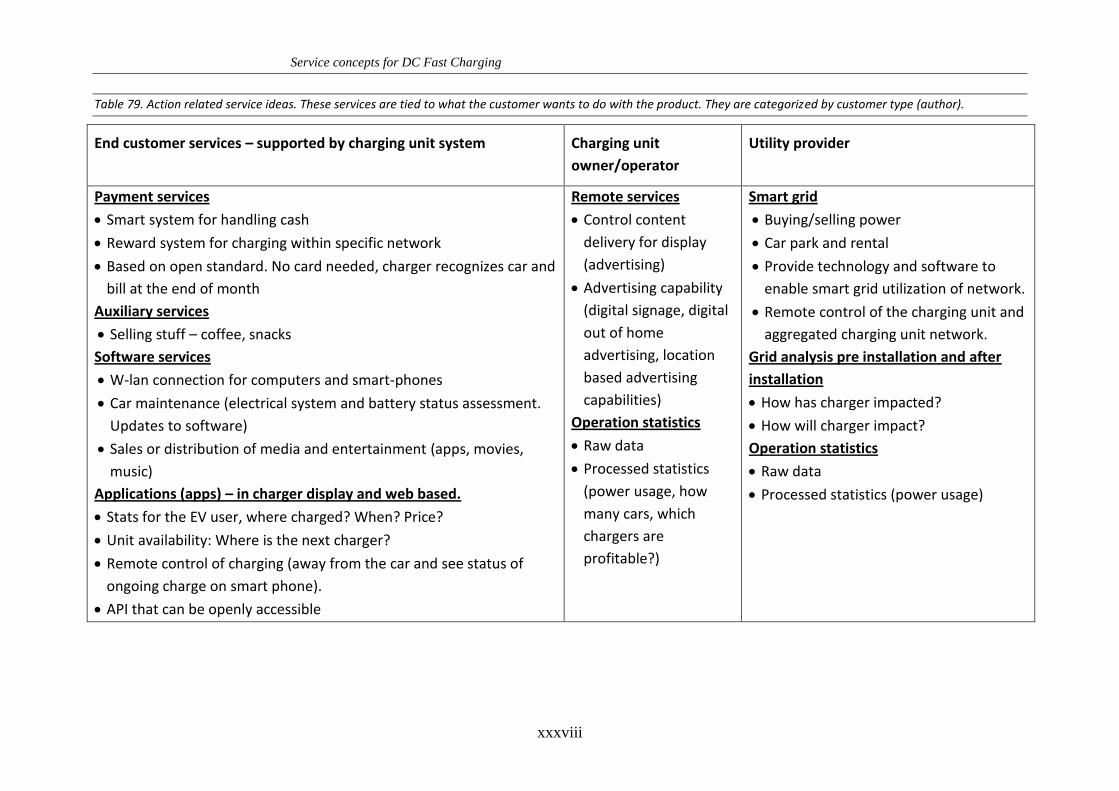
Service concepts for DC Fast Charging
xxxviii
Table 79. Action related service ideas. These services are tied to what the customer wants to do with the product. They are categorized by customer type (author).
End customer services – supported by charging unit system Charging unit
owner/operator
Utility provider
Payment services
Smart system for handling cash
Reward system for charging within specific network
Based on open standard. No card needed, charger recognizes car and
bill at the end of month
Auxiliary services
Selling stuff – coffee, snacks
Software services
W-lan connection for computers and smart-phones
Car maintenance (electrical system and battery status assessment.
Updates to software)
Sales or distribution of media and entertainment (apps, movies,
music)
Applications (apps) – in charger display and web based.
Stats for the EV user, where charged? When? Price?
Unit availability: Where is the next charger?
Remote control of charging (away from the car and see status of
ongoing charge on smart phone).
API that can be openly accessible
Remote services
Control content
delivery for display
(advertising)
Advertising capability
(digital signage, digital
out of home
advertising, location
based advertising
capabilities)
Operation statistics
Raw data
Processed statistics
(power usage, how
many cars, which
chargers are
profitable?)
Smart grid
Buying/selling power
Car park and rental
Provide technology and software to
enable smart grid utilization of network.
Remote control of the charging unit and
aggregated charging unit network.
Grid analysis pre installation and after
installation
How has charger impacted?
How will charger impact?
Operation statistics
Raw data
Processed statistics (power usage)

Service concepts for DC Fast Charging
xxxix
APPENDIX 9. SOURCES FOR COMPETITIVE DATA
Epyon http://www.epyonpower.com/Charginginfrastructure/Connection_standards.aspx
AeroVironment http://evsolutions.avinc.com/services/installer_network/
http://evsolutions.avinc.com/products/public_charging/#public_charging_b
Eaton http://www.eaton.com/Electrical/USA/ProductsandServices/Services/index.htm
Takaoka http://www.takaoka.co.jp/product/ev/faq.html
http://www.takaoka-eng.co.jp/english/maintenance.html
Takasago http://www.takasago-ss.co.jp/products/power_electronics/sp/tqvc/index.html
Nittetsu Elex http://www.ns-elex.co.jp/en/
Hasetec http://www.hasetec.co.jp/batterycharger/product.html
Siemens http://www.energy.siemens.com/hq/en/power-distribution/e-car.htm
http://www.siemens.com/innovation/en/highlights/energy/update_03/charging-electric-
vehicles.htm
SGTE http://www.sgte-power.com/documentation/sgte-dc-evqc01.pdf
http://www.sgte-power.com/mapage1/index-en.html
EFACEC http://www.efacec.pt/PresentationLayer/efacec_press_01.aspx?tipo=&area=1&idioma=2&id=299
ECOtality/Blink http://blinknetwork.com/media/kit/The%20Blink%20Network.pdf
http://www.blinknetwork.com/commercial/dc-fast-charger.php
Aker Wade http://akerwade.indigofiles.com/AWU-FleetManagement.pdf
http://www.akerwade.com/v.php?pg=71
Coulomb
Technologies
http://www.coulombtech.com/blog/tag/aker-wade/
http://www.coulombtech.com/products-charging-stations.php
RWE http://www.rweMobility.com/web/cms/en/236726/rwemobility/
http://www.eafturkey.com/assets/Uploads/JENS_MEYER.pdf
Schneider
Electric
http://www.greencarcongress.com/2010/07/evse-20100728.html
http://www.schneider-electric.com/sites/corporate/en/products-services/product-
launch/electric-vehicle/offer-presentation.page
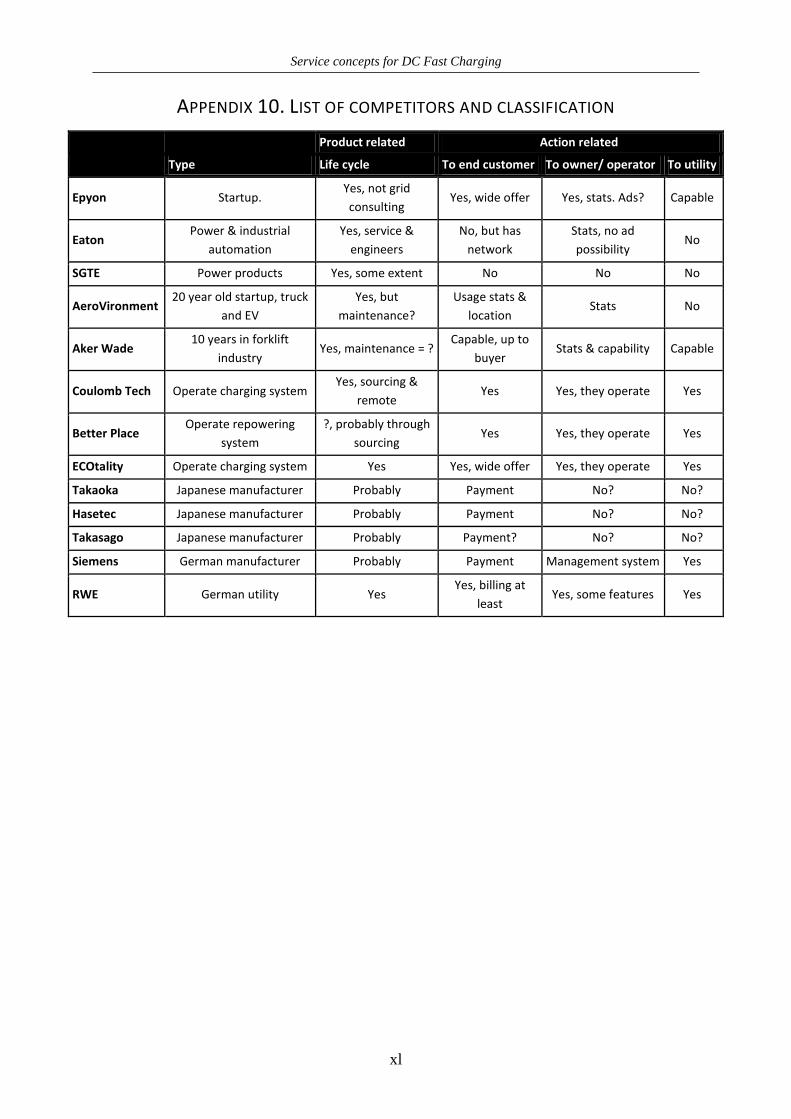
Service concepts for DC Fast Charging
xl
APPENDIX 10. LIST OF COMPETITORS AND CLASSIFICATION
Product related Action related
Type Life cycle To end customer To owner/ operator To utility
Epyon Startup. Yes, not grid
consulting Yes, wide offer Yes, stats. Ads? Capable
Eaton Power & industrial
automation
Yes, service &
engineers
No, but has
network
Stats, no ad
possibility No
SGTE Power products Yes, some extent No No No
AeroVironment 20 year old startup, truck
and EV
Yes, but
maintenance?
Usage stats &
location Stats No
Aker Wade 10 years in forklift
industry Yes, maintenance = ?
Capable, up to
buyer Stats & capability Capable
Coulomb Tech Operate charging system Yes, sourcing &
remote Yes Yes, they operate Yes
Better Place Operate repowering
system
?, probably through
sourcing Yes Yes, they operate Yes
ECOtality Operate charging system Yes Yes, wide offer Yes, they operate Yes
Takaoka Japanese manufacturer Probably Payment No? No?
Hasetec Japanese manufacturer Probably Payment No? No?
Takasago Japanese manufacturer Probably Payment? No? No?
Siemens German manufacturer Probably Payment Management system Yes
RWE German utility Yes Yes, billing at
least Yes, some features Yes


Service Concepts for DC Fast Charging
DAVID GUSTAFSSON
Service development is often an ad-hoc process within companies that follows when a product already is
launched. At ABB ATPS, Switzerland, management wanted to take a proactive approach to developing services
for the DC fast charging product for electrical cars (the so called eMobility market). The purpose of this project
has been to identify and evaluate different ideas for services around the DC fast charger and finally post
recommendations for which service concepts that should be undertaken by ABB.
The thesis has made internal brainstorms, customer interviews and service industry benchmarks to find ideas for
services and inspiration for service evaluation. To evaluate those ideas surveys were distributed to both
customers (a Kano survey) and internal ABB. This enabled studying market requirements, internal strategic fit,
internal strategic intent and the alignment between customer requirements and strategic fit. In total fifteen
interviews and nine surveys were collected from customers and ten from internal ABB.
The study has found that customers are mostly keen on simple services with a clear value add. It has also been
found that more technically immature customers, such as cities, have higher requirements for solutions compared
to for example utilities. Six general concepts were finally developed from the service idea evaluation:
Sales service
Consulting
Commissioning
Services during the products operational life
End of life services
Action related services
In the report these services are presented together with their evaluation data, an analysis of how the concepts can
be performed and estimations of their respective business cases.
© TOMAS DAVID EMANUEL GUSTAFSSON (2011).
www.davidgustafsson.com
Technical report no E2011:021
Department of Operations Management
Chalmers University of Technology
SE-412 96 Göteborg
Sweden
Telephone + 46 (0)31-772 1000
Looking for a young talented business developer and
entrepreneur?
Find my CV at www.davidgustafsson.com or follow me at
www.techonomics.se.