Service and Resource Planning · · 2015-06-19on the premise of fairness and protecting the most...
180
Chief Executive’s Office April 2015 Service and Resource Planning Financial Plan 2015/16 - 2017/18 and Service Analysis 2015/16
Transcript of Service and Resource Planning · · 2015-06-19on the premise of fairness and protecting the most...

Chief Executive’s Office
April 2015
Service and Resource
Planning
Financial Plan 2015/16 - 2017/18
and
Service Analysis 2015/16


Preface
This book provides an overview of the council’s planned expenditure and funding and
financial strategy for 2015/16 to 2017/18.
It also includes for each of the five directorates:
• The business strategy for 2015/16 to 2017/18 agreed in February 2015;
• The detailed revenue budget for 2015/16 by service area;
• A summary of the 2015/16 budgeted income and expenditure;
• Budget changes built into the medium term financial plan for 2015/16 and the following
two years.
The council's contribution to budgets managed managed jointly with Oxfordshire Clinical
Commissioning Group (OCCG) are shown as part of the budgets for Social &
Community Services.
The Council’s capital programme which shows planned expenditure on new or improved
school buildings and roads, for example, is also included.
The medium term financial plan contained in this booklet also forms part of the
Oxfordshire County Council Corporate Plan 2015/16 to 2017/18. The financial plans will
support the achievement of the council’s ambition for a county where local residents and
businesses can flourish through:
• A Thriving Economy – with small businesses starting, existing small businesses
growing, and large businesses choosing to locate in Oxfordshire, creating good jobs for
local people. A strong economy makes everything else possible.
• Thriving People and Communities – where residents are empowered to help
themselves and can contribute to what happens locally, and where everyone can make
informed decisions about their health and wellbeing.
• A Safety Net – where we support some of the county’s most vulnerable residents,
focusing on those we have a duty to consider, such as older people, disabled adults,
and children.
This publication complements Oxfordshire County Council’s services and council tax
leaflet for 2015/16. This is available on the Council's website
www.oxfordshire.gov.uk/cms/content/council-spending. It explains how the council tax is
spent and provides a summary of the 2015/16 budget.
For more information please contact Kathy Wilcox on (01865 323981) or e-mail
1.1


Introduction 1.3
Council Summary Information
Medium Term Financial Strategy 2015/16 to 2017/18 1.6
Summary Medium Term Financial Plan 2015/16 to 2017/18 1.10
Explanatory Notes to the Medium Term Financial Plan 1.11
Detailed Medium Term Financial Plan 2015/16 to 2017/18 1.13
Summary of Budget Changes 2015/16 to 2017/18 1.14
Estimated Reserves and Balances 2015/16 to 2017/18 1.15
Earmarked Reserves 1.16
1.19
Expenditure and Income Analysis - 2015/16 1.20
Government Grants - 2014/15 and 2015/16 1.21
Other Income - 2015/16 1.25
Strategic Measures 1.26
Staffing Summary 1.28
Financing and Trend Data
Financing Oxfordshire County Council 2.2
Financing Oxfordshire County Council - Trends 2011/12 to 2015/16 2.3
Council Tax - Values for 2015/16 and Increases since 2011/12 2.4
Council Tax - Population, Tax Bases and Council Tax Statistics 2.5
Directorate Business Strategies and Detailed Financial Information
Children, Education & Families 3.1
Social & Community Services 4.1
Environment & Economy 5.1
Chief Executive's Office 6.1
Public Health 7.1
Capital Programme
Capital Programme 2014/15 to 2018/19 8.1
Glossary of Terms
Glossary of Terms 9.1
Contents
Subjective Analysis of Council's Revenue Expenditure and Income by Service Area
1.2


Introduction
2015/16 is the second year of the four-year directorate business strategies agreed by Council in
February 2014. These build on the previous strategies agreed in 2011, and have not been
extended beyond 2017/18 due to uncertainty over future levels of government funding.
Sustained reductions in Government funding combined with pressure to restrict Council Tax
increases have resulted in a significant squeeze on Council resources over recent years, at a
time when demand for services has been increasing. The Corporate Plan for 2014/15 set out
that over the period 2010/11 to 2017/18 the Council planned to save £265m to offset funding
reductions and to meet additional expenditure pressures.
On-going expenditure pressures that were not anticipated when those savings were agreed have
been highlighted in the Financial Monitoring and Business Strategy Delivery reports to Cabinet
throughout 2014/15. Additional savings of £27m over that period are now required to manage
these pressures, bringing the total savings over the period 2010/11 to 2017/18 to £292m.
On 18 December 2014, Performance Scrutiny Committee was invited to consider and comment
upon the directorate business strategies and new revenue pressures and savings proposals.
Capital proposals were considered by the Committee on 8 January 2015.
The Cabinet published its budget proposals and its recommended Budget, Medium Term
Financial Plan and Capital Programme on 27 January 2015. The budget proposals were built
on the premise of fairness and protecting the most vulnerable from the impact of any cuts, as
well as raising income, where possible, so that reductions in service budgets are less
challenging. Some of the savings have been used to re-invest in priority areas.
In setting its budget the Council must set a Council Tax Requirement, which is the amount of
funding required to be raised from Council Tax to meet the expenditure plans of the authority
after taking into account all other funding. Council approved the Cabinet’s recommended Council
Tax Requirement for 2015/16 of £288.2m on 17 February 2015. This was based on a Band D
Council Tax of £1,232.46, an increase of 1.99% from the previous year.
The Capital Programme, also approved on 17 February 2015 includes planned expenditure of
£127.4m for 2015/16. £96.6m of the total expenditure will be funded by grants and
contributions, £15.1m through prudential borrowing and £15.7m through use of capital receipts.
Lorna Baxter, Chief Finance Officer
The purpose of this booklet is to provide information on the Council's revenue and capital
budgets for 2015/16 and over the medium term, how these budgets are financed and detail on
the budget by Directorate and service area.
1.3

Key Data
2014/15 2015/16
£000 £000
872,874 Gross Expenditure 831,083
-359,926 less Government Grants -340,495
-82,665 less Income -66,007
-80,623 less Revenue Support Grant -62,305
-36,390 less Business Rates Top-Up -37,085
-28,607 less Business Rates from District Councils -29,466
-6,929 less Council Tax Surpluses -7,472
277,734 = Council Tax Requirement 288,253
1.99% Increase in Council Tax 1.99%
£1,208.41 Council Tax (Band D) £1,232.46
£000 %
2014/15 Gross Expenditure 872,874
Permanent Virements Agreed in 2014/15 -21,643 -2.5%
Inflation 4,060 0.5%
Function and Grant Changes -15,017 -1.7%
Previously Agreed Budget Changes -12,096 -1.4%
Variation to Existing MTFP (agreed 2015/16) 6,243 0.7%
Virements -3,338 -0.4%
2015/16 Gross Expenditure 831,083 -4.8%
£000 %
2014/15 Income (Including Grants) -442,591
Permanent Virements Agreed in 2014/15 21,643 -4.9%
Inflation -284 0.1%
Function and Grant Changes 17,153 -3.9%
Previously Agreed Budget Changes -8,588 1.9%
Variation to Existing MTFP (agreed 2015/16) -852 0.2%
Virements 7,017 -1.6%
2015/16 Income (Including Grants) -406,502 -8.2%
The following tables provide an analysis of the changes in the Council's gross expenditure and
income budgets from 2014/15 to 2015/16:
Introduction
This information has changed from the Council Tax Leaflet as more up-to-date information has become available. The
overall Council Tax Requirement remains the same.
1.4

Information
Council Summary
1.5

Use of grant funding
Balance sheet management
The Council actively manages its debtors and creditors position to reduce the demand for working capital
using the following targets:
Balances and Reserves
The use of general grant funding for both revenue and capital will be maximised;
Where grant bids are required, these need to be linked to the Council's objectives;
Exit strategies are required for grant bids and time-limited grants;
Directorates will be required to meet any reductions in ring-fenced grant funding, through cessation or
projects/services or additional savings.
Debtors - we will clear 97% of non-care debtors and unsecured care debtors within 90 days. Days
revenue outstanding for non-care debts will be kept to 33 days or below, with a target of 62 days for care
debts;
Creditors - we will pay 97.5% of all undisputed invoices within normal payment terms. The Council's
standard payment terms are 14 days for small and medium size enterprises (SMEs), otherwise 28 days.
Balances will be maintained at a level commensurate with identified risks, based on an annual risk
assessment, subject to a minimum of 2.5% of gross expenditure (excluding schools). The risks reflect
unforeseen overspendings, unexpected events and emergencies such as severe weather, potential
liabilities and uncertainties over the future level of funding.
Any income which is fortuitous to the Council will be used to address an adverse cash flow position in the
medium term financial plan or otherwise be added to balances;
Revenue reserves will be held for specified purposes only and reviewed on an annual basis;
New revenue reserves require approval by The Cabinet.
The allocation of resources to meet statutory service requirements and key strategic priorities
The reducing level of financial support from Government and consequential revenue savings required
over The medium term
The use of one-off income to meet one-off pressures or priorities, or to help address an adverse cash flow
position in the MTFP (where planned pressures exceed planned savings in the short-term)
Our commitment to council tax payers
Our on-going commitment to achieve efficiencies to ensure improved value for money
The medium term financial plan aligns available revenue funding with the delivery of services through the
Service & Resource Planning process. Our financial planning reflects:
Medium Term Financial Strategy 2014/15 - 2017/18 (Refreshed for 2015/16)
The Financial Strategy sets out how the Council intends to finance its services and priorities and the principles
upon which the medium term financial plan and the capital programme are based.
The Financial Strategy was fully revised and updated during the 2014/15 Service & Resource Planning round
to coincide with the new administration and to incorporate the Capital Strategy, previously treated as a
separate document. Given the proposal to continue with the existing medium term financial plan, making
limited adjustments where necessary, the existing Financial Strategy has been refreshed.
Corporate Plan
The Service & Resource Planning process ensures the medium term financial plan (MTFP), capital
programme and directorate business strategies reflect the Council’s objectives and priorities set out in the
corporate plan.
The corporate plan is revised every year and the current plan for 2014/15 to 2017/18, agreed by Council in
April 2014 has also been refreshed for 2015/16. The plan outlines the Council’s overall goal of achieving a
‘Thriving Oxfordshire’ and sets out how we are working towards that goal.
Financial Planning
1.6

Invest to save schemes which generate sufficient revenue savings to cover the cost of capital within at least
10 years, or are self-financed through prudential borrowing will be considered on a case by case basis
alongside other bids which are subject to prioritisation.
Schemes below a certain financial threshold value will be assessed as part of an overall programme rather
than individually.
Priority 6:
projects which maximise leverage from external partnerships and bodies (e.g. Local Growth
Board) in order to deliver agreed infrastructure priorities.
projects where a major proportion is funded from developer contributions, Community
Infrastructure Levy, grant or revenue contributions.
projects that facilitate economic development and housing growth but require the majority of
funding to be met from the Council.
projects that address cross-cutting issues, facilitate joint-working with partners or generate new/
additional income.
other projects.
Priority 5:
projects which enable compliance with our legal/ statutory duties including projects which address
any infrastructure deficits related to statutory compliance.
Priority 1:
Priority 2:
Priority 3:
Priority 4:
This gives the following capital investment priorities:
The capital strategy provides a framework for the development of the capital programme and ensures that the
use of limited capital resources accords with the Council’s objectives and priorities as set out in the Corporate
Plan. The latter is achieved by having asset management plans for the two main areas of asset holding:
The Asset Management Plan sets out the future direction for managing the Council’s property assets
and provides a strategic approach to securing operational and financial benefits of the property estate. It
reflects the changing needs of the property portfolio as the Council moves from being a service provider to
a commissioner of services.
The Transport Asset Management Plan sets out the prioritisation for investment in highway
infrastructure including roads, footways, bridges, street lighting and drainage, based on an assessment of
need, and incorporates the Local Transport Plan.
Allocating capital resources in line with corporate objectives and priorities and considering what outcomes
can be achieved by a particular project and how effectively it uses corporate capital resources.
Using capital resources prudently and flexibly in line with the agreed capital funding strategies to ensure
their affordability, longevity and sustainability.
Providing contingencies across the capital programme to manage the resources pressure arising from
housing growth and uncertainties related to on-going service transformations.
comply with our statutory duties;
The Council’s limited capital resources are managed effectively by:
Our principles for prioritising capital investment are to:
improve the efficient and effective delivery of our services; and
promote economic growth.
Capital Strategy
1.7

In order to respond effectively to unforeseen capital pressures and to accommodate possible changes in the
capital resources position, a 3% contingency is built into capital programme planning assumptions. This
provision and other capital programme contingencies are managed corporately and reviewed on a regular
basis based on the risks associated with the overall programme.
Managing our Resources Effectively
Financial management roles and responsibilities are transparent and embedded across Directorates.
Financial literacy is actively promoted throughout the organisation.
Appropriate systems and processes are in place to ensure effective in-year financial monitoring of
revenue and capital and delivery of business strategies.
Effective financial controls are in place in all areas of financial management, risk management and asset
control.
Financial Procedure Rules, Contract Procedure Rules and Financial Regulations are regularly reviewed
and updated, providing a sound basis for financial governance.
Capital resource allocations are considered corporately on the following basis:
Central government capital allocations and grants issued as “not ring-fenced” will be allocated in line
with the Council’s priorities based on this capital strategy and the underpinning asset management plans.
Ring-fenced or earmarked funding received from central government will be used for the purposes for
which it is issued in line with grant/allocation conditions.
Capital receipts will be treated as a corporate resource and not ring-fenced to the originating service.
The Council seeks to maximise capital receipts from the disposal of surplus land and buildings, unless
another option gives greater overall benefit.
Prudential borrowing will be used to fund invest-to-save schemes, where the cost of borrowing is met
from future revenue savings by services; or capital investment where the Council has a significant unmet
capital need, in which case the cost of borrowing is met corporately. The application of prudential
borrowing must be in line with the requirements of the Prudential Code.
The Council will try wherever possible to influence investment through the targeted use of its limited
capital resources to lever in external funding and project specific grants where these meet the
Council’s priorities and objectives. Any external resources, once secured, will be used for the purposes
for which they are issued as per the guidance and conditions determined by funding providers. The
Council will evaluate long-term implications of accepting any external funding provision, in particular any
impact on the revenue budget and such projects only proceed if they are affordable and demonstrate
value for money. This includes working within the broader context (such as the Local Growth Board) to
align available funding streams.
The Council will be proactive in ensuring, as far as possible, that all additional capital investment needs
arising from new developments are funded from developer contributions, however it is recognised that
this is unlikely to meet the scale of infrastructure investment provision needed to respond to the identified
level of growth.
The Community Infrastructure Levy (CIL) is likely to come into full operation across Oxfordshire from
April 2015. This levy based mechanism is a contribution from all new development towards the cost of
infrastructure. Developer contributions will still apply for site specific infrastructure required to mitigate the
impact of a specific development. As the Charging Authorities will be the District Councils in Oxfordshire,
the County Council will need to seek an agreement with each Charging Authority the contribution from CIL
towards the cost of services and infrastructure which it provides.
The Council will consider alternative funding models (such as Public Private Partnerships, Private
Finance Initiative, Local Asset Backed Vehicles, Tax Increment Financing and Local Authority Bonds) to
address potential future funding requirements, subject to full evaluation of requirements.
In financing the capital programme the first calls on capital resources will be external funding (including
developer contributions). This is followed by grants & contributions, supported borrowing and capital receipts
and reserves. The final calls, where necessary, will be on prudential borrowing.
1.8

The Annual Investment Strategy sets out the Council’s policies for managing its investments and for
giving priority to the security and liquidity of those investments.
The Procurement Strategy sets out how we achieve value for money and efficiencies in our procurement
of goods and services, supplier relationship management and contract management.
Revenue overspends will be the first call against any underspends within a directorate. Where overspends
cannot be offset by underspends, they will be carried forward into the following year and a clear plan for
their recovery will be required.
Revenue underspends not needed to offset overspends will be placed in corporate reserves to support the
MTFP.
The Cabinet may agree to the carry forward of a revenue underspend for a specific purpose on an
exceptional basis.
Related Strategies
The Financial Strategy is underpinned by more detailed strategies for particular areas, including the Treasury
Management Strategy, the Annual Investment Strategy and the Procurement Strategy.
The Treasury Management Strategy sets out the Council’s strategy for borrowing to ensure its capital
investment plans are affordable, prudent and sustainable.
Arrangements for carrying forward revenue budget under/overspends
1.9

2015/16 2016/17 2017/18
£000 £000 £000
Budget
Base Budget 430,283 424,581 421,614
Virements 2,437 0 0
Inflation Note 1 3,776 7,300 7,400
Function and Grant Changes Note 2 2,135 0 491
Previously Agreed Budget Changes Note 3 -20,940 -5,925 -5,370
Variation to Existing MTFP (Agreed in 2014/15) Note 4 6,890 -4,342 1,593
Net Operating Budget 424,581 421,614 425,728
Financing
Revenue Support Grant -62,305 -49,844 -39,875
Business Rates Top-Up -37,085 -37,901 -39,000
Business Rates from District Councils -29,466 -31,001 -31,900
Council Tax Surpluses -7,472 -3,000 -3,000
Council Tax Requirement 288,253 299,868 311,953
Council Tax Calculation
Council Tax Base 233,884 236,223 238,585
Council Tax (Band D equivalent) £1,232.46 £1,269.43 £1,307.51
Increase in Council Tax (Precept) 3.8% 4.0% 4.0%
Increase in Council Tax (Band D) 1.99% 3.00% 3.00%
Summary Medium Term Financial Plan 2015/16 to 2017/18
The Medium Term Financial Plan was agreed at Council on 17 February 2015
1.10

In 2015/16 inflation has been allocated as follows:
* Pay inflation 1.00%
* Contract inflation - in line with individual contracts, maximum 3.00%
* Prices inflation 0.00%
* Income inflation 2.00%
Note 2 : Function and Grant Changes
Note 3 : Previously Agreed Budget Changes
Note 4 : Variation to Existing MTFP (Agreed in 2015/16)
Previously agreed budget changes relate to the on-going effects of budget changes agreed in previous years
budget and medium term financial plans. They comprise of savings, funding given for investment proposals,
pressures, changes in capital financing costs and contributions to/from reserves. They relate to resources
either added to or deducted from the budget for specific purposes.
Previously agreed budget changes can be either temporary (e.g. a two year project, or a contribution from
balances) or on-going (e.g. funding for a new duty or responsibility), and are agreed by Council at the budget
setting meeting in February. Details for each Directorate are included in sections 3 to 7 of this booklet.
The following notes provide details about the variations which build up the budget as shown in the Summary
Medium Term Financial Plan (MTFP) on page 1.10. Details for each Directorate are provided later in this
booklet.
Note 1 : Inflation
Explanatory Notes to the Medium Term Financial Plan
Beyond 2015/16 inflation has been allowed for at 2.5% for pay, 0% for general price inflation, up to 3% for
contracts and specific items (in line with individual contracts) and 2% for income.
Function and grant changes are adjustments made to the budget to allow for transfers of specific grant into
or out of general grant funding and for new or amended duties.
The details of the grant changes are detailed on pages 1.21 to 1.24.
The Business Strategy & Service & Resource Planning process for 2010/11 to 2014/15 included planned
savings of £265m over the period 2010/11 - 2017/18. Further reductions announced in the 2014 Budget,
restrictions on the level of Council Tax increase imposed by referendum limits and new expenditure
pressures (particularly from demand led services) required additional savings of £27m over the period up to
2017/18. Details for each directorate are included in sections 3 to 7 of this booklet.
1.11

Decrease in Capital Financing costs
Net Interest on Balances
Contribution from reserves
Contingency
TOTAL ALLOWED VARIATIONS 1.5
There is a decrease in Capital Financing costs as the profile of prudential borrowing forecast in the existing
MTFP has changed and resulted in a saving of £1.0m. This is offset by a pressure on the interest budget as
there is a reduction in the rate of return expected on deposits. A corporate cotingency has been set aside
within the Strategic Measures budget in case directorates are unable to deliver savings or manage within
available resources.
The contribution from reserves includes the movement on the budget reserve. The budget reserve is being
used to manage the cash flow implications of the variations to the MTFP. The forecast for the budget
reserve shows an overdrawn balance by the end of 2016/17, this position will be reviewed as part of the
2016/17 Service & Resource Planning process.
Allowed variations totalling £1.5m for 2015/16 are included in the Variation to the Existing MTFP figure and
comprise variations on strategic measures and use of or addition to balances and reserves. The following
table summarises these changes with details set out in the Strategic Measures and the Balances and
Reserves pages of this document.
Explanatory Notes to the Medium Term Financial Plan
£m
-1.0
0.9
0.8
0.8
1.12

Detailed Medium Term Financial Plan 2015/16 to 2017/182015/16 2016/17 2017/18
Base Budget Agreed
Allocation
Agreed Budget Base Budget Indicative
Allocation
Indicative
Budget
Base Budget Indicative
Allocation
Indicative
Budget
£000 £000 £000 £000 £000 £000 £000 £000 £000
Directorate Budgets
Children, Education & Families 102,618 4,430 107,049 107,049 -4,200 102,849 102,849 -3,000 99,849
Social & Community Services 214,724 -5,976 208,748 208,748 -4,910 203,838 203,838 -4,906 198,932
Environment & Economy 81,532 -4,951 76,581 76,581 -3,983 72,598 72,598 -7,276 65,322
Chief Executive's Office 20,748 -1,955 18,793 18,793 -181 18,612 18,612 -278 18,334
Public Health -1,250 -1,250 -1,250 -1,250 -2,500
Inflation and Other Adjustments (1) 10,800 10,800 10,800 7,400 18,200
Directorate Budgets 419,621 -8,451 411,171 411,171 -3,724 407,447 407,447 -9,310 398,137
Strategic Measures
Capital Financing
Principal 17,023 -1,426 15,597 15,597 311 15,908 15,908 648 16,556
Interest 18,231 -60 18,171 18,171 303 18,473 18,473 -200 18,274
Interest on Balances -4,548 349 -4,199 -4,199 -1,708 -5,907 -5,907 -1,883 -7,789
Un-Ringfenced Specific Grants -14,832 -945 -15,777 -15,777 -600 -16,377 -16,377 491 -15,886
Contingency 3,476 553 4,029 4,029 4,029 4,029 6 4,035
Pensions - Past Service Deficit Funding 830 830 830 830 830 830
Total Strategic Measures 20,180 -1,529 18,651 18,651 -1,694 16,957 16,957 -938 16,019
Contributions to/from reserves
General Balances 3,000 -1,000 2,000 2,000 2,000 2,000 2,000
Prudential Borrowing Costs 950 950 950 950 950 950
Capital Rolling Fund Reserve 491 -3,032 -2,541 -2,541 2,541
Budget Reserve -13,960 9,215 -4,746 -4,746 -2,370 -7,116 -7,116 14,262 7,146
Directorate Earmarked Reserves -2,180 -2,180 -2,180 2,180
Business Rates Reserve 494 494 494 494 494 494
Insurance Reserve 781 781 781 100 881 881 100 981
Total Contributions to/from reserves -9,519 4,278 -5,241 -5,241 2,451 -2,790 -2,790 14,362 11,572
Indicative Balance
Net Operating Budget 430,283 -5,702 424,581 424,581 -2,967 421,614 421,614 4,115 425,728
Funding
Government Grant
Revenue Support Grant -80,623 18,318 -62,305 -62,305 12,461 -49,844 -49,844 9,969 -39,875
Business Rates Top-up -36,390 -695 -37,085 -37,085 -816 -37,901 -37,901 -1,099 -39,000
Total Government Grant -117,013 17,622 -99,390 -99,390 11,645 -87,745 -87,745 8,870 -78,875
Business Rates local share -28,833 -1,500 -30,334 -30,334 -667 -31,001 -31,001 -899 -31,900
Collection Fund Surplus/Deficit 226 642 868 868 -868 0
Council Tax Surpluses -6,929 -543 -7,472 -7,472 4,472 -3,000 -3,000 0 -3,000
COUNCIL TAX REQUIREMENT 277,734 10,519 288,253 288,253 11,615 299,868 299,868 12,085 311,953
(1) Adjustment for inflation and other items that have not yet been allocated by Directorate including National Insurance changes in 2016/17.
1.13

Details
2015/16 2016/17 2017/18
£000 £000 £000
Children, Education & Families
Virements 1,118
Inflation 501
Function and Funding Changes -956
Previously Agreed Budget Changes -924 -2,200 -3,000
Variations to the MTFP (Agreed in 2015/16) 4,692 -2,000
Total Children, Education & Families 4,431 -4,200 -3,000
Social & Community Services
Virements -1,664
Inflation 1,022
Function and Funding Changes 3,482
Previously Agreed Budget Changes -11,249 -685 -2,006
Variations to the MTFP (Agreed in 2015/16) 2,433 -4,225 -2,900
Total Social & Community Services -5,976 -4,910 -4,906
Environment & Economy
Virements 3,575
Inflation 2,131
Function and Funding Changes 0
Previously Agreed Budget Changes -10,128 -3,187 -7,276
Variations to the MTFP (Agreed in 2015/16) -529 -796 0
Total Environment & Economy -4,951 -3,983 -7,276
Chief Executive's Office
Virements -592
Inflation 122
Function and Funding Changes 0
Previously Agreed Budget Changes -280 -431 -278
Variations to the MTFP (Agreed in 2015/16) -1,205 250
Total Chief Executive's Office -1,955 -181 -278
Public Health
Virements
Inflation
Function and Funding Changes
Previously Agreed Budget Changes -1,250 -1,250
Variations to the MTFP (Agreed in 2015/16)
Total Public Health 0 -1,250 -1,250
Budget Changes and Inflation to be allocated to
Directorates in Future Years
10,800 7,400
TOTAL DIRECTORATE BUDGET CHANGES -8,451 -3,724 -9,310
The table below provides a summary of the changes to directorate budgets agreed in the
2015/16 to 2017/18 MTFP and the on-going effects of changes agreed in previous years'
budgets. Details of the budget changes and variations to the MTFP for each Directorate are
shown in sections 3 to 7 of this booklet.
Year on Year variation (at 2015/16 prices)
Summary of Directorate Budget Changes 2015/16 to 2017/18
1.14

Estimated Balances and Reserves 2015/16 to 2017/18
2015/16 2016/17 2017/18
£000 £000 £000
General Balances
Estimated Balances at start of year 17,517 17,517 17,517
Planned Contributions to Balances to meet required level
of balances in MTFP 2,000 2,000 2,000
Budgeted Change in Balances 2,000 2,000 2,000
Total Balances at Start of Year 19,517 19,517 19,517
Estimated Use of Balances in Year -2,000 -2,000 -2,000
Net Use of Balances -2,000 -2,000 -2,000
Estimated Balances at end of year 17,517 17,517 17,517
Earmarked Reserves
Estimated School Reserves at start of year 14,944 7,585 4,533
Estimated Reserves at start of year 72,919 42,534 30,567
Estimated Total Reserves at start of year 87,863 50,119 35,100
Estimated Use of (-) / Additions to (+) School Reserves in
Year-7,359 -3,052 -2,362
Estimated Use of (-) / Additions to (+) Reserves in Year-30,385 -11,967 5,704
Estimated School Reserves at end of year 7,585 4,533 2,171
Estimated Reserves at end of year 42,534 30,567 36,271
Estimated Total Reserves at end of year 50,119 35,100 38,442
The table below provides an analysis of estimated general balances and a summary of
earmarked reserves for 2015/16 to 2017/18 at the time the budget was agreed on 17 February
2015. Earmarked reserves include Schools' balances. As stated in the Financial Strategy
(Page 1.7), revenue balances will be maintained at a level commensurate with identified risks.
During the year the level of balances is reported through the Financial Monitoring Reports to
Cabinet.
1.15

£000 £000 £000 £000
Schools' Reserves 14,944 7,585 4,533 2,171
Cross Directorate Reserves
Vehicle & Equipment Reserve 1,663 948 524 517
Grants and Contributions Reserve 12,871 3,000 3,000 3,000
ICT Projects 675
Total cross directorate 15,209 3,948 3,524 3,517
Children, Education & Families
CE&F Commercial Services 426
Joint Working with Police
School Intervention Fund 286
Thriving Families 955
Childrens Social Care
Foster Carer Loans 201
Academies Conversion Support 99
Staff Training & Development
Pay Protection Costs 282
Early Intervention Service Reserve 199
Total Children, Education & Families 2,448 0 0 0
Social & Community Services
Older People Pooled Budget Reserve 1,700
Physical Disabilities Pooled Budget Reserve 544
Leaning Disabilities Pooled Budget Reserve 95
Fire Control 150
Fire & Rescue and Emergency Planning Reserve 56
Community Safety Reserve 155 60 60 60
Total Social & Community Services 2,700 60 60 60
Earmarked Reserves 2015/16 to 2017/18
Forecast Balance at
31 March 2018
The table below shows the forecast level of earmarked reserves held by the Council over the medium term at the time the budget was agreed on 17 February 2015.
The actual level of earmarked reserves held by the Council at 31 March 2015 will be published in the 2014/15 Statement of Accounts.
Forecast Balance at
31 March 2015
Forecast Balance at
31 March 2016
Forecast Balance at
31 March 2017
1.16

Earmarked Reserves 2015/16 to 2017/18
£000 £000 £000 £000
Environment & Economy
Highways and Transport Reserve 33 15 15 15
Area Stewardship
On Street Car Parking 1,145 603 403 203
Countryside Ascott Park - Historical Trail 22 22 22 22
Carbon Reduction 60
SALIX Repayments 227
Dix Pit Development (Waste Recycling Centre)
Oxfordshire Waste Partnership Joint Reserve
Dix Pit Engineering Works 826
Waste Management 528
Property Disposal Costs 175 96 63 39
Developer Funding (Revenue) 515 205 0
West End Partnership 26 0 0
Catering Investment Fund 1,114 827 0
Asset Rationalisation 0 0
Job Clubs 0 0
Minerals and Waste Project 0 0
Joint Use Reserve 1,276 745 245
LABGI Reserve 186
OCS Development Reserves 863
Money Management Reserve
Oxford Flood Alleviation Scheme 350
Oxfordshire - Buckinghamshire partnership 198 148 100 50
Total Environment & Economy 7,544 2,661 848 329
Forecast Balance at
31 March 2015
Forecast Balance at
31 March 2016
Forecast Balance at
31 March 2017
Forecast Balance at
31 March 2018
1.17

Earmarked Reserves 2015/16 to 2017/18
£000 £000 £000 £000
Chief Executive's Office
Big Society Fund
CIPFA Trainees 58
Coroner's Service 133 106
Council Elections 217 434 651
Registration Service 599
Cultural Services Reserve 1,312 684 82 82
Total Chief Executive's Office 2,319 1,224 733 82
Total Directorate Reserves 15,011 3,945 1,641 471
Carry Forward Reserves 598
Efficiency Reserve 1,190 328
Total Corporate Reserves 1,788 328 0 0
Total Revenue Reserves 46,952 15,806 9,698 6,159
Other Reserves
Insurance Reserve 3,917 3,917 3,917 3,917
Capital Reserves
Capital Reserve 19,442 19,442 18,194 18,194
Rolling Fund Reserve 2,541
Prudential Borrowing Reserve 8,386 9,113 9,338 9,070
Total Capital Reserves 30,369 28,555 27,532 27,264
Cash Flow Reserves
Budget Reserve 6,625 1,841 -6,047 1,102
Total Cash Flow Reserves 6,625 1,841 -6,047 1,102
Total Other Reserves 40,911 34,313 25,402 32,283
Total Reserves 87,863 50,119 35,100 38,442
Forecast Balance at
31 March 2018
Forecast Balance at
31 March 2017
Forecast Balance at
31 March 2016
Forecast Balance at
31 March 2015
1.18

Subjective Analysis of the Council's 2015/16 Revenue Expenditure and Income by Service Area
Details
£000 £000 £000 £000 £000 £000 £000 £000 £000 £000 %
Employee Expenses 146,092 55,730 30,143 1,652 37,945 19,958 -6,979 284,541 830 285,371 34.3
Premises Related Expenses 26,834 5,475 3,974 7 10,529 3,540 -10,504 39,855 39,855 4.8
Transport Related Expenses 16,666 989 39 18,018 318 -14,940 21,090 21,090 2.5
Supplies and Services 41,685 50,241 4,392 5,670 30,133 5,025 -8,336 128,810 128,810 15.5
Third Party Payments 11,128 50,926 4,197 23,087 59,571 181 149,090 149,090 17.9
Transfer Payments 14 14 14 0.0
Support Services 13,645 176,106 568 1,698 2,714 -27,295 167,436 167,436 20.2
Contingency 4,029 4,029 0.5
Capital Financing Costs 335 370 915 205 -205 1,620 33,768 35,388 4.3
GROSS EXPENDITURE 226,074 193,067 220,716 31,023 158,099 31,736 -68,259 792,456 38,627 831,083 100.0
Recharges to other directorates -1,405 -1,913 -427 -57,255 -7,259 68,259
TOTAL EXPENDITURE EXCLUDING
RECHARGES226,074 191,662 218,803 30,596 100,844 24,477 0 792,456 38,627 831,083 100.0
Government Grants -203,679 -81,605 -30,419 -8,323 -692 -324,718 -15,777 -340,495 41.0
Other Grants, Reimbursements & Contributions -1,123 -7,588 -177 -5,336 -887 -15,111 -15,111 1.8
Customer and Client Receipts -22,395 -1,885 -2,467 -10,604 -4,105 -41,456 -41,456 5.0
0
GRANTS AND RECEIPTS -226,074 -84,613 -10,055 -30,596 -24,263 -5,684 0 -381,285 -15,777 -397,062 47.8
Net Interest on Balances -4,199 -4,199 0.5
Contribution to Reserves and Balances -5,241 -5,241 0.6
INTERNAL FINANCING 0 0 0 0 0 0 0 0 -9,440 -9,440 1.1
Revenue Support Grant -62,305 -62,305 7.5
Business Rates Top-Up -37,085 -37,085 4.5
Business Rates from District Councils -29,466 -29,466 3.6
Council Tax Collection Fund Surpluses -7,472 -7,472 0.9
Council Tax Precept -288,253 -288,253 34.7
EXTERNAL FINANCING 0 0 0 0 0 0 0 0 -424,581 -424,581 51.1
TOTAL INCOME -226,074 -84,613 -10,055 -30,596 -24,263 -5,684 0 -381,285 -449,798 -831,083 100.0
TOTAL NET BUDGET 0 107,049 208,748 0 76,581 18,793 0 411,171 -411,171 0
Delegated
Schools
Budgets
Public
Health
2015/16 Budget
at Outturn Prices
Children,
Education &
Families
Social &
Community
Services
Environment
& Economy
Chief
Executive's
Office &
CDC*
Recharges
Total
Service
Budget
Strategic
Measures
1.19

Schools
Public Health
Strategic Measures
Expenditure and Income Analysis - 2015/16
Schools 27%
Children, Education & Families 23%
Public Health 4%
Environment & Economy 12%
Chief Executive's Office 3%
Social & Community Services 26%
Strategic Measures 5%
Gross Expenditure by Service
Schools 60%
Children, Education & Families 24%
Social & Community Services 0%
Public Health 9%
Environment & Economy 2%
Chief Executive's Office 0%
Strategic Measures 5%
Specific Grants by Directorate
Schools 40%
Children, Education & Families 5%
Social & Community Services 18%
Public Health 0%
Environment & Economy 28%
Chief Executive's Office 9%
Strategic Measures 0%
Other Income by Directorate
1.20

Directorate Issued Estimate Revised Estimate Latest
by 2014/15 2014/15 2015/16 2015/16
£000 £000 £000 £000
Children, Education & Families
R DfE 292,502 268,138 262,644 262,644
R DfE 0 11 0 0
R DfE 11,668 11,027 10,149 10,149
R DfE 7,131 4,989 4,537 4,537
R YJB 636 736 680 680
R HO 656 656 795 795
R DfE 180 230 0 0
R DfE 0 50 0 0
R DfE 0 708 0 0
R DfE 0 1,013 723 723
R DfE 0 4,052 5,693 5,693
R YJB 144 94 64 64
TOTAL CHILDREN, EDUCATION & FAMILIES 312,917 291,704 285,285 285,285
Remand Framework
Universal Infant Free School Meals
Government Grants - Details 2014/15 and 2015/16
Rin
gfe
nced
The grants listed for 2014/15 were those known about when setting the 2014/15 budget. Further grants have been received during 2014/15, together with
amendments to existing grants, and have been reported to the Cabinet. These are shown in the Revised 2014/15 column. The grants listed as estimates for
2015/16 are those the Council have been notified of or are best estimates available when setting the 2015/16 budget. If further information has become
available since then, the latest position is shown in the Latest 2015/16 column. Further grants may be received throughout the year and will be reported to the
Cabinet, with recommendations about their use, through the Financial Monitoring Reports.
A key denotes whether the 2015/16 grant figure is ringfenced for a specific purpose, and the key in the first column denotes which this applies to.
Dedicated Schools Grant (DSG)
Unpaid Work Grant
Education Funding Agency - Sixth Form Funding and Threshold
Pupil Premium
Intensive Interventions Programme (DfE) 2014/15
PE and Sport Grant 2014/15 (£1.03m payable in 2014/15 with a
further instalment of £0.723m in April 2015)
Youth Justice Board
Asylum (USAC and Post 18)
PE and Sport Grant 2013/14 (paid April 2014)
Intensive Interventions Programme (DfE) 2013/14 Adjustment
1.21

Issued Estimate Revised Estimate Latest
by 2014/15 2014/15 2015/16 2015/16
£000 £000 £000 £000
R DoH 0 520 0 0
0 520 0 0
Environment & Economy
R BIS 3,899 3,899 3,697 3,697
R EFA 285 209 209 209
R DfT 0 795 795 795
R DEFRA 230 240 242 242
R Local Sustainable Transport Fund Grant DfT 535 535 1,000 1,000
Subtotal Environment & Economy Directorate Grants 4,949 5,678 5,943 5,943
Grants held on behalf of Local Enterprise Partnership
U Regional Growth Fund - Oxford Inovation Business Support RGF 0 1,961 896 896
R BIS - Oxford Innovation Business Support BIS 0 0 250 250
R SEEDA - Oxford Innovation Business Support BIS 0 0 144 144
U DCLG (Local Enterprise Partnership Funding) DCLG 500 500 500 500
R City Deal Skills Grant SFA 0 370 590 590
500 870 1,484 1,484
5,449 6,548 7,427 7,427
Skills Funding Agency - Adult Education
Government Grants - Details 2014/15 and 2015/16
Rin
gfe
nced
Directorate
Education Funding Agency
Natural England
TOTAL ENVIRONMENT & ECONOMY
Subtotal Grants held on behalf of Local Enterprise Partnership
Social & Community Services
Bus Service Operators Grant
Reducing Delayed Transfers of Care Attributable to Social Care
Revenue Grant
TOTAL SOCIAL & COMMUNITY SERVICES
1.22

Estimate Revised Estimate Latest
2014/15 2014/15 2015/16 2015/16
£000 £000 £000 £000
Public Health
R DH 26,086 26,086 30,419 30,419
TOTAL PUBLIC HEALTH 26,086 26,086 30,419 30,419
R DfE 0 15 0 0
R DfE 0 2 0 0
R DCLG 0 31 50 50
R DfE 0 642 642 642
0 690 692 692
Strategic Measures
U DCLG 285 285 288 288
U DEFRA 167 167 112 112
U DfE 379 379 310 310
U DCLG 100 100 200 200
U DCLG 9 9 0 0
U DCLG 2,387 2,387 3,170 3,170
U DCLG 214 214 210 210
U DH 414 414 515 515
U DWP 930 930 0 0
U Care Act New Burdens Grant DH 0 0 3,368 3,368
U DfE 6,965 6,965 5,365 5,365
U DfE 0 35 0 0
U DfE 597 597 0 0
U DfE 835 835 375 375
U DCLG 80,623 80,623 62,305 62,305
Government Grants - Details 2014/15 and 2015/16
Rin
gfe
nced
DirectorateIssued
by
Adoption Reform Grant
Education Services Grant
Phonics and Moderation Funding
Revenue Support Grant
Public Health Grant
Special Educational Needs Reform Grant
Department of Health Revenue Grant
Community Right to Challenge
Troubled Families - Service Transformation Grant
New Homes Bonus
Fire Revenue Grant
Local Welfare Provision
Extended Rights to Free Travel
New Homes Bonus Adjustment Grant
Lead Local Flood Authority
Chief Executive's Office
Find your Voice
Counter Fraud Fund
Arts Council
Music
TOTAL CHIEF EXECUTIVE'S OFFICE
1.23

Estimate Revised Estimate Latest
2014/15 2014/15 2015/16 2015/16
£000 £000 £000 £000
U DCLG 36,390 36,390 37,085 37,085
U Section 31 Grant for Cap on Business Rates Top-up DCLG 386 386 541 541
U Section 31 Grant for Cap on Business Rates and Other Reliefs DCLG 1,165 1,165 1,323 1,323
TOTAL STRATEGIC MEASURES 131,846 131,881 115,167 115,167
Total All Grants 476,298 457,429 438,990 438,990
Ringfenced
R Ringfenced
U Un-ringfenced
OS Outside Aggregate External Finance therefore R/U not applicable. Assume conditions attached therefore ringfenced
Issued by
DfE Department for Education BIS Department for Business, Innovation & Skills
YJB Youth Justice Board DEFRA Department for Environment, Food and Rural Affairs
HO Home Office EA Environment Agency
DH Department of Health DWP Department for Work & Pensions
DCLG Department for Communities & Local Government EFA Education Funding Agency
SFA RGF Regional Growth Board
Business Rates Top-Up
Government Grants - Details 2014/15 and 2015/16
Rin
gfe
nced
Directorate
Issued
by
Skills Funding Agency
1.24

Other Income - 2015/16
Details
£000 £000 £000 £000 £000 £000
Other Grants 0
Contributions 1,123 7,588 177 5,336 887 15,111
Rents 8,093 22 520 490 5 9,130
Sales 45 661 248 156 1,110
Fees & Charges 14,302 1,818 1,286 9,866 3,944 31,216
Other Service Income 22,395 3,008 10,055 177 15,940 4,992 56,567
Some of the major items of income are shown below.
Description Category Amount£000
Music Service Tuition Fees Fees & Charges 1,273Outdoor Education Centres Income Fees & Charges 1,495Home Care Income Contributions 1,469Nursing & Residential Care Income Contributions 1,765
Fees & Charges 5,847
Registration Service Fees Fees & Charges 1,483
Other service income makes up 7% of the Council's funding. Fees and charges are subject to an annual review and were
reported to the Cabinet on 16 December 2014 as the "Review of Charges" report. Other income comes from activities for
which a unit charge is not appropriate. These include rents, private works income, miscellaneous sales of goods/services,
charges for trade waste, royalties, and income from other activities for which charges are not set by members. Other grants are
grants received from non governmental bodies. Contributions are received from other local authorities, the Health Service and
bodies such as the Countryside Commission, for example.
Chief
Executive's
Office & CDC
Total
Children,
Education &
Families
Social &
Community
Services
Environment
& EconomyPublic HealthSchools
Social & Community Services
Environment & Economy
Chief Executive's Office
Directorate
Children, Education & Families
Social & Community Services
Children, Education & Families
On Street Parking, Camera Enforcement and
Park & Ride Income
Contributions 27%
Rents 16%
Sales 2%
Fees & Charges 55%
% of other income by type
Schools 40%
Children, Education & Families
5%
Social & Community Services 18%
Environment & Economy 28%
Chief Executive's Office 9%
Public Health 0%
% of other income by Directorate
1.25

2015/16
£000
2016/17
£000
2017/18
£000
Base Budget 25,493 29,187 30,544
Inflation
Previously Agreed Budget Changes 2,196 -1,072 8,440
2015/16 Budget Changes 1,498 2,429 4,493
Budget Requirement 29,187 30,544 43,477
Details
2015/16 2016/17 2017/18
£000 £000 £000
Previously Agreed Budget Changes
Capital Financing -957 -923
Contingency -257 -774 6
Contributions to/from General Balances -1,000
Budget Reserve - agreed February 2009
Budget Reserve 4,410 625 8,925
Capital Rolling Fund Reserve -491
2015/16 Budget Changes
Capital Financing -180 -171 -1,435
Contingency 810 774
Contributions to/from General Balances
Budget Reserve 4,805 -2,995 5,337
Capital Rolling Fund Reserve -3,032 2,541 491
Insurance Reserve 781 100 100
Business Rate Reserve 494
Directorate Reserves -2,180 2,180
TOTAL BUDGET CHANGES 3,694 1,357 12,933
Capital Financing
Before 2011/12, the Council received borrowing approvals from the Government each year which allowed
us to borrow to fund new schemes in our capital programme. The Council now receives capital grant
funding from Government to fund the capital programme instead of borrowing approvals. This means that
the council no longer has to take any borrowing to fund it's capital programme. Prudential borrowing is still
available which would increase borrowing, however the Treasury Management Strategy states that the
council will fund any borrowing requirement internally. As the bank rate is low at 0.50%, the cost of
borrowing is far higher than investment returns. Financing the borrowing requirement internally will reduce
this cost.
Strategic Measures
At 1 April 2015 the Council had total outstanding borrowing of £399.383m. Of this £349.383m is with the
Public Works Loan Board (PWLB) and £50m is in Lender Option/Borrower Option loans (LOBOs).
This is the budget to finance the Council's debt and reflects our borrowing to fund the capital programme.
The annual debt charges are made up of principal repayments due and the interest paid on the
outstanding debt. The Council has a statutory duty to charge a minimum repayment of principal to the
revenue account each year - this is broadly 4% of the outstanding debt as at 1 April.
Year on Year variation (at 2015/16 prices)
The following tables show the Medium Term Financial Plan for Strategic Measures and the details of the
previously agreed budget changes and budget changes agreed in 2015/16.
The budget for strategic measures is made up of four elements - capital financing, interest on balances,
contributions to/from reserves & balances and contingency.
1.26

2015/16 £m
-4.732
0.533
-4.199
Each year a budgeted contribution is made to balances to maintain them at the risk assessed level. In
2015/16 the contribution will be £2m.
The contribution from reserves includes the movement on the budget reserve. The budget reserve is
being used to manage the cash flow implications of the variations to the MTFP. The forecast for the
budget reserve shows an overdrawn balance by the end of 2016/17. This position will be reviewed as part
of the 2016/17 Service & Resource Planning process.
Strategic Measures
Interest On Balances
A corporate cotingency of £4.029m has been set aside within the Strategic Measures budget in case
directorates are unable to deliver savings or manage within available resources.
Contingency
Contribution to/from Reserves and Balances
The Council's average cash balance in 2014/15 was £299.2m and the average interest rate recieved was
0.82%
This budget covers a mix of interest received and interest payable on our cash balances. Interest received
includes the interest earned on our temporary surplus cash balances which are invested daily in the money
market and with external fund managers. Interest payable includes the interest paid on various sums which
are included within the Council's cash balance, including Developer Contributions and the Insurance Fund.
The budget shown in the Detailed Medium Term Financial Plan shows the net interest on balances, the
split of this between interest receivable and interest payable is shown below.
Interest Receivable
Interest Payable
Net Interest on Balances
The Council had £298.8m of investments at 1 April 2015.
1.27

The County Council employs 9,481 full time equivalent (fte) employees (approximately 14,822 staff). The
following graphs analyse the employees by the Directorate they work for and then by the employee type.
Staffing Summary
6,493
1,445
1,032
490
0%
10%
20%
30%
40%
50%
60%
70%
80%
90%
100%
Employee FTEs by Directorate 2015/16
Children, Education &Families
Social & Community Safety
Environment & Economy
Chief Executive's Office
Public Health
Total 9,481
33% 13%
1% 6%
7%
2%
30%
4% 4%
Employee Types by Budget Share 2015/16
Teachers Teaching Assistants
Lecturers Firefighters/control room staff
Social Workers/Care Managers Care Staff
Admin & Support Staff Cleaning & Catering Staff
Other Staff
Total £292.8m
1.28

Financingand
Trend Data
2.1

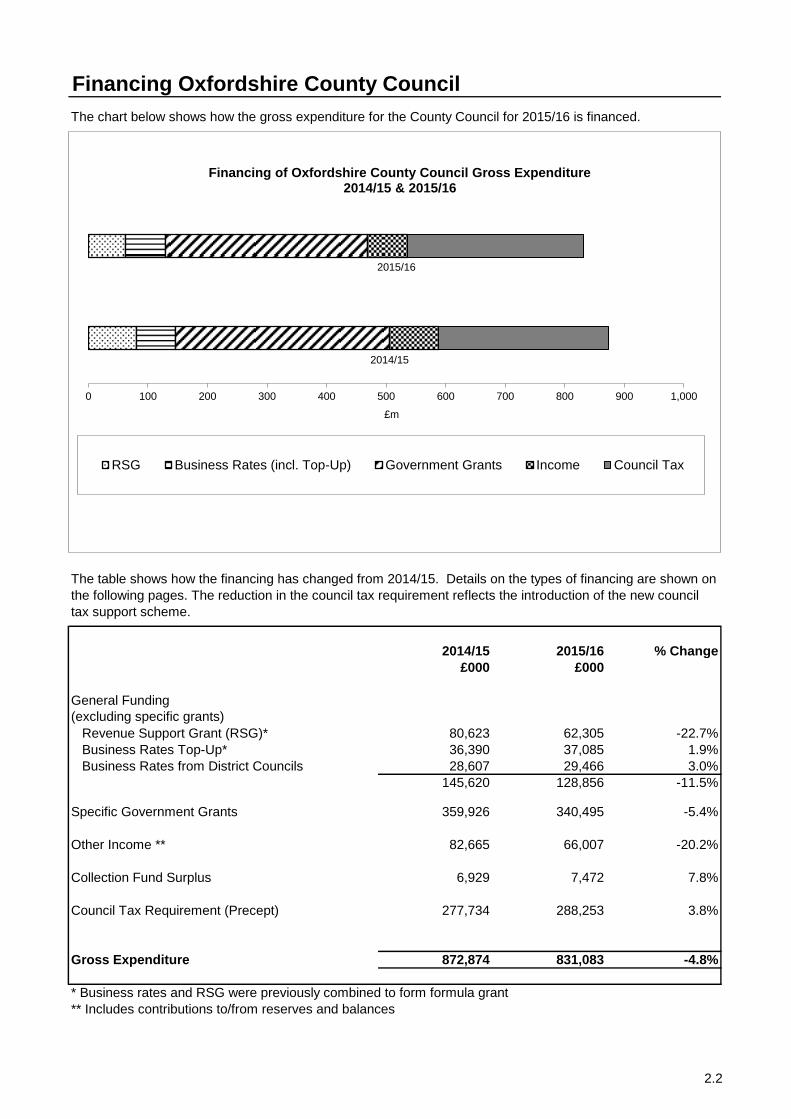
2014/15 2015/16 % Change
£000 £000
General Funding
(excluding specific grants)
Revenue Support Grant (RSG)* 80,623 62,305 -22.7%
Business Rates Top-Up* 36,390 37,085 1.9%
Business Rates from District Councils 28,607 29,466 3.0%
145,620 128,856 -11.5%
Specific Government Grants 359,926 340,495 -5.4%
Other Income ** 82,665 66,007 -20.2%
Collection Fund Surplus 6,929 7,472 7.8%
Council Tax Requirement (Precept) 277,734 288,253 3.8%
Gross Expenditure 872,874 831,083 -4.8%
* Business rates and RSG were previously combined to form formula grant
** Includes contributions to/from reserves and balances
The table shows how the financing has changed from 2014/15. Details on the types of financing are shown on
the following pages. The reduction in the council tax requirement reflects the introduction of the new council
tax support scheme.
Financing Oxfordshire County Council
The chart below shows how the gross expenditure for the County Council for 2015/16 is financed.
0 100 200 300 400 500 600 700 800 900 1,000
£m
Financing of Oxfordshire County Council Gross Expenditure 2014/15 & 2015/16
RSG Business Rates (incl. Top-Up) Government Grants Income Council Tax
2014/15
2015/16
2.2

2011/12 2012/13 2013/14 2014/15 2015/16
£000 £000 £000 £000 £000
General Funding
(excluding specific grants)
Revenue Support Grant* 28,844 2,193 94,487 80,623 62,305
Business Rates Top-Up* 93,316 113,119 35,694 36,390 37,085
Business Rates from District Councils 27,287 28,607 29,466
122,160 115,312 157,468 145,620 128,856
Council Tax
Collection Fund Surplus 3,782 4,019 4,763 6,929 7,472
Council Tax Requirement (Precept) 282,674 284,525 268,449 277,734 288,253
286,456 288,544 273,212 284,663 295,725
Net Budget 408,616 403,856 430,680 430,283 424,581
* Business rates and RSG were previously combined to form formula grant
Financing Oxfordshire County Council - Trends 2011/12 to 2015/16
The table below shows how much income the County Council has received to finance its budget from Revenue
Support Grant, Business Rates and Council Tax over the last five years.
7.1% 0.5%
21.9% 18.7%
14.7%
22.8%
28.0%
8.3% 15.1%
15.7%
70.1% 71.4% 63.4% 66.2%
69.7%
0%
10%
20%
30%
40%
50%
60%
70%
80%
90%
100%
2011/12 2012/13 2013/14 2014/15 2015/16
Financing of Net Budget
Council Tax Business Rates (incl. Top-Up) Revenue Support Grant
2.3

Property
band
Property Values Band D
proportion
A Up to £40,000 6/9 £821.64
B Over £40,000 and up to £52,000 7/9 £958.58
C Over £52,000 and up to £68,000 8/9 £1,095.52
D Over £68,000 and up to £88,000 9/9 £1,232.46
E Over £88,000 and up to £120,000 11/9 £1,506.34
F Over £120,000 and up to £160,000 13/9 £1,780.22
G Over £160,000 and up to £320,000 15/9 £2,054.10
H Over £320,000 18/9 £2,464.92
Note
Property values are based on 1991 valuations.
Council Tax - Values for 2015/16 and Increases since 2011/12
The Council Tax is calculated on the Council Tax base which is the number of Band D equivalent properties.
The Council Tax for Oxfordshire County Council for 2015/16 is £1,232.46 at Band D. This is a 1.99%
increase from the 2014/15 level. Oxfordshire can be compared to 10 other County Councils which have Fire
& Rescue responsibilities. The average Band D Council Tax for the 11 County Councils is £1,150.73, this
represents a 1.25% increase from the 2014/15 average. Seven County Councils in this comparison,
Cumbria, Hertfordshire, Lincolnshire, Northamptonshire, Oxfordshire, Surrey and Warwickshire, increased
their Council Tax in 2014/15. Oxfordshire County Council's Council Tax is the highest of the 11 County
Councils in monetary terms.
The County Council element of the Council Tax for each property band in 2015/16 is detailed below:
Details of the average Band D Council Tax for each District Council within the County are given on the next
page. The Council Tax individuals are expected to pay will vary according to a number of factors, including
property band, occupancy levels and entitlement to Council Tax support.
County Council element of
Council Tax
£
0.00% 0.00%
1.99% 1.99% 1.99%
0%
1%
1%
2%
2%
3%
2011/12 2012/13 2013/14 2014/15 2015/16
Council Tax increases over the last 5 years
2.4

Cherwell Oxford South
Oxfordshire
Vale of White
Horse
West
Oxfordshire
County
Total
Population Estimates
No. No. No. No. No. No.
Mid 2010 139,200 149,300 130,600 118,700 102,500 640,300
Mid 2011 140,400 153,700 131,000 119,800 103,800 648,700
Mid 2012 142,300 150,200 135,000 121,900 105,400 654,800
Mid 2013 143,700 154,800 136,000 123,600 108,000 666,100
Mid 2014 144,600 153,900 136,800 124,100 108,800 668,200
Council Tax Bases (Band D Equivalent)
No. No. No. No. No. No.
2011/12 Estimate 50,337.0 46,983.8 55,359.7 48,426.0 42,219.0 243,325.5
2012/13 Estimate 50,615.0 47,133.9 55,652.2 49,075.5 42,442.9 244,919.5
2013/14 Estimate* 46,672.0 41,291.0 52,607.0 45,965.0 40,037.0 226,572.0
2014/15 Estimate* 47,609.0 41,752.5 53,217.1 46,640.5 40,614.8 229,833.9
2015/16 Estimate* 48,253.0 42,658.7 54,233.6 47,563.1 41,175.8 233,884.2
Calculation of the Council Tax 2015/16
£ £ £ £ £ £
Oxfordshire County Council 1,232.46 1,232.46 1,232.46 1,232.46 1,232.46 1,232.46
District Council 123.50 283.00 111.24 116.69 81.63 143.21
Parish Council Average 84.64 4.03 77.23 63.63 74.15 60.74
Police and Crime Commissioner for Thames Valley 163.70 163.70 163.70 163.70 163.70 163.70
Average Band D Council Tax for 2015/16 1,604.30 1,683.19 1,584.63 1,576.48 1,551.94 1,600.11
District Council's Gross Expenditure & Council Tax Requirement 2014/15
£000 £000 £000 £000 £000 £000
Gross Expenditure (inc. Parish Council's) 2015/16 70,481 185,018 78,275 74,189 55,902 463,865
Council Tax Requirement 2015/16 10,043 12,072 10,222 8,577 6,414 47,328
* includes adjustments in respect of council tax support discounts.
Council Tax - Population, Tax Bases and Council Tax Statistics
2.5

Children, Education & Families
3.1


Children, Education and Families
Business Strategy 2015/16 to 2017/18
Directorate Overview
The independent Oxfordshire Safeguarding Children Board coordinates the effectiveness
of arrangements to safeguard and promote the welfare of children and young people in the
County.
2. Vulnerable children and young people
We work with partners to understand local need and secure provision of services that
promote prevention and early intervention and offer early help to children, young people
and families so that emerging problems are dealt with before they become more serious.
We also act as effective and caring ‘corporate parents’ for looked after children, with key
roles in improving their educational attainment, providing stable and high quality
placements and proper planning for when they leave care. We also ensure that disabled
children and those with special educational needs (SEN) can access high quality provision
that meets their needs and fund provision for children with statements of SEN.
The Children, Education & Families vision is for Oxfordshire to be the best place in England
for children and young people to grow up, by working with every child and young person to
develop the skills, confidence and opportunities they need to achieve their full potential.
We want Oxfordshire to be a ‘thriving Oxfordshire’. This means a place where people can
work to achieve a decent life for themselves and their family, a place alive with vibrant,
active communities and a place where people can enjoy the rewards of a growing economy
and feel safe.
We have an overarching responsibility to work with partners to improve the well-being of
children and young people, and to reduce inequalities between them. Our statutory duties
fall into four main areas:
1. Safeguarding
We work with partners to make arrangements to ensure that all our functions are
discharged with a view to safeguarding and promoting the welfare of children. In particular,
we ensure that there are clear and effective arrangements to protect children and young
people from harm.
We ensure arrangements are in place for alternative provision for children outside
mainstream education or missing education (for example due to permanent exclusion or
illness) to receive suitable full-time education. We also ensure that there is coherent
planning between all agencies providing services for children involved in the youth justice
system (including those leaving custody), secure the provision of education for young
people in custody and ensure that safeguarding responsibilities are effectively carried out.
3.2

We work with head teachers, school governors and academy sponsors and principals to
promote educational excellence for all children and young people and make sure they are
ambitious in tackling underperformance. We support maintained schools in delivering an
appropriate National Curriculum and early years providers in meeting the requirements of
the Early Years Foundation Stage (as outlined in the EYFS Statutory Framework).
Where necessary we take rapid and decisive action in relation to poorly performing
schools, including using powers of intervention with regard to maintained schools and
considering alternative structural and operational solutions. We develop robust school
improvement strategies, and promote high standards in education by supporting effective
school-to-school collaboration. We also provide local leadership for tackling issues needing
attention which cut across more than one school, for example poor performance in a
particular subject area across a cluster of schools.
3. Educational provision
We promote the interests of children, young people, parents and families and work with
local communities to stimulate and support a diversity of school, early years and 16 to 19
provision that meets local needs. We promote participation in education or training of
young people, including by securing provision for young people aged 16 - 19 (or 25 for
those with learning difficulties or disabilities). This includes ensuring fair access to all
schools for every child in accordance with the statutory School Admissions and School
Admissions Appeal Codes and ensuring appropriate information is provided to parents, and
suitable provision for suitable home to school transport arrangements.
We actively promote a diverse supply of strong schools, including by encouraging good
schools to expand and, where there is a need for a new school, seeking proposals for an
academy or free school. We also need to promote high quality early years provision,
including helping to develop the market, securing free early education for all three and four
year olds and for all disadvantaged two year olds. This includes providing information,
advice and assistance to parents and prospective parents, and ensuring there are sufficient
children’s centre services to meet local need and sufficient childcare for working parents.
We also promote children and young people’s participation in public decision-making so
they can influence local decisions about services.
4. Educational excellence
3.3

Delivering the council’s corporate priorities
Thriving economy
Support for the vulnerable
The proportion of Oxfordshire GCSE students achieving at least five A*- C grades including
English and Maths has overtaken the national average for the first time in four years and
performance in reading, writing and mathematics for seven and eleven year olds continues
to broadly be in line with the national figure. This suggests the council’s education strategy
is having a positive impact, although our performance has still not reached the aspirations
the council, pupils, parents and schools hold. A Strategy for Change – Improving
Educational Outcomes in Oxfordshire’ sets out a clear vision for Oxfordshire to be a
dynamic and forward looking place for education and learning, providing the best quality
experiences for children and young people to grow up, learn, develop and achieve, and we
will continue to work closely with a range of partners to ensure it is implemented effectively.
Giving children a good start in life will prevent many problems from ever occurring. Where
issues do occur we are committed to providing early help in order to avoid problems
escalating and family needs becoming more complex. Our early intervention service,
currently provided through hubs and children’s centres across the county, is an important
element of our targeted prevention approach. The service brings together previously
separate teams to give coordinated support to children and young people who are at risk of
not having good outcomes. A wide range of partner organisations refer individuals to the
service and support its provision of whole family, integrated services. Early intervention is
closely linked to supporting better educational outcomes and ensuring a good start in life,
particularly through targeted work with young and vulnerable parents.
Steps are being taken to promote even closer working between the Early Intervention
Service and Children’s Social Care the first of which means that with effect from January
2015 both services will report to the same Deputy Director.
Children's social care will continue to focus on protecting children at risk of harm or neglect
and tackling, as well as preventing, cases of child sexual exploitation.
We have made considerable investments in frontline children’s social care services to
ensure we have sufficient capacity to maintain high standards and ensure children and
young people are appropriately safeguarded. A joint resource (the Kingfisher team) is now
well established specifically to focus on child sexual exploitation is a demonstration of our
commitment, and we will continue working with the police and health – as well as other key
partners such as Oxfordshire’s district councils and its voluntary sector – to extend the
reach of this team. The Multi Agency Safeguarding Hub (MASH) is now open and provides
an all-important first port of call for children’s safeguarding issues and will be expanded in
due course to cater for adult referrals.
3.4

Thriving people and communities
How we work to deliver these priorities
We are rolling out a programme of agile working in order to support the new ways of
working necessary to deliver these priorities. Agile working means: giving staff the right
equipment and working environment to suit their role and service; working in a more flexible
way that makes best use of staff time, buildings, and resources; and taking advantage of
changes in technology and working styles to become more efficient. This will ultimately
protect delivery of front line services as far as possible.
For example, staff are able to work flexibly from a number of different offices across the
county, to reduce travel time and increase efficiency. A number of health services are
delivered from Children’s Centres, and staff from the council and partner organisations are
co-locating in early intervention hubs. This approach will be further extended as we develop
the MASH still further, co-locating partners including Adults Services, the Fire Service and
Trading Standards, Oxford Health and Thames Valley Police.
There is a national focus on helping the most disadvantaged and challenged families to
turn their lives around. The Thriving Families programme works with these families to
reduce worklessness, antisocial behaviour, crime and school exclusions and to increase
school attendance. The key focus is on our most resource intensive and vulnerable families
with the aim of reducing the numbers needing the type of support offered by social care.
This continues to be a vital strand in the on-going work locally to narrow the gap in
outcomes that exists across the county.
3.5
Services and Priorities
The key elements of the strategy are:
What has already been achieved?
The Children, Education and Families Directorate is a well-regarded and highly valued
service, with overall performance outcomes that are good and consistently good or
outstanding Ofsted judgements. Standards of reading, writing and mathematics in primary
schools continue to broadly be in line with national figures and the proportion of GCSE
students achieving at least five A*- C grades including English and Maths is now above the
national average. There continues to be a significant improvement in the number of
children taught in schools which are judged to be good or outstanding by Ofsted, with an
additional 4,320 children taught in such schools by the end of the 2013/14 academic year.
Since April 2012 the directorate has made substantial savings from the non-schools
budget, but is now facing significant increased demand for children’s social care services,
which will require service redesign to address the consequent budget pressure.
4) Supporting schools, academies, early years settings and other agencies to continue to
raise achievement
5) Ensuring good access to the right support at the right time
6) Encouraging a positive experience of the transition from childhood to adulthood.
7) Developing a balance of services provided by public, private and voluntary sector
organisations
Children's social care is working with slightly higher numbers of children than similar
authorities, and activity levels are increasing. In the last 18 months the most striking
increase has been in the numbers of children looked after which has increased by 26% in
18 months between April 2013 and October 2014. This included a 75% increase in non-
Oxfordshire County Council care homes; a 30% increase in independent living and a 20%
increase in foster care.
Our Strategy and Approach
1) Keeping children safe from harm and especially those at risk of exploitation
2) Establishing the right balance of universal and targeted services to be able to manage
demand for services
3) Embedding the most effective way to provide early help to children, young people and
families
3.6

1) Keeping children safe from harm and especially those at risk of exploitation
Protecting the most vulnerable children and young people is an overriding priority for the
council and its partners. We perform well in terms of timeliness of initial assessments, core
assessments, holding of child protection case conferences with solid multi-agency
safeguarding and child protection practice. However, children being looked after by the
council are currently being placed too far away from home, in many cases out of the
County. We will deliver our new placement strategy that has been developed to ensure
these children can live closer to home, to make it easier to keep contact with relatives and
for them to move back home as soon as it is appropriate to do so.
Child sexual exploitation is a significant issue in Oxfordshire and elsewhere. We are
working hard to keep our children and young people safe from abuse. We will continue to
build on existing work with partners, including development of the new multi-agency
safeguarding hub (MASH) and extending the reach of the Kingfisher team – a multi-
agency team providing an initial point of contact for advice and information to families,
children and other professionals where there are concerns about child sexual exploitation.
2) Establishing the right balance of universal and targeted services to be able to
manage demand for services
Where possible, the provision of universal services free at the point of delivery has been
retained. Increasingly however it is recognised that the work of our services needs to be
targeted to those in greatest need. Children who have a statement of special educational
needs are well supported but outcomes need to improve for those children identified as in
need. For young people with disabilities, we will streamline assessments, provide personal
budgets, make information and advice more readily available and have a more joined up
approach between education, health and social services.
The Thriving Families programme works intensively with families over a sustained period of
time to bring lifestyle changes in the family. The number of families who receive intensive
support will increase and a whole family approach developed through the Thriving Families
programme will be extended as part of the wider review of children’s services.
3.7

4) Supporting schools, academies, early years settings and other agencies to
continue to raise achievement
We are reviewing the way support is provided to schools and settings to reflect changes in
responsibilities for schools and the county council and to improve outcomes for children
and young people. About half of secondary schools are now academies and more
academies are expected in the medium term, but the council retains overall responsibility
for educational performance and quality.
Our focus will be on improving the number of good and outstanding schools and settings,
as this is an important factor influencing the overall educational attainment of children. We
will also continue to focus on the quality of teaching and learning, giving greater attention to
vulnerable learners, improving reading and improving performance at GCSE level.
5) Ensuring good access to the right support at the right time
Families need easier access to support and to get the help they need when they need it.
They need a consistent and co-ordinated response no matter which door they knock on.
We will increase personalisation, streamline assessments, have a more joined up
approach between education, health and social services, provide personal budgets (if
requested) and make information and advice more readily available.
6) Encouraging a positive experience of the transition from childhood to adulthood
3) Embedding the most effective way to provide early help to children, young people
and families
All services need to support children and families early enough to ensure the right support
at the right time, without delay, to prevent any escalation of needs. The Early Intervention
Service is targeted at vulnerable children and those with complex needs and we shall
ensure even closer liaison with children’s social care. A mix of children’s centres and other
provision is accessible to families and is delivered from a variety of venues including
schools. As we focus more on our statutory responsibilities, an increasingly important part
of our strategy is to increase the role of other organisations in delivering early help, across
the public sector but also by developing voluntary sector engagement.
We will work across the council to ensure smooth transitions from Children's to Adult
Services. We will ensure that eligible young adults receive personalised support which
improves their outcomes, and the capacity of those with more complex needs to be cared
for within their local communities. Children's and Adult Services will continue to work
together to ensure that disabled young people with mental health needs and challenging
behaviour are cared for locally wherever possible, and that robust monitoring arrangements
are in place to safeguard and protect young adults who are placed in specialist out of area
placements outside Oxfordshire.
3.8

This Strategy contains priorities of direct relevance to Children, Education and Families,
and that are in keeping with the strategic direction set out above, including ensuring all
children have a healthy start in life and stay healthy into adulthood; narrowing the gap for
our most disadvantaged and vulnerable groups; keeping all children and young people
safe; and raising achievement for all children and young people.
The Children and Young People’s Plan 2013/14 is in the process of being updated, and will
be available early in 2015. It has been developed by the Children and Young People’s
Partnership Board, on which the council is a key partner. It is a partnership plan that sets
out the strategic direction for future services for children, young people and families in
Oxfordshire, and how organisations will work together to improve outcomes.
The Children and Young People’s Plan reflects the joint strategic vision from the Health
and Wellbeing Strategy and the Oxfordshire Safeguarding Children Board, and contains
the same vision and strategic priorities outlined above. The plan also draws on other key
strategies from the city and district councils and the county council (including the Education
Strategy and Placement Strategy) as well as the Operating Plan from the Oxfordshire
Clinical Commissioning Group.
7) Developing a balance of services provided by public, private and voluntary sector
organisations
The majority of services for children are provided by public sector agencies – the county
council and the NHS. Approximately a tenth of spend is through contracts with non-
statutory organisations providing a range of services from individual placements through to
respite care and Children’s Centres.
To enable families to have greater choice we will work to develop a vibrant and high quality
market for services for children and families. Good quality will be maximised through
commissioning expertise and effective contract management. Improved choice is likely to
extend to the development of personal budgets in the future.
Overview of other strategic plans
The Health and Wellbeing Board is a partnership between local government, the NHS and
the people of Oxfordshire. It includes local GPs, councillors, Healthwatch Oxfordshire, and
senior local government officers. The board has been set up to ensure that we work
together to improve everyone’s health and wellbeing, especially those who have health
problems or are in difficult circumstances. The board provides strategic leadership for
health and wellbeing across the county and is responsible for the development of
Oxfordshire’s Joint Health and Wellbeing Strategy.
3.9

How our services are changing
In summary, our further proposals for 2014/15 to 2017/18 are as follows:
Development of an Integrated Children’s Social Care and Early Intervention Service
We are continuing to review all of the services we provide for children and families. The
aim of this review will be to find innovative ways to save money whilst at the same time
maintaining frontline services, and to bring forward proposals to be implemented in the
2017/18 financial year.
We will be seeking to make better links between early intervention services, children’s
centres and children’s social care to create a more cohesive all-round service that
improves outcomes for children and young people. We will also be focusing on improving
the experience of children and young people and their families from needing care and
support to receiving it, and transitioning between services where necessary.
In future, we will continue to ensure the safety and wellbeing of children and young people,
whilst ensuring the services are delivered as efficiently as possible. We will also ensure
there is high quality educational provision in the county, and that there is appropriate
support available to children, young people and families when they need it.
However, to make the necessary savings we will focus on what we are required to do by
legislation, regulation or policy. We will support but no longer be a provider of universal
services, focusing on ensuring that services are targeted to those in greatest need.
We are already delivering a number of savings previously agreed, and changed the way
that some services are delivered. These include efficiencies in the way early help is
delivered through early intervention hubs, reducing management and administration costs
in children’s centres, reviewing how school improvement and foundation learning is
delivered, and working with providers to reduce the cost of home to school transport.
The review will also focus on ways of working with partner organisations and the
community to explore new ways of delivering services, such as increased use of
volunteers, or new sources of funding. We are already working with health commissioners
and providers to develop more joined up services and improved timely access to those
services. This might mean the joining up of teams and budgets in localities, and includes
the new autism residential academy as a way of providing the right support locally for those
with the most severe and complex needs.
3.10

Children’s Social Care
As part of our Placement Strategy, we are committed to ensuring children being looked
after by the council live as close to home as possible. This has benefits for the young
people and their families in staying in contact, and making it easier for them to return home
as soon as it is appropriate. We will therefore be investing in four new Children’s homes in
Oxfordshire, which will also reduce the cost of placements to the council as out of county
placements are higher cost than placements within the county.
We will also improve outcomes for children, young people and their families by streamlining
services between Early Intervention and Children’s Social Care and by working more
closely with partner agencies. The reshaping of Children’s Services will help us implement
the Placement Strategy, promote the use of family based services and permanency of
placements, and to make better use of early help services. We will deliver more joined-up
services that improve the experiences of young people who need and receive care, and
reduce duplication and the amount of ‘hand-overs’ between different services and
professionals.
Education Services (including Schools & Learning and Foundation Years)
We will change the way that a number of non-statutory education services are delivered, in
response to the changing relationships and responsibilities for schools and the council and
the need to find more efficient ways of working. This includes different ways to deliver the
Foundation Learning Service, which provides support for the education of 0 to 5 year-olds,
and to avoid duplication with other services.
Management of issues relating to the attendance of pupils at school is increasingly
transferring from local authorities to individual schools across the country, especially as
more schools convert to academy status and are therefore independent from local authority
control. We will therefore reduce the existing Attendance Service, but continue to fulfil our
legal obligations to manage cases where a pupil is regularly not attending school.
We are already implementing a planned reduction in our school improvement services, in
line with central government direction to promote the role of school to school support.
Increasingly, the good practice promoted within the variety of projects that we currently
fund is being embedded in schools, as demonstrated by improved attainment and the
number of schools rated good or outstanding by Ofsted. We have worked with schools to
set up their own improvement networks and partnerships, and the increasing autonomy of
schools will result in schools working with each other, bidding for external funding and
sharing pooled funding for future projects., Any additional developments that schools wish
to continue will be funded by school partnerships, and where projects have had an impact
on improved outcomes we will strive to share this practice and to identify those schools
who can champion these approaches.
3.11

Additional funding for staffing for the Multi Agency Safeguarding Hub
We shall continue to work with partners including the Thames Valley Police, Oxford Health,
Adults Services, the Fire Service and Trading Standards to further enhance the work of the
Multi-Agency Safeguarding Hub (MASH). It will lead to improved outcomes for children by
co-locating key safeguarding agencies, by enabling better information sharing and decision
making, identification of risk at the earliest possible opportunity, appropriate early and
holistic interventions, and a coordinated, effective and timely response. We will invest to
make sure that qualified and experienced staff are available within the MASH to provide
appropriate support and decision making.
We will continue to ensure we deliver our statutory responsibilities, such as short breaks
and accessible childcare for working parents with disabled children, whilst driving down
costs and reducing duplication and management.
Administration
As a result of the proposals outlined above, and other savings already agreed and
implemented, there will be a reduction in the support needs of specific services and the
directorate as a whole. Administrative support for the directorate will be reviewed and
reduced to reflect this, and to improve current practices to remove any unnecessary
activity, reconfigure staff structures and increase the use of apprentices where appropriate.
Disability and Special Educational Needs
We will continue to focus on keeping children with special educational needs and
disabilities (SEND) safe, keeping our riskiest and most vulnerable in local placements
wherever possible, maximising family resilience and improving children’s independence
skills and well- being. We will make strategic use of available funding and outcomes based
commissioning will be used to focus our resources to families in need of support, especially
those in the greatest need.
We will continue to reduce our use of expensive out of county placements for children and
young people, and challenge charges for post-16 services. We will work with partners and
providers of targeted and specialist services to maintain support to children with the highest
needs and enable them to live as close to home as possible, by developing cost-effective
local solutions such as the new residential autism academy.
Our arrangements for responding to the recent legislative changes are progressing well.
3.12

The Joint Commissioning team is a joint service supporting both Adult Social Services and
Children, Education and Families in commissioning, contract management, educational
and social care performance reporting and management, strategy and business planning,
engagement, advocacy and complaints. As above, a reduction in the support needs of
specific services and the directorate as a whole will mean there will also be a reduction in
many of these services, although we will seek to protect statutory functions and those that
safeguard vulnerable service users.
Joint Commissioning
3.13

Gross DSG (1) Other Recharges
Ref. Expenditure Income Income
£000 £000 £000 £000
CEF1 84,212 -43,114 -2,847 -1,022
CEF2 57,390 -1,834 -776 -529
CEF3 5,908 0 0 0
CEF4-1 226,074 -183,242 -22,395 0
CEF4 30,062 -30,138 616 0
403,646 -258,328 -25,402 -1,551
(2) 15,641 -4,316 0 0
419,287 -262,644 -25,402 -1,551
-146 0 0 146
419,141 -262,644 -25,402 -1,405
INCOME
Delegated
Schools
Budgets
CE&F
Excluding
School
Budgets
Delegated
Schools
Budgets
CE&F
Excluding
School
Budgets
£000 £000 £000 £000
146,092 55,730 -203,679 -81,605
26,834 5,475 0 -1,123
16,666 -22,395 -1,885
41,685 50,241
11,128 50,926 TOTAL INCOME -226,074 -84,613
14
13,645 NET EXPENDITURE 0 107,049
335 370
226,074 193,067
-1,405
226,074 191,662
(1) DSG - Dedicated Schools Grant
2015/16
£000 £000
Children, Education & Families - Summary
Revenue Budget 2015/16
Grant Net
Service Area Income Expenditure
Children, Education & Families Central Costs 0 5,908
Education & Early Intervention -665 36,564
Children's Social Care -1,539 52,712
Budget Controllable by Directorate -22,641 95,724
Delegated Schools Budgets -20,437 0
Other Schools Budgets 0 540
Less Recharges within the Directorate 0 0
Non Negotiable Support Service Recharges 0 11,325
Total Non Negotiable Support Service -22,641 107,049
TOTAL -22,641 107,049
Subjective Analysis 2015/16
EXPENDITURE 2015/16 Budget at Outturn Prices 2015/16 Budget at Outturn Prices
% %
Premises 2.8 Other Grants, 0.4
Transport 8.6 Customer & Client 7.8
Employees 28.9 Government Grants 91.8
Transfer Payments 0.0
Support Services 7.1
Supplies and Services 26.0
Agency & Contracted 26.4 100.0
(2) The presentation of the directorate summary has been updated to reflect a technical change to non-negotiable support service
recharges to show more clearly the budgets controllable by directorates
Recharges to other directorates
TOTAL EXPENDITURE
Capital Financing Costs 0.2
GROSS EXPENDITURE 100.0
3.14

Gross Grant DSG Other Recharges Net
Reference Service Area Expenditure Income Income Income Expenditure
2015/16
£000 £000 £000 £000 £000 £000
CEF1 EDUCATION & EARLY INTERVENTION
Deputy Director: Rebecca Matthews (Interim)
CEF1-1 Management & Central Costs 2,960 0 -424 0 0 2,536
Central strategic planning, administration, support
service recharges (£9.4m) and management of
operations for Education & Early Intervention.
CEF1-2 Additional & Special Educational Needs (SEN)
Strategy, policy and service development for children
with special educational needs. This includes statutory
responsibilities in relation to the identification and
assessment of, and provision for, children with special
educational needs, the provision of a Parent Partnership
Service, specialist SEN support services, including Early
Years and support for individual children with high level
needs, Statutory Educational Psychology functions and
funding for children with SEN in Out of County
placements.
CEF1-21 Special Educational Needs 25,120 0 -23,821 0 0 1,299
CEF1-22 SEN Support Services (SENSS) 6,330 0 -5,638 -643 -23 26
CEF1-23 Identification & Assessment 628 0 0 0 -90 538
CEF1-24 Early Years SEN Inclusion Teachers
(EY SENITS)
824 0 -824 0 0 0
CEF1-2 Subtotal Additional & Special Educational Needs 32,902 0 -30,283 -643 -113 1,863
CEF1-3 Early Intervention (EIS)
The Early Intervention Service (0-19) aims to support
children, young people and families to reach their full
potential and improve their life chances by providing
accessible services that target the most vulnerable.
The Early Intervention Service (0-19) will do this by:
• targeting vulnerable communities and children, young
people and families with additional and complex needs,
aged pre-birth – 19 years and up to 25 years for young
people with Special Educational Needs and care leavers;
• working holistically and intervening early to assist family
members to develop skills and resilience to resolve
existing concerns;
• working with our community partner agencies to ensure
we develop integrated, inclusive solutions taking into
account local strengths and local needs identified by
children, young people and their families
• delivering high quality, responsive support through
specialist central services, our local hubs, satellites and
Children’s Centres to improve outcomes for children,
young people and families.
CEF1-31 Early Intervention Hubs 6,888 0 -1,043 -15 0 5,830
CEF1-32 Children's Centres and Childcare 9,122 0 -1,387 -14 -41 7,680
CEF1-33 Youth, Engagement & Opportunities 1,838 0 0 -345 -12 1,481
CEF1-34 Thriving Families 243 0 0 0 0 243
CEF1-3 Subtotal Early Intervention 18,091 0 -2,430 -374 -53 15,234
Children, Education & Families - Revenue Budget 2015/16
3.15

Gross Grant DSG Other Recharges Net
Reference Service Area Expenditure Income Income Income Expenditure
2015/16
£000 £000 £000 £000 £000 £000
Children, Education & Families - Revenue Budget 2015/16
CEF1-4 Education
Schools and Learning ensures the Local Authority meets
its statutory duties in regard to School Improvement and
provides challenge and support where there may be
concerns about the quality of provision or progress.
Foundation Years ensures that the Council’s duties
under the Childcare Act are effectively discharged, as
well as strategic priorities for early education in the pre-
birth to five age range and in childcare.
CEF1-41 Schools & Learning 7,547 -665 -2,536 -1,830 -718 1,798
CEF1-42 Foundation Years 2,273 0 -2,273 0 0 0
CEF1-4 Subtotal Education 9,820 -665 -4,809 -1,830 -718 1,798
CEF1-5 School Organisation & Planning
The School Organisation and Planning Team is
responsible for:
Strategy for accurate place planning for schools and
settings and ensuring a sufficient supply of early years
childcare and school places. This includes opening new
schools and the planning and implementation of the
school and early years capital programmes.
Technical arrangements around new types of educational
provision (such as Free Schools) and managing the
conversion of schools to academies, including through
sponsorship.
School admissions and transport and access to all
schools across the county and cross border
arrangements with other local authorities.
CEF1-51 Early Years Sufficiency & Access 5,000 0 -4,693 0 0 307
CEF1-52 School Organisation & Planning 399 0 -44 0 0 355
CEF1-53 Admissions & Transport 15,040 0 -431 0 -138 14,471
CEF1-5 Subtotal School Organisation & Planning 20,439 0 -5,168 0 -138 15,133
CEF1 TOTAL EDUCATION & EARLY INTERVENTION 84,212 -665 -43,114 -2,847 -1,022 36,564
3.16

Gross Grant DSG Other Recharges Net
Reference Service Area Expenditure Income Income Income Expenditure
2015/16
£000 £000 £000 £000 £000 £000
Children, Education & Families - Revenue Budget 2015/16
CEF2 CHILDREN'S SOCIAL CARE
Deputy Director: Lucy Butler
CEF2-1 Management & Central Costs 3,769 0 0 0 -37 3,732
Central strategic planning, administration, and
management of operations for Children's Social Care.
CEF2-2 Corporate Parenting 15,373 0 0 -48 -60 15,265
The service supports the provider side of the looked after
service. This includes commissioning and monitoring
placements (residential, fostering, family/kinship care &
supported housing); adoption ; a range of preventative
services to prevent placement & family breakdown and
children/young people entering the care system, and
therapeutic interventions to support placement stability or
facilitate return home.
CEF2-3 Social Care
This service provides consultation in respect of
safeguarding for all child care agencies/members of the
public within Oxfordshire. It is also a front door into
children’s social care; receiving, assessing and if
appropriate signposting to other services.
Services include investigations of all referrals where
there are child protection or child sexual exploitation
concerns; direct work with children who are in need &
their families as well as children subject to child
protection plans; care proceedings/assessment of
families as alternatives to a child coming into care; direct
work with looked after children (overall responsibility for
care planning, health and education planning); support to
children leaving care and services to homeless young
people/families and services to Unaccompanied Asylum
Seeking children (UASCs) and young people with all
rights exhausted (ARE).
.
CEF2-31 Referral & Assessment 3,382 0 -316 -33 0 3,033
CEF2-32 Family Support 5,935 0 -102 0 0 5,833
CEF2-33 Looked After Children & Leaving Care 3,114 0 0 0 -369 2,745
CEF2-34 Placements 14,606 -64 -1,352 -268 0 12,922
CEF2-35 Asylum 1,268 -795 0 0 0 473
CEF2-3 Subtotal Social Care 28,305 -859 -1,770 -301 -369 25,006
3.17

Gross Grant DSG Other Recharges Net
Reference Service Area Expenditure Income Income Income Expenditure
2015/16
£000 £000 £000 £000 £000 £000
Children, Education & Families - Revenue Budget 2015/16
CEF2-4 Safeguarding 1,178 0 -64 -94 -53 967
Provision of the strategic and professional lead on
safeguarding, working in partnership with schools,
partner agencies, and the Oxfordshire Safeguarding
Children Board. The service:
Develops, implements, monitors and reviews effective
safeguarding policy, procedures, performance
management and quality assurance systems within the
Directorate and contributes to the corporate safeguarding
responsibilities of the County Council
Manages and administers the effective operation of the
Oxfordshire Safeguarding Children Board and continuous
improvement in safeguarding practice across all services
to children in the county.
CEF2-5 Services for Disabled Children 7,253 0 0 0 -10 7,243
The Children's Disability Service supports children and
young people with severe and complex disabilities. It also
provides support to disabled children who are in need,
who require safeguarding support or who are looked
after. Services include:
• Emergency care
• Relief to Carer Service
• Home Care Services
• Family Short Break Care
• Overnight Care at Short Break Centre
The budget also supports a range of open access and
targeted support services for disabled children which aim
to support families including siblings and keep children in
local placements wherever possible.
CEF2-6 Youth Offending Service 1,512 -680 0 -333 0 499
Oxfordshire Youth Offending Service (OYOS) is a
partnership service between Oxfordshire County
Council, Thames Valley Police, County Magistrates,
Mental Health Trust, NHS Primary Care Trust.
The service was established in October 1999 to reduce
the likelihood of offending & re-offending by young people
and prevent young people from entering the criminal
justice system for the first time.
In addition, it has a particular remit to help young people
repair the harm (both emotional and physical) they have
caused to the victims by their offending by using
Restorative Justice approaches.
The service also aims to re-integrate offenders into the
wider community and contribute to protecting the public
by supporting local crime-reduction strategies.
CEF2 TOTAL CHILDREN'S SOCIAL CARE 57,390 -1,539 -1,834 -776 -529 52,712
3.18

Gross Grant DSG Other Recharges Net
Reference Service Area Expenditure Income Income Income Expenditure
2015/16
£000 £000 £000 £000 £000 £000
Children, Education & Families - Revenue Budget 2015/16
CEF3 CHILDREN, EDUCATION & FAMILIES (CEF)
CENTRAL COSTS
CEF3-1 Management & Admin 487 0 0 0 0 487
Central strategic planning, administration, support
service recharges (£0.4m) and management of
operations for Children, Education & Families.
CEF3-2 Premature Retirement Compensation (PRC) 3,916 0 0 0 0 3,916
CEF3-3 Joint Commissioning Recharge 1,505 0 0 0 0 1,505
CEF3 TOTAL CHILDREN, EDUCATION & FAMILIES (CEF)
CENTRAL COSTS
5,908 0 0 0 0 5,908
CEF4 SCHOOLS
CEF4-1 Delegated Budgets 226,074 -20,437 -183,242 -22,395 0 0
CEF4-2 Early Years Single Funding Formula (Nursery
Education Funding)
25,360 0 -25,360 0 0 0
CEF4-3 Non-Delegated Schools Costs 1,318 0 -778 0 0 540
CEF4-4 Schools Support Service Non-Negotiable Recharges 217 0 -833 616 0 0
CEF4-5 Capitalised Repairs & Maintenance 3,167 0 -3,167 0 0 0
CEF4 TOTAL SCHOOLS 256,136 -20,437 -213,380 -21,779 0 540
DIRECTORATE TOTAL 403,646 -22,641 -258,328 -25,402 -1,551 95,724
Non Negotiable Support Service Recharges 15,641 0 -4,316 0 0 11,325
Less Recharges within the Directorate -146 0 0 0 146 0
TOTAL 419,141 -22,641 -262,644 -25,402 -1,405 107,049
3.19

Detail 2015/16 2016/17 2017/18 Total
£000 £000 £000 £000
Children, Education & Families (CEF) Cross Directorate
CEF1-1
CEF2-1
CEF3-1
15CEF10 S Reduce administration support in line with reductions in directorate services, seek
efficiency improvements.
-500 -500
CEF1, CEF2,
CEF4
16CORP4 NS Reduce the use of agency & contracted staff and introduce a vacancy factor for
administration staff
-639 -639
CEF1-21
CEF2-5
15CEF11 S Develop more integrated management across Special Educational Needs (SEN) &
Disability. Challenge costs of 16+ SEN responsibilities transferred into OCC from
Education Funding Agency, obtaining savings within Dedicated Schools Grant (DSG)
funded SEN services that enable a larger DSG contribution to the educational cost of
placements.
-1,200 -1,200
CEF3-3 15CEF12 S Reduce support services from Joint Commissioning team in line with other service
reductions. Reduce non-statutory public engagement activities.
-500 -500
CEF2 16CORP2 NS Supplies & Services -19 -19
CEF2-3
CEF1-3
15CEF 2 and
16CEF4
S & NS Implementation of an integrated Children's Social Care and Early Intervention Service. -1,000 -2,000 -3,000 -6,000
Total Children, Education & Families (CEF) Cross Directorate -1,658 -4,200 -3,000 -8,858
Education & Early Intervention
Early Intervention
CEF1-32 15CEF1 S On-going effect of rephasing previous savings CEF10c and 14CEF4 relating to Children's
Centres
-499 -499
Subtotal Early Intervention -499 0 0 -499
Education
CEF1-41 15CEF5 S On-going effect of reducing Attendance service from Sept 2014 -100 -100
CEF1-41 15CEF6 S Further reduce staffing of School Improvement services -75 -75
Subtotal Education -175 0 0 -175
CEF1 Total Education & Early Intervention -674 0 0 -674
Children, Education & Families - Budget Changes
Budget Book
Reference
Type of
Budget
Change
Reference ID
3.20
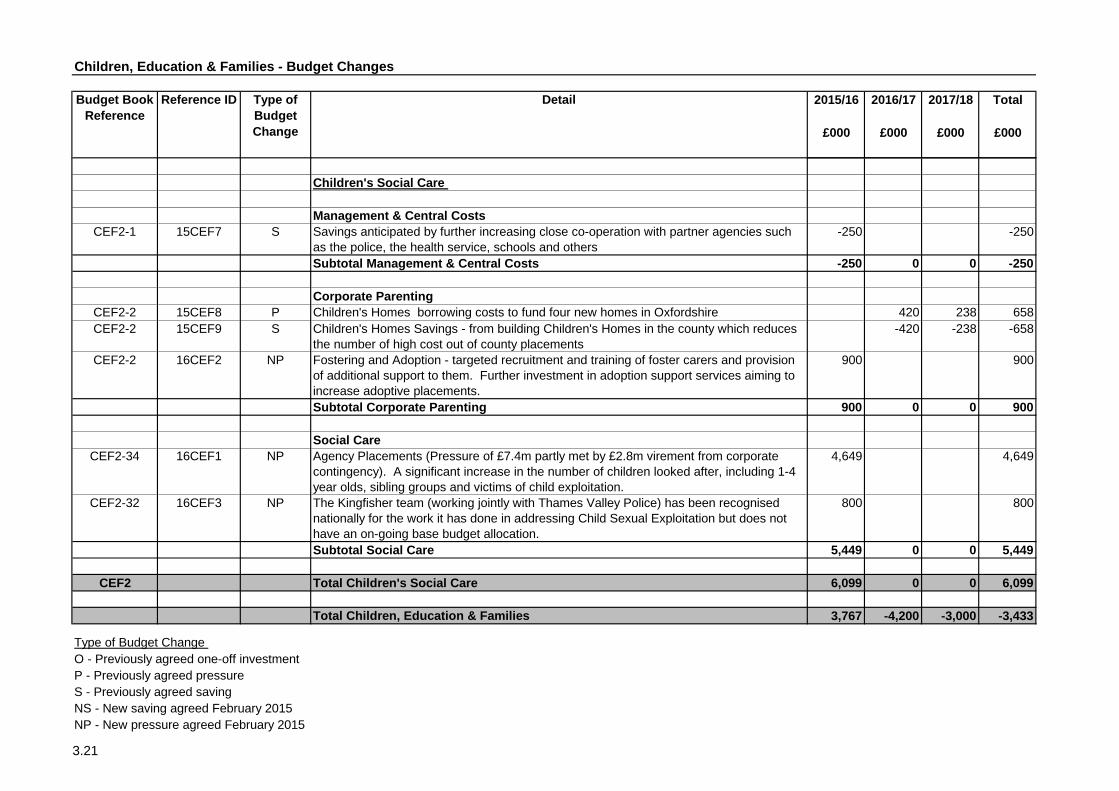
Detail 2015/16 2016/17 2017/18 Total
£000 £000 £000 £000
Children, Education & Families - Budget Changes
Budget Book
Reference
Type of
Budget
Change
Reference ID
Children's Social Care
Management & Central Costs
CEF2-1 15CEF7 S Savings anticipated by further increasing close co-operation with partner agencies such
as the police, the health service, schools and others
-250 -250
Subtotal Management & Central Costs -250 0 0 -250
Corporate Parenting
CEF2-2 15CEF8 P Children's Homes borrowing costs to fund four new homes in Oxfordshire 420 238 658
CEF2-2 15CEF9 S Children's Homes Savings - from building Children's Homes in the county which reduces
the number of high cost out of county placements
-420 -238 -658
CEF2-2 16CEF2 NP Fostering and Adoption - targeted recruitment and training of foster carers and provision
of additional support to them. Further investment in adoption support services aiming to
increase adoptive placements.
900 900
Subtotal Corporate Parenting 900 0 0 900
Social Care
CEF2-34 16CEF1 NP Agency Placements (Pressure of £7.4m partly met by £2.8m virement from corporate
contingency). A significant increase in the number of children looked after, including 1-4
year olds, sibling groups and victims of child exploitation.
4,649 4,649
CEF2-32 16CEF3 NP The Kingfisher team (working jointly with Thames Valley Police) has been recognised
nationally for the work it has done in addressing Child Sexual Exploitation but does not
have an on-going base budget allocation.
800 800
Subtotal Social Care 5,449 0 0 5,449
CEF2 Total Children's Social Care 6,099 0 0 6,099
Total Children, Education & Families 3,767 -4,200 -3,000 -3,433
Type of Budget Change
O - Previously agreed one-off investment
P - Previously agreed pressure
S - Previously agreed saving
NS - New saving agreed February 2015
NP - New pressure agreed February 2015
3.21

Social and Community Services
4.1


Adult Social Care
Business Strategy 2015/16 to 2017/18
Directorate Overview
The Social & Community Service's vision is to support and promote strong communities so
that people live their lives as successfully, independently and safely as possible. We
believe that people themselves, regardless of age or ability, are best placed to determine
what help they need.
Local Authorities have a statutory duty to meet the needs of older, disabled and vulnerable
people and their carers - this includes older people, adults with learning disabilities, adults
with mental health problems and those with physical and sensory impairments. Social care
needs are, in summary, activities of daily living, personal care such as going to the toilet,
help with bathing and eating and in some circumstances help with occupation and activities
during the day (for example for younger adults who may require access to training and
employment). Access to support is normally through a professional assessment of need,
guided by nationally set eligibility criteria. Local authorities can take resources into account
when determining how those assessed needs should be met but we cannot refuse to meet
people’s eligible care needs.
People who meet the criteria for social care are financially assessed to see how much they
should pay. Everyone in a care home makes a contribution towards the cost of their care,
but people with over £24,000 of savings have to pay for all of their care costs irrespective
of how that is provided. A significant proportion of older people in Oxfordshire fund their
own care.
Over 90% of social care locally is delivered by third parties via a contract with the council.
Working in partnership with the National Health Service, the council has a role in ensuring
that there is a range of good quality services available to support people.
4.2

Adult social care (in partnership with the Oxfordshire Clinical Commissioning Group)
spends in excess of £330m per year on external services through its Pooled Budget
arrangements. These services include a wide range of small, medium and large
organisations either based or working within Oxfordshire and contribute to a significant
number of employment and training opportunities across the county.
Delivering the council’s corporate priorities
Thriving economy
Support for the vulnerable
Thriving people and communities
Prevention is also key to our approach in adult services. We want to keep people well and
help them to live at home and remain active in their local communities for as long as
possible, and avoid, reduce and delay the need for more complex care or admission to a
care home. We will continue to enable people to live at home for longer through investment
in equipment and assistive technology. We are working with our district council colleagues
to increase Extra Care Housing, which enables people to live independently with varying
levels of care and support on site.
Community development - including working in localities with districts, the NHS, and
providers including the voluntary sector to support local decision-making about how best to
support older people in their community - also remains important. We are investing in
community information networks to support people to stay in their communities for as long
as possible by helping them access the information, advice and local services they need to
make informed choices about how best to meet their needs.
We will continue to provide information and support to individuals and their carers to
ensure people can live a life free from abuse and the fear of abuse and can have care and
support which meets their needs. We will treat people as individuals and with dignity and
respect. We will invest in reablement – this means helping people to maintain or regain
their independence by learning or re-learning the skills necessary for daily living.
4.3

How we work to deliver these priorities
We are rolling out a programme of ‘agile working’ in order to support the new ways of
working necessary to deliver these priorities. Agile working means: giving staff the right
equipment and working environment to suit their role and service; working in a more
flexible way that makes best use of staff time, buildings, and resources; and taking
advantage of changes in technology and working styles to become more efficient. This will
ultimately protect delivery of front line services as far as possible. For example, we have
good working relationships with health, and staff are able to work from offices at the
Oxfordshire Clinical Commissioning Group and John Radcliffe Hospital. The Health and
Wellbeing Resource Centres are used by health services and voluntary organisations to
extend the use of the building and offer important support to service users.
4.4

1)
2)
3)
4)
5)
To ensure people can live a life free from abuse and the fear of abuse.
Ensuring people have more choice and control over the way they are supported.
To develop long term support options that reduce the number of people admitted to
care homes (especially residential care homes which do not provide nursing support),
increase alternatives to care and develop community support that continues to keep
people safe in their own homes.
To facilitate a market of good quality services that can be used by everyone.
We have worked closely with providers of services to reduce the impact of price increases,
and to maintain the cost of home care, which is currently £19.40 per hour. The number of
staff employed by Adult Social Care has fallen by almost 30% since 2010, due to the
outsourcing of services previously provided internally including the home support,
reablement and Supported Living services.
We have also improved the links between health and social care, including a significant
increase in the amount of money that is spent from pooled budgets between the council
and Oxfordshire Clinical Commissioning Group. Currently, we pool 99% of the adult social
care budget to improve the links between health and social care.
The key elements of our strategy are:
Our Strategy and Approach
Keeping people well through investment in services that prevent some people from
needing social care, reducing or delaying the need for care
Services and PrioritiesWhat has already been achieved?
Adult social care has already delivered savings of £47m by the end of 2014/15, whilst
meeting increased demand for care. Between April 2012 and April 2013 7% more older
people; 14% more adults with a learning disability and 18% more adults with a physical
disability have been supported. In the 18 months since April 2013, 2% more Older People,
8% more adults with a learning disability and 8% more adults with a physical disability have
been supported)
Since April 2012 all adults eligible for social care support from the council have had their
own personal budgets to use to make their own choices and have greater control over the
way they live their lives. In 2013/14, we were in the top quartile of authorities offering
personal budgets and had the 4th
highest use in the country of direct payments.
4.5

We do this by providing services such as home care, respite, day services, occupational
therapy and equipment in people’s own homes. We are also developing alternative
housing options that reduce the number of people admitted to care homes such as Extra
Care Housing and Supported Living. We work with the Oxfordshire Clinical Commissioning
Group who commission health care and NHS providers to provide better round the clock
health care to prevent hospital admissions for the most complex needs and to discharge
people back home. This includes multi agency integrated teams and joint commissioning.
To facilitate a market of services that can be used by everyone and that support the
capacity of communities to care. There is a focus on quality, contract management and
encouraging consumer feedback.
1) Keeping people well
Providing low level support to keep people well and prevent them from needing more
intensive (and expensive) care. Services include information and advice, reablement (to aid
recovery after illness), falls prevention, support to family carers, employment, assistive
technology, equipment and day services.
We use a set formula to calculate how much money (personal budget) should be allocated
to a person who is eligible for support from adult social care. The size of the personal
budget will reflect the scale and complexity of their care needs but also the availability of
informal care from their families and friends. People can choose to be given money in the
form of a Direct Payment to buy their own care. We are still responsible for making sure
that their eligible care needs are met.
4) Develop long term support options that reduce the number of people admitted to
care homes
2) Ensuring people can live a life free from abuse and the fear of abuse
The council has a safeguarding role for all vulnerable adults, ensuring that people live their
lives free from abuse and taking action to protect people where necessary. In 2013/14
there were 3,517 safeguarding alerts raised, 648 converted to referrals.
3) Ensuring people have more choice and control
5) Market facilitation
Since January 2014 we have published three Market Position Statements covering the
areas of Home Support, Extra Care Housing and Care Homes. In these statements there is
a commentary on how the services fit within the national and local strategies; demand and
supply within Oxfordshire; available budgets and our future service model and the
challenge for providers.
4.6

To facilitate closer working, the Director of Adult Social Services with the County Council
also holds the post of Director of Strategy & Transformation at the Oxfordshire Clinical
Commissioning Group
The Health and Wellbeing Board provides strategic leadership for health and wellbeing
across the county and is responsible for the development of Oxfordshire’s Joint Health and
Wellbeing Strategy. This Strategy contains priorities of direct relevance to Adult Social
Care, and that are in keeping with the strategic direction set out above, including:
supporting adults with long term conditions, physical or learning disability or mental health
problems to live independently and achieve their full potential; supporting older people to
live independently with dignity whilst reducing the need for care and support, and; working
together to improve quality and value for money in the Health and Social Care System.
The council also has Joint Commissioning Strategies, developed with the Oxfordshire
Clinical Commissioning Group and service users and carers, that set how we will work
together to ensure the needs of specific groups of people will be met. These include
people with learning disabilities, autism, physical disabilities, mental health, and older
people. Work is underway to develop a new Learning Disability strategy- the Big Plan.
Work will be started this year to develop a new Mental Health strategy.
Working with Health
Overview of other strategic plans
We need to work even more closely with Health partners. One of the main concerns from
people needing care is that the different groups of care professionals don’t talk to each
other and there are too many “handoffs or handovers”. The challenges facing the health
service are the same as those facing adult social care. There are increasing demands for
care from a relatively small proportion of the population. Financial resources are not
increasing in line with those demands so we need to focus on intervening early and quickly
to limit the extent to which care needs increase. This will require radical changes in health
in particular as resources are focused on care in the community rather than in hospitals.
The Health and Wellbeing Board is a partnership between local government, the NHS and
the people of Oxfordshire (chaired by the Leader of the council). It includes local General
Practitioners, councillors, Healthwatch Oxfordshire, and senior local government officers.
The board has been set up to ensure that we work together to improve everyone’s health
and wellbeing, especially those who have health problems or are in difficult circumstances.
The creation of Health and Wellbeing Boards has brought local government much closer to
decision making within the health service.
Integrated neighbourhood teams will be in place during 2015 which will bring together
social workers and occupational therapists with community health staff and GPs. Joint
commissioning strategies for all our client groups have now been agreed. A larger pooled
budget with the Oxfordshire Clinical Commissioning Group has the potential to move
resources to where they will achieve the best outcomes for people.
4.7

We also continue to work closely with colleagues in the NHS to develop plans that support
more seamless working across health and social services and more efficient use of
resources. This includes the Better Care Fund that will see around £37m dedicated to this
purpose from 2015 onwards.
4.8

We will continue to focus on reducing the numbers of people who need personal care, by
focusing on intervening earlier to prevent people needing any care or to reduce the level of
their care needs. We will also continue to explore and exploit ways to reduce the cost of
providing care, such as working with providers to reduce the hourly rates without
compromising quality and increasing the use of assistive technology. We will also seek to
charge for services wherever possible and sensible to do so, without placing people at
unnecessary risk if they cannot afford to pay for their care.
We are already delivering a number of savings previously agreed, and this includes
changing the way that some services are delivered. These include efficiencies in the
provision of services for older people, investing in preventative services and equipment to
support people to live at home and reduce the cost of care in the longer term, reviewing
existing contracts and working with providers to reduce cost to the council, reviewing the
Learning Disability Integrated Social and Healthcare Teams, and reviewing the level of
funding people need to meet their eligible care needs as a result of more efficient services.
In summary, our proposals are as follows:
Investment to help meet increased demand for social care
In future we will focus on continuing to ensure there is good quality support available to
meet the assessed needs of eligible people, supporting them to live independently and
keep well whilst ensuring the services are delivered as efficiently as possible. However, to
make the necessary savings we will stop supporting non-statutory activities which are not
essential for adult social care.
We have started to implement changes in October 2014 and we are working to deliver new
outcomes based arrangements for home support by April 2016.
How our services are changing
The budget is set assuming that the increase in demand for care is in line with funding for
demography of £5m. There is also funding of £6m to support increased activity in Learning
Disabilities (see below). For Older People numbers have remained constant in the year to
date but the average package of care has increased. The numbers in care homes has not
increased.
Create a more personalised approach to home support which will include removing
short visits for personal care for older people
We have ensured that no home care visit offering personal care is too short for the service
user to be treated with dignity and respect. Often home support for older people has
become too focused on time and task, as opposed to good outcomes for the individual.
Sometimes visits are too short for the care recipient to be treated with dignity and respect.
We will link this funding to an improvement in performance for home support based on the
needs of the older person.
4.9

In 2014/15, there has been increased demand for support for Learning Disability clients in
excess of the demography funding available. This has arisen from changes in family
circumstances which means greater support is needed from Adult Social Care. The budget
allows for a temporary investment of £6m in 2015/16 with a target to recover this amount
over the next three years.
We are already working with providers of care and support to explore ways of delivering
care in a more cost effective and efficient way. This is being achieved through better use of
assistive technology to replace paid support; development of properties to deliver greater
economies of scale and to support people in their own homes in the community rather than
in a residential setting; increased use of community resources; decommissioning of
services which are no longer affordable; as well as developing new and improved services
which meet the needs of individuals, offer a quality service and are affordable within
personal budgets.
Resources from the Better Care Fund to protect adult social care services
Central Government has announced that, nationally, £3.8 billion of NHS funding will be
made available to protect adult social care and to reduce unplanned emergency
admissions through the Better Care Fund. Oxfordshire’s share of this is around £37m from
2015/16 onwards, of which around £19m will be money not previously available to support
adult social care or community health services. We are working with partners in the
Oxfordshire Clinical Commissioning Group, Oxford University Hospitals Trust and Oxford
Health NHS Foundation Trust to agree how this will be utilised to improve outcomes for
service users. Some of the resources are dependent on performance on a number of
measures specified in national guidance. The focus of the Fund is on improving outcomes
for frail older people and thus reducing the pressures on the health and social care system.
Working closely with providers to generate efficiencies in contracted services
We will work closely with providers in the planning, delivery, monitoring and review of local
services, and introducing more outcome based service contracts. We will also encourage
the use of provider self-assessment systems and user evaluation of services, work with
providers to review and reduce back-office costs and find transactional cost efficiencies
such as shared training, and jointly develop a social care workforce strategy for the county.
Alongside this and to generate further efficiencies we will continue to promote reablement
and recovery throughout all services to ensure that resulting support packages are
appropriate to a person's needs, promote the expansion of Self Directed Support and a
direct relationship between service users and providers. We will also set annual price
reviews based on an improved understanding of the cost of care in Oxfordshire. We will
review high cost placements and wherever possible secure alternative provision at a more
affordable cost that continues to meet a person's needs. We are working with the
Oxfordshire Association of Care Providers to develop a stronger communication network
and develop further capacity in high quality services, to support those most vulnerable in
Oxfordshire.
Learning Disabilities - manage pressures by 2017/18 within the resources available
in the medium term plan.
4.10

This approach has proved successful for a number of years, increasing efficiency and
delivering positive outcomes and increased independence for people with learning
disabilities. It is proposed to continue this approach to be able to deliver further savings.
We will continue to work in close partnership with support and housing providers and by
involving people with learning disabilities and their representatives in decision making and
planning.
We are developing our strategy and commissioning intentions for people with learning
disabilities alongside providers and service users. The Big Plan sets out how people with
learning disabilities will have increased independence and access to the services that
everyone else does rather than specialist resources.
Review of information and advice services
We currently spend £1.2m on information and advice services.
We will undertake a full review of these services, to ensure that they are providing value for
money, are in line with the ambitions of the Care Act and are the most effective way of
helping people understand and access the care they need. This will include consultation
with service users and providers of services, and will result in changes to the services that
are commissioned as well as reviewing individual contracts.
Supporting our staff to work more efficiently, reducing bureaucracy and streamlining
process
We are undertaking a comprehensive review of existing processes and procedures, with
the aim of delivering more than 10% improvement in productivity through better ways of
working. This will reduce pressures on staff, enable quicker responses and create more
capacity to cope with increasing safeguarding alerts.
Adult Social Care Funding Reform from 2015 onwards will mean our services will need to
meet increased demand for new assessments. This increased activity will result from
people who previously would have self-funded their care and will now be seen much
earlier, and in monitoring care accounts to ensure people do not spend beyond the
governments stated cap on care costs of £72,000 in their lifetime. The Government is
providing additional money to cover the increased demand for assessments so, by using
smarter working to free up operational staff to meet the additional demands resulting from
funding reform without requiring further investment, an overall saving can be made whilst
minimising the risk of redundancies
Reduction in line with central government reductions in Supporting People funding
Central Government gives the county council funding for housing related support
(previously known as the Supporting People fund). This is used to pay for hostels for
homeless people, floating support and housing support for victims of domestic violence
and people with drug problems. The Government funding has significantly reduced year on
year and is now less than our actual spend (£9.5m compared to £15.4m). The county
council has already reduced spend by £2.3m but absorbed the remainder of the funding
reduction, largely protecting spending on housing related support of most importance to
district councils and Oxford City Council.
4.11

The scale of the reductions in funding means that more savings will need to be found over
the coming years. We believe it will be possible to further reduce the demand for care for
older people by investing in preventative services, and to challenge the price paid for care
and support more effectively. There may also be scope to reduce demand as a result of
investments from the Better Care Fund. Detailed proposals will be developed over the
period based on what is already working in reducing costs and new ideas as appropriate,
and brought forward for approval by Cabinet at appropriate times
Given the current financial circumstances we cannot afford to continue with this
arrangement, and have proposed that funding is reduced by 38% to bring spending in line
with the amount of money we receive from government. In 2013/14 we have worked
closely with the district and city councils to consider how best to manage this reduction and
developed proposal for how to implement this reduction in funding over two years from
April 2015 to March 2017. These proposals have been consulted on over the summer and
subsequently have been approved by the Health Improvement Board and by the Health
and Wellbeing Board in the autumn. We are developing an implementation plan together
with commissioning partners and providers, which will be put into practice once the Cabinet
has considered these proposals in early 2015.
Continued work to identify further savings
4.12

Fire and Rescue Service
Business Strategy 2015/16 to 2017/18
Delivering the Council’s corporate priorities
Incorporating Emergency Planning, Trading Standards and Community Safety Services
Directorate Overview
This Business Strategy covers the Fire & Rescue Service, Emergency Planning and
Community Safety Services. The Strategy has been updated in order to capture the
medium term (3-5 year) vision for all of the Services identified, as well as their aims to meet
the current priorities of the wider county council.
The strategy links directly with the Corporate Strategic Objectives centred on delivering a
Thriving Oxfordshire:
Thriving Economy – This objective will be supported through our contribution to the
sustainable development and protection of the thriving local economy by provision of
advice and support. This will enable local businesses and industry to successfully compete
in the marketplace, ensure their business continuity, minimise the likelihood and impact of
regulatory challenge and minimise the likelihood of emergencies (e.g. accidents and fires).
More broadly, the services also protect the environment for example, reducing both carbon
emissions and emergency incidents, as well as through partnership working with partners
such as the Environment Agency to help minimise the effects of flooding, pollution
incidents and fire-fighting actions, as well as promoting quicker recovery.
Thriving People and Communities – This objective is supported by our work to support
and protect those at greatest risk from doorstep crime, fraud and scams, domestic abuse
and hate crime. In addition, we safeguard our communities from fire risk through the
provision of fire protection risk reduction, intervention activities and the provision of
information, advice and guidance. We are bringing our Trading Standards and Fire
Protection and Prevention team together to ensure we support businesses in a more
effective and joined up way. We also provide (directly or with partners) preventative
programmes for children and young people at risk of offending. We manage and deliver the
Junior Citizen Programme countywide as well as the Consumer Challenge Quiz for children
with special needs. We support partners to reduce crime, anti-social behaviour and fear of
crime. Our Trading Standards Service is a key player in the development and delivery of
the ‘Support with Confidence’ approval scheme enabling social care clients to make safer
choices about the care they receive. Emergency Planning helps to develop service,
organisational and community resilience through education, training and the development
of community led planning.
4.13
Fire & Rescue and Emergency Planning have delivered savings totalling £1.256m by
service reviews and more effective ways of working
Trading Standards has delivered savings totalling £0.79m by restructuring the service
and generating additional income
The Gypsy & Traveller Service is managing contracts with other local authorities who
are contributing £0.1m per annum to management and overheads. The service is self-
financing.
Going forward we are carrying out a LEAN review of our protection and prevention
functions as part of the wider integration with Trading Standards, to ensure that we are
focusing on the customer and are working in a more flexible way that makes best use of
staff time, buildings, and resources; and taking advantage of changes in technology and
working styles to become more efficient. This will ultimately protect delivery of front line
services as far as possible.
Support for the vulnerable - This objective will be supported by the OFRS integrated
approach to community and home safety ensuring that we contribute to this objective
through collaboration and information sharing with local partners. We are embedded into
the Thriving families programme board and are looking at how we can assist the
programme in meeting its outcomes, e.g. developing the future Carterton Fire Station as a
community hub with Social and Community Service providers. We are currently working
with the teams from Public Health to work with the most vulnerable adults and children in
our communities to ensure that they are able to be cared for in their local environment and
are given the support and advice needed. The Trading Standards Service continues to
provide direct support to vulnerable victims of scams and doorstep crime incidents.
Finally, all the services strive to deliver efficiency programmes and provide value for money
in general. This is being achieved at a local and regional level to increase efficiency further,
the Fire & Rescue Service working within the Thames Valley and with other neighbouring
Fire and Rescue Services on various collaborative activities.
We have already been working towards the above priorities and as a result have already
delivered the following savings for the public in the Fire and Rescue Service, Trading
Standards and the Gypsy and Traveller Service since 2010:
How we work to deliver these priorities
4.14

Flexible use of firefighters – this has enabled full-time firefighters to work more
dynamically rather than being based in one location. This has enabled OFRS to utilise
them in a more flexible way to ensure we maximise on-call station availability and
response times across the county.
Joint working with Thames Valley Police and Social and Community Services – our
response strategy has identified the need for a response resource in the Carterton
area and we are working with colleagues from the Police Service and Adult Social
Care Services to develop an integrated approach to any new development. This will
ensure that the asset will be available to the community as well as the Emergency
Services.
We have already started to deliver benefits to service delivery through:
Medical Response to emergency incidents – we have been working with the
ambulance service to provide First Person on Scene medical response where they
have been facing challenging response scenarios. This has been trialled at Thame
Fire Station which has seen an increase in emergency calls which has delivered
benefits to the community and the fire service through improved intervention times and
improved morale for staff. This service has been stood up across Oxfordshire over the
Christmas period to support the ambulance service with the unprecedented increase
in 999 calls at this time.
Remote Working - we have worked with staff who live significant distances from their
work base and identified whether they are able to work from another location or from
home.
On–call station support officers - these are based in our local communities to support
the community and the station personnel and work flexible hours to meet the
requirement of both parties. They are based at the on-call stations which has been
possible due to the improved network availability and accessibility of the ICT
infrastructure.
We are currently working with the county council’s Asset Utilisation Programme team
about the option for staff who need to be re-located to work at our on-call fire stations
either as a permanent base or as a drop in centre. This is being trialled at three
locations where there is an identified need for a remote location for council staff to be
able to use.
4.15

Collaboration with other Fire & Rescue Services to deliver efficiencies.
Save 365 lives – reduce the loss of life in fires and road traffic collisions through the
prevention, protection and response work of the Fire and Rescue Service.
Save the economy £100,000,000 – through the reduced number of incidents, injuries
and deaths and their direct and indirect costs to the economy.
Deliver 840,000 safety messages to make people safer – through the prevention work
of the Fire and Rescue Service and other partners.
Our purpose is to secure a safer Oxfordshire. This plan identifies the risks to public and
firefighter safety, and sets out the things we are doing, and plan to do, to control them. Our
approach is to prevent incidents happening, protect against their impact and respond
quickly and effectively to minimise their effect to people and their communities.
We have a measurable 10-year strategic aim, known as ‘365 Alive’, which was launched in
2006 and sets targets to save lives, save money for the Oxfordshire economy and make
our communities safer through education.
Services and Priorities
Fire and Rescue Service and Emergency Planning
Specifically, our three strategic targets are, by 2016, to:
We are pleased to announce that in 2014, two years early, we achieved our strategic
aim. As a result we have set a 25% per cent increase on our annual targets for the last two
years which are designed to ensure that we “stretch” ourselves to meet them.
We have set out the following principles to support these strategic aims through effective
and efficient working:
A truly integrated cross directorate/multi agency approach – adding value across
Oxfordshire County Council
A prioritised & intelligence led approach to keeping Oxfordshire's communities safe
Focus on prevention across Fire & Rescue and Trading Standards
Protecting the emergency response function
Fire & Rescue - Addressing the future risk profile in Oxfordshire to ensure we are ‘fit
for purpose’.
4.16

This strategy is aimed at saving lives in the home and on the road by identifying,
assessing, reducing and controlling the risks to our community from fire and other
emergencies. It highlights a shift in emphasis on preventing fires and other emergencies
before they occur, while maintaining an effective response. It provides a strategic planning
process that ensures the right resources are in the right place at the right time.
These strategic aims and principles are in support of our statutory responsibility to provide:
These responsibilities are requirements of the Fire and Rescue Services Act 2004,
Regulatory Reform (Fire Safety) Order 2005, Civil Contingencies Act 2004 and the Fire and
Rescue National framework document and they underpin the service’s community risk
management plan 2013-2018 and our annual community risk action plans.
Fire and other safety related prevention/Educational Activities,
Fire protection advice and enforcement
Operational 999 blue light call handling, training and response activities
Road Safety Advice and Education
Community resilience
The strategy builds upon our improvements in service delivery and fire fighter safety and
ensures that the service reflects the needs of our communities.
We are also focusing on community resilience through our emergency planning team
working both at a local level - to develop focused plans within our local communities - and
also with the Thames Valley Local Resilience Forum through sharing of notable practice
and learning activities with the key partners across the group.
Trading Standards
The Trading Standards Service enforces approximately 80 Acts of Parliament and several
hundred sets of subordinate legislation on behalf of the council. The wide remit of the
Service includes but is not limited to activities such as food safety, fair trading and fraud,
farm animal health and welfare controls, age restricted sales, product safety and storage
and sale of hazardous substances.
In addition the service provides an enforcement service in relation to overweight heavy
goods vehicles.
4.17

A set of strategic objectives have been agreed for the Trading Standards Service. These
include:
The Gypsy & Traveller Service provides landlord services for some 80 families resident on
the county council’s six permanent sites as well as safeguarding the county’s settled
communities from the problems associated with unauthorised encampments. The service
also provides this function for Buckinghamshire County Council and Brent Housing
Partnership which generates additional income to off-set costs. In addition the Service has
been approved to provide Gypsy and Traveller Services to Ealing Council under a contract
which should be finalised for 2015/16
Gypsy and Traveller Service
Ensuring strong and well publicised business support services that enhance the plans
for growth in Oxfordshire.
Developing stronger ties with partners, such as Citizens Advice locally, and
partnerships, such as the Health Improvement Board, to ensure a seamless customer
response to consumer problems in Oxfordshire and provide support for wider priorities
in Oxfordshire.
Supporting and strengthening safeguarding mechanisms for vulnerable people and in
the new personalised care and support market
4.18

How our services are changing
The Cabinet has already endorsed Fire & Rescue response targets (80% incidents
attended in 11 minutes, 95% in 14 minutes).
We will always maintain an emergency response to calls for assistance. However, our
emphasis towards securing a safer society has shifted to also encompass prevention and
education. Multi-skilled employees along with voluntary agencies and other partners, help
promote risk awareness, self-help, safeguarding and will sign-post specialist assistance
and support when required. This approach embraces the preventative agenda and reduces
the call on other council services such as Adult Social Care, which helps support the
elderly.
The current targets can reasonably be expected to be met, with a minimum station
disposition (using predominantly On-call Duty System staff) of 24 fire stations and 34 front
line fire appliances.
We are working with colleagues in the Economy and Environment Directorate to ensure we
continue to monitor the planned developments within the county and identify developing
risks in those areas to ensure that our resources are allocated to meet the future needs,
whilst maintaining the agreed response targets across Oxfordshire. We are looking for
wider collaboration opportunities with other local authorities and community partners which
will focus on outcomes rather that outputs to meet the community’s needs.
The following areas of work have already been agreed within the current business strategy.
Thames Valley Fire Control receiving emergency calls for Oxfordshire,
Buckinghamshire and Berkshire.
New crewing models for specialist appliances
Reduction in pension payments
Review of working patterns
Refocusing and reducing our support to community safety partnership coordination
Increasing income in Trading Standards through enhanced business support and
training services
4.19

Developing further opportunities to generate income
Further prioritisation in Trading Standards including reducing our product testing work
Renegotiating the funding arrangement for the Police Officer secondment to the
Doorstep Crime team
Alignment of Business Continuity with Fire & Rescue
New proposals:
Integration of Trading Standards with prevention and protection teams.
Delivering efficiencies through further collaboration with neighbouring Fire and Rescue
Services
Increased income generation through trading activities
Look at staff and building requirements
Identify opportunities for sharing buildings
Working with partners to ensure we collaborate where we can
Working with local communities to help them develop their plans to prepare for local
emergencies e.g. flooding
4.20

Grant Other Recharges Net
Ref. Service Area Income Income Expenditure
2015/16
£000 £000 £000 £000
SCS1 0 -7,517 -8,487 166,402
SCS2 0 -326 -2,401 4,436
SCS3 0 -1,691 0 1,502
SCS4 Fire and Rescue & Emergency Planning 23,104 0 -521 -4 22,579
0 -10,055 -10,892 194,919
(1) Non Negotiable Support Service Recharges 0 0 0 13,829
0 -10,055 -10,892 208,748
0 0 8,979 0
0 -10,055 -1,913 208,748
INCOME
£000 % £000 %
30,143 13.7 0 0.0
3,974 1.8 75.5
989 0.4
4,392 2.0 -2,467 24.5
4,197 1.9
176,106 79.8 -10,055 100.0
Capital Financing Costs 915 0.4
208,748
220,716 100.0
-1,913
218,803
£000
Social & Community Services - Summary
Revenue Budget 2015/16
Gross
Expenditure
Supplies and Services Customer & Client Receipts
Less Recharges within the Directorate -8,979
Adult Social Care 182,406
Joint Commissioning 7,163
Community Safety 3,193
Total including Recharges 215,866
13,829
Total Non Negotiable Support Service 229,695
-7,588Transport
TOTAL 220,716
Subjective Analysis 2015/16
EXPENDITURE 2015/16 Budget at
Outturn Prices
2015/16 Budget at
Outturn Prices
Employees Government Grants
Premises Other Grants, Reimbursements &
Contributions
Agency & Contracted
Support Services TOTAL INCOME
(1) The presentation of the directorate summary has been updated to reflect a technical change to non-negotiable support
service recharges to show more clearly the budgets controllable by directorates
GROSS EXPENDITURE
Recharges to other directorates
TOTAL EXPENDITURE
NET EXPENDITURE
4.21

Gross Grant Other Recharges Net
Reference Service Area Expenditure Income Income Expenditure
2015/16
£000 £000 £000 £000 £000
SCS1 ADULT SOCIAL CAREDeputy Director: Seona Douglas
SCS1-1 OLDER PEOPLE
SCS1-1E, SCS1-1A Pooled Budget Contributions 71,255 0 0 0 71,255
SCS1-1BCD Income 57 0 0 0 57
SCS1-1 SUBTOTAL OLDER PEOPLE 71,312 0 0 0 71,312
SCS1-2 LEARNING DISABILITIES
SCS1-2ABDE Learning Disabilities Non Pool Services
Services to provide support for people with learning
disabilities, aged 18 and over, and their carers to live healthy,
safe and valued lives.
SCS1-2A Provider Services 4,558 0 -54 -4,571 -67
SCS1-2B Social Work 2,064 0 -255 -1,834 -25
SCS1-2D Income 0 0 -5,172 0 -5,172
SCS1-2E Learning Disabilities Commissioning 175 0 0 0 175
SCS1-2ABDE Sub Total Learning Disabilities Non Pool Services 6,797 0 -5,481 -6,405 -5,089
SCS1-2C Pooled Budget Contribution 73,953 0 0 0 73,953
The Council's contribution to a budget pool with Health, which
provides integrated services to clients with a learning
disability. See page 4.28 for details of how this contribution is
used.
SCS1-2 SUBTOTAL LEARNING DISABILITIES 80,750 0 -5,481 -6,405 68,864
Social & Community Services - Revenue Budget 2015/16
4.22

Gross Grant Other Recharges Net
Reference Service Area Expenditure Income Income Expenditure
2015/16
£000 £000 £000 £000 £000
Social & Community Services - Revenue Budget 2015/16
SCS1-3 MENTAL HEALTH
SCS1-3A Non-Pool Services 850 0 0 0 850Provision of services to meet the social and community
service needs to Adult Mental Health clients.
SCS1-3B Pooled Budget Contributions 8,112 0 -53 0 8,059The Council's element of a budget pool with Health, which
provides integrated services to Adult Mental Health clients.
SCS1-3 SUBTOTAL MENTAL HEALTH 8,962 0 -53 0 8,909
SCS1-4 SERVICES FOR ALL CLIENT GROUPS
Provision of specialist care management services for clients
outside the pooled budgets.
SCS1-4A Asylum Seekers 52 0 0 0 52
SCS1-4B HIV/AIDS 34 0 0 0 34
SCS1-4C Drugs and Alcohol 427 0 0 0 427
SCS1-4D Adults At Risk 10 0 0 0 10
SCS1-4E Employment Services 1,296 0 -795 0 501
SCS1-4F Shared Lives 1,905 0 -135 -1,778 -8
SCS1-4G Adults information System 70 0 0 0 70
SCS1-4H Internal Services 39 0 0 0 39
SCS1-4I Housing Related Support 2,893 0 0 0 2,893
SCS1-4J Adult Social care Improvement Board 362 0 0 0 362
SCS1-4K Emergency Duty 1,065 0 0 -264 801
SCS1-4L Adult Protection and Mental Capacity 666 0 -30 0 636
SCS1-4M Money Management 391 0 -366 -40 -15
SCS1-4 SUBTOTAL SERVICES FOR ALL CLIENT GROUPS 9,210 0 -1,326 -2,082 5,802
SCS1-5 PHYSICAL DISABILITIES
SCS1-5A Pooled Budget Contributions 12,027 0 0 0 12,027
The Council's contribution to the pooled budget with the
National Health Service. This purchases a range of services
to meet the health and social care needs of people with
physical disabilities and their carers.
SCS1-5B Income 0 0 -657 0 -657
SCS1-5 SUBTOTAL PHYSICAL DISABILITIES 12,027 0 -657 0 11,370
SCS1-6 Adult Social Care Recharges 145 0 0 0 145
SCS1-6 SUBTOTAL Adult Social Care Recharges 145 0 0 0 145
SCS1 TOTAL ADULT SOCIAL CARE 182,406 0 -7,517 -8,487 166,402
4.23

Gross Grant Other Recharges Net
Reference Service Area Expenditure Income Income Expenditure
2015/16
£000 £000 £000 £000 £000
Social & Community Services - Revenue Budget 2015/16
SCS2 JOINT COMMISSIONING
Deputy Director : Kate Terroni
Leads the development of commissioning strategies to meet
the needs of people and families who need social care
support. This is undertaken through needs analysis through to
service specification, tendering, procurement, contract
management and evaluation of outcomes. The service works
in partnership with other agencies, operational teams, elected
members and service users and carers.
The service has the following functions: service user/carer
involvement, strategic planning, complaints management,
governance activities, performance management, data
gathering and analysis, policy development and partnership
working including support to the Health & Wellbeing
Partnership
SCS2-1 to SCS2-5 Joint Commissioning 6,719 0 -326 -2,401 3,992
SCS2-6 Oxfordshire Support Fund 444 0 0 0 444
SCS2 TOTAL JOINT COMMISSIONING 7,163 0 -326 -2,401 4,436
4.24

Gross Grant Other Recharges Net
Reference Service Area Expenditure Income Income Expenditure
2015/16
£000 £000 £000 £000 £000
Social & Community Services - Revenue Budget 2015/16
SCS3 COMMUNITY SAFETY
Chief Fire Officer & Deputy Director : David Etheridge
SCS3-1 Gypsy & Traveller Services 950 0 -1,051 0 -101
Provision of landlord services for some 80 families resident
on the County Council’s six permanent sites as well as
safeguarding the county’s settled communities from the
problems associated with unauthorised encampments. The
service also manages five sites in Buckinghamshire and one
in the London Borough of Brent on behalf of the respective
councils.
SCS3-2 Trading Standards 2,243 0 -640 0 1,603
The Trading Standards Service enforces approximately 80
Acts of Parliament and several hundred sets of subordinate
legislation on behalf of the Council. The wide remit of the
Service ranges from food safety to fair trading and fraud,
illegal money lending to counterfeiting, farm animal health
and welfare controls to under-age sales, product safety to
overweight heavy goods vehicles, doorstep crime to the
storage of hazardous substances.
SCS3 TOTAL COMMUNITY SAFETY 3,193 0 -1,691 0 1,502
SCS4 FIRE AND RESCUE & EMERGENCY PLANNING
Chief Fire Officer: David Etheridge
SCS4-1 Fire & Rescue Service 22,832 0 -521 -4 22,307
Focuses predominantly on ‘Prevention and Protection’
activities to minimise the need for ‘Response' to emergencies.
Delivers operational excellence, measured by the speed and
weight of response to incidents. The service aims to
maximise productive use of the capital assets, people and
‘brand’ delivering directly or co-ordinating third party actions
designed to improve community safety
SCS4-2 Emergency Planning 272 0 0 0 272
Prepares and maintains core emergency plans and
professional advice on emergency planning. Identifies and co-
ordinates District and City Council contributions to joint
emergency Plans. Delivers emergency management training;
manages the Council's 24/7 duty officer system and the
Council's response to major incidents. Meets the duties of
the Civil Contingencies Act 2004.
SCS4 TOTAL FIRE AND RESCUE & EMERGENCY PLANNING 23,104 0 -521 -4 22,579
DIRECTORATE TOTAL 215,866 0 -10,055 -10,892 194,919
Non Negotiable Support Service Recharges 13,829 0 0 0 13,829
Less Recharges within the Directorate -8,979 0 0 8,979 0
TOTAL 220,716 0 -10,055 -1,913 208,748
4.25

Reference Detail 2015/16 2016/17 2017/18 Total
ID £000 £000 £000 £000
Older People
SCS1-1A 14SCS2 P Care Homes - on-going effect of additional placements made in
2012 falls out in 2015/16.
-2,200 -2,200
SCS1-1A 14SCS7 S Greater use of assistive technology to enable more people to
remain in their homes for longer and reduce the need for home
support
-250 -250 -500
SCS1-1A 14SCS5 S Adjustment to Older People's Pool meeting own pressures. 2,200 2,200
SCS1-1A 14SCS21 S Review of Older People's day services -300 -300
SCS1-1C 15SCS1 S Resources from the Better Care Fund to protect adult social care
services
-8,000 -8,000
SCS1-1A 15SCS2 S Working closely with providers to generate efficiencies in
contracted services
-400 -400 -400 -1,200
SCS1-1A 15SCS3 S Supporting our staff to work more efficiently, reducing bureaucracy
and streamlining process – establishing efficiency savings in
preparation for increased demand generated by funding reform,
which we expect will be funded by central government
-1,500 -1,500
SCS1-1A 15SCS4 S Seeking alternatives to the current brokerage service -600 -600
SCS1-1A 15SCS5 S Stop subsidising shopping and meals service. Continue to provide
a subsidised laundry service for people who suffer from
incontinence.
-140 -140
SCS1-1A 15SCS6
16SCS17
S
NS
Continuing to fund information and advice for people who may
need or are eligible for social services, but reducing support for
mainstream welfare rights advice and advocacy. A review of
information and advice services will be undertaken.
-60 -40 -100
SCS1-1A 15SCS7
16SCS7
S
NS
Part of the £2.8m unidentified saving in the MTFP in 2017/18 has
been made earlier than expected as set out in 16SCS4-6 detailed
below. Work is continuing to identify the remainder of this saving.
-2,050 -2,050
Adult Social Care - Budget Changes
Budget
Book
Reference
Type of
Budget
Change
4.26

Reference Detail 2015/16 2016/17 2017/18 Total
ID £000 £000 £000 £000
Adult Social Care - Budget Changes
Budget
Book
Reference
Type of
Budget
Change
SCS1-1A 16SCS4 NS 15 minute visits - number of people receiving 15 minutes visit is
fewer than originally thought.
-300 -300
SCS1-1A 16SCS5 NS Home support - savings from new block contracts which will also
deliver earlier start times
-250 -250
SCS1-1A 16SCS6 NS Inflation applied in 2014/15 is not required in the base budget -200 -200
SCS1-1A 15SCS8
14SCS8
16SCS18
14SCS6
16SCS19
P
S
NS
S
NS
£10.000m investment in 2014/15 to help meet increased demand
for social care reduces from 2015/16 (also see additional
demography under 'All Client Groups')
-3,900 -1,600 -1,600 -7,100
SCS1-1A 15SCS44 P Create a more personalised approach to home support which will
include removing short visits for personal care for older people
400 400
Subtotal Older People -14,000 -3,790 -4,050 -21,840
Learning Disabilities
SCS1-2C 14SCS16 S More efficient delivery of care leading to reduced cost of Learning
Disabilities Resource Allocation System.
-1,000 -1,000 -2,000
SCS1-2C 15SCS9 S Close working with learning disability service users to find new
ways of working whilst ensuring assessed needs continue to be
met.
-500 -400 -1,800 -2,700
SCS1-2C 16SCS1 NP Learning Disabilities - £4.6m pressure due to increasing demand
and £1.5m of previously agreed savings that still need to be
delivered.
5,368 -135 850 6,083
SCS1-2C 16SCS2 NS Learning Disabilities - manage pressures by 2017/18 within the
resources available in the medium term plan.
-100 -2,500 -3,500 -6,100
Subtotal Learning Disabilities 3,768 -4,035 -4,450 -4,717
4.27
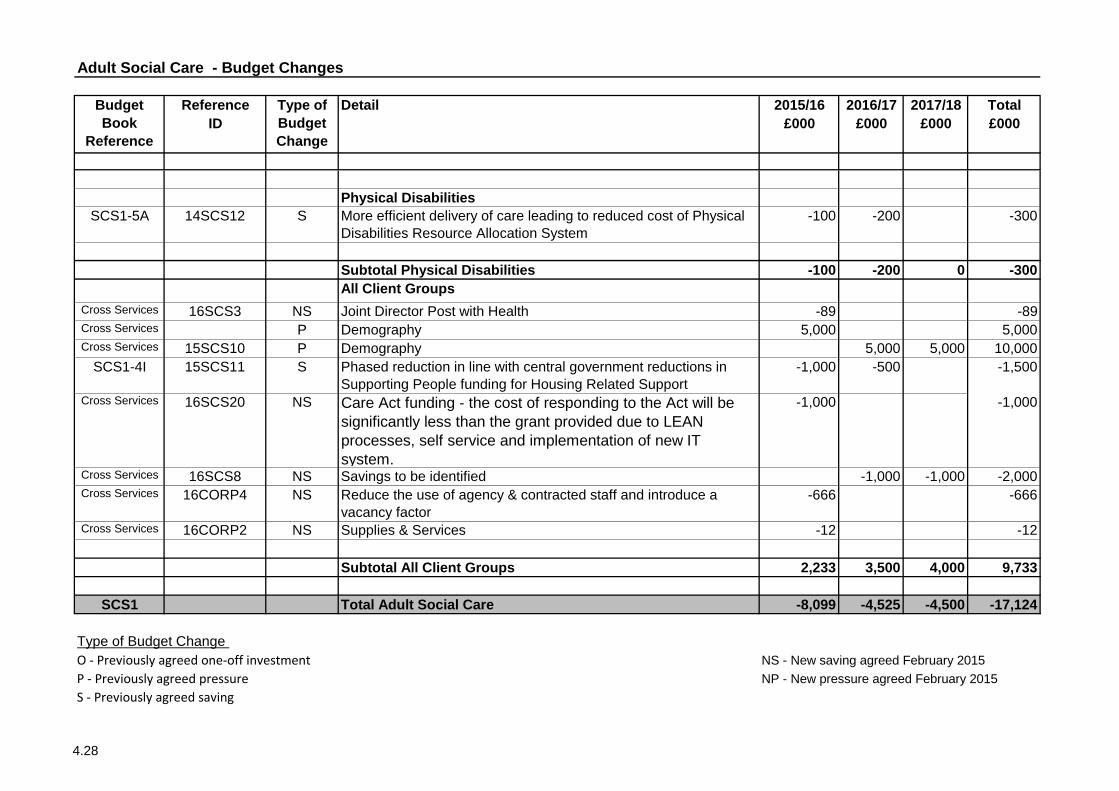
Reference Detail 2015/16 2016/17 2017/18 Total
ID £000 £000 £000 £000
Adult Social Care - Budget Changes
Budget
Book
Reference
Type of
Budget
Change
Physical Disabilities
SCS1-5A 14SCS12 S More efficient delivery of care leading to reduced cost of Physical
Disabilities Resource Allocation System
-100 -200 -300
Subtotal Physical Disabilities -100 -200 0 -300
All Client Groups
Cross Services 16SCS3 NS Joint Director Post with Health -89 -89Cross Services P Demography 5,000 5,000Cross Services 15SCS10 P Demography 5,000 5,000 10,000
SCS1-4I 15SCS11 S Phased reduction in line with central government reductions in
Supporting People funding for Housing Related Support
-1,000 -500 -1,500
Cross Services 16SCS20 NS Care Act funding - the cost of responding to the Act will be
significantly less than the grant provided due to LEAN
processes, self service and implementation of new IT
system.
-1,000 -1,000
Cross Services 16SCS8 NS Savings to be identified -1,000 -1,000 -2,000Cross Services 16CORP4 NS Reduce the use of agency & contracted staff and introduce a
vacancy factor
-666 -666
Cross Services 16CORP2 NS Supplies & Services -12 -12
Subtotal All Client Groups 2,233 3,500 4,000 9,733
SCS1 Total Adult Social Care -8,099 -4,525 -4,500 -17,124
Type of Budget Change
O - Previously agreed one-off investment NS - New saving agreed February 2015
P - Previously agreed pressure NP - New pressure agreed February 2015
S - Previously agreed saving
4.28

Reference Detail 2015/16 2016/17 2017/18 Total
ID £000 £000 £000 £000
Community Safety
SCS2-1 15SCS16 S Cessation of dedicated Community Safety coordination work through
the Safer Communities Unit
-194 -194
SCS2-3 15SCS17 S Increased income from business support services and new specialist
training service (Trading Standards)
-20 -20
SCS2-3 15SCS18 S Reduction in livestock welfare enforcement work and refocus of
remaining animal health activity on animal health and disease control
(Trading Standards)
-30 -30
SCS2-1 16SCS14 NP Domestic Abuse Co-ordinator post funding 45 45
SCS2-3 16SCS15 NS Remove one enforcement officer post (currently vacant) -28 -28
SCS2-3 16SCS16 NS Request TVP to pay for the Police Officer secondment to Trading
Standards
-45 -45
SCS2-3 16SCS17 NS Review of out of hours activity/testing -20 -20
SCS2 16CORP4 NS Reduce the use of agency & contracted staff and introduce a vacancy
factor
-51 -51
SCS2 16CORP2 NS Supplies & Services -3 -3
SCS2 Total Community Safety -346 0 0 -346
Fire & Rescue and Community Safety - Budget Changes
Budget
Book Line
Reference
Type of
Budget
Change
4.29

Reference Detail 2015/16 2016/17 2017/18 Total
ID £000 £000 £000 £000
Fire & Rescue and Community Safety - Budget Changes
Budget
Book Line
Reference
Type of
Budget
Change
Fire and Rescue & Emergency Planning
Fire and Rescue Service
SCS4-1 15SCS19 P Change of staffing to support county-wide Emergency Cover -
Bicester Fire Station - potential staffing model change from fully on-
call (2 appliances) to 1 appliance on-call and 1 appliance day crewed.
(This will require an additional 10 firefighters plus 4 supervisory
managers)
700 700
SCS4-1 15SCS22 P Development of established staffing model to support emergency
cover - Increase in on-call firefighters in the West Oxford District
Council & Carterton area
50 50
SCS4-1 15SCS23 P New Provision of Staff to meet changing emergency cover needs -
Additional on-call crewing to strengthen second appliance response in
Wantage / Science Vale area
50 50
SCS4-1 16SCS9 NP Increased cost of ill health retirement 100 100
SCS4-1 15SCS26 S Emergency Planning - Restructure and alignment with Oxfordshire
Fire & Rescue in relation to business continuity management.
-20 -20
SCS4-1 15SCS27 S Agile Working - Full review of administration and support function
following the introduction of agile working arrangements
-60 -60
SCS4-1 15SCS28 S Development of Commercial Training Unit (Income Generation) -25 -25 -25 -75
SCS4-1 15SCS29 S Collaboration Efficiencies - Revenue reductions associated with
implementation of Thames Valley Fire Control Service (TVFCS)
-75 -25 -25 -125
4.30

Reference Detail 2015/16 2016/17 2017/18 Total
ID £000 £000 £000 £000
Fire & Rescue and Community Safety - Budget Changes
Budget
Book Line
Reference
Type of
Budget
Change
SCS4-1 15SCS30 S Collaboration Efficiencies - reconfiguration of Oxfordshire Fire &
Rescue's Technical Communications Team following the
implementation of Thames Valley Fire Control Service
-25 -25
SCS4-1 15SCS31 S Collaboration Efficiencies - Benefits realisation of collaborative
approach to training delivery, leading to the reduction in staffing costs.
-50 -50
SCS4-1 15SCS32 S Collaboration Efficiencies - Benefits realisation of collaborative
approach to training support, leading to reconfiguration of training
administration resources
-50 -50
SCS4-1 15SCS33 S Senior Management Restructure and Collaboration - amend
operational rota
-30 -30
SCS4-1 15SCS34 S Charging and Fees Efficiencies - Review of current charges including
revisiting Fire and Rescue Services Act 2004 Section 13/16
arrangements
-25 -25
SCS4-1 15SCS35 S Middle Management Review - Road Safety function -40 -40
SCS4-1 15SCS36 S Large/Major Incident Command Review - review OFRS resources in
conjunction with the other Thames Valley fire & rescue services.
-30 -30
SCS4-1 15SCS39 S Change of Staffing to Support County-wide Emergency Cover -
Reduction in staffing for one on-call appliance at Bicester - covered by
day crewed personnel (see 15SCS19)
-50 -50
4.31

Reference Detail 2015/16 2016/17 2017/18 Total
ID £000 £000 £000 £000
Fire & Rescue and Community Safety - Budget Changes
Budget
Book Line
Reference
Type of
Budget
Change
SCS4-1 15SCS42 S Change of Staffing to Support County-wide Emergency Cover -
Banbury Fire Station - staffing model change from 1 appliance full
time 24/7 and one on-call appliance to 1 appliance day crewed and
one on-call (release 10 Firefighters plus 4 Supervisory Managers)
-360 -360
SCS4-1 15SCS43 S Reduction in Full-time Firefighter Support - for new Carterton
emergency cover arrangements (see 15SCS21)
-216 -216
SCS4-1 14SCS31 NS Fire Pension Scheme - changes implemented from April 2016,
therefore budget not needed in 2015/16 (one-off)
-200 200 0
SCS4-1 16SCS10 NS Review Commercial Trading and increase income -25 -25
SCS4-1 16SCS11 NS Increase savings from Thames Valley Fire Control -75 -75
SCS4-1 16SCS12 NS Reduction in the Operational on-call budget -50 -50
SCS4-1 16SCS13 NS LEAN review of processes across F&RS & Trading Standards -75 -75
SCS4-1 15SCS19 NS Delay implementing operational changes to Bicester by two years to
18/19, currently scheduled for 16/17.
-650 -650
SCS4-1 16CORP2 NS Supplies & Services -25 -25
4.32

Reference Detail 2015/16 2016/17 2017/18 Total
ID £000 £000 £000 £000
Fire & Rescue and Community Safety - Budget Changes
Budget
Book Line
Reference
Type of
Budget
Change
Emergency Planning
SCS4-2 16CORP4 NS Reduce the use of agency & contracted staff and introduce a vacancy
factor
-6 -6
Total Fire and Rescue & Emergency Planning -371 -385 -406 -1,162
SCS4 Total Fire & Rescue and Community Safety -717 -385 -406 -1,508
Type of Budget Change
O - Previously agreed one-off investment
P - Previously agreed pressure
S - Previously agreed saving
NS - New saving agreed February 2015
NP - New pressure agreed February 2015
4.33

Environment and
Economy
5.1


Environment and Economy
Business Strategy 2015/16 to 2017/18
Directorate Overview
Environment and Economy is a diverse directorate, delivering and commissioning a
range of highly visible services and functions, and supporting the Council's role in
leading through partnership on the delivery of critical infrastructure and future economic
growth. The Directorate delivers the Council's duty to maintain a safe highways network,
probably the Council's most visible universal function. In addition to supporting
Oxfordshire's role as the Minerals and Waste planning authority, Environment and
Economy plays a vital part in supporting Districts in their local planning function, as
Oxfordshire prepares for growth in the economy and housing, and for the infrastructure
to support that growth.
The Environment and Economy Directorate also plays a role in delivering efficiency
across the Council by integrating back office functions and services. In particular
Oxfordshire Customer Services operates as a unit of the directorate, ensuring
integration of back office and customer-facing functions. We also take the lead on
implementing the 'corporate landlord' approach to property management and efficiency,
working with our external partners, Carillion Capita Symonds.
5.2

Delivering the Council’s corporate priorities
The County cannot drive economic and social development alone, instead we must
provide leadership and enable partnership working to ensure we create the conditions
for economic growth. Strong and effective partnership working across the public,
business and academic sectors has enabled a shared vision to be arrived at – one that
is focused on realising our potential for economic growth through innovation.
Delivery of Oxfordshire’s shared ambition is dependent upon the County Council
continuing to inform and shape the statutory development plans of the District/City
Councils. It is also dependent upon the County Council continuing to take an active role
in working closely with the business and academic sectors.
The Customer Services Centre provides the front door to the Council’s services,
enabling customers to get what they need from the Council as quickly and efficiently as
possible, ensuring we deliver efficient public services. The Customer Service Centre
also performs a key role in supporting front line services to improve the performance
and deliver savings by working with them to improve their process and simplify the
customer’s interaction with the council
The Environment and Economy Directorate delivers services which address every
aspect of the Council’s Corporate Strategy; the key theme of which is to deliver a
Thriving Oxfordshire.
Oxfordshire has the greatest potential of any location in the UK to deliver world leading
technology and business innovation which builds upon our academic and research
excellence, led by our internationally renowned Universities, Oxford and Brookes. The
directorate has the lead role in helping deliver the shared ambition of a thriving
economy as an infrastructure provider and service deliverer. Our City Deal aims to
deliver transformational growth through support to developing employing, exporting,
profitable businesses from this research and innovation. Helping those businesses
thrive, and ensuring Oxfordshire is an attractive location for investment.
Oxfordshire as an economic region has underperformed and the County Council has a
key role to play in creating the conditions that give investor confidence in Oxfordshire as
the location of choice for the world’s leading science and technology businesses. Our
road network and public transport system are insufficient for the County’s needs.
Demand for housing and commercial premises has outstripped supply in recent years,
leading to a shortage of available property, and pricing many employees and
businesses out of the market.
As a rural County any economic growth needs to be carefully balanced against the need
to preserve our countryside and enhance the environment. The directorate leads on the
management of our countryside and through our property service ensures that the
county council’s presence in both rural and urban Oxfordshire is sympathetic both to the
environment and the needs of that community.
5.3

It is essential that our plans and investment proposals take into account the need for
rural communities to continue to have access to our services in order to prevent rural
isolation and to support our healthy and thriving communities, helping people to help
themselves, as well as directly supporting the most vulnerable service users. Transport
is a key factor in this regard, as well as in ensuring that we support vulnerable people
of any age enabling them to access the support and services they need wherever they
live.
5.4

Services and Priorities
Economy and Skills
The County Council has an important role to play in supporting economic growth and
ensuring that the skills offer available is closely aligned with the needs and expectations
of employers.
External Partnerships
The development of the shared vision for Oxfordshire – Economic Growth through
Innovation – has been achieved through partnership working across the public,
business and academic sectors.
The County Council has been a proactive partner in discussions that took place in
support of the proposed City-Deal: it will continue to be a proactive partner in the work
to develop the Strategic Economic Plan. The latter forms the basis for future
Oxfordshire bids to the Local Growth Fund, which from 2015 will be the primary source
of Government funding for capital investment in major structural maintenance and new
highway schemes.
As part of our commitment to partnership working we will continue to:
Be a member of the Oxfordshire Growth Board – and in particular contribute to its
consideration of future levels and distribution of housing, jobs and infrastructure
Be a member of the Local Enterprise Partnership – and act as the accountable body
for the Partnership
Support the work to deliver the City-Deal – in particular overseeing delivery of the
priority transport schemes
Support the work to develop the European Investment Strategy as the framework for
the allocation of European funds managed by the Local Enterprise Partnership
Contribute to the development of the Strategic Economic Plan – in particular
ensuring that it provides the basis for robust bids to the Local Growth Fund
Be a member of the Oxfordshire Skills Board – in particular working to deliver the
skills initiatives associated with the City-Deal and Strategic Economic Plan
As part of our on-going commitment to support economic growth we will:
Continue to run the Work Experience Service through which young people are place
with employers
Actively promote apprenticeships to employers – building on the work to date which
has seen Oxfordshire consistently exceed national performance with
apprenticeshipsSupport the ‘Invest in Oxfordshire’ inward investment service as it transitions into a
self-funding service
5.5

Local Plans and Neighbourhood Plans
The Local Plan – prepared by each of the District/City Councils – provides the statutory
basis on which growth in each area is planned. It is essential that the implications of
planned growth on County Council provided infrastructure and services is properly taken
into consideration by the relevant district/city council.
Neighbourhood Plans are a recent introduction and form part of the statutory
development plan (along with the Local Plan). Local communities are incentivised to
produce a Neighbourhood Plan by the fact that where one exists they will receive 25%
of any money collected through the Community Infrastructure Levy.
Spatial Growth and Infrastructure Strategy
The county council no longer prepares structure plans to set out the spatial
development strategy for Oxfordshire, but there is an urgent need to plan for future
growth which most efficiently and effectively delivers much needed infrastructure
including schools, transport and other community facilities. The council will:
Work together with City and District Councils to develop a combined approach for
strategic planning to meet the unmet needs of housing across the City;
Develop a county-wide infrastructure plan and test options for future growth to
determine the most sustainable way of delivering growth and the infrastructure we
need; and,
As part of a robust review of growth options, undertake a review of Oxfordshire’s
Green Belt.
In protecting the interests of the County Council we will:
In order to mitigate the impact of new development the County Council will:
Co-ordinate input from across the County Council into the Local Plan making
process – including inputting into the drafting of Local Plans, responding to
consultations and attending Public Examinations
Engage in the preparation of detailed policy documents that supplement Local Plans
– e.g. Supplementary Planning Documents, Area Action Plans
Respond to consultation on planning policy documents issued by adjoining local
authorities where these have an impact on Oxfordshire
Provide base information to communities that are preparing Neighbourhood Plans
and undertake (on a cost recovery basis) more detailed work to support
Neighbourhood Plans
Continue to negotiate and secure legal agreements on behalf of the County Council
that provide the funding required to invest in new infrastructure and/or services
Ensure that any proposal by a district council to introduce the Community
Infrastructure Levy takes into the County Council’s infrastructure and service
requirements
Maintain a programme of works that ensures the developer contributions secured
are spent in a timely manner to the benefit of the community
5.6

Other Statutory Planning Functions
The County Council is responsible for preparing and keeping up-to-date the Local
Transport Plan – a statutory document that sets out the long-term transport strategy for
Oxfordshire.
Resources have been allocated to review and update the Local Transport Plan in order
to consider the implications of changes in the delivery of services, as well as the
implications of external factors – e.g. an aging population, new housing requirements.
Minerals and Waste
In its role as Minerals and Waste Planning Authority, the Council will:
The initial focus of work has been on updating the ‘area strategies’ for key locations
across Oxfordshire so as to provide a basis for securing financial contributions from
developers. Resources have been allocated to undertake the formal review of the Plan,
with a timescale of completion within 18 months.
As the Highways Authority the County Council is a statutory consultee for highway
matters on all planning applications. Recent months have witnessed a marked increase
in the number of applications received as the economy picks up and as developers
exploit the lack of up to date Local Plans.
In its role as Highway Authority the Council will:
Set itself the target of responding to consultations on planning applications within 21
days.
Review its processes and procedures, subject to resources, with a view to
introducing ‘standing advice’ that can be used by the District/City Councils when
dealing with smaller planning applications.
Continue to recover from developers the cost of the work required to adopt roads
built as part of new developments.
Further develop and maintain a strategic transport model.
Prepare, monitor and review the Minerals and Waste Local Plan.
Continue the preparation of the Minerals and Waste Local Plan. Following the need
to review that work in light of changes introduced through National Planning Policy
Framework, the County Council will aim to submit the revised Local Plan to
Government for inspection by Spring 2015.Consider and determine all minerals and waste planning applications.
Highways
The County Council has a duty to maintain a safe highway network under the Highways
Act 1980. The highways maintenance service is continuously under scrutiny because it
affects everybody, every day and is high on the issues that the public are most
concerned about.
5.7

2,900 bridges and structures
Network management through the traffic control centre
Real time information
Streetworks
Parking
Civil Parking Enforcement in Oxford City and West Oxfordshire.
As a Council we are committed to prioritising highways maintenance so we can continue
to maintain the road network and avoid reactive maintenance costs.
Working with our partner Skanska we are moving to a more asset led approach which
ensures that money is used in the most efficient way rather than ‘worst first’ thus
delivering better value for money and a more stable asset.
We also recognise that this is an area of our business that the public care about, for it
has an immediate impact on their day to day lives, and we are improving public
information and access to information (e.g. FixMyStreet defect reporting on the web
site, improved information to members at locality meetings)
The service enables the council to fulfil its obligations under the Traffic Management Act
2004 and manages the flow of traffic through the transport network and includes:
The County Council maintains the highway network using an integrated Highways
Services Contract (currently with Skanska). This contract has been in place for
approximately 44 years.
Highways maintenance is split into three main areas as follows:
Planned – Capital funded work on carriageways including surface dressing,
bridgeworks and drainage schemes.
Cyclic – e.g. gully emptying, grass cutting, signs and lines, weed control and safety
fence tensioning.
Reactive - defect repairs (potholes and small patching works), flooding responses,
winter maintenance.
The County has:
4,576 km of Roads
3,170 km of footways
59,600 Street Lights
105,225 Drainage Gullies
Network Management
The County Council delivers these services through a variety of contracts and in-house
provision and uses a range of methods to control traffic movement and to keep the
public informed of issues on the highway network, including having BBC Radio
Oxfordshire embedded in our control room at peak times.
5.8

Create a better integrated, rationalised transport network
Safeguard the Council’s most vulnerable transport users
Ensure Oxfordshire’s residents (in particular young people) are enabled to access
employment through transport
Ensure available resources are targeted at those users with the greatest need
At the heart of the programme’s approach has been the principle of encouraging the
voluntary and community sector to mitigate the impact of service reductions. The
increased savings targets imposed this year will challenge the Councils ability to deliver
this programme in the most effective way possible.
The service is funded through a combination of revenue and income with the
Streetworks and Parking services wholly funded through income. It is important to note
that the Council is only allowed to charge enough to cover its costs and uses the
parking account to enable it to manage the peaks and troughs of income over years
without impacting on council revenue budgets.
This service has a key role to play as the growth agenda develops and the council and
others increase the amount of work they are undertaking to improve the transport
network.
Supported Transport
The Council currently spends circa £30m a year on a range of different transport
services. This includes funding home to school transport for eligible school children,
providing transport to and from day centres for adult social care clients, subsidised bus
routes, support to community transport services, and subsidising concessionary bus
passes for the elderly and disabled, along with various other forms of direct or indirect
provision.
The Council has effectively pooled these budgets to enable a comprehensive review of
the transport services it supports to be undertaken and pilot opportunities for change.
Through this, we aspire to:
Reduce OCC’s overall expenditure on transport
5.9

The main property types are:
The County Council also provides support to the corporate estate including premises
management, health and safety and repairs and maintenance. Working with our
partner, Carillion Capita Symonds, the Council manages the balance between planned
and reactive maintenance of our property estate to ensure that the asset is managed
efficiently and is fit for purpose.
Waste Management
The team provides services that help manage approximately 300,000 tonnes of
municipal waste every year, and fulfills the County Councils statutory responsibilities as
the Waste Disposal Authority through the delivery of:
Special schools Staff houses
Offices Children’s centres
Fire stations Early intervention hubs
Property
Our buildings are the public face of the County Council but we need to consider how
best to utilise them to enable our customers to access services in the manner which
best meets their needs.
The County Council’s property portfolio comprises approximately 830 operational
properties with an asset value of approximately £800m.
Secondary schools Day centres
Primary schools Highway depots
Libraries Waste recycling centres
Museums Homes for older people
As part of our commitment to protecting front line services we are committed to
supporting the Council and partners in transforming the ways we work, maximising
efficiency from technology, property, and our people:
Proactively identifying opportunities to further reduce our asset base triggered by
changes in the way we deliver our services and by using lease breaks to reduce the
number of offices from which the County Council operates.
Actively working with other local authorities and public sector agencies to identify
and realise opportunities to co-locate services and staff which will not only reduce
our property costs, but also deliver improved and more efficient services to the
Providing staff with the support and equipment that enables them to work in the
most cost effective and efficient way in order to maximise the time that they can
spend with our customers
Proactively secure the disposal of surplus property at the earliest opportunity
possible
7 Household Waste Recycling Centres
2 Anaerobic Digestion facilities that treat the county’s separately collected food
waste
An In Vessel Composting facility that treats mixed food and green waste
5.10

We will provide our services on line whilst accepting that for some customers,
telephone, e-mail and surface mail will remain the preferred route for some. (“Digital
by default”)
Service improvement should be a continuous exercise and an embedded approach
embracing all staff from top to bottom.
Customers should have a single point of access to the Council and we should
minimise the number of additional contacts they experience to get the job done.
We will work towards a “single view” of the customer so that our advisers have a
complete understanding of the customer’s engagement with the Council whenever
they talk to them.
Oxfordshire Customer Services Externalisation
The Transforming OCS Programme has delivered a number of process improvements
and self-service practices for the Council which has contributed to the current OCS
MTFP. It is acknowledged internally and externally that OCS cannot deliver further
significant savings without externalisation or significant investment in automation.
ICT Business Delivery has already been substantially restructured and most
infrastructure services are now commissioned including the Council’s data centre
requirements that are now hosted in Birmingham. Work will continue over the next 12
months to move further towards “cloud” based computer services.
The Energy from Waste facility at Ardley was commissioned in 2014 and deals with the
overwhelming majority of municipal residual waste, reducing the amount that needs to
be sent to landfill. The construction of 2 new waste transfer stations is enabling residual
waste to be transported to the Ardley facility. The energy created as a by-product of the
Energy from Waste facility provides the County Council with a revenue stream that
supports its activities as Waste Disposal Authority. A Household Waste and Recycling
Strategy will be developed in 2015.
Customer Service Centre
The Customer Services Centre provides the front door to most of the Council’s services
including social care, supporting residents as customers to get what they need from the
Council as quickly and efficiently as possible. The Customer Service Centre also
performs a key role in supporting front line services to improve the performance and
deliver savings by working with them to improve their process and simplify the
customer’s interaction with the council.
The Customer Service Centre is committed to delivering a better customer experience
for Oxfordshire residents, and future savings based on the following principles:
3 composting facilities for the treatment of the county’s green waste
The safe disposal of over 100,000 tonnes of municipal waste every year
Ongoing management of 10 closed landfill sites so they do not pollute the
environment.
5.11

Human Resources and Finance services will be delivered from an integrated
business centre located in Winchester
Schools will continue to contract with the Council for Human Resources and Finance
services that will be delivered by Hampshire
Academies will be able to contract directly with Hampshire for Human Resources
and Finance services
Some services that cannot be delivered by the integrated business centre will
remain with Oxfordshire and their future will be determined in conjunction with other
Council programmes e.g. adult social care improvement
The Cabinet has agreed (July 2014) that the Council will join an existing partnership
established by Hampshire County Council for the delivery of operational HR and
financial services which will take effect from 1st
July 2015. As a result of the Partnership
agreement:
Entering the Hampshire Partnership will deliver a further extension to self-service for
Council staff and permanent cost reductions.
5.12

How our services are changing
We are rolling out a programme of ‘agile working’ in order to support the new ways of
working necessary to deliver these priorities. Agile working means: giving staff the right
equipment and working environment to suit their role and service; working in a more
flexible way that makes best use of staff time, buildings, and resources; and taking
advantage of changes in technology and working styles to become more efficient. This
will ultimately protect delivery of front line services as far as possible.
The business of the Environment and Economy Directorate is diverse and we have
taken a tailored approach to identifying savings in each of our services to ensure that
we minimise the impact on our customers.
There are some overarching principles that we have applied when approaching savings
across the directorate:
We must continue to meet our statutory duties and ensure we safeguard our most
vulnerable and isolated service users
Services should no longer be provided by the County Council unless there is clear
strategic value to retain the delivery of them in-house. However, we will ensure that
our customers, schools and academies continue to have access to the services they
need and where possible, these services should be based locally.
We will focus on opportunities for our activities to support economic growth in the
county, and maximise our contribution to the national economy. In particular, we will
develop strategic infrastructure plans to inform our delivery and bidding priorities,
and to encourage planned delivery as part of new development through the planning
system.
We will maximise efficiency for the council as a whole - seeking out opportunities to
reduce the asset base of the council and to co-locate with other partners where
possible. We will enable our staff to work more flexibly so as to reduce the office
based footprint of the council and to enable staff to best meet their clients’ needs.
We must maximise opportunities for income generation and drive best value out of
all our contracts.
We will work creatively with our public and voluntary sector partners to build capacity
within our communities to respond to changes in services.
We will provide a focus on customer services to enable our customers to get what
they need from the council using the fastest and most effective channel. Customers
should have a single point of access to the council and their needs met with as few
‘contacts’ as possible.
5.13

Grant Other Recharges Net
Ref. Service Area Income Income Expenditure
2015/16
£000 £000 £000 £000
EE1 -3,380 -1,627 -828 7,469
EE2 -1,037 -11,285 -25,899 80,271
EE3 -3,906 -3,028 -6,571 19,496
-8,323 -15,940 -33,298 107,236
(1) Non Negotiable Support Service Recharges 0 0 -37,745 -30,655
-8,323 -15,940 -71,043 76,581
0 0 13,788 0
-8,323 -15,940 -57,255 76,581
£000 % £000 %
37,945 24.0 -8,323 34.3
10,529 6.7 -5,336 22.0
18,018 11.4
30,133 19.0 -10,604 43.7
59,571 37.7
1,698 1.1 -24,263 100.0
Capital Financing Costs 205 0.1
76,581
158,099 100.0
-57,255
100,844 100.0
£000
Environment & Economy - Summary
Revenue Budget 2015/16
Gross
Expenditure
Less Recharges within the Directorate -13,788
Strategy and Infrastructure 13,304
Commercial Services 118,492
Oxfordshire Customer Services 33,001
Budget Controllable by Directorate 164,797
7,090
Total Non Negotiable Support Service Recharges 171,887
Total 158,099
Subjective Analysis 2015/16
EXPENDITURE 2015/16 Budget at
Outturn Prices
INCOME 2015/16 Budget at
Outturn Prices
Employees Government Grants
Premises Other Grants, Reimbursements &
ContributionsTransport
(1) The presentation of the directorate summary has been updated to reflect a technical change to non-negotiable support
service recharges to show more clearly the budgets controllable by directorates
GROSS EXPENDITURE
Recharges to other directorates
TOTAL EXPENDITURE
Supplies and Services Customer & Client Receipts
Agency & Contracted
Support Services TOTAL INCOME
NET EXPENDITURE
5.14

Gross Grant Other Recharges Net
Reference Service Area Expenditure Income Income Expenditure
2015/16
£000 £000 £000 £000 £000
EE1 STRATEGY & INFRASTRUCTURE
Leads in the planning and implementation of strategic
infrastructure that supports Oxfordshire’s ambitions for a
thriving economy, delivering services that make the maximum
contribution to achieving the Council’s corporate objectives.
The role of the division is to:
• Define the longer term strategic planning policy framework
for Oxfordshire and work with partners at the locality level to
turn that framework into a medium term programme of
projects that contribute towards delivering agreed outcomes
for that locality.
• Discharge the County Council’s statutory planning and
regulatory functions in support of delivering agreed outcomes
at the locality level.
• Facilitate and support sustainable economic growth, utilising
and unlocking the potential of the skills base within
Oxfordshire.
Strategy & Infrastructure 10,979 -1,590 -1,627 -828 6,934
EE1-5 Flood Defence Levy 535 0 0 0 535
EE1-6 Local Enterprise Partnership 1,790 -1,790 0 0 0
EE1 TOTAL STRATEGY & INFRASTRUCTURE 13,304 -3,380 -1,627 -828 7,469
EE2 COMMERCIAL SERVICES
EE2-1 Commercial Services Management -276 0 -95 0 -371Managers the Commercial Services function. This budget
includes the services budgeted drawdowns from earmarked
reserves.
EE2-1 Subtotal Commercial Management -276 0 -95 0 -371
EE2-2 Property & Procurement
EE2-21 Property & Procurement Management 833 0 0 0 833
EE2-22 Property & Facilities Management 26,931 0 -578 -8,439 17,914
The Property and Facilities contract commenced on 1 July
2012. This service delivers effectively planned, used and
managed property assets that are used in the most effective
way to deliver the council’s priorities and make the maximum
contribution to achieving the Council’s corporate objectives.
Working to create a core of well located, flexible properties,
focused on core public service delivery.
EE2-23 Property Programme Office 603 0 0 0 603Programme Management lead on developing and refining a
joint approach that seeks to develop longer term programmes
that enable flexibility but also allow better co-ordination of
maintenance and new works.
EE2-2 Subtotal Property & Procurement 28,367 0 -578 -8,439 19,350
Environment & Economy - Revenue Budget 2015/16
EE1-1 to
EE1-4
5.15

Gross Grant Other Recharges Net
Reference Service Area Expenditure Income Income Expenditure
2015/16
£000 £000 £000 £000 £000
Environment & Economy - Revenue Budget 2015/16
Network & Asset Management 12,845 0 -1,200 0 11,645
Network Management - Management of the highway network
to enable traffic to move about it as effectively as possibly
through signal management, traffic monitoring and effective
coordination of works and events.
Asset Management - Development and delivery of an
effective asset management plan to enable optimal use of
budgets in maintaining highway network and public rights of
way assets.
EE2-35 Countryside & Records 2,252 -242 -31 -12 1,967
Safeguard, maintain and enhance the quality of Oxfordshire's
countryside, support physical and mental health, the rural
economy and enjoyment and understanding of the
countryside through public access and information.
EE2-36 On/Off Street Parking and Park & Rides 4,850 0 -5,847 0 -997
Provision of park and ride car parks at Water Eaton and
Thornhill and the operation of civil enforcement of parking and
bus lanes.
EE2-3 Subtotal Network & Asset Management 19,947 -242 -7,078 -12 12,615
EE2-4 Delivery 10,618 0 -364 -778 9,476An integrated delivery team consisting of both OCC and
Skanska staff reporting to the Deputy Director. The team
provides the majority of the maintenance, construction and
design work related to the highways and rights of way service
and maintains the vehicles used by the Integrated Transport
Unit (ITU).
EE2-4 Subtotal Delivery 10,618 0 -364 -778 9,476
EE2-5 Highways, Transport & Waste
EE2-51A Waste Management 25,319 0 -1,133 0 24,186Organise the treatment or disposal of collected household
waste and provides Waste Recycling Centres throughout
Oxfordshire
EE2-51B Supported Transport (including Integrated Transport Unit) 31,704 -795 -2,037 -16,670 12,202
Provision of subsidised public transport, concessionary bus
passes and Home to School Transport and other transport for
eligible clients
EE2-52 H&T Contract & Performance Mgt 1,451 0 0 0 1,451The Highways Service Contract is delivered by Skanska. The
Highways & Transport Contract & Performance Management
Team oversee the implementation, delivery and performance
of this contract.
EE2-53 Area Stewards 1,362 0 0 0 1,362The Area Stewards are the local representatives for the
highway networks
EE2-5 Subtotal Highways, Transport & Waste 59,836 -795 -3,170 -16,670 39,201
EE2-6 Major Infrastructure Delivery 0 0 0 0 0
EE2-6 Subtotal Major Infrastructure Delivery 0 0 0 0 0
EE2 TOTAL COMMERCIAL SERVICES 118,492 -1,037 -11,285 -25,899 80,271
EE2-31 to
EE2-34
5.16

Gross Grant Other Recharges Net
Reference Service Area Expenditure Income Income Expenditure
2015/16
£000 £000 £000 £000 £000
Environment & Economy - Revenue Budget 2015/16
EE3 OXFORDSHIRE CUSTOMER SERVICES (OCS)
Oxfordshire Customer Services (OCS) was formed in late
2010, when the Customer Contact Centre, Information
Communication Technology (ICT), Procurement and Adult
Learning formally merged with Shared Services.
EE3-1 Management Team 450 0 -207 0 243Provides service management and associated support for
Oxfordshire Customer Services.
EE3-2 Education Support Services * 3,169 0 -397 -3,150 -378The Education Support Service was set up in 2012/13 and
provides a one stop shop for schools and academies to
purchase council delivered support services including Human
Resources, Finance, Management Information Systems and
Health & Safety.
EE3-3 ICT * 13,556 0 -802 -1,299 11,455ICT maintain the Council’s ICT infrastructure, and access to
systems and facilities required by internal customers to
deliver the Council’s services
EE3-4 Business Development 3,083 0 0 -348 2,735
EE3-5 Customer Service Centre 2,961 0 -279 -577 2,105The Customer Service Centre is the first point of customer
contact for a range of Oxfordshire County Council services
including social care, registration and highways. It delivers a
range of customer facing and supporting functions in a multi-
skilled environment.
EE3-6 Human Resources (Including Adult Learning) * 6,468 -3,906 -454 -934 1,174
The Human Resources team provides operational services
and support to the Council's workforce and Oxfordshire's
Schools. It also provides services to some external
organisations including Academies. The range of services
provided includes payroll, workforce information, recruitment,
health and safety, occupational health and staff care, advice
on complex employment issues and learning and
development opportunities for the council's workforce and the
people of Oxfordshire.
EE3-7 Operational Finance * 1,954 0 -11 -246 1,697
EE3-8 Pensions, Procure to Pay (P2P) * 1,360 0 -878 -17 465
EE3 TOTAL OXFORDSHIRE CUSTOMER SERVICES 33,001 -3,906 -3,028 -6,571 19,496
DIRECTORATE TOTAL 164,797 -8,323 -15,940 -33,298 107,236
Non Negotiable Support Service Recharges 7,090 0 0 -37,745 -30,655
Less Recharges within the Directorate -13,788 0 0 13,788 0
TOTAL 158,099 -8,323 -15,940 -57,255 76,581
* Many of the services provided by these teams will transfer to the Hampshire County Council from July 2015
5.17

Reference Detail 2015/16 2016/17 2017/18 Total
ID £000 £000 £000 £000
Strategy and Infrastructure
EE1-1 to
EE1-5
15EE1 S Carbon Reduction Tax - Council no longer part of government
scheme (below threshold)
-290 -290
EE1-1 to
EE1-5
15EE2 S Merger of Energy, Natural Environment and Waste Strategy
Teams
-120 -120
EE1-1 to
EE1-5
15EE5 S Unidentified Savings within Strategy - Delivery being planned -150 -150
EE1-1 to
EE1-5
15EE6 S Move to a self funding position for travel planning -75 -75
EE1-1 to
EE1-5
15EE8 S Reduce Travel Behaviour and Energy non-staffing budgets -240 -240
EE1-1 to
EE1-5
14EE16 O Economic Development & Growth - £0.100m additional funding to
gather business intelligence and help address barriers to growth
was provided in 2013/14. This falls out in 2016/17.
-100 -100
EE1-1 to
EE1-5
15EE7 S Move to a self funding position for Invest in Oxfordshire -125 -125
EE1-1 to
EE1-5
16EE18 NP Medium term service implications of economic growth (incl.
Greenbelt Review, Plan Shaping, Road Agreement & Transport
DC, pooled resource)
991 -88 -186 717
EE1-1 to
EE1-5
16EE19 NP One-off service pressures (including LTP4 Programme support
and minerals and Waste Local Plan)
150 -150 0
EE1-1 to
EE1-5
16EE20 NS Realise opportunities from Growth (including Section 788,
capitalisation of staff, pre-application charging and ST model
income)
-518 -20 -20 -558
EE1-1 to
EE1-5
16EE21 NS Removal and reduction of services (incl. Trust for Oxfordshire’s
Environment grant, Travel plan funding and reduction in agency
spend)
-105 -12 -117
Environment & Economy - Budget Changes
Budget
Book
Reference
Type of
Budget
Change
5.18

Reference Detail 2015/16 2016/17 2017/18 Total
ID £000 £000 £000 £000
Environment & Economy - Budget Changes
Budget
Book
Reference
Type of
Budget
Change
EE1-1 to
EE1-5
16CORP4 NS Reduce the use of agency & contracted staff and introduce a
vacancy factor
-70 -70
EE1 Total Strategy & Infrastructure -202 -720 -206 -1,128
Commercial Services
EE2-1 15EE13 S Unidentified Saving- within Commercial Services delivery being
planned
-535 -535
EE2-1 16EE1 NP Insufficient Parking Account funding to draw down budgeted
contribution to revenue
900 150 1,050
EE2 16CORP4 NS Reduce the use of agency & contracted staff and introduce a
vacancy factor
-70 -70
Subtotal Miscellaneous 830 0 -385 445
Property & Facilities Management
EE2-22 14EE32
14EE15
15EE10
S Asset Rationalisation Savings -450 -250 -640 -1,340
EE2-22 15EE11 P Asset Reduction Implementation - Change in profile of additional
funding
-477 711 -756 -522
EE2-22 14EE5 S Estimated facilities management contract savings -100 -20 -120
EE2-22 14EE26 S Further savings from Facilities Management contract dependent
on experience of phase 1 of contract
-175 -175
EE2-22 14EE34 S Reintroduce maintenance 'holiday' to non-school property -
suspension of non-statutory property maintenance work
-200 -707 -907
EE2-22 15EE18 S Property and Facilities staffing including - reduce facilities
management structure/Property & Facilities service
stream/Property and Facilities staffing
-60 -400 -460
5.19

Reference Detail 2015/16 2016/17 2017/18 Total
ID £000 £000 £000 £000
Environment & Economy - Budget Changes
Budget
Book
Reference
Type of
Budget
Change
EE2-22 15EE19 S Reduce size of property portfolio therefore reducing the overall
size of contract
-200 -100 -100 -400
EE2-22 15EE20 S Reduce planned Property Repairs and Maintenance -400 -400
EE2-22 15EE12 S Other staff/staffing facilities reduction -10 -50 -60
EE2-22 16EE4 NP Property related pressures (incl. contract clarifications, Asbestos
surveys and change to the Asset Rationalisation saving profile)
595 -145 -300 150
EE2-22 16EE9 NS Reduction in the funding available to support ad hoc Property
Contract work
-444 336 -108
EE2-22 16CORP5 NS Reduction in contract inflation -100 -100
Subtotal Property & Facilities Management -942 -1,240 -2,260 -4,442
Network & Asset Management
EE2-31 to
EE2-35
14EE10 S Reduction in road patching work and pre-planned surface
maintenance schemes
-700 -310 -1,010
EE2-31 to
EE2-35
15EE26 S Reduce the support for street works and events management -30 -30
EE2-31 to
EE2-35
15EE27 S Reduce Road Survey Budget/other network maintenance/Network
management general restructure/joint workings/Further other
network maintenance
-100 -102 -281 -483
EE2-31 to
EE2-35
15EE28 S Street Lighting - Energy Saving plus reduction in inspection
frequencies and cleaning regimes
-390 -30 -420
EE2-31 to
EE2-35
15EE16 S Withdraw contributions to Bus Stop infrastructure information -58 -57 -115
EE2-31 to
EE2-35
15EE35 S Reduction in non-essential tree maintenance -90 -90
EE2-31 to
EE2-35
16EE3 NP Highways & Transport staffing and income related pressures (incl.
unrealised restructure savings, Traffic Design and Safety Teams
and land search income)
450 450
5.20

Reference Detail 2015/16 2016/17 2017/18 Total
ID £000 £000 £000 £000
Environment & Economy - Budget Changes
Budget
Book
Reference
Type of
Budget
Change
EE2-31 to
EE2-35
16EE8 NS Changes in Real Time Passenger Information technology leading
to efficiencies
-280 -280
EE2-31 to
EE2-35
16CORP5 NS Reduction in contract inflation -100 -100
EE2-36 15EE30 S Income generated through sponsorship and providing other
services
-230 -100 -400 -730
EE2-36 16EE11 NS Increase in parking charges -150 -100 -100 -350
Subtotal Network & Asset Management -1,008 -1,002 -1,148 -3,158
Highways & Transport Operations Delivery
EE2-4 15EE31 S Reorganisation of Area Stewardship and locality working staff -145 -145
EE2-4 15EE32 S Reduce Grass Cutting -689 -689
EE2-4 15EE33 S Alternative defect repairs -200 -200
EE2-4 15EE34 S Significant defect correction lines/signs -175 -175
EE2-4 15EE36 S Other Highways Savings -92 -88 -180
EE2-4 15EE37 S Additional investment in highways defects following increased
volumes
700 700
EE2-4 15EE41 P Additional investment in highways (locality based) - £0.2m
reduction to £1m added in 2014/15
-200 -200
EE2-4 16EE6 NS Staff related reduction in cost and income generation (incl.
restructure, Section 278 Traffic Design & Safety team funding,
staff capitalisation and reduction in agency staff)
-640 -640
EE2-4 16EE7 NS Reduction and efficiencies in Roads Maintenance (incl. removal of
Locality Area Stewardship based funding, efficiencies in winter
maintenance and one-off capitalisation of patching)
-2,957 1,675 -1,282
Subtotal Highways & Transport Operations Delivery -4,223 1,587 -175 -2,811
5.21

Reference Detail 2015/16 2016/17 2017/18 Total
ID £000 £000 £000 £000
Environment & Economy - Budget Changes
Budget
Book
Reference
Type of
Budget
Change
Waste Management
Waste Disposal
EE2-51A 15EE22
16EE5
P Increased Waste Tonnage - linked to the economic up turn and
increase in number of households
1,000 500 500 2,000
Waste Treatment Procurement
EE2-51A 14EE14 O Savings arising from the implementation of the Waste Treatment
Facility - slipped from 2014/15
-489 -489
EE2-51A 14EE8 S Reduce Bulking and Haulage contract costs - resulting from
planned opening of the new waste management facility
-300 -300
EE2-51A 15EE23 S Commercial Waste & Electrical energy from waste - Third Party
Income
-1,300 -1,300
Waste Recycling Centre Strategy
EE2-51A 15EE24 P Household Waste Recycling Centres - additional pressure from
increased Redbridge Rent and unachieved savings; new strategy
for future savings to be developed
-350 -350
Oxfordshire Waste Partnership
EE2-51A 14EE3 S Oxfordshire Waste Partnership -phased withdrawal of non-
statutory waste incentives
-232 -213 -445
EE2-51A 15EE25 S Withdraw contribution to Oxfordshire Waste Partnership -138 -138
Subtotal Waste Management -159 287 -1,150 -1,022
5.22

Reference Detail 2015/16 2016/17 2017/18 Total
ID £000 £000 £000 £000
Environment & Economy - Budget Changes
Budget
Book
Reference
Type of
Budget
Change
Supported Transport
EE2-51B 14SCS17 O Transport for Day Services -400 -400
EE2-51B 15EE14
16EE10
S Supported Transport Project savings which includes review of:
transport contract management, Dial a Ride, bus subsidies, home
to school transports including Special Educational Needs (SEN)
-1,725 -2,100 -1,700 -5,525
EE2-51B 16EE2 NP Home to School Transport 1,200 1,200
Subtotal Supported Transport -925 -2,100 -1,700 -4,725
Highways & Transport Contract & Performance Management
EE2-52 14EE6 S Highways contract management savings -80 -80
EE2-52 15EE15 S Highways contract process efficiency -20 -118 -138
Subtotal Highways & Transport Contract & Performance
Management
-100 0 -118 -218
EE2 Total Commercial Services -6,527 -2,468 -6,936 -15,931
5.23

Reference Detail 2015/16 2016/17 2017/18 Total
ID £000 £000 £000 £000
Environment & Economy - Budget Changes
Budget
Book
Reference
Type of
Budget
Change
Oxfordshire Customer Services
Management Team
EE3-1 16EE12 NP Unachievable previously agreed MTFP savings (including printer
materials and pension overheads)
340 100 -100 340
EE3-1 16EE13 NP Changes to cashflow of investment costs relating to the Hampshire
partnership
550 550
EE3-1 16EE15 NS LEAN and reshape the service out of scope from the Hampshire
partnership (incl. reshape Senior Management structure and
reduce agency spend)
-455 -105 -560
EE3 16CORP4 NS Reduce the use of agency & contracted staff and introduce a
vacancy factor
-70 -70
Subtotal Management Team 365 -5 -100 260
ICT
EE3-3 14EE22 S Removing/ rationalising ICT applications which reduces
maintenance costs
-150 -150 -300
EE3-3 14EE28 S Removal and recycling of ICT Hardware -50 -50
EE3-3 14EE29 S ICT reductions associated with data centre - Movement to "Cloud"
allows reductions in staff and maintenance
-290 -290
EE3-3 14EE33 S ICT reductions based on property rationalisation -400 -400
EE3-3 14EE35 O OCC Data Centre - £0.350m Investment in 2014/15 to secure the
transition to Cloud delivering savings from 2015/16
-500 -500
5.24

Reference Detail 2015/16 2016/17 2017/18 Total
ID £000 £000 £000 £000
Environment & Economy - Budget Changes
Budget
Book
Reference
Type of
Budget
Change
EE3-3 15EE38 S Oxfordshire Customer Services - ICT restructure -960 -960
EE3-3 15EE39 S ICT Rationalisation - including implementation of new telephony
technology
-400 -400
EE3-3 16EE12 NP Unachievable previously agreed MTFP savings relating to ICT
rationalisation
400 400
EE3-3 16EE16 NS Line lease savings due to superfast broad band -150 -150
EE3-3 16EE18 NS Remove Saturday ICT service desk support -28 -28
Subtotal ICT -2,078 -600 0 -2,678
Business Development
EE3-4 15CEO13c S Remove 4fte (vacant posts) and reduce Communications spend
(Business Development share)
-33 -33 -34 -100
EE3-4 14EE34 O Procurement costs of externalisation of customer services - one off
funding in 2014/15 falls out in 2015/16.
-750 -750
Subtotal Business Development -783 -33 -34 -850
Customer Service Centre
EE3-5 16EE14 NP Additional demand 108 108
EE3-5 15EE38 S Customer Service Centre restructure -200 -200
EE3-5 16EE17 NS Self Service -157 -157
Subtotal Customer Service Centre -92 -157 0 -249
Human Resources
EE3-6 14EE24
14EE30
15EE38
S Oxfordshire Customer Services - Human Resources
Externalisation
-350 -350
EE3-6 15EE38 S Oxfordshire Customer Services - Learning & Development -630 -630
Subtotal Human Resources -980 0 0 -980
5.25

Reference Detail 2015/16 2016/17 2017/18 Total
ID £000 £000 £000 £000
Environment & Economy - Budget Changes
Budget
Book
Reference
Type of
Budget
Change
Operational Finance
EE3-7 14EE24
14EE30
15EE38
S Oxfordshire Customer Services - Finance Externalisation -231 -231
Subtotal Operational Finance -231 0 0 -231
Pensions, Procure to Pay
EE3-8 15EE38 S Oxfordshire Customer Services - Money Management -129 -129
Subtotal Pensions, Procure to Pay -129 0 0 -129
Total Oxfordshire Customer Services -3,928 -795 -134 -4,857
Total Environment & Economy -10,657 -3,983 -7,276 -21,916
Type of Budget Change
O - Previously agreed one-off investment NS - New saving agreed February 2015
P - Previously agreed pressure NP - New pressure agreed February 2015
S - Previously agreed saving
NS - New saving agreed February 2015
NP - New pressure agreed February 2015
5.26


Chief Executive's Office
(including Cultural Services)
6.1


Chief Executive’s Office
Business Strategy 2015/16 to 2017/18
Directorate Overview
Delivering the Council’s corporate priorities
Attracting wedding business into Oxfordshire and proving citizenship ceremonies to
welcome our new citizens
Undertaking Coroner’s investigation and inquiries into sudden or unexplained death
and providing support to families through this difficult time.
Individuals, their families and communities have the opportunity to enhance the lives,
wellbeing and educational attainment of those involved through music education and
those who attend performances.
The music service will be a recognised Business Unit which can operate more
commercially, building upon the entrepreneurial approach which has become a
feature of the service.
Targeting work to support and increase children’s, young people’s and families’
literacy and learning; connecting people to information, online resources and learning
and employment opportunities
Contributing to cultural tourism, creative educational programmes, music
involvement, and connecting communities to their heritage
The focus of the Chief Executive’s Office is on working with members to set the direction
of the council and support the organisation through a period of significant change.
Registration & Coroner’s, Music Service and Cultural Services also form part of the
Directorate’s responsibilities.
The Chief Executive’s Office provides a number of key support functions to enable
directorates to achieve the council’s overarching goal of ‘A Thriving Oxfordshire’. This
includes:
Registration & Coroner’s, Music Service, and Cultural Services (including Libraries,
Museums and the History service), along with our work with the voluntary and community
sector play an important role in the delivering Thriving People and Communities, and
Thriving Economy:
working closely with the Leader and Chief Executive on the strategic direction and
priorities of the council;providing the governance framework for the council and supporting members to
make democratic decisions;
supporting service delivery through provision of Human Resources, legal, finance
services and providing policy trouble-shooting capacity and data when required;
delivering internal audit and setting the risk and performance management
framework for the council;
communicating key messages through the local media and within the council;
working in partnership with local and national stakeholders, and ensuring that we
position the county council effectively.
6.2

Services and Priorities
Research and intelligence team, providing key evidence to support service delivery
Performance management
Service and resource planning (with finance)
Supporting scrutiny and cabinet advisory groups
Chief Executive's personal office, including support to the Chairman of the Council
and the Oxfordshire Lieutenancy
Providing policy and trouble-shooting support to council directorates to support
delivery of key priorities and support the service and resource planning process
Working with external stakeholders to support delivery of the council's priorities
The Chief Executive’s office consists of four small units, (Corporate Finance, Corporate
Human Resources, Law and Governance and Policy) plus Registration & Coroner’s, the
Music Service and Cultural Services (which includes Library, Museums and History
Services).
The Policy Team’s current service activity includes:
Working with the Cabinet and County Council Management Team to articulate the
council's strategic direction
Corporate Finance (including Internal Audit and Insurance) lead on the council’s key
financial processes including working with members to set the budget, Medium Term
Financial Plan and capital programme. The service provides support, advice and
challenge to high risk areas, projects and programmes, together with a lead advisor on
financial matters for each directorate. As part of our statutory requirement we are
required to have an officer responsible for the arrangements for the proper administration
of its financial affairs, this is the Chief Financial Officer. Internal Audit provides a level of
assurance by managing the internal governance and reporting, this also includes
managing risk.
Corporate HR ensures that the council complies with employment legislation and has a
skilled, motivated and well informed workforce. Current service activity includes:
The Corporate HR team which defines, develops and communicates a comprehensive
employment framework for all major aspects of work and employment. Key areas are
policy development, professional advice, employee relations and workforce information
and analysis together with the provision of business partner support for each directorate.
Cabinet and County Council management team support and forward planning
Setting the framework for the council's approach to working at a local level in
communities
Leading work with the voluntary and community sectors
6.3

Attendance and representing the council in the Supreme Court, Court of Appeal,
High Court and all other lesser courts (including Magistrates and Tribunals)
Provide legal advice on contracts, developer agreements, highways and property
matters, employment related matters, child protection, adult safeguarding, debt
recovery, consumer protection and trading standards matters, inquests, and
possessions.
Professional clerking of the Council’s main democratic decision-making bodies
(Council, Cabinet, Scrutiny and Council Committees), preparation of the formal
‘Forward Plan’, agendas and minutes; advice to managers on procedure and reports;
advice to councillors about Constitutional rules and rights relating to formal decision-
making meetings
Effective and compliant governance arrangements including compliance with all
public law requirements and Member/Officer codes of conduct
Legal Services provides comprehensive legal advice, representation and assistance to
the council and all directorates. This includes:
The Organisational Development team drive organisational effectiveness by supporting
effective change management ensuring the council has a skilled workforce capable of
fulfilling statutory duties. Key areas are strategic leadership, performance management,
workforce planning, employee engagement, learning & development and Investors in
People
The Communications team agree a communication strategy with County Council
Management Team and Cabinet who are the decision making body of the council at the
start of each year. Key areas are media and public relations, internal communications,
marketing, consultation and digital.
The Governance team provides support and advice to Councillors and co-opted
members; and electoral support for the Returning Officer who has to oversee the
electoral process. The team are also responsible for:
The Registration and Coroner’s Service provide a statutory service that serves people at
key times of their lives including:
Oversight of the Council’s constitution policies and procedures
Managing the proper administration of Schools admissions appeals, exclusions
appeals, and transport appeals.
Providing specialist advice to managers on handling Freedom of Information and
Environmental Information Requests; and for reporting to the Monitoring Officer on,
compliance with these statutory requirements.
Leading on Local Government Ombudsman complaints (the ‘Link Officer’ role) for
the Monitoring Officer; and advising managers on the application of the complaints
policy, including commenting on the adequacy of all second stage responses;
providing management information on the Council’s compliance with Ombudsman
and other best practice standards.
Full Registration Service for all births, deaths, marriages and civil partnerships within
Oxfordshire. This service also:
6.4

The Music Service provides music teaching support to schools, as well as instrumental
and vocal tuition to children and adults, and opportunities for making music together.
Cultural Services provide opportunities for people of all ages to participate in and enjoy
cultural activities, to acquire new skills and knowledge and access learning and
employment opportunities through:
The History Service preserves and makes available the historic documents,
photographs, and printed resources necessary for the public to understand the
history of Oxfordshire and develop a sense of place and identity.
The Library Service provides access to books, information and knowledge to support
the recreational, cultural and educational needs of those who live, work and study in
Oxfordshire.
The Museum Service enables the long term care and preservation of the County’s
archaeology and history material. Through its permanent displays, temporary
exhibitions and in partnership with others, it inspires an interest in the history and
culture of the County.
Delivers civil partnerships, citizenship ceremonies, Nationality Checking
Services, Settlement Checking Service, and additional celebratory services such
as naming ceremonies.
Investigates deaths that appear violent, unnatural, sudden, of unknown cause, or
occurring in legal custody; as well as military repatriations through the Coroner’s
Service.
Delivers the national Tell Us Once service to the bereaved
6.5

How our services are changing
The Chief Executive’s Office is changing to reflect the needs of the organisation. We are
reducing the number of staff, reducing the internal spend along with reducing the
services we provide to the rest of the organisation. This means in the future we will be
providing a more flexible and responsive service looking at self-service approaches. We
will also be reviewing statutory and non-statutory services and the charges we make for
these.
6.6

Grant Other Recharges Net
Ref. Service Area Income Income Expenditure
2015/16
£000 £000 £000 £000
CEO1 0 0 0 848
CEO2 0 -3 0 2,738
CEO3 -50 -368 -287 2,892
CEO4 -642 -4,621 -1,938 10,706
CEO5 0 0 0 916
CEO6 0 0 0 79
-692 -4,992 -2,225 18,179
(1) 0 0 -7,327 -1,448
-692 -4,992 -9,552 16,731
Non Negotiable Support Service Recharges 0 0 0 2,062
-692 -4,992 -9,552 18,793
0 0 2,293 0
-692 -4,992 -7,259 18,793
INCOME
£000 % £000 %
19,958 62.9 -692 12.2
3,540 11.2 -887 15.6
318 1.0
5,025 15.8 -4,105 72.2
181 0.6
2,714 8.6 -5,684 100.0
31,736 100.0 18,793
-7,259
24,477
Chief Executive's Office & Business Support 848
Chief Executive's Office - Summary
Revenue Budget 2015/16
Gross
Expenditure
£000
Human Resources 2,741
Corporate Finance & Internal Audit 3,597
Law & Culture 17,907
Total Non Negotiable Support Service 34,029
Policy 916
Corporate & Democratic Core 79
Budget Controllable by Directorate 26,088
Plus Corporate & Democratic Core 5,879
Total Corporate & Democratic Core 31,967
2,062
Less Recharges within the Directorate -2,293
TOTAL 31,736
Subjective Analysis 2015/16
2015/16 Budget at
Outturn Prices
Employees Government Grants
Premises Other Grants, Reimbursements &
ContributionsTransport
EXPENDITURE 2015/16 Budget at
Outturn Prices
(1) The presentation of the directorate summary has been updated to reflect a technical change to non-negotiable support
service recharges and Corporate and Democratic Core to show more clearly the budgets controllable by directorates
Recharges to other directorates
TOTAL EXPENDITURE
Supplies and Services Customer & Client Receipts
Agency & Contracted
Support Services TOTAL INCOME
GROSS EXPENDITURE NET EXPENDITURE
6.7

Gross Grant Other Recharges Net
Reference Service Area Expenditure Income Income Expenditure
2015/16
£000 £000 £000 £000 £000
CEO1 CHIEF EXECUTIVE'S OFFICE & BUSINESS SUPPORT 848 0 0 0 848
Business Support provides operational support, including
administration and planning to the Chief Executive's Office, the
Lord Lieutenant of Oxfordshire, Cabinet and Senior
Management of the Council.
TOTAL CHIEF EXECUTIVE'S OFFICE & BUSINESS
SUPPORT
848 0 0 0 848
CEO2 HUMAN RESOURCES 2,741 0 -3 0 2,738
Strategic Human Resources - provide policy and expert
professional advice and tools for the Council's workforce. This
reflects latest employment law/legislation and best practice
and enables delivery of expert employment solutions.
Human Resources Business Partners - key members of the
directorate senior management teams working at a strategic
level.
Organisational Development – Drives organisational
effectiveness by ensuring that the Council has a skilled
workforce capable of fulfilling statutory duties.
Communications - Provide residents with information about
Council services and policies; enable the Council to
understand service users priorities through effective
consultation and to keep staff informed about working in the
Council.
TOTAL HUMAN RESOURCES 2,741 0 -3 0 2,738
CEO3 CORPORATE FINANCE & INTERNAL AUDIT 3,597 -50 -368 -287 2,892
Strategic Financial Planning, Accounting and Advice - provides
corporate leadership of the finance function, including setting
the budget, Medium Term Financial Plan and Capital
Programme, monitoring against these in year and reporting the
outturn position and accounts. Leads on corporate and
professional standards and technical financial advice.
Finance Business Partners - Provide a strategic client role in
ensuring that Management Accounting teams in Oxfordshire
Customer Services provide a high quality and effective service
to the organisation and ensuring proper financial
administration within the directorates.
Treasury Management - Manage the Council's cash flow and
debt portfolio.
Pensions Investment - Manage the investments of the
Oxfordshire Pension Fund. Advise the pension committee on
investment and performance and complete the Pension Fund
accounts.
Internal Audit - Provides independent assurance opinions and
advice on systems of internal control across the Council.
TOTAL CORPORATE FINANCE & INTERNAL AUDIT 3,597 -50 -368 -287 2,892
Chief Executive's Office - Revenue Budget 2015/16
6.8

Gross Grant Other Recharges Net
Reference Service Area Expenditure Income Income Expenditure
2015/16
£000 £000 £000 £000 £000
Chief Executive's Office - Revenue Budget 2015/16
CEO4 LAW & CULTURE
Legal Services provide a comprehensive legal advice and
representation service to all Directorates of the Council and to
the Council as a whole.
Democratic services lead and supports the corporate
management and governance of the Council and administers
the democratic decision making process.
The Registration Service provides a caring and efficient
service for registering; births, deaths, marriages, civil
partnerships and other celebratory ceremonies.
The Coroners service provides essential administrative and
officer support to the Coroner and the fulfilment of his statutory
Coronial duties.
Cultural Services provides public library services to anyone
living, working or studying in the county. Through the
Oxfordshire Museums Service, the History Service and the
Victoria County History, it cares for the heritage of Oxfordshire
and helps people enjoy and understand it.
CEO4-1 Legal Services 1,841 0 -419 -1,585 -163
CEO4-2 Governance 1,870 0 -38 0 1,832
CEO4-3 Coroner's Service 950 0 -3 0 947
CEO4-4 Registration Service 1,691 0 -1,723 0 -32
CEO4-5 Cultural Services 8,991 0 -1,014 -78 7,899
CEO4-6 Music Service 2,564 -642 -1,424 -275 223
TOTAL LAW & CULTURE 17,907 -642 -4,621 -1,938 10,706
CEO5 POLICY 916 0 0 0 916
Lead and co-ordinate the Council's horizon scanning, forward
planning, strategy and policy development and relationship
with national government and other stakeholders. Provide
support to the Cabinet, Chief Executive and County Council
Management Team. Co-ordinate and support strategic
partnerships including the Oxfordshire Partnership and
relationships with District Councils.
TOTAL STRATEGY & COMMUNICATIONS 916 0 0 0 916
CEO6 CORPORATE & DEMOCRATIC CORE 79 0 0 0 79
These budgets comprise recharges from other service areas
within Chief Executive's Office and Oxfordshire Customer
Services to the corporate and democratic core of the Council
in accordance with the Service Reporting Code of Practice
(SeRCOP).
TOTAL CORPORATE & DEMOCRATIC CORE 79 0 0 0 79
DIRECTORATE TOTAL 26,088 -692 -4,992 -2,225 18,179
Non Negotiable Support Service Recharges 2,062 0 0 0 2,062
Less Recharges within the Directorate -2,293 0 0 2,293 0
Plus Corporate & Democratic Core 5,879 0 0 -7,327 -1,448
TOTAL 31,736 -692 -4,992 -7,259 18,793
6.9

Reference Detail 2015/16 2016/17 2017/18 Total
ID £000 £000 £000 £000
Chief Executive's Office & Business Support
CEO1 14CEO7a S Reduce staffing and office costs from Chief Executive's Office -100 -100 -200
CEO1 15CEO14 S Take out military and local grants (Locality Grant to Choose
Abingdon and Refugee Resource Grant)
-30 -15 -45
CEO1 16CEO6 NS Remove Councillor Community Budgets -315 -315
CEO1 16CORP2 NS Supplies & Services -1 -1
CEO1 Total Chief Executive's Office & Business Support -446 -115 0 -561
Human Resources
CEO2 15CEO3 S Reduce Human Resources establishment by 2 full time equivalents -42 -42
CEO2 16CEO5 NS One-off Learning & Development reduction -250 250 0
CEO2 16CORP4 NS Reduce the use of agency & contracted staff and introduce a
vacancy factor
-51 -51
CEO2 16CORP2 NS Supplies & Services -5 -5
CEO2 Total Human Resources -306 208 0 -98
Corporate Finance & Internal Audit
CEO3 16CORP4 NS Reduce the use of Agency & Contracted staff and introduce a
vacancy factor
-76 -76
CEO3 16CORP2 NS Supplies & Services -7 -7
CEO3 Total Corporate Finance & Internal Audit -83 0 0 -83
Chief Executive's Office - Budget Changes
Budget
Book
Reference
Type of
Budget
Change
6.10

Reference Detail 2015/16 2016/17 2017/18 Total
ID £000 £000 £000 £000
Chief Executive's Office - Budget Changes
Budget
Book
Reference
Type of
Budget
Change
Law and Culture
CEO4-1 16CEO4 NS Legal Services - additional income from external and internal clients -200 -200
CEO4-2 16CEO1 NP Members' Allowances 160 160
CEO4-3 and
4-4
16CEO2 NS Registration and Coroners Service - Increase charges and
renegotiation of contract
-32 -32
CEO4-5 15CEO9 S Withdrawal of grant to the Mill Arts Centre -80 -80
CEO4-5 15CEO10 S Increased efficiencies to be achieved by Library Service through
further review of management support, book procurement & supplies
and services
-63 -187 -250
CEO4-5 16CEO3 NS Libraries/Cultural Services - Review of management support,
supplies and services, including book fund
-95 -95
CEO4-6 15CEF3 S Make Music Service self financing by increasing income and
reducing free tuition.
-70 -70 -182 -322
CEO4 16CORP4 NS Reduce the use of agency & contracted staff and introduce a
vacancy factor
-307 -307
CEO4 16CORP2 NS Supplies & Services -5 -5
CEO4 Total Law and Culture -612 -257 -262 -1,131
6.11

Reference Detail 2015/16 2016/17 2017/18 Total
ID £000 £000 £000 £000
Chief Executive's Office - Budget Changes
Budget
Book
Reference
Type of
Budget
Change
Policy
CEO5 15CEO13b S Remove 4fte (vacant posts) and reduce Communications spend -17 -17 -16 -50
CEO5 16CORP4 NS Reduce the use of agency & contracted staff and introduce a
vacancy factor
-19 -19
CEO5 16CORP2 NS Supplies & Services -2 -2
CEO5 Total Policy -38 -17 -16 -71
Total Chief Executive's Office -1,485 -181 -278 -1,944
Type of Budget Change
O - Previously agreed one-off investment
P - Previously agreed pressure
S - Previously agreed saving
NS - New saving agreed February 2015
NP - New pressure agreed February 2015
6.12


Public Health
7.1


Public Health
Business Strategy 2015/16 to 2017/18
Directorate Overview
Delivering the Council's corporate priorities
The Health and Social Care Act 2012 returned a public health role to local government.
The reformed public health system gives us an unprecedented opportunity to take a far
more strategic role. We can now promote public health through the full range of council
business and become an influential source of trusted advice for the population, the local
NHS and everyone whose activity might affect, or be affected by, the health of the people
in Oxfordshire.
Public health practice made huge strides during the 20th century, transforming the living
standards of millions and saving countless lives in the process. Yet real threats still linger
and new ones emerge. Dealing with the avoidable mortality caused by smoking or obesity
as conclusively as cholera and typhoid were dealt with requires different ways of thinking
and acting.
We will have succeeded when we can see that the people of Oxfordshire are living longer,
healthier lives and we have narrowed the persistent inequalities in health.
Building a thriving economy – Economic productivity within an area is closely tied to
its health and wellbeing. We develop and commission initiatives, such as NHS health
checks and public health campaigns, to keep people healthy so that they can be
economically active, thus contributing towards the financial success of Oxfordshire.
We work ever more closely with colleagues in Environment and Economy so that
wider development plans across Oxfordshire are informed by evidence about how
changes to infrastructure can best support the health and well-being of the people of
Oxfordshire.
Supporting healthy Thriving people and communities – we support people in making
healthy lifestyle choices, keeping people safe from diseases and other threats plus
identifying people who are more vulnerable to disease and ill health. Healthy people
are able to contribute to and work for their local community, thus allowing
communities to thrive. We coordinate work across the Council with the voluntary
sector and promote programmes to tackle inequalities. We work closely to support
the NHS and to join up NHS and Council business. Our work on community safety
with the police and our drug rehabilitation programmes also contributes. We help to
keep people safe through our 24/7 on call service for emergencies and disasters
affecting the community. We support people to make commitments to be active,
using the environment for both community and personal health gain. We help to keep
the environment safe by helping to prevent environmental hazards and infectious
diseases.
7.2

How we work to deliver these priorities We are rolling out a programme of ‘agile
working’ in order to support the new ways of working necessary to deliver these priorities.
Agile working means: giving staff the right equipment and working environment to suit
their role and service; working in a more flexible way that makes best use of staff time,
buildings, and resources; and taking advantage of changes in technology and working
styles to become more efficient. This will ultimately protect delivery of front line services
as far as possible. The public health team works across two locations where hot-desking
systems are used in order to optimise office space. Staff also make use of laptops and
blackberries with secure network connections to enable them to work from a variety of
locations including other council or NHS sites and from home when appropriate. Where
possible the team take active travel opportunities, walking, cycling and public transport.
Supporting the vulnerable – we ensure that the services we commission support
those people who are the most vulnerable by building specific requirements into our
contracts. Some services we commission are targeted at vulnerable groups, such as
rehabilitation services and needle exchange for drug users, support to ensure that
rehomed families are rapidly allocated a new health visitor and additional community
breast feeding support in areas where breastfeeding is low. We also deliver extensive
public health campaigns to help vulnerable groups understand the importance of
taking up opportunities to protect their health such as the NHS health check,
immunisations and screening programmes.
7.3

Services and Priorities
Our responsibilities cover:
Sexual Health Services
NHS Health Check programme
Local Authority monitoring and oversight role in health protection
Public health advice
National Child Measurement Programme
Obesity
Physical Activity
Drug Misuse
Alcohol Misuse
Stop smoking services and tobacco control
Public health services for children 5-19 (including School Health Nursing)
From October 2015, public health services for children 0 – 5 years old
Wider work including
Wider Determinants
Mental well being
Oral health
Nutrition Initiatives
Accidental injury prevention
Behavioural and lifestyle campaigns
Health at Work
public health aspects of promotion of community safety
public health aspects of local initiatives to tackle social exclusion
local initiatives that reduce public health impacts of environmental risks.
From April 2013 Oxfordshire County Council took over a raft of vital public health activity,
ranging from stroke prevention and tackling obesity to drug misuse and sexual health
services.
Our priorities are informed by the Joint Health and Well-Being strategy for Oxfordshire
and include promoting the uptake of cancer screening programmes and immunisation
programmes; promoting the uptake of NHS Health Checks; promoting breastfeeding;
increasing the number of people supported to quit smoking, halting the increase in
childhood obesity and increasing the number of drug users successfully completing their
treatment in order to become drug free.
7.4

How our services are changing
In 2014/15 Public health is funded through a ring fenced grant of £26.085m from central
government. We aim to make a significant reduction in our budget in line with other
directorates of £1.25m savings in each of 2016/17 and 2017/18 (£2.5m in total). In
addition to this we have and will continue to streamline our work against that of other
directorates and to support them in making efficiencies where initiatives are in line with
the public health grant conditions. The savings are loaded towards the latter years as we
are anticipating that the County Council will be expected to protect the ring-fence until
after 2015/16 in line with central government policy. The intention is to make savings
through commissioning more efficient services, internal efficiencies and reviewing health
promotion campaigns rather than through seeking front line service reductions. This is
possible as new contracts have agreed efficiencies built in.
In October 2015 we will take on responsibility for commissioning Health Visiting services,
so we are working closely with the NHS England Thames Valley team to ensure that
transition of this service runs smoothly. The 2015/16 grant of £29.847m reflects that new
responsibility.
Public Health is a small directorate that secures its services through commissioning. As
contracts become due for renewal they will be renegotiated to ensure opportunities for
efficiencies and market testing are optimised. The new contracts reflect latest practice
and population requirements; are more clearly defined, so that we can more easily
monitor what is being delivered for our money; and increase requirements for quality
monitoring and safeguarding.
7.5

Grant Other Recharges Net
Ref. Service Area Income Income Expenditure
2015/16
£000 £000 £000 £000
PH1 0 0 0 14,728
PH2 0 -177 -427 15,025
PH3 0 0 0 94
PH4 Grant Income 0 -29,847 0 0 -29,847
-29,847 -177 -427 0
(1) -572 0 0 0
-30,419 -177 -427 0
0 0 0 0
-30,419 -177 -427 0
INCOME
£000 % £000 %
1,652 5.3 -30,419 99.4
7 0.0 -177 0.6
39 0.1
5,670 18.3 0 0.0
23,087 74.4
568 1.8 -30,596 100.0
31,023 100.0 0
-427
30,596
LA Commissioning Responsibilities - Nationally defined 14,728
Public Health - Summary
Revenue Budget 2015/16
Gross
Expenditure
£000
LA Commissioning Responsibilities - Locally defined 15,629
Public Health Recharges 94
Budget Controllable by Directorate 30,451
2015/16 Budget at
Outturn Prices
Non Negotiable Support Service Recharges 572
Total Non Negotiable Support Service Recharges 31,023
Less Recharges with the Directorate 0
Total 31,023
Subjective Analysis 2015/16
EXPENDITURE 2015/16 Budget at
Outturn Prices
Employees Government Grants
Premises Other Grants, Reimbursements
& ContributionsTransport
(1) The presentation of the directorate summary has been updated to reflect a technical change to non-negotiable support
service recharges to show more clearly the budgets controllable by directorates
Recharges to other directorates
TOTAL EXPENDITURE
Supplies and Services Customer & Client Receipts
Agency & Contracted
Support Services TOTAL INCOME
GROSS EXPENDITURE NET EXPENDITURE
7.6

Gross Grant Other Recharges Net
Reference Service Area Expenditure Income Income Expenditure
2015/16
£000 £000 £000 £000 £000
PH1 MANDATORY FUNCTIONS
The public health grant is used to:
• improve significantly the health and wellbeing of local
populations
• carry out health protection functions delegated from the
Secretary of State
• reduce health inequalities across the life course, including
within hard to reach groups
• ensure the provision of population healthcare advice.
Prescribed functions:
1) Sexual health services - STI testing and treatment
2) Sexual health services – Contraception
3) NHS Health Check programme
4) Local authority role in health protection
5) Public health advice
6) National Child Measurement Programme
PH1-1 Sexual Health 9,390 0 0 0 9,390
PH1-2 NHS Health Check Programme 730 0 0 0 730
PH1-3 Health Protection 20 0 0 0 20
PH1-4 National Child Measurement Programme 150 0 0 0 150
PH1-5 Public Health Advice 105 0 0 0 105
PH1-6 0-5 Year Olds 4,333 0 0 0 4,333
TOTAL LA Commissioning Responsibilities - Nationally
defined
14,728 0 0 0 14,728
PH2 NON-MANDATORY FUNCTIONS
Public Health - Revenue Budget 2015/16
Non-prescribed functions:
7) Sexual health services - Advice, prevention and promotion
8) Obesity – adults
9) Obesity - children
10) Physical activity – adults
11) Physical activity - children
12) Drug misuse - adults
13) Alcohol misuse - adults
14) Substance misuse (drugs and alcohol) - youth services
15) Stop smoking services and interventions
16) Wider tobacco control
17) Children 5-19 public health programmes
18) Miscellaneous, which includes:
o Non-mandatory elements of the NHS Health Check
programme
o Nutrition initiatives
o Health at work
o Programmes to prevent accidents
o Public mental health
o General prevention activities
o Community safety, violence prevention & social exclusion
o Dental public health
o Fluoridation
o Local authority role in surveillance and control of infectious
disease
o Information & Intelligence
o Any public health spend on environmental hazards
protection
o Local initiatives to reduce excess deaths from seasonal
mortality
o Population level interventions to reduce and prevent birth
defects (supporting role)
o Wider determinants
7.7

Gross Grant Other Recharges Net
Reference Service Area Expenditure Income Income Expenditure
2015/16
£000 £000 £000 £000 £000
Public Health - Revenue Budget 2015/16
PH2-1 Obesity 891 0 0 0 891
PH2-2 Physical Activity 135 0 0 0 135
PH2-3 Public Health General 1,526 0 0 0 1,526
PH2-4 Smoking and Tobacco Control 982 0 0 0 982
PH2-5 Children's 5-19 Public Health Programme 2,106 0 0 0 2,106
PH2-6 Other Public Health Programmes 745 0 0 0 745
PH2-7 Drugs and Alcohol 9,244 0 -177 -427 8,640
TOTAL LA Commissioning Responsibilities - Locally
defined
15,629 0 -177 -427 15,025
PH3 PUBLIC HEALTH RECHARGES 94 0 0 0 94
TOTAL PUBLIC HEALTH RECHARGES 94 0 0 0 94
PH4 GRANT INCOME 0 -29,847 0 0 -29,847
TOTAL GRANT INCOME 0 -29,847 0 0 -29,847
DIRECTORATE TOTAL 30,451 -29,847 -177 -427 0
Non Negotiable Support Service Recharges 572 -572 0 0 0
Less Recharges within the Directorate 0 0 0 0 0
TOTAL 31,023 -30,419 -177 -427 0
7.8

Reference Detail 2015/16 2016/17 2017/18 Total
ID £'000 £'000 £'000 £'000
Cross
Directorate
15PH1 S More efficient contract negotiations -1,250 -1,250 -2,500
Total Public Health 0 -1,250 -1,250 -2,500
Type of Budget Change
O - Previously agreed one-off investment
P - Previously agreed pressure
S - Previously agreed saving
NS - New saving agreed February 2015
NP - New pressure agreed February 2015
Public Health - Budget Changes
Budget
Book
Reference
Type of
Budget
Change
7.9

Capital
Programme
8.1


Current Year
Programme 2014 / 15 2015 / 16 2016 / 17 2017 / 18 2018 / 19
£000 £000 £000 £000 £000 £000
Children, Education & Families 1 - OCC 37,101 43,420 38,953 32,687 11,628 163,789
Children, Education & Families 2 - Schools Local Capital 2,500 2,200 1,383 1,278 0 7,361
CEF Programme reductions to be identified 0 0 0 -5,814 0 -5,814
Social & Community Services 3,066 3,304 15,347 2,591 12,910 37,218
Environment & Economy 1 - Transport 49,937 61,644 30,861 23,986 15,040 181,468
Environment & Economy 2 - Other Property
Development Programmes10,666 13,672 2,777 2,285 5,352 34,752
Chief Executive's Office 874 3,160 365 1,000 250 5,649
TOTAL ESTIMATED CAPITAL PROGRAMME
EXPENDITURE 104,144 127,400 89,686 58,013 45,180 424,423
Earmarked Reserves 915 0 10,619 10,000 24,949 46,483
TOTAL ESTIMATED CAPITAL PROGRAMME 105,059 127,400 100,305 68,013 70,129 470,906
TOTAL ESTIMATED PROGRAMME IN-YEAR
RESOURCES96,185 97,556 95,516 71,029 48,919 409,205
In-Year Shortfall (-) /Surplus (+) -8,874 -29,844 -4,789 3,016 -21,210 -61,701
Cumulative Shortfall (-) / Surplus (+) 61,701 52,827 22,983 18,194 21,210 0 0
Capital Programme: 2014/15 to 2018/19 Planned Expenditure and Financing
Firm Programme Provisional Programme CAPITAL
INVESTMENT
TOTAL
8.2

2014 / 15 2015 / 16 2016 / 17 2017 / 18 2018 / 19
CAPITAL
RESOURCES
TOTAL
£'000s £'000s £'000s £'000s £'000s £'000s
SCE(C) Formulaic Capital Allocations -
Un-ringfenced Grant50,484 44,478 24,839 20,614 23,288 163,703
SCE(C) Supplementary Grant Approval 600 0 272 0 0 872
Devolved Formula Capital- Grant 2,474 2,200 1,383 1,278 0 7,335
Prudential Borrowing 1,106 15,054 30,642 18,501 17,636 82,939
Grants 35,291 14,849 6,111 4,000 0 60,251
Developer Contributions 11,667 32,578 27,213 23,400 10,559 105,417
District Council Contributions 720 0 0 0 0 720
Other External Funding Contributions 301 3 0 0 0 304
Revenue Contributions 2,347 2,529 770 220 102 5,968
Schools Contributions 69 5 0 0 0 74
Use of Capital Receipts 0 15,704 7,827 0 350 23,881
Use of Capital Reserves 0 0 1,248 0 18,194 19,442
TOTAL ESTIMATED PROGRAMME RESOURCES
UTILISED105,059 127,400 100,305 68,013 70,129 470,906
TOTAL ESTIMATED IN YEAR RESOURCES
AVAILABLE96,185 97,556 95,516 71,029 48,919 409,205
Capital Grants Reserve C/Fwd 28,112 17,326 0 0 2,666 0 0
Usable Capital Receipts C/Fwd 14,147 16,059 3,541 0 350 0 0
Capital Reserve C/Fwd 19,442 19,442 19,442 18,194 18,194 0 0
SOURCES OF FUNDING
8.3

Current Year
2014 / 15 2015 / 16 2016 / 17 2017 / 18 2018 / 19
£000 £000 £000 £000 £000 £000 £000 £000 £000
Primary Capital Programme
Bayards (New Scheme) - replacement of existing buildings (ED750) 2,168 4,080 500 58 0 0 6,806 4,638 558
Eynsham - Expansion to 2FE (ED785) 78 410 13 0 0 0 501 423 13
Oxford, SS Mary & John - Single Site (ED873) 0 100 225 25 0 0 350 350 250
Primary Capital Programme Total 2,246 4,590 738 83 0 0 7,657 5,411 821
Secondary Capital Programme
Wantage, King Alfred's (ED872) 0 450 82 0 0 0 532 532 82
Secondary Capital Programme Total 0 450 82 0 0 0 532 532 82
Provision of School Places (Basic Need)
Existing Demographic Pupil Provision (Basic Needs Programme) 558 851 7,000 6,982 6,500 2,680 24,571 24,013 23,162
11/12 - 13/14 Basic Need Programme Completions 11,122 401 83 0 0 0 11,606 484 83
Oxford, Orchard Meadow - (Phase 2) (ED819) 554 50 42 0 0 0 646 92 42
Oxford, New Marston - (Phase 4) (ED798) 1,151 233 0 0 0 0 1,384 233 0
Oxford, Cutteslowe - (Phase 3) (ED796) 1,224 680 36 0 0 0 1,940 716 36
Oxford, St Joseph's - (Expansion to 2 FE) (ED815) 135 1,060 13 0 0 0 1,208 1,073 13
Oxford, St Gregory - (Phase 2) New 2FE (ED823) 199 2,900 102 0 0 0 3,201 3,002 102
Bletchingdon - Relocate School & Expansion to 0.5FE (ED841) 24 550 400 44 0 0 1,018 994 444
Children, Education & Families Capital Programme - February 2015
Project/ Programme Name
Previous Years Actual
Expenditure
Firm Programme Provisional Programme
Total Scheme
Cost
Capital Investment
Total (excluding
previous years)
Future Capital
Investment Total
(excluding
previous and
current years)
8.4

Current Year
2014 / 15 2015 / 16 2016 / 17 2017 / 18 2018 / 19
£000 £000 £000 £000 £000 £000 £000 £000 £000
Children, Education & Families Capital Programme - February 2015
Project/ Programme Name
Previous Years Actual
Expenditure
Firm Programme Provisional Programme
Total Scheme
Cost
Capital Investment
Total (excluding
previous years)
Future Capital
Investment Total
(excluding
previous and
current years)
Woodstock - (Phase 3) Expansion to 1.5FE (ED809) 42 448 30 0 0 0 520 478 30
Oxford, St Christopher's - Expansion to 2FE (ED818) 214 1,896 120 0 0 0 2,230 2,016 120
Oxford, St Ebbe's - Expansion to 2FE (ED813) 36 1,018 46 0 0 0 1,100 1,064 46
Botley - Expansion to 2FE (ED830) 248 742 50 0 0 0 1,040 792 50
Henley, Badgemore - (Phase 2) Expansion to 1FE (ED803) 85 1,100 668 50 0 0 1,903 1,818 718
Reducing Out of County Provision for SEN Pupils (ED810) 1,326 4,000 124 0 0 0 5,450 4,124 124
Cheney - Expansion by 1FE (ED864) 0 150 1,472 81 0 0 1,703 1,703 1,553
Wantage, Charlton - (Phase 3) Expansion to 2FE (ED842) 72 600 900 88 0 0 1,660 1,588 988
Oxford, Larkrise - Expansion to 2FE (ED845) 112 501 36 0 0 0 649 537 36
Banbury, Frank Wise - Post 16 Provision (ED843) 156 600 1,252 100 0 0 2,108 1,952 1,352
Oxford, Wolvercote - Expansion to 1.5FE (ED829) 205 1,000 1,550 144 0 0 2,899 2,694 1,694
Wallingford, Fir Tree Junior - Expansion to 2FE (ED821) 52 150 149 15 0 0 366 314 164
Provision of School Places Total 17,515 18,930 14,073 7,504 6,500 2,680 67,202 49,687 30,757
8.5

Current Year
2014 / 15 2015 / 16 2016 / 17 2017 / 18 2018 / 19
£000 £000 £000 £000 £000 £000 £000 £000 £000
Children, Education & Families Capital Programme - February 2015
Project/ Programme Name
Previous Years Actual
Expenditure
Firm Programme Provisional Programme
Total Scheme
Cost
Capital Investment
Total (excluding
previous years)
Future Capital
Investment Total
(excluding
previous and
current years)
Growth Portfolio - New Schools Note: This section of the programme shows available funding and not the full scheme cost, unless Project Approval number displayed.
South Oxfordshire
Didcot, Great Western Park - Primary 1 (14 classroom) 120 600 3,500 2,512 0 0 6,732 6,612 6,012
Didcot, Great Western Park - Primary 2 (14 classroom) 0 0 150 3,600 2,483 0 6,233 6,233 6,233
Didcot, Great Western Park - Secondary (Phase 1) 0 100 750 10,000 10,190 0 21,040 21,040 20,940
Didcot, University Technical College - Secondary (Contribution)
(ED867)
0 300 1,500 200 0 0 2,000 2,000 1,700
Cherwell
Bodicote, Longford Park - 10 classroom 0 200 3,000 2,375 293 0 5,868 5,868 5,668
Bicester - Secondary P1 (incl existing schools) 0 0 100 600 8,000 5,505 14,205 14,205 14,205
Bicester, South West - 14 classroom (ED822) 339 3,400 3,400 196 0 0 7,335 6,996 3,596
Bicester Exemplar Eco-development - Primary 1 Phase 1 (7
classroom)
74 200 3,700 2,548 265 0 6,787 6,713 6,513
Oxford
Oxford - Barton (West) 0 200 3,700 2,748 350 0 6,998 6,998 6,798
Countywide
Project Development Budget 0 100 100 100 150 0 450 450 350
Growth Portfolio Total 533 5,100 19,900 24,879 21,731 5,505 77,648 77,115 72,015
8.6

Current Year
2014 / 15 2015 / 16 2016 / 17 2017 / 18 2018 / 19
£000 £000 £000 £000 £000 £000 £000 £000 £000
Children, Education & Families Capital Programme - February 2015
Project/ Programme Name
Previous Years Actual
Expenditure
Firm Programme Provisional Programme
Total Scheme
Cost
Capital Investment
Total (excluding
previous years)
Future Capital
Investment Total
(excluding
previous and
current years)
Children's Home
Children's Home Programme 159 400 3,800 2,200 1,266 0 7,825 7,666 7,266
Children's Home Total 159 400 3,800 2,200 1,266 0 7,825 7,666 7,266
Annual ProgrammesSchools Access Initiative 381 400 400 400 400 400 2,381 2,000 1,600
Health & Safety - Schools 48 350 325 275 300 300 1,598 1,550 1,200
Temporary Classrooms - Replacement & Removal 91 528 250 310 300 350 1,829 1,738 1,210
Schools Accommodation Intervention & Support Programme 0 25 75 75 100 100 375 375 350
School Structural Maintenance (inc Health & Safety) 4,994 3,119 2,000 2,000 1,750 1,750 15,613 10,619 7,500
Schools Energy Reduction Programme 26 0 250 250 250 250 1,026 1,000 1,000
Annual Programme Total 5,540 4,422 3,300 3,310 3,100 3,150 22,822 17,282 12,860
Other Schemes & Programmes
Early Years Entitlement for Disadvantage 2 year olds 0 600 1,000 822 0 0 2,422 2,422 1,822
Free School Meals (ED862) 0 1,850 143 0 0 0 1,993 1,993 143
Loans to Foster/Adoptive Parents (Prudentially Funded) 247 90 90 90 90 293 900 653 563
Small Projects 72 60 4 0 0 0 136 64 4
Other Schemes & Programmes Total 319 2,600 1,237 912 90 293 5,451 5,132 2,532
8.7

Current Year
2014 / 15 2015 / 16 2016 / 17 2017 / 18 2018 / 19
£000 £000 £000 £000 £000 £000 £000 £000 £000
Children, Education & Families Capital Programme - February 2015
Project/ Programme Name
Previous Years Actual
Expenditure
Firm Programme Provisional Programme
Total Scheme
Cost
Capital Investment
Total (excluding
previous years)
Future Capital
Investment Total
(excluding
previous and
current years)
Retentions & Oxford City Schools Reorganisation
Retentions & OSCR 609 290 65 0 0 964 964 355
Retentions & OSCR Total 609 290 65 0 0 964 964 355
Schools Capital
Devolved Formula Capital 2,500 2,200 1,383 1,278 0 7,361 7,361 4,861
School Local Capital Programme Total 2,500 2,200 1,383 1,278 0 7,361 7,361 4,861
CE&F CAPITAL PROGRAMME EXPENDITURE TOTAL 26,312 39,601 45,620 40,336 33,965 11,628 197,462 171,150 131,549
CE&F OCC ADJUSTED CAPITAL PROGRAMME EXPENDITURE
TOTAL26,312 37,101 43,420 38,953 32,687 11,628 190,101 163,789 126,688
Programme reductions to be identified 0 0 0 0 -5,814 -5,814 -5,814 -5,814
CE&F OCC REDUCED CAPITAL PROGRAMME EXPENDITURE
TOTAL26,312 37,101 43,420 38,953 32,687 5,814 184,287 157,975 120,874
8.8

Project/ Programme NameCurrent
Year
2014 / 15 2015 / 16 2016 / 17 2017 / 18 2018 / 19
£'000s £'000s £'000s £'000s £'000s £'000s £'000s £'000s £'000s
Public Health Directorate
PHE Grant programme 0 183 0 0 0 0 183 183 0
PUBLIC HEALTH PROGRAMME TOTAL 0 183 0 0 0 0 183 183 0
COMMUNITY SAFETY PROGRAMME
Fire & Rescue ServiceFire Equipment (SC112) 236 264 0 0 0 0 500 264 0
Joint Control room (SC111) 110 275 0 0 0 0 385 275 0
Relocation of Rewley Training Facility 0 0 100 500 0 0 600 600 600
Fire Review Development Budget 0 50 150 2,187 1,113 0 3,500 3,500 3,450
COMMUNITY SAFETY PROGRAMME
TOTAL346 589 250 2,687 1,113 0 4,985 4,639 4,050
SOCIAL CARE FOR ADULTS PROGRAMME
Mental Health
Mental Health Projects 485 46 0 0 0 0 531 46 0
Adult Social Care
Adult Social Care Programme 0 0 500 500 1,000 2,250 4,250 4,250 4,250
Residential
HOPs Phase 1- New Builds 0 0 0 0 0 10,503 10,503 10,503 10,503
Oxfordshire Care Partnership 0 0 0 8,900 0 0 8,900 8,900 8,900
Social & Community Services Capital Programme - February 2015
Previous
Years Actual
Expenditure
Firm ProgrammeProvisional
ProgrammeTotal
Scheme
Cost
Capital
Investment Total
(excluding
previous years)
Future Capital
Investment Total
(excluding current
year)
8.9

Project/ Programme NameCurrent
Year
2014 / 15 2015 / 16 2016 / 17 2017 / 18 2018 / 19
£'000s £'000s £'000s £'000s £'000s £'000s £'000s £'000s £'000s
Social & Community Services Capital Programme - February 2015
Previous
Years Actual
Expenditure
Firm ProgrammeProvisional
ProgrammeTotal
Scheme
Cost
Capital
Investment Total
(excluding
previous years)
Future Capital
Investment Total
(excluding current
year)
Specialist Housing Programme (inc ECH -
New Schemes & Adaptations to Existing
Properties)ECH - New Schemes & Adaptations to
Existing Properties
501 1,116 2,100 3,100 318 0 7,135 6,634 5,518
Deferred Interest Loans (CSDP) 259 160 160 160 160 157 1,056 797 637
SOCIAL CARE FOR ADULTS PROGRAMME
TOTAL1,245 1,322 2,760 12,660 1,478 12,910 32,375 31,130 29,808
STRATEGY AND TRANSFORMATION PROGRAMME
New Adult Social Care Management System
(SC107)
92 800 294 0 0 0 1,186 1,094 294
STRATEGY& TRANSFORMATION
PROGRAMME TOTAL92 800 294 0 0 0 1,186 1,094 294
Retentions & Minor Works 172 0 0 0 0 172 172 0
S&CS CAPITAL PROGRAMME
EXPENDITURE TOTAL1,683 3,066 3,304 15,347 2,591 12,910 38,901 37,218 34,152
8.10
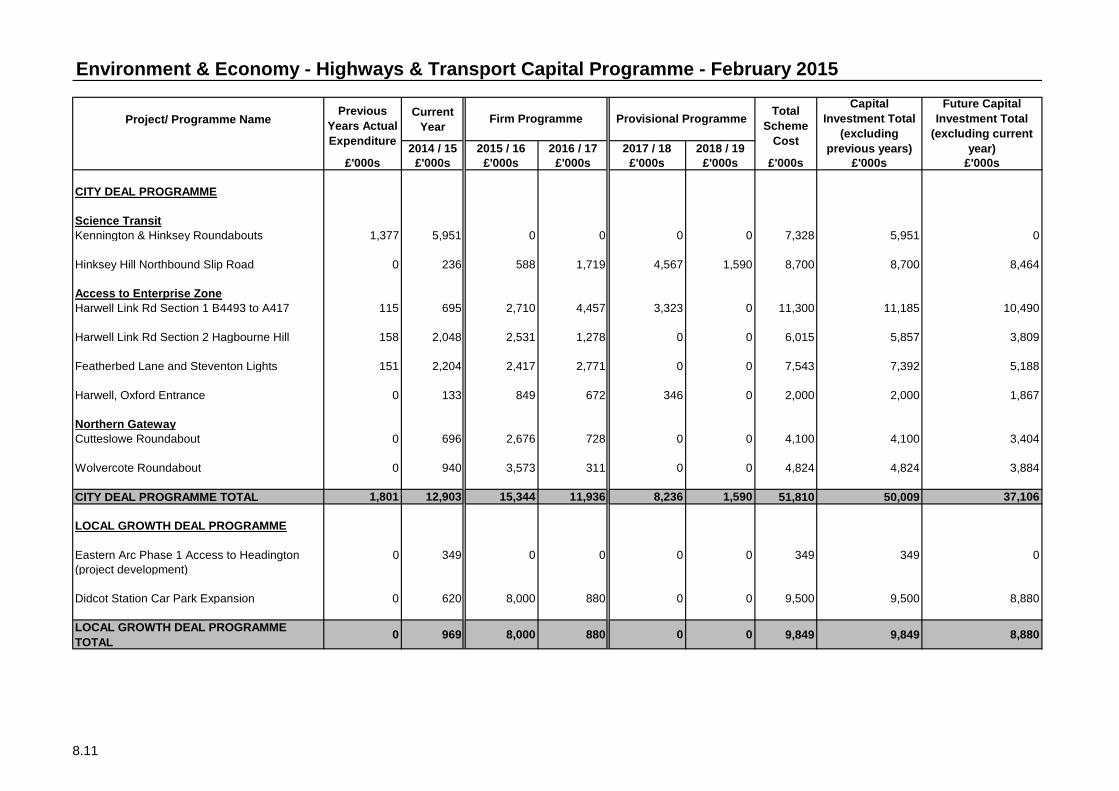
Project/ Programme NameCurrent
Year
2014 / 15 2015 / 16 2016 / 17 2017 / 18 2018 / 19
£'000s £'000s £'000s £'000s £'000s £'000s £'000s £'000s £'000s
CITY DEAL PROGRAMME
Science Transit
Kennington & Hinksey Roundabouts 1,377 5,951 0 0 0 0 7,328 5,951 0
Hinksey Hill Northbound Slip Road 0 236 588 1,719 4,567 1,590 8,700 8,700 8,464
Access to Enterprise Zone
Harwell Link Rd Section 1 B4493 to A417 115 695 2,710 4,457 3,323 0 11,300 11,185 10,490
Harwell Link Rd Section 2 Hagbourne Hill 158 2,048 2,531 1,278 0 0 6,015 5,857 3,809
Featherbed Lane and Steventon Lights 151 2,204 2,417 2,771 0 0 7,543 7,392 5,188
Harwell, Oxford Entrance 0 133 849 672 346 0 2,000 2,000 1,867
Northern Gateway
Cutteslowe Roundabout 0 696 2,676 728 0 0 4,100 4,100 3,404
Wolvercote Roundabout 0 940 3,573 311 0 0 4,824 4,824 3,884
CITY DEAL PROGRAMME TOTAL 1,801 12,903 15,344 11,936 8,236 1,590 51,810 50,009 37,106
LOCAL GROWTH DEAL PROGRAMME
Eastern Arc Phase 1 Access to Headington
(project development)
0 349 0 0 0 0 349 349 0
Didcot Station Car Park Expansion 0 620 8,000 880 0 0 9,500 9,500 8,880
LOCAL GROWTH DEAL PROGRAMME
TOTAL0 969 8,000 880 0 0 9,849 9,849 8,880
Environment & Economy - Highways & Transport Capital Programme - February 2015
Previous
Years Actual
Expenditure
Firm Programme Provisional ProgrammeTotal
Scheme
Cost
Capital
Investment Total
(excluding
previous years)
Future Capital
Investment Total
(excluding current
year)
8.11

Project/ Programme NameCurrent
Year
2014 / 15 2015 / 16 2016 / 17 2017 / 18 2018 / 19
£'000s £'000s £'000s £'000s £'000s £'000s £'000s £'000s £'000s
Environment & Economy - Highways & Transport Capital Programme - February 2015
Previous
Years Actual
Expenditure
Firm Programme Provisional ProgrammeTotal
Scheme
Cost
Capital
Investment Total
(excluding
previous years)
Future Capital
Investment Total
(excluding current
year)
SCIENCE VALE UK
Milton Interchange 684 3,300 5,475 1,166 0 0 10,625 9,941 6,641
A34 Chilton Junction Improvements 170 972 5,873 1,649 2,219 0 10,883 10,713 9,741
Enterprise Zone Sustainable Transport Project -
Cycleway improvements - Harwell Oxford to
Didcot via Winnaway (GPF)
18 45 425 0 0 0 488 470 425
Didcot Parkway Station Forecourt 6,994 1,061 0 0 0 0 8,055 1,061 0
Didcot Parkway Brompton Docks 0 45 0 0 0 0 45 45 0
Didcot Northern Perimeter Road 3 (project
development)
0 150 350 0 0 0 500 500 350
SCIENCE VALE UK LOCALITY
PROGRAMME TOTAL7,866 5,573 12,123 2,815 2,219 0 30,596 22,730 17,157
OXFORD
Frideswide Square 589 1,575 3,143 535 0 0 5,842 5,253 3,678
The Plain Cycle Improvements 119 976 222 29 0 0 1,346 1,227 251
Woodstock Rd, ROQ 48 10 10 462 50 0 580 532 522
London Road Bus Lane (LSTF) 193 902 85 0 0 0 1,180 987 85
8.12

Project/ Programme NameCurrent
Year
2014 / 15 2015 / 16 2016 / 17 2017 / 18 2018 / 19
£'000s £'000s £'000s £'000s £'000s £'000s £'000s £'000s £'000s
Environment & Economy - Highways & Transport Capital Programme - February 2015
Previous
Years Actual
Expenditure
Firm Programme Provisional ProgrammeTotal
Scheme
Cost
Capital
Investment Total
(excluding
previous years)
Future Capital
Investment Total
(excluding current
year)
Green Road-Warneford Lane Cycle Route
(LSTF)
9 119 0 0 0 0 128 119 0
Oxford Station to City Centre Improvements
(project development)
0 60 0 0 0 0 60 60 0
OXFORD LOCALITY PROGRAMME TOTAL 958 3,642 3,460 1,026 50 0 9,136 8,178 4,536
BICESTER
Bicester Park and Ride 244 750 2,426 380 0 0 3,800 3,556 2,806
Bicester Perimeter Road (Project Development) 0 0 300 700 0 0 1,000 1,000 1,000
BICESTER LOCALITY PROGRAMME TOTAL 244 750 2,726 1,080 0 0 4,800 4,556 3,806
WITNEY AND CARTERTON
Witney, Ducklington Lane/Station Lane
Junction
382 2,037 0 75 0 0 2,494 2,112 75
Witney, A40 Downs Road junction (project
development)
0 0 1,250 0 0 0 1,250 1,250 1,250
WITNEY AND CARTERTON LOCALITY
PROGRAMME TOTAL382 2,037 1,250 75 0 0 3,744 3,362 1,325
COUNTYWIDE AND OTHER
Bicester Town Station (EWR) 0 10 110 0 0 0 120 120 110
Oxford Parkway Station (EWR) 0 10 37 0 0 0 47 47 37
East-West Rail (contribution) 0 587 737 737 737 737 3,535 3,535 2,948
8.13

Project/ Programme NameCurrent
Year
2014 / 15 2015 / 16 2016 / 17 2017 / 18 2018 / 19
£'000s £'000s £'000s £'000s £'000s £'000s £'000s £'000s £'000s
Environment & Economy - Highways & Transport Capital Programme - February 2015
Previous
Years Actual
Expenditure
Firm Programme Provisional ProgrammeTotal
Scheme
Cost
Capital
Investment Total
(excluding
previous years)
Future Capital
Investment Total
(excluding current
year)
Small developer funded schemes 427 582 299 36 0 0 1,344 917 335
Completed schemes 175 0 132 0 0 307 307 132
COUNTYWIDE AND OTHER INTEGRATED
TRANSPORT TOTAL427 1,364 1,183 905 737 737 5,353 4,926 3,562
INTEGRATED TRANSPORT STRATEGY
TOTAL11,678 27,238 44,086 18,717 11,242 2,327 115,288 103,610 76,372
STRUCTURAL MAINTENANCE PROGRAMME
Carriageway Schemes (non-principal roads) 0 4,358 3,676 3,129 3,280 3,280 17,723 17,723 13,365
Footway Schemes 0 1,393 995 1,068 1,353 1,354 6,163 6,163 4,770
Surface Treatments 0 5,291 6,179 3,871 4,988 4,946 25,275 25,275 19,984
Street Lighting Column Replacement & Traffic
Signals
0 500 575 490 490 490 2,545 2,545 2,045
Drainage 0 950 1,120 930 922 928 4,850 4,850 3,900
Bridges 0 1,268 1,813 1,681 1,611 1,615 7,988 7,988 6,720
Public Rights of Way Foot Bridges 6 205 89 100 100 100 600 594 389
Additional Maintenance Works 2,152 1,399 0 0 0 0 3,551 1,399 0
STRUCTURAL MAINTENANCE ANNUAL
PROGRAMMES TOTAL2,158 15,364 14,447 11,269 12,744 12,713 68,695 66,537 51,173
Detrunked, Principal Roads and Other Major
Schemes
A420 Cumnor embankment works 0 83 244 40 0 0 367 367 284
8.14

Project/ Programme NameCurrent
Year
2014 / 15 2015 / 16 2016 / 17 2017 / 18 2018 / 19
£'000s £'000s £'000s £'000s £'000s £'000s £'000s £'000s £'000s
Environment & Economy - Highways & Transport Capital Programme - February 2015
Previous
Years Actual
Expenditure
Firm Programme Provisional ProgrammeTotal
Scheme
Cost
Capital
Investment Total
(excluding
previous years)
Future Capital
Investment Total
(excluding current
year)
Network Rail Electrification Bridge Betterment
Programme
0 20 2,090 156 0 0 2,266 2,266 2,246
M40 Junction 9 A41 Drainage works 0 50 0 0 0 0 50 50 0
Thames Towpath Reconstruction 284 5 306 0 0 0 595 311 306
A4130 Bix dual carriageway 531 4,188 0 0 0 0 4,719 4,188 0
A420 Shrivenham Bypass 199 2,929 0 0 0 0 3,128 2,929 0
A420/A34 Slip Road 0 0 471 679 0 0 1,150 1,150 1,150
Completed Major Schemes 60 0 0 0 0 60 60 0
STRUCTURAL MAINTENANCE MAJOR
SCHEMES TOTAL1,014 7,335 3,111 875 0 0 12,335 11,321 3,986
STRUCTURAL MAINTENANCE
PROGRAMME TOTAL3,172 22,699 17,558 12,144 12,744 12,713 81,030 77,858 55,159
HIGHWAYS & TRANSPORT CAPITAL
PROGRAMME EXPENDITURE TOTAL14,850 49,937 61,644 30,861 23,986 15,040 196,318 181,468 131,531
8.15

Current
Year
2014 / 15 2015 / 16 2016 / 17 2017 / 18 2018 / 19
£'000s £'000s £'000s £'000s £'000s £'000s £'000s £'000s £'000s
ASSET STRATEGY IMPLEMENTATION PROGRAMMES
Asset Strategy Implementation Programme 95 110 1,899 2,000 1,841 0 5,945 5,850 5,740
Relocation of CSC from Clarendon House to
County Hall
411 687 0 0 0 0 1,098 687 0
Abbey House 31 1,685 0 0 0 0 1,716 1,685 0
Cambridge Terrace moves to Ron Groves
House
0 450 101 0 0 0 551 551 101
Cricket Road Centre Closure (including Unipart
House works)
124 77 0 0 0 0 201 77 0
ASSET STRATEGY IMPLEMENTATION
PROGRAMME TOTAL661 3,009 2,000 2,000 1,841 0 9,511 8,850 5,841
ENERGY EFFICIENCY IMPROVEMENT PROGRAMME
SALIX Energy Programme 1,192 140 220 220 220 102 2,094 902 762
Energy Strategy Implementation (Non-Schools) 139 184 0 0 0 0 323 184 0
ENERGY EFFICIENCY IMPROVEMENT
PROGRAMME TOTAL1,331 324 220 220 220 102 2,417 1,086 762
Environment & Economy (Excluding Transport) Capital Programme - February 2015
Project/ Programme Name
Previous Years
Actual
Expenditure
Firm Programme Provisional Programme
Total
Scheme
Cost
Capital
Investment Total
(excluding
previous years)
Future Capital
Investment Total
(excluding current
year)
8.16

Current
Year
2014 / 15 2015 / 16 2016 / 17 2017 / 18 2018 / 19
£'000s £'000s £'000s £'000s £'000s £'000s £'000s £'000s £'000s
Environment & Economy (Excluding Transport) Capital Programme - February 2015
Project/ Programme Name
Previous Years
Actual
Expenditure
Firm Programme Provisional Programme
Total
Scheme
Cost
Capital
Investment Total
(excluding
previous years)
Future Capital
Investment Total
(excluding current
year)
ANNUAL PROPERTY PROGRAMMES
Minor Works Programme 654 250 200 200 200 200 1,704 1,050 800
Health & Safety (Non-Schools) 63 27 24 24 24 50 212 149 122
ANNUAL PROPERTY PROGRAMMES TOTAL 717 277 224 224 224 250 1,916 1,199 922
WASTE MANAGEMENT PROGRAMME
Waste Recycling Centre Infrastructure
Development
0 0 2,799 0 0 0 2,799 2,799 2,799
Alkerton WRC 0 150 1,425 175 0 0 1,750 1,750 1,600
Oxford Waste Partnership PRG Allocation 530 40 0 0 0 0 570 40 0
WASTE MANAGEMENT PROGRAMME
TOTAL530 190 4,224 175 0 0 5,119 4,589 4,399
8.17

Current
Year
2014 / 15 2015 / 16 2016 / 17 2017 / 18 2018 / 19
£'000s £'000s £'000s £'000s £'000s £'000s £'000s £'000s £'000s
Environment & Economy (Excluding Transport) Capital Programme - February 2015
Project/ Programme Name
Previous Years
Actual
Expenditure
Firm Programme Provisional Programme
Total
Scheme
Cost
Capital
Investment Total
(excluding
previous years)
Future Capital
Investment Total
(excluding current
year)
CORPORATE PROPERTY & PARTNERSHIP PROGRAMMES
Broadband (OxOnline) Project 392 6,624 6,844 0 0 0 13,860 13,468 6,844
Spendlove Centre, Charlbury 0 30 160 158 0 0 348 348 318
Wigod Way, Wallingford 0 189 0 0 0 0 189 189 0
Oxford Flood Relief Scheme 0 0 0 0 0 5,000 5,000 5,000 5,000
CORPORATE PROPERTY & PARTNERSHIP
PROGRAMMES TOTAL392 6,843 7,004 158 0 5,000 19,397 19,005 12,162
Retentions (completed schemes) 23 0 0 0 0 23 23 0
ENVIRONMENT & ECONOMY (EXCLUDING
TRANSPORT) CAPITAL PROGRAMME
EXPENDITURE TOTAL
3,631 10,666 13,672 2,777 2,285 5,352 38,383 34,752 24,086
8.18

Current
Year
2014 / 15 2015 / 16 2016 / 17 2017 / 18 2018 / 19
£'000s £'000s £'000s £'000s £'000s £'000s £'000s £'000s £'000s
COMMUNITY SERVICES PROGRAMME
Libraries
Bicester Library (CS13) 0 500 910 90 0 0 1,500 1,500 1,000
Headington Library (CS12) 75 190 0 0 0 0 265 190 0
Westgate Library 0 0 0 250 1,000 250 1,500 1,500 1,500
Museums
Oxfordshire Museum 0 25 250 25 0 0 300 300 275
COMMUNITY SERVICES PROGRAMME
TOTAL75 715 1,160 365 1,000 250 3,565 3,490 2,775
Partnerships
Super Connected Cities Bid 0 150 0 0 0 0 150 150 0
City Deal
Culham Advanced Manufacturing Hub 0 0 2,000 0 0 0 2,000 2,000 2,000
PARTNERSHIPS PROGRAMME TOTAL 0 150 2,000 0 0 0 2,150 2,150 2,000
Completed Projects 9 0 0 0 0 9 9 0
CHIEF EXECUTIVE'S OFFICE CAPITAL
PROGRAMME EXPENDITURE TOTAL75 874 3,160 365 1,000 250 5,724 5,649 4,775
Chief Executive's Office Capital Programme - February 2015
Project/ Programme Name
Previous
Years Actual
Expenditure
Firm ProgrammeProvisional
ProgrammeTotal
Scheme
Cost
Capital
Investment Total
(excluding
previous years)
Future Capital
Investment Total
(excluding current
year)
8.19

Appendix A Grant bids and allocations not yet included in the Capital Programme
Ref. Scheme/ Programme Area/ Status Description Amount Year
Grant Name £000
Children, Education & Families
(1) Free School Meals Programme 2 Universal infant free school meals - capital bidding round, 4 school
bids successful
TBC 2015/16
Sub-Total Children, Education & Families 0
Social & Community Services
(2) Better Care Fund 2 Ringfenced allocation 1,276
Sub-Total Social & Community Services 1,276
Environmental & Economy
(3) Local Transport Board 2 Funding allocation to the following schemes: - Wantage Eastern Link Road 4,500
- Bicester London Road level crossing 2,300
(4) Local Growth Fund 1 2 Funding allocation towards: 9,200 2015/16
44,200 2016/17 to
2021
35,000 Provisional
Capital Programme: 2015/16 to 2018/19 Appendix A
2015/16 &
2016/17
- Headington Phase 1 and Eastern Arc Transport Improvements
- Science Vale Cycle Network Improvements
- Oxford Science Transit Phase 2 (A40)
8.20

Ref. Scheme/ Programme Area/ Status Description Amount Year
Grant Name £000
(5) Local Growth Fund 2 2 Funding allocation towards a package to improve transport in North
Oxford and enable the Northern Gateway Development:
9,900 2016/17 to
2021
- Transport and site improvements to support the Oxpens
development
- Establishing the Activate Care Suite to improve adult social care and
healthcare in Oxfordshire.
- Improvements to the A34, including the Lodge Hill Junction
Sub-Total Environmental & Economy 105,100
Chief Executive's Office
Subtotal Chief Executive's Office 0
Total 106,376
Key:
1 Grant bids or allocations waiting approval or confirmation from funding authorities
2 Secured new resources waiting programme of work approval
3 Funding to be allocated against viable projects
8.21

Appendix B Schemes Remaining On Hold
Ref Directorate Project/ Programme NameTotal project
cost
Project
Specific
Funding
Available
Flexible
Funding
Required
Priority Category
£000 £000 £000
1 S&CS Banbury Regeneration Scheme 5,785 110 5,675 5
2 S&CS Thame Fire Station - relocation to new site 2,300 0 2,300 6
3 E&E - Transport Bicester Market square (developer contribution funded scheme) 1,116 1,116 0 5
TOTAL 8,085 110 7,975
Priority Categories:
Priority 1 Statutory Requirements & Infrastructure Deficit
Priority 2 Revenue Savings & Service Transformation
Priority 3 Substantially Externally Funded
Priority 4 Portfolio Rationalisation
Priority 5 Economic development & housing growth
Priority 6 Cross-cutting, joint working, income generation
Capital Programme: 2015/16 to 2018/19 Appendix B
These schemes have been placed on hold under the Capital Budget Setting Process for 2012/13.
However, they will be considered for entry into the programme as part of the future Service and Resource Planning rounds and if further funding becomes
available.
8.22

Appendix C Highways & Transport Forward Plan
Scheme Name DescriptionEstimated Year
of Construction
Estimated
Total Project
Cost
£000
Funding Status and Source if Known
SCIENCE VALE
Access to Enterprise Zone - A417
Corridor Improvements (Wantage
to Blewbury) & relief to Rowstock
To improve east-west travel and ensure safe access
to/from the villages.
2016/17 -
2019/20
4,000 LGF, CIL/Developer Contributions, plus
other funding opportunities if available
Wantage Eastern Link Road A new road linking the A338 and A417, providing a
strategic route across the town & access to Crab Hill
strategic housing development site.
2017/18 -
2022/23
15,000 LGF, CIL/Developer Contributions, on-
site strategic housing development
Science Bridge & A4130 widening New bridge over the railway line along the A4130 to
provide highway capacity and routing improvements
to the main route through Didcot.
2016/17 -
2019/20
39,000 LGF, CIL/Developer Contributions, on-
site strategic housing & commercial
developments, plus other funding
opportunities if available
Cycle Network Enhancements Improving cycle accessibility and connectivity across
the Science Vale area
2015/16 -
2019/20
9,000 LGF, CIL/Developer Contributions, on-
site strategic housing & commercial
developments, plus other funding
opportunities if available
Jubilee Way roundabout (Didcot)
Improvements
Enhancements to the junction to provide improved
access to Didcot town centre
2018/19 -
2020/21
6,500 LGF, CIL/Developer Contributions, plus
other funding opportunities if available
Didcot Station Enhancements -
Gateway to Science Vale
Enhanced Station accessibility and improved facilities
creating a transport hub and Gateway to Science
Vale. Enhancements to the station building, new
platforms and northern entrance.
2018/19 -
2023/24
53,000 LGF, CIL/Developer Contributions,
private sector, plus other funding
opportunities if available
Capital Programme: 2015/16 to 2018/19 Appendix D
These schemes have been identified as priorities for meeting local growth but funding has not yet been secured for delivery. When
funding has been identified approval will be sought through the capital governance approval process to bring them into the capital
programme. Costs and delivery timeframes are indicative.
8.23

Scheme Name DescriptionEstimated Year
of Construction
Estimated
Total Project
Cost
£000
Funding Status and Source if Known
Didcot town centre improved
accessibility
To update signage to reflect the new and improved
network changes, helping to ensure appropriate
routing of vehicles across the area.
Unknown at
present
Unknown at
present
LGF, CIL/Developer Contributions, plus
other funding opportunities if available
A338 Corridor Improvements
(including Frilford Lights)
Highway and junction improvements to accommodate
additional traffic heading to/from the Science Vale
area and Oxford.
2026 - 2031 5,000 LGF, CIL/Developer Contributions, plus
other funding opportunities if available
Didcot Northern Perimeter Road
Phase 3 (NPR3)
A new road to allow extension of the perimeter road
around Didcot and access for the Ladygrove East site.
2016/17 -
2020/21
12,500 LGF, CIL/Developer Contributions, on-
site strategic housing development, plus
other funding opportunities if available
A34 improvements - Lodge Hill
slips and Park & Ride
New south facing slips and Park & Ride site (1500
space P&R & new signalised junction)
2016/17 -
2020/21
26,000 LGF, CIL/Developer Contributions, plus
other funding opportunities if available
Access to Culham - New strategic
road linking Didcot, Culham
Science Centre and Oxford
New strategic road linking Didcot with Culham
Science Centre, and Oxford (incl. river crossing).
Phase 1: A415/B4015 Culham Science Centre Link
Road; Phase 2: new road across the Thames
between Didcot & Culham Science Centre.
2016/17 - 2026 45,000 LGF, CIL/Developer Contributions, on-
site commercial development, private
sector, plus other funding opportunities
if available
Implementation of Bus Strategy Bus links and accesses to connect strategic
development sites to employment and other key
destinations
Unknown at
present
Unknown at
present
LGF, CIL/Developer Contributions, on-
site strategic housing & commercial
developments, plus other funding
opportunities if available
Culham Station improvements Improving accessibility and level of rail service Unknown at
present
Unknown at
present
LGF, CIL/developer contributions,
private sector and other opportunities if
available
Grove/Wantage Station A new railway station / interchange at Grove 2020 + Unknown at
present
LGF, CIL/developer contributions,
private sector and other opportunities if
available
8.24

Scheme Name DescriptionEstimated Year
of Construction
Estimated
Total Project
Cost
£000
Funding Status and Source if Known
OXFORD
Oxford Station master plan Non-rail elements of station redevelopment 2018/19 + 75,000 Commercial development on site,
LGF/SEP, CIL and other funding
opportunities if available
Bus Rapid Transit Lines 1, 2 and
3
Infrastructure for Oxford BRT network 2015 - 25 104,000 LGF, CIL, private sector and other
opportunities if available
Super, premium and connector
cycle routes
Completing gaps in network/strategic links 2015 - 35 16,000 Cycle City Ambition Grant, LGF, CIL,
and other opportunities if available
Ring Road improvements
including A34
Capacity improvements, BRT/bus infrastructure,
pedestrian and cycle crossings
2015 - 25 111,000 City Deal, Highways Agency, LGF, CIL,
private sector and other opportunities if
available
City Centre schemes Transport and public realm improvements, including
new transport interchanges
2015 - 35 49,000 LGF, CIL, private sector and other
opportunities if available
City centre transit tunnels Transit tunnels for use by BRT and buses, serving the
city centre
2035 + 600,000 To be identified
Park & Ride expansion Construction of five new P&R sites and expansion of
Thornhill P&R. Lodge Hill P&R included in Science
Vale section (a new P&R in Eynsham may be
delivered as part of the A40 Public Transport
Enhancements item)
2018 - 2030 52,000 LGF, CIL, private sector and other
opportunities if available
Cowley Branch line Improvements to allow use by passenger trains.
Includes two new stations.
2020 - 2025 40,000 LGF, CIL, private sector and other
opportunities if available
Smart mobility infrastructure Infrastructure to support transport technologies,
including infrastructure for driverless vehicles
2015 - 2025 13,000 LGF, CIL, private sector and other
opportunities if available
Freight Freight infrastructure, including consolidation centre 2015 - 2025 5,000 LGF, CIL, private sector and other
opportunities if available
District centre improvements Transport and public realm improvements 2016 - 2030 10,000 LGF, CIL, private sector and other
opportunities if available
8.25

Scheme Name DescriptionEstimated Year
of Construction
Estimated
Total Project
Cost
£000
Funding Status and Source if Known
BICESTER
London Road level crossing
solution
A replacement scheme so that the level crossing can
be closed when rail services increase.
2024 + 27,000 LGF, CIL / developer contributions,
Garden Town bid
Charbridge Lane level crossing
replacement
A road bridge over the railway so that level crossing is
closed for East West Rail
2019 13,000+ EWR fund for single carriageway
bridge. LGF3 EoI for dualling gap
Eastern peripheral corridor
improvements (minus the
Charbridge Lane scheme)
Phase (i) - upgrading the junctions and links from
Launton Road to Gavray Drive (minus Charbridge
Lane)
2019 12,000 LGF3 EoI, CIL/developer funding,
Garden Town bid
Phase (ii) upgrading Skimmingdish Lane and A4095 /
A4221 junction
2024+ 7,000 LGF, CIL / developer contributions,
Garden Town bid
Southern peripheral corridor - a
new south-east perimeter road
A new link road from the A41 north of Junction 9
across to join the link road to the south of Graven Hill
2021? 21,000 LGF, CIL / developer contributions,
Garden Town bid
Motorway junction south of
Arncott
Scheme predicated on announcement of
Bicester/Arncott being designated as a Garden Town
with additional 3,000 houses.
2023 30,000 Garden Town bid
A41 bus measures A bus lane on the A41 between the ESSO roundabout
to Junction 9
pre-2021 10,000 LGF, CIL / developer contributions,
Garden Town bid
Bicester - Pedestrian/Cyclist
Connectivity
Cycle access between new employment
developments and housing developments
2017/18+ 4,400 LGF, CIL / developer contributions,
Garden Town bid
BANBURY
North-south corridor'
*Traffic calming along A361 the
South Bar Street/ Horsefair
corridor
*Promotion of Bankside
*Bridge Street/ Cherwell Street
improvements
*Bloxham Road (A361)/ South
Bar Street improvements
*Renew highway signage to
reflect change in routes (above)
Utilise Cherwell Street 'eastern corridor' as the
preferred north-south route through the town, with
Bankside improvements offering a secondary route.
The Oxford Road corridor is also integral. Reduce
traffic in the Air Quality Management area at South
Bar. Reviewing and replace highway signage on
routes into the town centre to sign north-south through-
traffic away from sensitive areas of the town centre
and promote appropriate route choices at key
decision making junctions, especially on Oxford Road
A4260.
2018 + 15,000 Some held S106 monies available to
progress this project Additional funding
will be required for the major works
likely to be needed.
8.26

Scheme Name DescriptionEstimated Year
of Construction
Estimated
Total Project
Cost
£000
Funding Status and Source if Known
Hennef Way (A422) to M40
Corridor Improvements
*Hennef Way/ Southam Road
junction
*Hennef Way/ Concord Avenue
junction
*Hennef Way/ Ermont Way
junction
Route capacity improvements to deal with existing
demands and those to be created by future
development
2017 …. Unknown at
present
Some held S106 monies may be
available to start on feasibility
Warwick Road B4100 Corridor Increasing the capacity of junctions along Warwick
Road (B4100), including the roundabout junctions with
A422 Ruscote Avenue and Orchard Way.
2017 …. Unknown at
present
Developer Contributions, plus other
funding opportunities will be required
East of M40 J11 link road - A422
to Overthorpe Road.
Provision of a link road east of M40 Junction 11
linking A422 to Overthorpe Road.
Post 2024 13,000 To be identified
Higham Way to Chalker Way link
road.
Provision of a link road from Higham Way to Chalker
Way through the former Grundons site to the Central
M40 site.
Unknown at
present
Unknown at
present
To be identified
Road bridge crossing from
Tramway Road to Higham Way.
Provision of a road bridge crossing the railway line
linking Tramway Road to Higham Way.
Post 2024 Unknown at
present
To be identified
Ermont Way/ Middleton Road
improvements.
Improve traffic flow at the junction. Unknown at
present
Unknown at
present
To be identified
Banbury Rail Station
Improvements
Re-designing the station forecourt to create an
interchange
Unknown at
present
Unknown at
present
To be identified
A361 Bloxham Road to A4260
Oxford Road spine road - south of
Saltway
Spine Road through the South of Saltway
development site linking A361 to A4260
Unknown at
present
Unknown at
present
To be identified
Car park guidance matrix sign
system
Integrated, real-time car park guidance system. Unknown at
present
Unknown at
present
To be identified
Bus Strategy (long term) Reviewing and developing the town’s bus network and
enhancing existing bus services/ providing additional
services,
Unknown at
present
Unknown at
present
To be identified
Bus Strategy (Short term)
*East-West cross town bus
routing including bus gates.
Enable east-West cross town bus routing including
opening bus gates.
2016 Unknown at
present
Developer funding/To be identified
8.27

Scheme Name DescriptionEstimated Year
of Construction
Estimated
Total Project
Cost
£000
Funding Status and Source if Known
Banbury Bus Station - review
function
Review function and location of Banbury bus station. Unknown at
present
Unknown at
present
To be identified
Improve walking, cycling and
public transport access to the rail
station.
Improve walking, cycling and public transport links to
the station in order to meet future demand and to
better connect the station to the town
Unknown at
present
Unknown at
present
To be identified
WITNEY & CARTERTON
West-facing slip roads at A40
Shores Green junction
Possible direct delivery by developer Unknown at
present
Unknown at
present
To be identified
Improvements to the B4022
Oxford Hill junction with Jubilee
Way and Cogges Hill Road
Possible direct delivery by developer Unknown at
present
Unknown at
present
To be identified
Re-designating the A4095
through Witney
Re-designating the A4095 via Jubilee Way, Oxford
Hill, A40, Ducklington Lane and Thorney Leys
Unknown at
present
Unknown at
present
To be identified
Witney town centre package Reducing congestion to improve the environment;
using directional signs to discourage undesirable
routeing.
Unknown at
present
Unknown at
present
To be identified
Improve the B4477 between
Carterton and A40 at Minster
Lovell including a cycle route
between Witney and Carterton.
Improvements to the transport network to support
residential growth, attract economic investment and
enable growth of RAF Brize Norton
2017-2020 3,900 Developer Contributions, plus other
funding opportunities
West facing slip roads at
A40/B4477 Minster Lovell
junction,
Improvements to the transport network to enable
growth of RAF Brize Norton
Unknown at
present
7,400 To be identified
Improve bus routing through
Witney
Improve bus routing through Witney particularly along
Corn Street, Market Place, Bridge Street and Newland
Unknown at
present
Unknown at
present
To be identified
Bus Priority eastbound at A40
Shores Green
Bus Priority for buses joining the A40 eastbound at
B4044 Shores Green
Unknown at
present
Unknown at
present
To be identified
Witney Cycle Strategy Improving pedestrian and cyclist routes in Bridge
Street, the town centre and Station Lane areas of
Witney
Unknown at
present
Unknown at
present
To be identified
8.28

Scheme Name DescriptionEstimated Year
of Construction
Estimated
Total Project
Cost
£000
Funding Status and Source if Known
Ducklington Lane / Station Lane
junction - footway improvements
Following CPO for land to complete footway
improvements.
Unknown at
present
Unknown at
present
To be identified
Install bus stops close to the RAF
Brize Norton Main Gate,
Carterton.
Install bus stops close to the RAF Brize Norton Main
Gate to increase access to the site.
Unknown at
present
Unknown at
present
To be identified
Carterton town centre crossroads
enhancement
Reduce queuing traffic and improve the environment
in Carterton town centre.
Unknown at
present
Unknown at
present
To be identified
Hanborough Rail Station Highway improvements and car park expansion
predicated on planned housing development.
Unknown at
present
Unknown at
present
Highways work may be funded by OCC
but car park expansion works are likely
to be funded by 3rd party.
A40 public transport priority
scheme
Public transport enhancements to facilitate trips along
the A40 corridor (may include delivery of a new P&R
in Eynsham)
2017/18 40,000 Local Growth Fund £35m plus OCC
match funding
COUNTYWIDE
Cycle Network Enhancements Schemes include: Culham - Oxford, Eynsham -
Oxford, Adderbury - Banbury
Unknown at
present
Unknown at
present
To be identified
8.29

Glossary of Terms
Where additional resources are added to or deducted from the budget for a specific purpose e.g. a new duty
or savings, and are agreed by the Council at the budget setting meeting.
Balances
The cash which the authority uses in the normal course of its business to aid cash management and meet
contingencies not otherwise, provided for. In certain circumstances it may be used to reduce the authority’s
council tax requirement.
Base Budget
The budget from the previous year is taken forward to create the initial budget for the next year before inflation
and other adjustments are added.
Budget Changes
A tax on domestic property set by local authorities and based on the value of the property within eight bands, A
to H. The Council Tax value of each band is expressed as a proportion of band D (e.g. Band A = 6/9, Band H
= 18/9).
Business Rates/National Non-Domestic Rates (NNDR)
Rates are payable by the non-domestic sector, i.e. property not used for residential purposes, including shops,
offices and schools. The level of business rates is set by the Government. Business rates are collected by
District Councils and a proportion is paid over to Central Government, with the remainder retained locally and
shared between the District Councils and the County Council.
Business Rates Top-Up
A grant from Central Government to ‘top-up’ the Council’s local share of business rates to the level of
assessed need, as measured by formulae determined by the Government.
Capital Expenditure
Expenditure on assets with a lasting value including land, buildings, roads and vehicles.
Capital Financing
The cost of borrowing to fund the Capital Programme, made up of principal repayments and interest (similar to
a mortgage).
Capital Programme
Provides details on the planned expenditure on capital schemes over a period of years, and the resources
available to fund those schemes. The Capital Programme is updated each quarter.
Council Tax
Council Tax Base
The number of properties from which it is estimated Council Tax will be collected, expressed as Band D
equivalent properties.
Council Tax/Collection Fund Surplus or Deficit
A surplus/deficit arising from either more or less Council Tax being collected than expected by District
Councils. This would be as a consequence of variations in collection rate or variations to the estimated
increase in the number of properties.
9.1

Glossary of Terms
Inflation
An efficiency saving means that the budget of the service is reduced but the same amount and quality of
service is provided. Savings can be made by lowering the level of service provided, changing the service
and/or providing a lower level of quality. Savings can also be achieved through income generation where a
higher level of income is received whilst containing expenditure.
Council Tax Precept
The levy made by the precepting authority (Oxfordshire County Council) on billing authorities (the district
councils in Oxfordshire) requiring the latter to collect income from council taxpayers on their behalf.
Council Tax Requirement
The amount of funding required to be raised from council tax to meet the expenditure plans of the authority
after taking into account all other funding.
Dedicated Schools Grant (DSG)
The grant is paid by Central Government as a ring-fenced specific grant and must only be used in support of
the schools budget.
Efficiencies and Savings
Local Government Finance Settlement (Provisional & Final)
Fixed Assets
Permanent assets with a lasting value, including land, buildings and roads.
FTE
FTE stands for full-time equivalent, and refers to the proportion of a full time employee (usually 37.0 hours per
week) where the post holder works part time.
Function Changes
An addition to or a removal of a service or function provided by the Council that is reflected in the general
funding of the Council or a reduction in general funding to reflect a change in responsibilities.
General Funding
Funding received in support of local authority expenditure. The main sources of general funding are Revenue
Support Grant, Business Rates Top-up and the local share of business rates.
Gross Expenditure
The cost of providing the service before the deduction of government grants or other income.
Changes to budgets reflecting increases in prices or pay awards.
The annual determination of local authority spending made by the Government and debated by Parliament. It
includes the amount of Government support for the spending and the distribution of support between local
authorities.
Medium Term Financial Plan (MTFP)
The financial plan for the County Council over the coming years.
9.2

Glossary of Terms
Recharges
Net Expenditure
The cost of providing a service after the deduction of specific government grants and other sources of income
but excluding the use of reserves and balances.
Non Negotiable Support Service Recharges
Reallocations of income and costs incurred by one service to other services in reflection of their contribution to
delivery or use of resources which are not controllable by Directorates.
Pooled Budget
A pooled budget is a discrete fund to pay for an agreed set of services. Contributions are made to the pool by
the Council and other partners such as the Oxfordshire Clinical Commissioning Group.
Prudential Guidelines
The Local Government Act 2003 gave new freedoms to Local Authorities to use additional borrowing for
funding capital programmes. As part of the new freedoms CIPFA produced a series of Prudential Guidelines
which Authorities have to comply with. These guidelines require Council’s to approve a series of Prudential
Indicators with the annual budget. The indicators are to demonstrate that the Council’s investment decisions
are both prudent and affordable.
Strategic Measures
The reallocation of income and costs incurred by one service to other services in reflection of their contribution
to delivery or use of resources.
Reserves
Funding set aside for an agreed purpose, such as the capital reserve.
Revenue Expenditure
Comprises the day to day costs associated with running the Council’s services and financing the Council’s
outstanding debt. The costs are financed from income. Gross expenditure, net expenditure and the net
budget are different ways of defining revenue expenditure.
Revenue Support Grant
The main government grant paid in support of local authority expenditure.
Specific Grants/Government Grants
Grants paid by the Government in respect of specific services or outcomes. Ringfenced grants may only be
used for the purpose specified by the grant body.
Spending Review
An announcement made by the Government of its future spending plans, normally every two years. Separate
figures are included for local authorities. The last Spending Review took place in June 2013 and covered the
period up to 2015/16.
This is a category of revenue expenditure made up of the cost of borrowing to fund the Capital Programme
(capital financing) and interest generated from the general balances and reserves held by the Council.
9.3

Glossary of Terms
These are budgets jointly funded by Heath and the Council under Section 75 of the National Health Service
Act 2006.
Subjective Analysis
The classification of expenditure and income according to the nature of the items, made up of the following
categories; employees, premises costs, transport, supplies and services, third party payments (including
contracted services), support services and income.
Virements
The transfer of budget from one service area to another. Virements are subject to approval in accordance
with the Virement Rules agreed annually by Council.
Section 75 Pooled Budgets
9.4