Serum Metabolomics Profiling to Identify Biomarkers for...
9
Research Article Serum Metabolomics Profiling to Identify Biomarkers for Unstable Angina Wei Yao, Yuxia Gao, and Zheng Wan Department of Cardiology, Tianjin Medical University General Hospital, Tianjin Medical University, No. 154, Anshan Road, Heping District, Tianjin 300052, China Correspondence should be addressed to Wei Yao; [email protected] Received 17 January 2017; Revised 12 April 2017; Accepted 2 May 2017; Published 24 May 2017 Academic Editor: Maria Dolores Pinazo-Duran Copyright © 2017 Wei Yao et al. is is an open access article distributed under the Creative Commons Attribution License, which permits unrestricted use, distribution, and reproduction in any medium, provided the original work is properly cited. Although statistical evidence is clear regarding the dangerousness of unstable angina (UA), a form of coronary heart disease (CHD) characterised by high mortality and morbidity globally, it is important to recognise that diagnostic precision for the condition is unfavourable. In the present research, to gain insight into candidate biomarkers, the author draws on 1 H NMR-based serum metabolic profiling to analyze the unstable angina pectoris (UAP) metabolic signatures; this constitutes an effective way to produce medical diagnosis. 101 unstable angina pectoris patients and 132 healthy controls were enrolled and 22 serum samples from each group were analyzed. Effective separation was noted regarding the UAP and control groups, and, for the former group considered in relation to their counterpart, the serum concentrations of Lac, m-I, lipid, VLDL, 3-HB, and LDL were higher whereas the concentrations of r, Cr, Cho, PC/GPC, Glu, Gln, Lys, HDL, Ile, Leu, and Val were lower. e conclusion drawn in view of the results is that the plasma metabolomics examined by 1 H NMR displayed promise for biomarker identification for UA. In addition to this, the analysis illuminated the metabolic processes of UA. 1. Introduction Unstable angina pectoris (UAP) is a frequently encoun- tered complication of coronary heart disease (CHD), and approximately one-third of the population in developed nations experiences the condition prior to turning 70 years old. It results in the hospitalisation of over one million patients each year, and it is a leading factor that contributes to patient deaths [1, 2]. A range of clinical presentations are associated with the condition, and they result from a blockage in the coronary flow. Such blockages can occur as a consequence of various pathophysiological mechanisms, pri- mary among which are intracoronary atheromatous plaque rupture, platelet aggregation, and thrombus formation [3]. At present, the diagnosis of UA takes place with reference to angina symptoms and electrocardiogram modifications [4]. Nevertheless, it is important to recognise the limitations of this approach, which mainly relate to the lack of objectivity regarding symptoms and the nature of the variations in ECG. Despite the fact that coronary angiography is characterised by diagnostic reliability and accuracy for UA, it can only be carried out invasively, thereby meaning that certain indi- viduals are not willing to undergo it. Crucial considerations when diagnosing UAP in clinical practice include patient symptoms, which manifest in the form of high cholesterol, triglyceride-rich lipoprotein particles (primarily VLDL and LDL), and lower levels of cholesterol in HDL particles [5]. However, it is important to note that higher levels are not common to every UA patient and, moreover, they can arise for patients who have different forms of CHD [6]. Research has demonstrated that the pathogenesis of numerous health conditions is linked to metabolite incon- sistencies in body tissues and fluids [7]. Metabolomics is useful because it facilitates the quantitative assessment of small molecule metabolites within an organism, and it is possible to employ the method for the purpose of evaluating the way in which the concentration of certain metabolites varies in relation to pathophysiological stimuli [8]. e process has been employed to diagnose CHD with H- nuclear magnetic resonance spectroscopy (NMR), and it facilitates the differential evaluation of the levels of numerous endogenous and exogenous molecules; for this reason, the Hindawi BioMed Research International Volume 2017, Article ID 7657306, 8 pages https://doi.org/10.1155/2017/7657306
Transcript of Serum Metabolomics Profiling to Identify Biomarkers for...

Research ArticleSerum Metabolomics Profiling to Identify Biomarkers forUnstable Angina
Wei Yao, Yuxia Gao, and ZhengWan
Department of Cardiology, Tianjin Medical University General Hospital, Tianjin Medical University, No. 154, Anshan Road,Heping District, Tianjin 300052, China
Correspondence should be addressed to Wei Yao; [email protected]
Received 17 January 2017; Revised 12 April 2017; Accepted 2 May 2017; Published 24 May 2017
Academic Editor: Maria Dolores Pinazo-Duran
Copyright © 2017 Wei Yao et al. This is an open access article distributed under the Creative Commons Attribution License, whichpermits unrestricted use, distribution, and reproduction in any medium, provided the original work is properly cited.
Although statistical evidence is clear regarding the dangerousness of unstable angina (UA), a form of coronary heart disease (CHD)characterised by high mortality and morbidity globally, it is important to recognise that diagnostic precision for the conditionis unfavourable. In the present research, to gain insight into candidate biomarkers, the author draws on 1H NMR-based serummetabolic profiling to analyze the unstable angina pectoris (UAP) metabolic signatures; this constitutes an effective way to producemedical diagnosis. 101 unstable angina pectoris patients and 132 healthy controls were enrolled and 22 serum samples from eachgroup were analyzed. Effective separation was noted regarding the UAP and control groups, and, for the former group consideredin relation to their counterpart, the serum concentrations of Lac, m-I, lipid, VLDL, 3-HB, and LDL were higher whereas theconcentrations of Thr, Cr, Cho, PC/GPC, Glu, Gln, Lys, HDL, Ile, Leu, and Val were lower. The conclusion drawn in view of theresults is that the plasma metabolomics examined by 1H NMR displayed promise for biomarker identification for UA. In additionto this, the analysis illuminated the metabolic processes of UA.
1. Introduction
Unstable angina pectoris (UAP) is a frequently encoun-tered complication of coronary heart disease (CHD), andapproximately one-third of the population in developednations experiences the condition prior to turning 70 yearsold. It results in the hospitalisation of over one millionpatients each year, and it is a leading factor that contributesto patient deaths [1, 2]. A range of clinical presentationsare associated with the condition, and they result from ablockage in the coronary flow. Such blockages can occur as aconsequence of various pathophysiological mechanisms, pri-mary among which are intracoronary atheromatous plaquerupture, platelet aggregation, and thrombus formation [3].At present, the diagnosis of UA takes place with reference toangina symptoms and electrocardiogram modifications [4].Nevertheless, it is important to recognise the limitations ofthis approach, which mainly relate to the lack of objectivityregarding symptoms and the nature of the variations in ECG.Despite the fact that coronary angiography is characterisedby diagnostic reliability and accuracy for UA, it can only
be carried out invasively, thereby meaning that certain indi-viduals are not willing to undergo it. Crucial considerationswhen diagnosing UAP in clinical practice include patientsymptoms, which manifest in the form of high cholesterol,triglyceride-rich lipoprotein particles (primarily VLDL andLDL), and lower levels of cholesterol in HDL particles [5].However, it is important to note that higher levels are notcommon to every UA patient and, moreover, they can arisefor patients who have different forms of CHD [6].
Research has demonstrated that the pathogenesis ofnumerous health conditions is linked to metabolite incon-sistencies in body tissues and fluids [7]. Metabolomics isuseful because it facilitates the quantitative assessment ofsmall molecule metabolites within an organism, and it ispossible to employ the method for the purpose of evaluatingthe way in which the concentration of certain metabolitesvaries in relation to pathophysiological stimuli [8]. Theprocess has been employed to diagnose CHD with H-nuclear magnetic resonance spectroscopy (NMR), and itfacilitates the differential evaluation of the levels of numerousendogenous and exogenous molecules; for this reason, the
HindawiBioMed Research InternationalVolume 2017, Article ID 7657306, 8 pageshttps://doi.org/10.1155/2017/7657306

2 BioMed Research International
literature reports that it significantly influences the examina-tion of physiological status, condition diagnosis, biomarkeridentification, and the detection of the pathways affectedby disease or treatment [9]. One of the key quantitativeand nondestructive techniques drawn on in clinical settingsis high-resolution NMR spectroscopy, which is viewed asadvantageous owing to its robustness and reliability, alongwith the fact that it can be reproduced and repeated [10, 11]. Inrecent years, this technique has yielded favourable results inbiomarker discovery for cardiovascular conditions, includingmyocardial ischemia [12], heart failure [13], and hypertension[14].
Owing to the way in which it can be obtained straight-forwardly from patients in all age groups, serum constitutesan ideal biological fluid for medical examinations. In thepresent research, 1H NMR is applied to serum samplesgathered from UAP patients and healthy participants whohave previously received diagnosis and confirmation bycoronary angiography.Metabolite profile variance is recordedin relation to the serum of each group in view of physiologicaland pathological differences, and it is important to recognisethat advanced characterisation and authentication using asignificant sample size could facilitate their establishment asclinically useful biomarkers.
2. Materials and Methods
2.1. Plasma Collection. A completely randomized design wasused in this research, and the sample size was calculatedaccording to the design.The research received approval fromthe Ethics Committee of the Tianjin Medical UniversityGeneral Hospital and TianjinMedical University, andwrittenconsent was gathered from every participant. From January2015 to June 2015, 101 individuals who received coronaryangiography for UA diagnosis and diagnosed as UAP atthe Department of Cardiology, Tianjin Medical UniversityGeneral Hospital were registered for this study.The inclusioncriteria were based on UA diagnosis and selective coronaryangiography. Angina symptoms were new in onset, gettingprogressively worse, or arising with minimal activity, unac-companied by ECG changes of ST elevation, and angiograph-ically documented organic stenosis 𝑍 > 75% in a minimumof one major coronary artery. The exclusion criteria include(1) participants had a history of myocardial infarction,coronary revascularisation, heart failure, liver/renal disease,inflammatory conditions, or metabolic disease; (2) partici-pants who were not willing to sign the written consent formwere removed; (3) the cases were removed where clinicalinformation was lacking or missing and therefore statisticalanalysis could not be performed. A 132-person control group,constituted of individuals in full health, was constructed bydrawing on voluntary support at the medical examinationcenter at TianjinMedical University General Hospital. Table 1overviews the demographic data pertaining to each of thesample groups.
Before 24 hours had elapsed after being admitted, eachpatient was set into an overnight fasting state and, thefollowing morning, a 5-mL sample of peripheral venous
blood was obtained. Centrifuging was employed at 3000 rpmfor a period of 10 minutes at 4∘C, and the serum was subjectto storage at 80∘C while awaiting analysis. Additionally,following the patients’ enrolment onto the study, informationwas gathered regarding demographic data, medical history,personal history, and signs, and data from four conventionaldiagnostic methods was logged. Notably, the collation ofpatient histories and the data from diagnostic methods wasinformed by pertinent specialists.
2.2. Sample Preparation and 1HNMR Spectroscopic Analysis ofSerum. The 1H NMR analysis of serum samples took placein the manner as already accounted for [15], and serumsamples storage at −80∘C took place before 3 hours hadelapsed following collection to maintain the samples forurinalysis. 22 samples from UAP group and 22 samples fromthe control group were randomly selected. Thawing of thesamples took place a single time in the context of a biosafetyfume hood, and preparation took place by combining 550 𝜇lof serum with 55 𝜇l of 1.5mol/l deuterated phosphate buffer(NaH2PO4 and K2HPO4, including 0.1% TSP (sodium 3-(trimethylsilyl)propionate-2,2,3,3-d4), pH 7.47). Where theserumwas not sufficient, D2Oup to 550𝜇l was added. In turn,the serum-buffer combination was set to rest for 5 minutesat room temperature, and this was followed by centrifugingat 10,000 rpm at 4∘C for a period of 10 minutes, the purposeof which was to remove floating debris. The next step was totransfer the supernatant (550 𝜇l) into a 5mmNMR tube, andTSP was used as a chemical shift reference (𝛿 0.0), and D2Oprovided a lock signal.
Every NMR spectra were subject to measurement at a1H frequency of 600.11MHz, and this was carried out byemploying a Bruker Avance AVIII 600 spectrometer at 298K(Bruker Biospin, Rheinstetten, Germany). A conventionalone-dimensional (1D) NMR spectrum was used to facilitatewater presaturation, and this served as a standard repre-sentation of the overall metabolite composition. To weakensignals from macromolecules by the CPMG (Carr-Purcell-Meiboom-Gill) pulse sequence, the researcher employedan interpulse delay of 3𝜇s, a mixing time of 100ms, andirradiation of the water resonance. A BPP-LED (bipolar-pairlongitudinal eddy) current pulse sequence was employed forthe purpose of detecting large macromolecule signals, anda two-dimensional 1H-1H COSY (correlation spectroscopy)and TOCSY (total correlation spectroscopy) were also per-formed for selected plasma samples to facilitate resonanceassignment.
Before Fourier transformation, an exponential windowfunction of 1.0Hz was employed to multiply free inductiondecay (FID), and these were subject to correction for phaseand baseline distortions. This was carried out by utilisingTopSpin 2.0 (Bruker). Chemical shifts were referenced tothe peak of the anomeric proton of 𝛼-glucose at 𝛿 5.23,and NMR spectra (𝛿 0.5–8.5) were subject to binning withregions 0.002 ppm wide; in turn, automatic integration tookplace by employing the AMIX package (v.3.8.3, BrukerBiospin, Germany). For the purpose of bypassing the impactsassociated with imperfect water suppression, the 𝛿 4.55–5.13
BioMed Research International 3
Table 1: Demographic and clinical characteristics of unstable angina patients and healthy controls.
Controls𝑛 = 132
UAP group𝑛 = 101
𝜒2/𝑡/𝑈 P
Male 72 (54.55%) 53 (52.48%) 0.099 0.753Age (years) 61.04 ± 7.38 63.18 ± 9.65 1.265 0.209Hypertension 71 (53.79%) 60 (59.40%) 0.734 0.392Diabetes 28 (21.21%) 30 (29.70%) 2.206 0.137Smoking 40 (30.30%) 48 (47.52%) 7.220 0.007∗
SBP (mmHg) 136.88 ± 19.62 133.98 ± 17.50 0.792 0.430DBP (mmHg) 83.10 ± 10.72 79.41 ± 8.53 1.927 0.057HR (BPM) 69.25 ± 10.95 70.06 ± 10.02 0.391 0.697BMI (Kg/m2) 26.12 ± 3.24 25.14 ± 2.99 0.202 0.117WC (cm) 97.90 ± 10.11 85.80 ± 8.61 1.119 0.266LV (mm) 47.22 ± 3.62 47.74 ± 4.82 0.610 0.543EF (%) 63.98 ± 3.80 62.42 ± 6.72 1.430 0.156TC (mmol/L) 4.41 ± 1.02 4.32 ± 1.02 0.451 0.653TG (mmol/L) 1.29 (0.84, 1.59) 1.51 (1.00, 1.84) 2.235 0.025HDL-C (mmol/L) 1.27 (0.97, 1.52) 1.06 (0.84, 1.27) 2.857 0.004∗
LDL-C (mmol/L) 2.54 ± 0.89 3.35 ± 0.89 2.026 0.038∗
GLU (mmol/L) 5.63 (5.00, 6.00) 6.37 (5.10, 6.60) 1.087 0.277CR (umol/L) 65.65 (56.00, 73.00) 68.98 (58.00, 76.00) 1.047 0.295UA (mmol/L) 301.63 ± 80.37 309.96 ± 84.25 0.513 0.609Data are presented as mean ± SD. SBP: systolic blood pressure; DBP: diastolic blood pressure; HR: heart rate; BMI: body mass index; WC: waist circumference;LV: left ventricular end diastolic diameter; EF: left ventricular ejection fraction; TC: total cholesterol; TG: triglycerides; HDL-C: high density lipoproteincholesterol; LDL-C: low density lipoprotein cholesterol; GLU: blood glucose; CR: creatinine; UA: uric acid. ∗ indicates statistically different between groups.
region was extracted, thereby meaning that the spectra overthe ranges 𝛿 0.5–4.55 and 𝛿 5.13–8.5 were chosen and limitedto 3663 regions, each being 0.002 ppm wide. Normalisationtook place for every internal region to the total of everyintegral region for each spectrum before pattern recognitionanalysis.
Principal component analysis (PCA) was initiallyemployed for detecting the CPMG spectra from each serumsample in order to derive an outline of data distribution andsimilarities between the samples, for instance, in terms ofclustering and outliers.This was facilitated by drawing on theSimca-P 11.0 software (Umetrics, Sweden). Following this,the partial least-squares discriminant analysis (PLS-DA)was utilised with unit variance scaling to facilitate a morein-depth analysis of the NMR spectral data. A tenfold cross-validation method was used to get Q2 and R2, as these twovalues represent predictive ability and the explained varianceof the model, respectively. In order to further confirm thevalidation of the PLS-DA model quality, permutation testsincluding a randomly permuting class membership andrunning 200 iterations were carried out. Then, the OPLS-DAwas used to maximize covariance between the measured dataand the response variable.
2.3. Statistical Analysis. The SAS software package (V 9.2,Cary, NC, USA) was employed to conduct statistical tests,and a ProcMixed analysis of variance-covariance was appliedto the data before conducting Tukey’s multiple comparisons
test. The information is presented in the form of the mean ±standard error of the means, and a P value lower than 0.05 isconsidered as statistically significant.
3. Results
Since serum, when considered in relation to any otherbiological fluid, is characterised by its high level of availabilityand metabolite richness following a series of biochemicalprocedures, it is a useful way inwhich to gain bio-informationregarding an organism’s metabolism. As noted, the presentstudy has examined 22 UA patients and 22 AS controls, andthe spectra of 1H NMR measurements for serum samplesfrom each group are displayed in Figure 1. Previously con-ducted research along with the in-house NMR database wasreferenced to facilitate resonance assignments [16, 17].
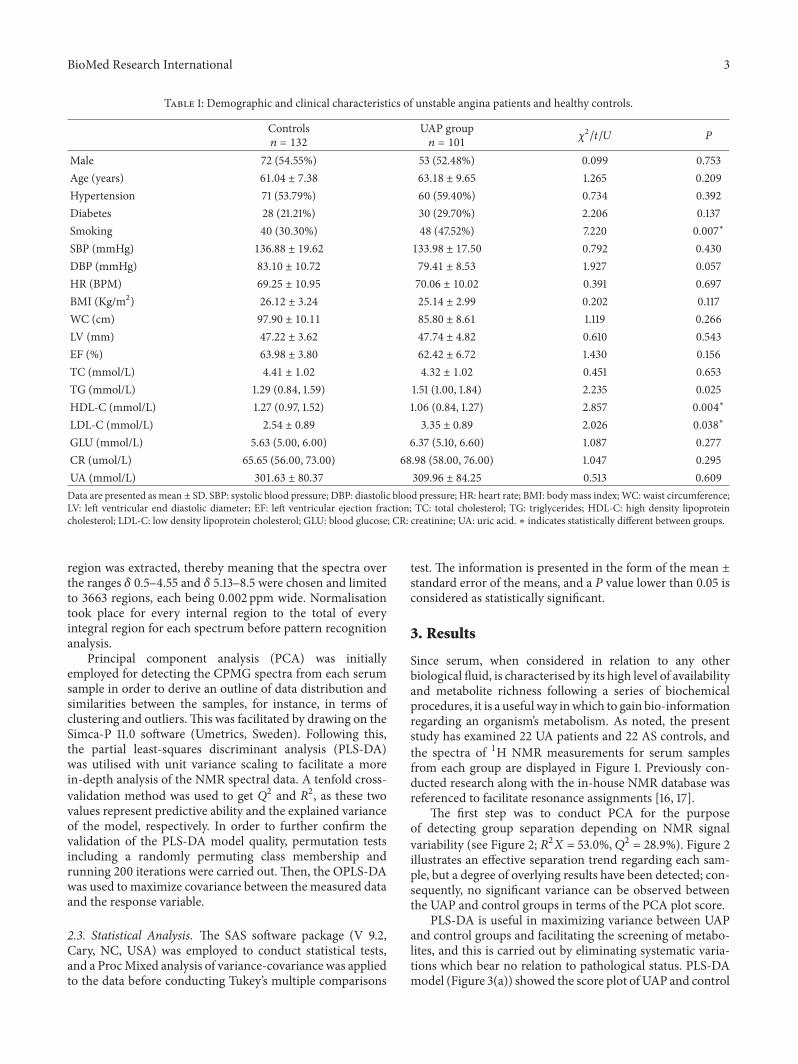
The first step was to conduct PCA for the purposeof detecting group separation depending on NMR signalvariability (see Figure 2; 𝑅2𝑋 = 53.0%, 𝑄2 = 28.9%). Figure 2illustrates an effective separation trend regarding each sam-ple, but a degree of overlying results have been detected; con-sequently, no significant variance can be observed betweenthe UAP and control groups in terms of the PCA plot score.
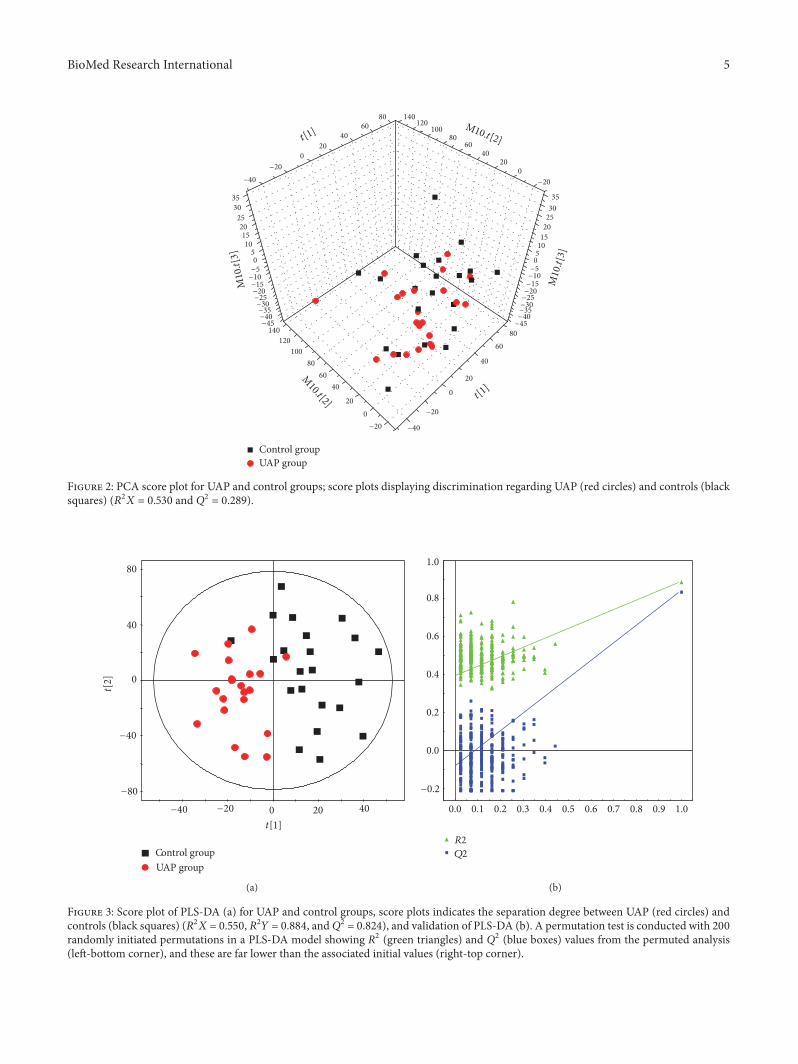
PLS-DA is useful in maximizing variance between UAPand control groups and facilitating the screening of metabo-lites, and this is carried out by eliminating systematic varia-tions which bear no relation to pathological status. PLS-DAmodel (Figure 3(a)) showed the score plot of UAP and control

4 BioMed Research International
UAP group
Control group
L9
-Glc PC/GPC
Lac
GlyMet
L6DMA
EACit
SucAct
Lac EthIBIle
Urea
HOD
�r
CrG
MolTMAO
MCr
L8Py
L7
GluNAG
AceL4 Val
LeuL2
L1HDL
6 4 3 2 1(ppm)
�훽-Glc
a-&�훽-Glc
5
Figure 1: Representative spectra of 1H NMR from UAP andcontrol groups. The different metabolites are as follows: 1-MH,1-methylhistidine; Ace, acetic acid; Act, acetone; Cit, citric acid;Cr, creatinine; DMA, dimethylamine; EA, ethanol amine; Eth,ethanol; For, formic acid; Glc, glucose; Glu, glutamic acid; Gly,glycine; G, glycerinum; GPC, glycerophosphoryl choline; HDL,high-density lipoprotein; HX, hypoxanthine; IB, isobutyrate; Ile,isoleucine; L1, LDL, CH3-(CH2)𝑛-; L2, VLDL, CH3-(CH2)𝑛-; L4,VLDL, CH3-(CH2)𝑛-; L5, VLDL, -CH2-CH2-C=O; L6, Lipid,-CH2-CH=CH-; L7, Lipid, -CH2-C=O; L8, Lipid, =CH-CH2-CH=;L9, Lipid, -CH=CH-; Lac, lactic acid; Leu, leucine; Lys, lysine; M,malonic acid;Met,methionine;Mol,methyl alcohol; NAG, n-acetyl-glycoprotein; PC, phosphocholine; Phe, phenylalanine; Py, pyruvicacid; Suc, succinic acid; Thr, threonine; TMAO, trimethylamine;Urea, Uric Acid; Val, valine.
groups were rendered clearly distinct with 𝑅2𝑋 = 0.550, 𝑅2𝑌= 0.884, and Q2 = 0.824. The parameters used to describethe PLS-DA model were considerably heightened, therebyindicating the robustness of the model. For the purpose ofvalidating the model’s performance, the author conducted a200-iteration permutation test. Figure 3(b) illustrates that thevalidation plot of the initial PLS-DAmodel is neither randomnor overfitting, and this can be seen with reference to the factthat the permutated Q2 and R2 values are far less than theassociated initial values.
For the purpose of eliminating the impact of individ-ual variance and, furthermore, to illuminate the modifiedmetabolites governing the separation regarding each group,the OPLS-DA model was formulated. The cross-validationparameters Q2Y were employed to generate a description ofthe model’s quality, and this also served to provide insightinto the degree to which the model was predictable; incombination with this, R2Y was used to represent the totalexplained variation. Regarding score plot of OPLS-DAmodel(𝑅2𝑌 = 0.894 and𝑄2𝑌 = 0.877), notable biochemical varianceregarding the respective sample groups was observed (seeFigure 4(a)), and the metabolic variations for UAP groupwere summarized in a color-coded coefficient plot (seeFigure 4(b)). Themetabolites displaying considerable change(𝑃 < 0.05) were detected on the basis of the absolute cut-offvalue regarding correlation coefficients. Furthermore, with𝑟 > 0.423, the serum samples of the UAP group displayed
upregulation of Lac, m-I, lipid, VLDL, 3-HB, TMAO, andLDL. Correspondingly, samples displayed downregulation ofThr, Cr, Cho, PC/GPC, Glu, Gln, Lys, TC, Ile, Leu, and Val.Table 2 presents a summary of the metabolic variation.
4. Discussion
It is important to recognise that patients with UA couldbe provided with pharmaceuticals to facilitate prevention.In order to identify the biomarkers linked to UA and,furthermore, to note the difference between these and thebiomarkers stemming frommedication, 101UApatients and a132-person control group comprised of healthy patients wereenrolled and 22 samples from UAP group and 22 samplesfrom control group were analyzed in this research. Thismethodological approach has also contributed to the devel-opment of insight regarding the degree to which biomarkersfor UA diagnosis are reliable.
Thepresent research has found that plasmametabolomicswith the 1H NMR metabolomics technique illuminated thenature of the metabolic differences regarding UAP and con-trol groups.The ensuing examination of the profiles of serumsamples from the UAP group had the capacity to differentiatebetween it and the latter group, and it facilitated the provisionof a metabolic fingerprint of the disease. In this way, thepromising nature of metabolomic spectrum in evaluatingthe disease has been emphasised. In addition, the methodwas employed for the purpose of evaluating the degree towhich it is accurate and reliable in UAP diagnosis, and ithas demonstrated a more effective performance regardingspecificity and sensitivity.
The experimental findings have allowed the author todetect the 18 central metabolites governing the differentiationbetween UAP and control groups. Regarding these metabo-lites, the levels of Lac, m-I, lipid, VLDL, 3-HB, TMAO, andLDL were upregulated in UAP group in comparison to thehealthy control group, while Thr, Creatine, Cho, PC/GPC,Glu, Gln, Lys, TC, Ile, Leu, and Val were downregulatedin relation to the controls. In view of this, it is possible toconclude that phospholipid and amino acid metabolism isdisrupted in regard to the UA patients. Park et al. showedincreased level of lipid metabolites were associated with ahigher risk of myocardial infarction [18]. As phospholipidsare a critical feature of every cell membrane, they have thepotential to formulate lipid bilayers. In addition to this,phospholipids play a role in varied cell processes, includingapoptosis, cell-cell interaction, cell proliferation, and celldifferentiation [19]. Recently conducted research also demon-strated that phospholipid metabolism performed a criticalfunction regarding the pathogenesis of metabolic syndromeand hepatic steatosis, and this subsequently resulted in theincremental progression of CVD [20]. Disturbed phospho-lipid metabolism played an important role in cardiovascularpathophysiology, and this included necrotic core formation,plaque erosion or rupture, and platelet aggregation [21].In view of this, it is justifiable to conclude that disturbedphospholipid metabolism is critical for the development ofUA.
BioMed Research International 5
Control groupUAP group
3530
2520151050−5−10−15−20−25−30−35−40−45
35
302520
151050
−5−10−15−20−25−30−35−40−45
−20
0
20
40
60
80
100
120
140
−20
020
4060
80100
120140
−40
−20
0
20
40
60
80
−40
−20
0
20
4060
80
t[1]
t[1]
M10.t[2]
M10.t[2]
M10
.t[3]
M10
.t[3]
Figure 2: PCA score plot for UAP and control groups; score plots displaying discrimination regarding UAP (red circles) and controls (blacksquares) (𝑅2𝑋 = 0.530 and Q2 = 0.289).
0
40
80
0 20 40
UAP groupControl group
−20−40
−40
−80
t[1]
t[2
]
(a)
0.0
0.2
0.4
0.6
0.8
1.0
0.0 0.1 0.2 0.3 0.4 0.5 0.6 0.7 0.8 0.9 1.0
−0.2
R2
Q2
(b)
Figure 3: Score plot of PLS-DA (a) for UAP and control groups, score plots indicates the separation degree between UAP (red circles) andcontrols (black squares) (𝑅2𝑋 = 0.550, 𝑅2𝑌 = 0.884, andQ2 = 0.824), and validation of PLS-DA (b). A permutation test is conducted with 200randomly initiated permutations in a PLS-DA model showing R2 (green triangles) and Q2 (blue boxes) values from the permuted analysis(left-bottom corner), and these are far lower than the associated initial values (right-top corner).

6 BioMed Research International
0
40
80
0 20 40
Control groupUAP group
−20−80
−40
−40
t[1]P
t[2
]O
(a)
400
200
0
1
0.8
0.6
0.4
0.2
0
UAP group
Control group
m-ILac TMAO VLDL
LipidLipid
3-HB
LDL
�r Cr
PC/GPC
ChoCr Glu
Gln
Lys
TC
IleLeuVal
−400
−200
3 15Chemical shi� (ppm)
4 2
(b)
Figure 4: Score plot of OPLS-DA model (a) for UAP and control groups, score plots showing the model’s separation regarding UAP (redcircles) and healthy controls (black squares), and OPLS-DA corresponding correlation coefficient loading plots (b) of key metabolites.
Table 2: OPLS-DA coefficients derived from the CPMG NMR data of metabolites in serum samples obtained from different groups.
Metabolites 1H (ppm) and multiplicityb𝑟a
UAP −control
LDL 0.85(br), 1.28(br) 0.751Glycerophosphocholine 3.23(s) −0.669
Threonine 4.25(m) −0.658
Phosphocholine 3.21(s) −0.626
TC 0.70(br) −0.624
3-Hydroxybutyrate 1.20(d), 2.31(dd), 2.41(dd), 4.16(m) 0.577
1-Methylhistidine 7.07(s), 7.81(s) −0.556
Lipid, -CH2-C=O 2.24(br) 0.537
Phenylalanine 7.33(d), 7.37(t), 7.42(m) −0.530
Lipid, =CH-CH2-CH= 2.78(br) 0.527
Glutamate 2.08(m), 2.12(m), 2.35(m), 3.78(m) −0.500
Creatine 3.04(s), 3.93(s) −0.491
Lysine 1.45(m), 1.71(m), 1.91(m), 3.01(m), 3.76(m) −0.490
Glutamine 2.14(m), 2.45(m), 3.78(m) −0.486
Choline 3.20(s) −0.480
Leucine 0.96(t) −0.478
Valine 0.99(d), 1.04(d) −0.473
myo-inositol 3.28(t), 3.56(dd), 3.61(m), 4.06(t) 0.468
Isoleucine 0.94(t), 1.01(d) −0.452
VLDL 0.88(br), 1.30(br), 1.58(br) 0.441Lactate 1.33(d), 4.11(q) 0.431TMAO 3.27(s) 0.430aCorrelation coefficients: positive and negative signs indicate positive and negative correlation in the concentrations, respectively. The correlation coefficientof |𝑟| > 0.423 was used as the cutoff value for the statistical significance based on the discrimination significance at the level of 𝑃 = 0.05 and df (degree offreedom) = 20. “−” means the correlation coefficient |𝑟| is less than 0.423. Multiplicityb: s: singlet; d: doublet; t: triplet; q: quartet; dd: doublet of doublets; m:multiplet; br: broad single peak.

BioMed Research International 7
The increased level of serum creatinine is a marker ofacute coronary syndrome, in patients with a creatinine levelof 1.0mg/ml have a 10–35% higher motility than the controlgroup [22]. Saygitov et al. also showed that the increasedblood urea nitrogen together with serum creatinine levelwas the independent risk factors of high motility in ACSpatients [23]. The majority of creatinine transitions intophosphocreatine and produces ATP by the reversible capacityof the enzyme. It transitions into creatinine in the absence ofthe enzyme in nonstandard scenarios.This highlights that thelower level of creatinine in the serum of UAP group indicatesthe inability of UAP group to generate ATP conventionally;consequently, the requirement exists for a greater quantity ofcreatine to transition into phosphocreatine, thereby produc-ing ATP [24].
The metabolite levels for amino acids in this research,including Thr, Gln, Lys, Ile, Leu, and Val, were considerablyreduced for the UA patients when considered in relation tothe healthy controls. The energy metabolism of myocardiumcells was disturbed in UA patients and these cells have to findalternative substrates to provide energy [25, 26]. Glutamine,a critical resource for gluconeogenesis, is classified as aform of glucogenic amino acid, and glutamine itself is acritical component of the TCA cycle; moreover, it performsa crucial function in numerous metabolic pathways, in par-ticular regarding the maintenance of amino acid homeostasis[27]. Some researches drew on metabolomics profiling forthe purpose of comparing cardiac extraction and plasmasubstrates, and the results indicated that CHD experienceda lower level of glutamate or glutamine [28]. Nishimuraet al. showed that Val decreased the damage induced bymetabolic disorder and hypoxia in a rabbit model [29]. Inthe present study, the lower level could potentially resultfrom the amino acid metabolism disorder, where lysinehas the potential of reducing the concentrations of bloodtriglycerides to hinder cardiovascular and cerebrovasculardisease.
To conclude, the metabolomics technique has offereda high degree of utility in the context of this initiative toimprove the under diagnosis of UAP. The present study’sfindings indicate 18 possible biomarkers associated with UAPwere identified through analysis and serum metabolomicsis a highly effective way to detect biomarkers which canfacilitate subsequent differentiation regarding UAP patientsand controls. In view of this, the technique of metabolomicsis valuable in enhancing the under diagnosis of UAP, and itis further notable that the detected metabolite biomarkers,in functioning as predicative factors, have the potential tobe used to formulate a classification model; this could bedrawn on to facilitate the preliminary diagnoses of UApatients, thereby creating the opportunity to provide person-ally tailored clinical solutions to patients. At the same time,effective treatment would be facilitated in a viable timeframe,thereby avoiding the further development of the disease tomyocardial infarction and cardiac death. Biomarkers of thiskind have similar potential to offer further insight into thebiological mechanisms of UA, and these can facilitate valu-able hints on the basis of which practitioners can heightentreatment standards.
Conflicts of Interest
The authors declare that there are no conflicts of interestregarding the publication of this article.
Acknowledgments
Theproject was supported by Science and Technology Devel-opment Fund Project of Tianjin, no. 20130138.
References
[1] A. Kibos and A. Guerchicoff, “Susceptibility genes for coronaryheart disease and myocardial infarction,” Acute Cardiac Care,vol. 13, no. 3, pp. 136–142, 2011.
[2] B. Unal, J. A. Critchley, and S. Capewell, “Explaining thedecline in coronary heart diseasemortality in england andwalesbetween 1981 and 2000,”Circulation, vol. 109, no. 9, pp. 1101–1107,2004.
[3] Y. Yeghiazarians, J. B. Braunstein, A. Askari, and P. H. Stone,“Unstable angina pectoris,” New England Journal of Medicine,vol. 342, no. 2, pp. 101–114, 2000.
[4] J. L. Anderson, B. D. Horne, S. M. Stevens et al., “Randomizedtrial of genotype-guided versus standard warfarin dosing inpatients initiating oral anticoagulation,”Circulation, vol. 116, no.22, pp. 2563–2570, 2007.
[5] C. Delles, E. Schiffer, C. Von Zur Muhlen et al., “Urinaryproteomic diagnosis of coronary artery disease: identificationand clinical validation in 623 subjects,” Journal of HumanHypertension, vol. 24, no. 10, p. 698, 2010.
[6] T. Reichlin, W. Hochholzer, S. Bassetti et al., “Early diagnosis ofmyocardial infarction with sensitive cardiac troponin assays,”New England Journal of Medicine, vol. 361, no. 9, pp. 858–867,2009.
[7] C. E. Wheelock, A. M.Wheelock, S. Kawashima et al., “Systemsbiology approaches and pathway tools for investigating cardio-vascular disease,” Molecular BioSystems, vol. 5, no. 6, pp. 588–602, 2009.
[8] J. K. Nicholson and J. C. Lindon, “Systems biology: metabo-nomics,” Nature, vol. 455, no. 7216, pp. 1054–1056, 2008.
[9] M.H. Abu Bakar,M. R. Sarmidi, K. Cheng et al., “Metabolomics- the complementary field in systems biology: a review onobesity and type 2 diabetes,” Molecular BioSystems, vol. 11, no.7, pp. 1742–1774, 2015.
[10] J. Y. Jung, H.-S. Lee, D.-G. Kang et al., “1H-NMR-basedmetabolomics study of cerebral infarction,” Stroke, vol. 42, no.5, pp. 1282–1288, 2011.
[11] P. Bernini, I. Bertini, C. Luchinat, L. Tenori, and A. Tognaccini,“The cardiovascular risk of healthy individuals studied byNMR metabonomics of plasma samples,” Journal of ProteomeResearch, vol. 10, no. 11, pp. 4983–4992, 2011.
[12] V. Bodi, J. Sanchis, J. M. Morales et al., “Metabolomic profileof human myocardial ischemia by nuclear magnetic resonancespectroscopy of peripheral blood serum: a translational studybased on transient coronary occlusion models,” Journal of theAmerican College of Cardiology, vol. 59, no. 18, pp. 1629–1641,2012.
[13] W. B. Dunn, D. I. Broadhurst, S. M. Deepak et al., “Serummetabolomics reveals many novel metabolic markers ofheart failure, including pseudouridine and 2-oxoglutarate,”Metabolomics, vol. 3, no. 4, pp. 413–426, 2007.

8 BioMed Research International
[14] K. Akira, S. Masu, M. Imachi, H. Mitome, M. Hashimoto,and T. Hashimoto, “1H NMR-based metabonomic analysis ofurine from young spontaneously hypertensive rats,” Journal ofPharmaceutical and Biomedical Analysis, vol. 46, no. 3, pp. 550–556, 2008.
[15] H. Xiao, B. E. Tan, M. M. Wu et al., “Effects of compositeantimicrobial peptides in weanling piglets challenged withdeoxynivalenol: II. Intestinal morphology and function,” Jour-nal of Animal Science, vol. 91, no. 10, pp. 4750–4756, 2013.
[16] M. B. Bizino, S. Hammer, and H. J. Lamb, “Metabolic imagingof the human heart: clinical application of magnetic resonancespectroscopy,” Heart, vol. 100, no. 11, pp. 881–890, 2014.
[17] M. Trupp, P. Jonsson, A. Ohrfelt et al., “Metabolite and peptidelevels in plasma and CSF differentiating healthy controls frompatients with newly diagnosed parkinson’s disease,” Journal ofParkinson’s Disease, vol. 4, no. 3, pp. 549–560, 2014.
[18] J. Y. Park, S.-H. Lee, M.-J. Shin, and G.-S. Hwang, “Alterationin metabolic signature and lipid metabolism in patients withangina pectoris and myocardial infarction,” PLoS ONE, vol. 10,no. 8, Article ID e0135228, 2015.
[19] M.M.Wright, A. G.Howe, andV. Zaremberg, “Cellmembranesand apoptosis: role of cardiolipin, phosphatidylcholine, andanticancer lipid analogues,” Biochemistry and Cell Biology, vol.82, no. 1, pp. 18–26, 2004.
[20] A. K.Walker, R. L. Jacobs, J. L.Watts et al., “A conserved SREBP-1/phosphatidylcholine feedback circuit regulates lipogenesis inmetazoans,” Cell, vol. 147, no. 4, pp. 840–852, 2011.
[21] S. Dimmeler, C. Hermann, and A. M. Zeiher, “Apoptosisof endothelial cells. contribution to the pathophysiology ofatherosclerosis?” European Cytokine Network, vol. 9, no. 4, 697pages, 1998.
[22] C. B. Granger, R. J. Goldberg, O. Dabbous et al., “Predictorsof hospital mortality in the global registry of acute coronaryevents,” Archives of Internal Medicine, vol. 163, no. 19, pp. 2345–2353, 2003.
[23] R. T. Saygitov, M. G. Glezer, and S. V. Semakina, “Bloodurea nitrogen and creatinine levels at admission for mortalityrisk assessment in patients with acute coronary syndromes,”Emergency Medicine Journal, vol. 27, no. 2, pp. 105–109, 2010.
[24] J. Carrola, C.M. Rocha, A. S. Barros et al., “Metabolic signaturesof lung cancer in biofluids: NMR-based metabonomics ofurine,” Journal of Proteome Research, vol. 10, no. 1, pp. 221–230,2011.
[25] K. J. Drake, V. Y. Sidorov, O. P. McGuinness, D. H. Wasserman,and J. P. Wikswo, “Amino acids as metabolic substrates duringcardiac ischemia,” Experimental Biology and Medicine, vol. 237,no. 12, pp. 1369–1378, 2012.
[26] G. Liu, S. Chen, J. Zhong, K. Teng, and Y. Yin, “Crosstalkbetween tryptophan metabolism and cardiovascular disease,mechanisms, and therapeutic implications,”Oxidative Medicineand Cellular Longevity, vol. 2017, Article ID 1602074, 5 pages,2017.
[27] G. Liu, W. Ren, J. Fang, C. A. Hu et al., “L-Glutamine and L-arginine protect against enterotoxigenic Escherichia coli infec-tion via intestinal innate immunity in mice,” Amino Acids, pp.1–10, 2017.
[28] A. T. Turer, R. D. Stevens, J. R. Bain et al., “Metabolomicprofiling reveals distinct patterns of myocardial substrate usein humans with coronary artery disease or left ventriculardysfunction during surgical ischemia/reperfusion,” Circulation,vol. 119, no. 13, pp. 1736–1746, 2009.
[29] M. Nishimura, H. Tanaka, N. Homma, T. Matsuzawa, and Y.Watanabe, “Ionicmechanisms of the depression of automaticityand conduction in the rabbit atrioventricular node caused byhypoxia ormetabolic inhibition and protective action of glucoseand valine,”The American Journal of Cardiology, vol. 64, no. 20,pp. J24–J28, 1989.

Submit your manuscripts athttps://www.hindawi.com
Hindawi Publishing Corporationhttp://www.hindawi.com Volume 2014
Anatomy Research International
PeptidesInternational Journal of
Hindawi Publishing Corporationhttp://www.hindawi.com Volume 2014
Hindawi Publishing Corporation http://www.hindawi.com
International Journal of
Volume 201
Hindawi Publishing Corporationhttp://www.hindawi.com Volume 2014
Molecular Biology International
GenomicsInternational Journal of
Hindawi Publishing Corporationhttp://www.hindawi.com Volume 2014
The Scientific World JournalHindawi Publishing Corporation http://www.hindawi.com Volume 2014
Hindawi Publishing Corporationhttp://www.hindawi.com Volume 2014
BioinformaticsAdvances in
Marine BiologyJournal of
Hindawi Publishing Corporationhttp://www.hindawi.com Volume 2014
Hindawi Publishing Corporationhttp://www.hindawi.com Volume 2014
Signal TransductionJournal of
Hindawi Publishing Corporationhttp://www.hindawi.com Volume 2014
BioMed Research International
Evolutionary BiologyInternational Journal of
Hindawi Publishing Corporationhttp://www.hindawi.com Volume 2014
Hindawi Publishing Corporationhttp://www.hindawi.com Volume 2014
Biochemistry Research International
ArchaeaHindawi Publishing Corporationhttp://www.hindawi.com Volume 2014
Hindawi Publishing Corporationhttp://www.hindawi.com Volume 2014
Genetics Research International
Hindawi Publishing Corporationhttp://www.hindawi.com Volume 2014
Advances in
Virolog y
Hindawi Publishing Corporationhttp://www.hindawi.com
Nucleic AcidsJournal of
Volume 2014
Stem CellsInternational
Hindawi Publishing Corporationhttp://www.hindawi.com Volume 2014
Hindawi Publishing Corporationhttp://www.hindawi.com Volume 2014
Enzyme Research
Hindawi Publishing Corporationhttp://www.hindawi.com Volume 2014
International Journal of
Microbiology