Serotyping dengue virus with isothermal … dengue virus with isothermal amplification and a...
30
Instructions for use Title Serotyping dengue virus with isothermal amplification and a portable sequencer Author(s) Yamagishi, Junya; Runtuwene, Lucky R.; Hayashida, Kyoko; Mongan, Arthur E.; Lan Anh Nguyen Thi; Linh Nguyen Thuy; Cam Nguyen Nhat; Limkittikul, Kriengsak; Sirivichayakul, Chukiat; Sathirapongsasuti, Nuankanya; Frith, Martin; Makalowski, Wojciech; Eshita, Yuki; Sugano, Sumio; Suzuki, Yutaka Citation Scientific reports, 7: 3510 Issue Date 2017-06-14 Doc URL http://hdl.handle.net/2115/67101 Rights(URL) http://creativecommons.org/licenses/by/4.0/ Type article Additional Information There are other files related to this item in HUSCAP. Check the above URL. File Information 41598_2017_3734_MOESM1_ESM.pdf Hokkaido University Collection of Scholarly and Academic Papers : HUSCAP
Transcript of Serotyping dengue virus with isothermal … dengue virus with isothermal amplification and a...

Instructions for use
Title Serotyping dengue virus with isothermal amplification and a portable sequencer
Author(s)Yamagishi, Junya; Runtuwene, Lucky R.; Hayashida, Kyoko; Mongan, Arthur E.; Lan Anh Nguyen Thi; Linh NguyenThuy; Cam Nguyen Nhat; Limkittikul, Kriengsak; Sirivichayakul, Chukiat; Sathirapongsasuti, Nuankanya; Frith,Martin; Makalowski, Wojciech; Eshita, Yuki; Sugano, Sumio; Suzuki, Yutaka
Citation Scientific reports, 7: 3510
Issue Date 2017-06-14
Doc URL http://hdl.handle.net/2115/67101
Rights(URL) http://creativecommons.org/licenses/by/4.0/
Type article
Additional Information There are other files related to this item in HUSCAP. Check the above URL.
File Information 41598_2017_3734_MOESM1_ESM.pdf
Hokkaido University Collection of Scholarly and Academic Papers : HUSCAP

Supplementary Files
Serotyping dengue virus with isothermal amplification and a portable sequencer
Junya Yamagishi, Lucky R. Runtuwene, Kyoko Hayashida, Arthur E. Mongan, Lan Anh Nguyen
Thi, Linh Nguyen Thuy, Cam Nguyen Nhat, Kriengsak Limkittikul, Chukiat Sirivichayakul,
Nuankanya Sathirapongsasuti, Martin Frith, Wojciech Makalowski, Yuki Eshita, Sumio Sugano,
Yutaka Suzuki

Den1 GAGTGATCCCGAAGGGGCACTCTGGTAAGCCAACTCATTCACAAAATAAAGGAAAATAAAAAATCAAACAAGGCAAGAAGTCAGGCCGGATTAAGCCATAGCACGGTAAGAG
Den2 AGAGGAAGAAGCAGGAGTTCTGTGGTAGA--------------------AAGCAAAACTAACATGAAACAAGGCTAGAAGTCAGGTCGGATTAAGCCATAGTACGGAAAAAA
Den3 AGAGGAGTCGGAGGGAGCCATTTGGTAAAC------------------GTAGGAAGTGGAAAA------GAGGCTAACTGTCAGgccaccttaagccacagtaCGgaagaag
>-F3--------------> |-FIP2-
Den4 TTCAGAGAGTGAAGGAGTTCTGTAATTACC---------------------------------------------------------------AACAACAA-ACACCAAAGG
** * ** * * * * * * * * ** *
Den1 CTATGCTGCCTGTGAGCCCCGTCCAAGGACGT---AAAATGAAGTCAGGCCG-----AAAGCCACGGTTCGAGCAAGCCGTGCTGCCTGTAGCTCCATC-GT----GGGGAT
Den2 CTATGCTACCTGTGAGCCCCGTCCAAGGACGTT---AAAAGAAGTCAGGCCATCATAAATGCCATAGCTTGAGTAAACTATGCAGCCTGTAGCTCCACCTGA----GAAGGT
Den3 ctgtgctgcctgTGagccccgtccaaggACGTTAAAAGAAgaagtcaggcccc----aaagccaCGGTTTGAGCAAACCGTGCTGCctgtagctccgtc-gt----ggggaC
-----------> <-FLP--------< |-FIP1-----------------< >-BIP1------------------|
Den4 ctat-----------------------------------tgaagtcaggccacT---TGTGccacggtttgagcaaaccGTGctgcctgtagctccgccAATaatgggaggc
>-F3------------------------------------------------> |-FIP2-----------> <-FLP-----------< |---FIP1--
** * *********** **** * * *** ** * *** ************ * * *
Den1 GTAAAAA-CCC--GGgaggctgcaaaccatggaaGctgtacgcatggggtagcAgactagtggttagaggagACCcctccc----aagacacaacgcagcAGC--GGGGccc
>-F3--------------> |-FIP2-----------> <-FLP------------< |-FIP1------------------< >--
Den2 GTAAAAAATCC--GGGAGGCCACAAACCAtggaagctgtacgcatggCGtagtggactagcggttagaggAGAcccctccctt--acaaatcGcagcaacaat--gggggcc
>-F3-------------> |-FIP2--------------> <-FLP-------------< |-FIP1-------------
Den3 GTAAAA--CCT--GggaggctgcaaactgtgGAAGCTGTACgcacggtgtagcagactagCGGTTAGAGGAGACccctccc----atgacacaacGCAGCAGC--GGGGCCC
>-BLP-----------> <-BIP2------------| <-B3----------------<
Den4 gtaataatccccaGGGAGGCCATGCGCCACGGAAGCTGTACGCGTGGCATATTGGACTAGCggttagaggagacccctcccAtcactgataaaacgcagCAAAAGGGGGCCc
------------< >-BIP1-------------| >-BLP-----------> <
**** * * ******* * ************* ** ** ****** ******************** * *** ** **** **
Den1 aa-caccaggggaagctgtACCCTggtggtaaggactagaggTTAGAGGAGACcccccgcacaacaacaaaCAGCATATTGACGCTGGGagagaccagagatcctgctgTCT
BIP1--------------| >-BLP------------> <-BIP2-----------| <-B3---------------<
Den2 caaGGCGAGATGAAGCTGTAGTCTCGCTGGAAGGACTAGAggttagaggagacccccccga-aACAAAAAACAgcatattgacgctgggaAAGAccagagatcctgctgtct
--< >-BIP1----------------| >-BLP-----------> <-BIP2------------
Den3 GAGCACTGAGGGAAGCTGTACCTCCTTGCAAAGGACTAGAGGTTAGAGGAGACCCCCCGCA-AATAA-AAACAGCATATTGACGCTGGGAGAGACCAGAGATCCTGCTGTCT
Den4 gaagccaggaggaagctGTACTCCTggtggaaggactagaggtTAGAGGAGACCCCCCCAA-CACAA-AAACAGCATATTGACGCTGGGAAAGACCAGAGATCCTGCTGTCT
-BIP2-----------| <-B3-------------<
* * ********* **************************** * * ** ********************** *********************
Den1 CTACAGCATCATTCCAGGCACAGAACGCCAAAAAATGGAATGGTGCTGTTGAATCAACAGGTTCT
Den2 ccTcagcatcattccaggcacAGAACGCCAGAAAATGGAATGGTGCTGTTGAATCAACAGGTTCT
-| <-B3-------------<
Den3 CCTCAGCATCATTCCAGGCACAGAACGCCAGAAAATGGAATGGTGCTGTTGAATCAACAGGTTCT
Den4 CTGCAACATCAATCCAGGCACAGAGCGCCGCAAGATGGATTGGTGTTGTTGATCCAACAGGTTCT
* ** ***** ************ **** ** ***** ***** ****** ***********
b
a

c Control Den 1 Control Den 3
Control Den 2 Control Den 4
Figure S1 | The schematics of LAMP. a, Schematic representation of LAMP. Using six pair of primers, LAMP amplify the target DNA or RNA into a ladder configuration. Briefly, the
primers form the indicated hairpin structure, which allows turn back priming of the DNA polymerase in an isothermal reaction. For further
details, see the reference. b, Primers used for the LAMP amplification for each serotype. Asterisks at the bottom indicate the common bases
between the serotypes. For the alignment, the genome sequences of D1-D4 are aligned using ClustalW. c, Sanger sequencing of the control
viral RNAs.

Figure S2 | The correlation between LAST score and e-value. Each sequence obtained from a sequence run had an e-value calculated using the LAST option and this value was compared with its LAST score. The e-value corresponding to a LAST score of 150 is highlighted. Pearson’s correlation is also shown.

0%
10%
20%
30%
40%
50%
60%
70%
0% 10% 20% 30% 40% 50% 60% 70% 80% 90% 100%
Rat
io o
f re
ads
Ratio of identified bases by LAST
Figure S3 | Sequencing result of control samples obtained by newer version flow cell. Accuracy of the sequencing obtained by flow cell version 9.4 was calculated by considering the matched base between each sequence and the corresponding reference genome.

Figure S4| MinION sequencing of clinical samples. a, Examples of erroneous LAMP results. Note that LAMP results by their own were not always conclusive. b, Example of clinical samples sequencing. The highest score reads are shown here. These reads have approximately 95% in fidelity.
Query: B24
TargetSubject: Den1
sstart-send: 10489-10550
MinScore: 450
Subject:CTGT-ACGCATGGGGTAGCA-GACTAGTGGTTAGAG--GAGACCCCTCCCAAGACACAACGCAGCA
read1 :****-**********CCC*--***************--*****G**********************
read2 :****G***************-***************--*******-********************
read3 :****-***************A***************--*-**T***CT***CA*************
read4 : **-***************-A--************--****T*******************CCG*
read5 :****-******-********-***************AG*******--T******************
read6 :****-*****CTC*******-***************--*******-***AC***************
Query: B54
TargetSubject: Den3
sstart-send: 10321-10382
MinScore: 750
Subject:GAAGAAGCTGTGCTGC-CTGTGAGCCC-CGTCCA--AGGACGTTAAAAGAAGAAGTCAGGCCCCAA
read1 :*************A**-**********-******CATA*************************A**
read2 :****G********A**-**********--*****--***************************A*C
read3 :*************A**C**********-******--***************************A**
read4 :*************A**-*******-**-******--***************************A**
read5 :*************A**-**********C******--****************---********A**
read6 :*************A**-****-****---*****--***************************A**
read7 :*************A**-**********-******--***************************A**
read8 :*************A**-**********-******--***G***********************-**
Query: B49
TargetSubject: Den2
sstart-send: 10489-10550
MinScore: 670
Subject:TAGTGGACT-AGC-GGTT-AGAGGAGACCCCTCCCTTACAAATCGCAGCAACAAT-GGGGGCCCAA
read1 :*********-***-****T***********T--*******G***A**********-**********
read2 :*********-***-****--********************G***A**********-**********
read3 :****-****-***-****-*********************G***A**TA******-**********
read4 :*********-***G****-*********************G***A**********-**********
read5 : **-****-***************A*****G***A**********-**********
read6 : ****-***-****-T********************G***A**********-**********
read7 :*********-***-*-**-*****C***************G**************-**********
read8 : *******G***-*T*G-**G******************G***A**********-**********
read9 : *******-***-****-*********************G***A**********C**********
read10 :*********-***-*-**-**************G*G**-*G***A**********-**********
read11 : *******-***-****-***********-*********G***A********-*-**********
Query: B17
TargetSubject: Den4
sstart-send: 10312-10369
MinScore: 730
Subject:CCACGGTTTGAGCA-AACCGTGCTGCCTGTAGCTCCGCCAATAATGGGAGG-----CGT-AATAA
read1 :******C*******-************************************-----***-T****
read2 :******C*******-************************************-----***-T****
read3 :******C*******-************************************-----***-T****
read4 :******C*******-************************************GCGGG***-TGACC
read5 :******C*******-*********************A*-************-----***T*CCCT
read6 :******C*******-**G*****************************-***-----***-T****
read7 :******C*******-***********-*********C**************-----***-T*CGT
read8 :******C******CC**A*********************************-----***-T****
b
a

a
b
c
Figure S5 | On-site MinION sequencing The photos of the outlook of the clinics in Indonesia (a), Vietnam (b), and Thailand (c).

Figure S6 | Scaling the analysis with barcode oligos. a, Results from the simulation analysis regarding the number of sequence reads necessary to include more than ten sequence reads
supporting the serotyping of the indicated serotype. b, c, The precision (b) and recall (c) that separate barcoding oligos.
D1
D2
D3
D4
X1
B
C
a
b
c

Figure S7 | Precision plotted against recall
We employed threshold 2.0 for our analysis, which is conservative with a recall rate lower than 50%. Threshold 1.0, on the other hand, gives
varied results among different datasets. For that reason, we did not change our threshold for subsequent analysis.
0.5
1.02.0
0%
10%
20%
30%
40%
50%
60%
70%
80%
90%
100%
0% 10% 20% 30% 40% 50% 60% 70% 80% 90% 100%
pre
cisi
on
recall
Depth >=5
Depth >=10
Depth >= 20

a
b
template D1:D4 1:0 1:1 1:1/10 1:1/100 1:1/1,000 1:1/10,000
primer D1 1,825 2,550 2,575 2,250 3,350 2,850 (ng)
primer D4 25 4,825 2,800 25 25 0
p= 1e-2 p= 2e-5
p= 4e-6
p=1x10⁻² p=2x10⁻⁵
p=4x10⁻⁶

c
d
p=0.06
p=0.006

e
p=0.07
p=0.03
p=0.004

f
Figure S8 | Possible causes of the ambiguous detections. a, The number of sequence reads for the indicated population. The difference in statistical significance was evaluated by the Wilcoxson’s
singed rank test and shown on the plot. b, Non-specific amplification of the contaminated templates. Amounts of the LAMP amplicons using the
indicated templates and the primers are shown. Templates were serially mixed with the indicated ratios between the D1 and D4 viral RNA with
the total amount of 400 p.f.u.. Note that remnant amount of amplicons of D4 was observed even at the 1/100 dilutions or less. c, The detection
rate is correlated with viral titer, which is shown here with Ct value from qRT-PCR of DENV E protein. d, Detection rate is slightly correlated
with sample purity, with purified virus RNA shows slightly better detection rate. e, f, Detection rate is correlated with viral titer (in this case
shown by Ct value), with higher viral titer (lower Ct value) gives a better detection rate.

a
Sample ID Sequencing mode Category Diagnosed serotype
Total reads Total mapped reads
Total reads mapped to the corresponding serotype
Mapped ratio Average sequence identity
Control D1 2D Control D1 4,060 2,164 2,155 100% 77%
Control D2 2D Control D2 9,260 6,719 6,617 98% 79%
Control D3 2D Control D3 9,750 7,885 7,873 100% 82%
Control D4 2D Control D4 2,758 2,014 2,010 100% 78%
Control D1 Template Control D1 22,510 1,160 1,133 98% 70%
Control D2 Template Control D2 24,079 3,623 3,375 93% 69%
Control D3 Template Control D3 22,842 6,557 6,499 99% 71%
Control D4 Template Control D4 5,579 967 967 100% 70%
Control D1 Complement Control D1 5,943 41 41 100% 68%
Control D2 Complement Control D2 11,450 577 527 91% 69%
Control D3 Complement Control D3 12,436 755 751 99% 69%
Control D4 Complement Control D4 3,242 62 62 100% 70%
b.
Program Sample ID Sequencing mode # of total reads # of mapped reads # of reads mapped to the corresponding serotype
Mapped ratio
LAST Control D1 2D 4,060 2,164 2,155 100% Control D2 2D 9,260 6,719 6,617 98% Control D3 2D 9,750 7,885 7,873 100% Control D4 2D 2,758 2,014 2,010 100% Control D1 Template 22,510 1,160 1,133 98% Control D2 Template 24,079 3,623 3,375 93% Control D3 Template 22,842 6,557 6,499 99% Control D4 Template 5,579 967 967 100% Control D1 Complement 5,943 41 41 100% Control D2 Complement 11,450 577 527 91% Control D3 Complement 12,436 755 751 99% Control D4 Complement 3,242 62 62 100%
GraphMap Control D1 2D 4,060 3,073 2,606 85% Control D2 2D 9,260 7,686 5,293 69% Control D3 2D 9,750 8,218 6,911 84% Control D4 2D 2,758 2,186 1,796 82% Control D1 Template 22,510 12,949 9,561 74% Control D2 Template 24,079 13,763 7,880 57% Control D3 Template 22,842 15,747 11,867 75% Control D4 Template 5,579 2,985 2,116 71% Control D1 Complement 5,943 1,908 1,052 55% Control D2 Complement 11,450 5,439 2,706 50% Control D3 Complement 12,436 5,987 3,566 60% Control D4 Complement 3,242 1,141 623 55%
SSEARCH Control D1 2D 4,060 2,136 2,115 99% Control D2 2D 9,260 6,658 6,511 98% Control D3 2D 9,750 7,833 7,800 100% Control D4 2D 2,758 2,047 2,044 100% Control D1 Template 22,510 3,272 3,217 98% Control D2 Template 24,079 6,899 6,566 95% Control D3 Template 22,842 11,050 10,921 99% Control D4 Template 5,579 1,992 1,992 100% Control D1 Complement 5,943 189 187 99% Control D2 Complement 11,450 1,547 1,489 96% Control D3 Complement 12,436 1,963 1,940 99% Control D4 Complement 3,242 278 278 100%
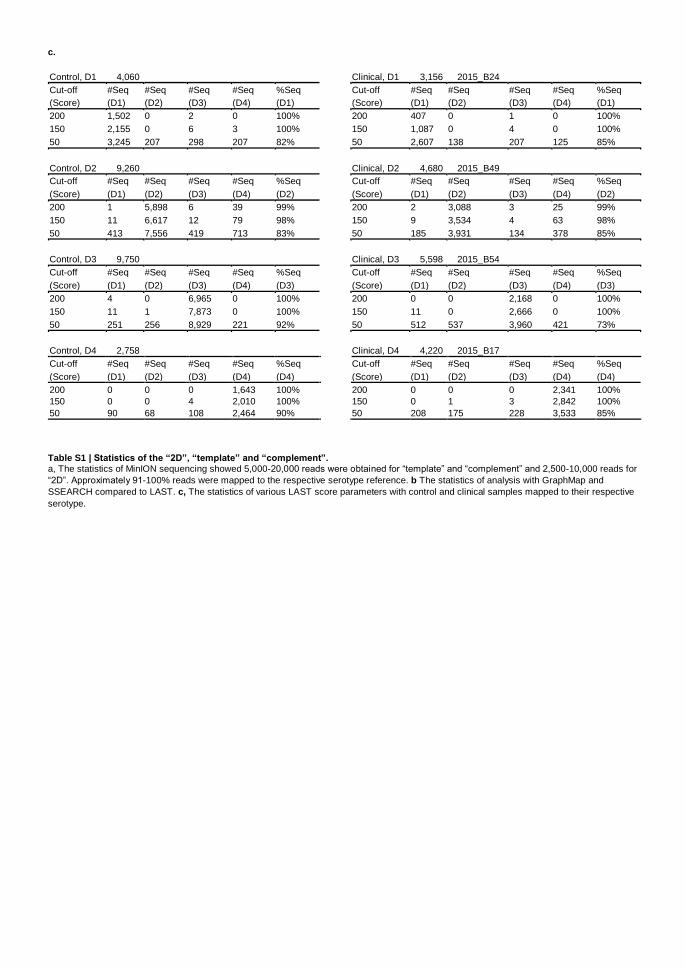
c.
Control, D1 4,060 Clinical, D1 3,156 2015_B24
Cut-off #Seq #Seq #Seq #Seq %Seq Cut-off #Seq #Seq #Seq #Seq %Seq
(Score) (D1) (D2) (D3) (D4) (D1) (Score) (D1) (D2) (D3) (D4) (D1)
200 1,502 0 2 0 100% 200 407 0 1 0 100%
150 2,155 0 6 3 100% 150 1,087 0 4 0 100%
50 3,245 207 298 207 82% 50 2,607 138 207 125 85%
Control, D2 9,260 Clinical, D2 4,680 2015_B49
Cut-off #Seq #Seq #Seq #Seq %Seq Cut-off #Seq #Seq #Seq #Seq %Seq
(Score) (D1) (D2) (D3) (D4) (D2) (Score) (D1) (D2) (D3) (D4) (D2)
200 1 5,898 6 39 99% 200 2 3,088 3 25 99%
150 11 6,617 12 79 98% 150 9 3,534 4 63 98%
50 413 7,556 419 713 83% 50 185 3,931 134 378 85%
Control, D3 9,750 Clinical, D3 5,598 2015_B54
Cut-off #Seq #Seq #Seq #Seq %Seq Cut-off #Seq #Seq #Seq #Seq %Seq
(Score) (D1) (D2) (D3) (D4) (D3) (Score) (D1) (D2) (D3) (D4) (D3)
200 4 0 6,965 0 100% 200 0 0 2,168 0 100%
150 11 1 7,873 0 100% 150 11 0 2,666 0 100%
50 251 256 8,929 221 92% 50 512 537 3,960 421 73%
Control, D4 2,758 Clinical, D4 4,220 2015_B17
Cut-off #Seq #Seq #Seq #Seq %Seq Cut-off #Seq #Seq #Seq #Seq %Seq
(Score) (D1) (D2) (D3) (D4) (D4) (Score) (D1) (D2) (D3) (D4) (D4)
200 0 0 0 1,643 100% 200 0 0 0 2,341 100%
150 0 0 4 2,010 100% 150 0 1 3 2,842 100%
50 90 68 108 2,464 90% 50 208 175 228 3,533 85%
Table S1 | Statistics of the “2D”, “template” and “complement”. a, The statistics of MinION sequencing showed 5,000-20,000 reads were obtained for “template” and “complement” and 2,500-10,000 reads for
“2D”. Approximately 91-100% reads were mapped to the respective serotype reference. b The statistics of analysis with GraphMap and
SSEARCH compared to LAST. c, The statistics of various LAST score parameters with control and clinical samples mapped to their respective
serotype.
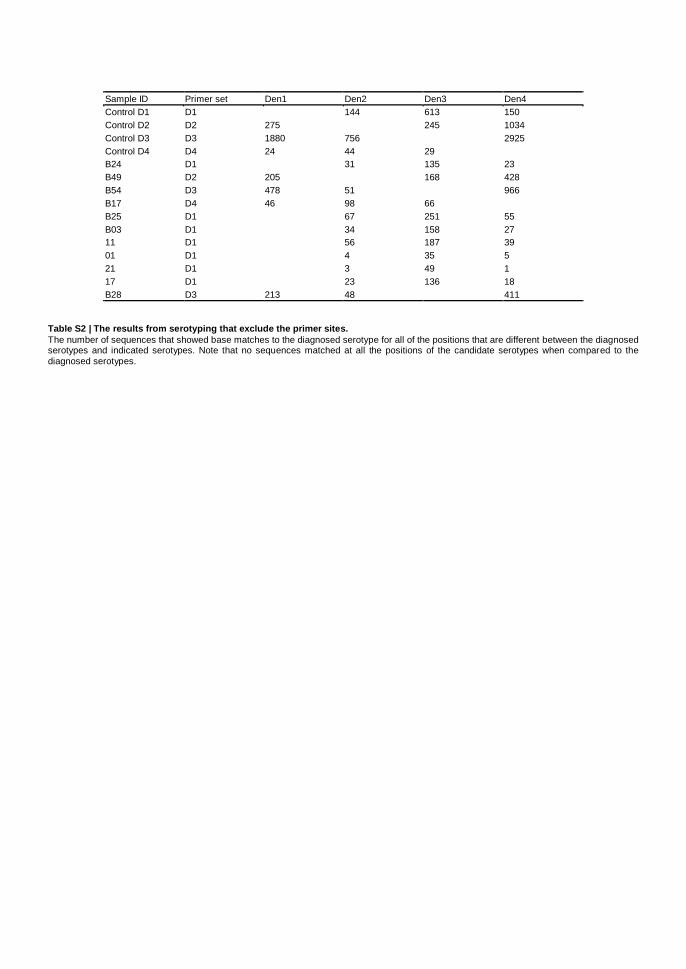
Sample ID Primer set Den1 Den2 Den3 Den4
Control D1 D1 144 613 150
Control D2 D2 275 245 1034
Control D3 D3 1880 756 2925
Control D4 D4 24 44 29
B24 D1 31 135 23
B49 D2 205 168 428
B54 D3 478 51 966
B17 D4 46 98 66
B25 D1 67 251 55
B03 D1 34 158 27
11 D1 56 187 39
01 D1 4 35 5
21 D1 3 49 1
17 D1 23 136 18
B28 D3 213 48 411
Table S2 | The results from serotyping that exclude the primer sites.
The number of sequences that showed base matches to the diagnosed serotype for all of the positions that are different between the diagnosed serotypes and indicated serotypes. Note that no sequences matched at all the positions of the candidate serotypes when compared to the diagnosed serotypes.

a.
Sample ID Sequencing mode Category Diagnosed serotype
Total reads Total mapped reads
Total reads mapped to the corresponding serotype
Mapped ratio Average sequence identity
Control D1 2D Control D1 650,232 622,563 622,325 100% 87%
Control D2 2D Control D2 296,751 288,743 287,845 99% 86%
Control D3 2D Control D3 129,955 126,193 126,119 100% 89%
Control D4 2D Control D4 133,968 129,643 129,635 100% 86%
Control D1 Template Control D1 973,069 868,796 867,602 100% 82%
Control D2 Template Control D2 498,409 441,176 437450 99% 80%
Control D3 Template Control D3 200,498 178,831 179,391 100% 84%
Control D4 Template Control D4 223,864 184,034 184,008 100% 80%
Control D1 Complement Control D1 703,513 587,770 586,571 100% 80%
Control D2 Complement Control D2 331,234 281,245 276,948 98% 78%
Control D3 Complement Control D3 144,910 124,163 123,572 100% 82%
Control D4 Complement Control D4 160,309 126,841 126,825 100% 79%
b.
Sample ID Sequencing mode Total reads Total mapped reads
(score=150)
Total reads mapped to the corresponding serotype (score=150, mismap=1) Ratio
DENV1 DENV2 DENV3 DENV4
Control DENV1 2D 650,232 622,563 622,325 5 37 196 100%
Control DENV2 2D 296,751 288,743 20 287,845 140 738 100%
Control DENV3 2D 129,955 126,193 67 4 126,119 3 100%
Control DENV4 2D 133,968 129,643 0 2 6 129,635 100%
c.
Sample ID Sequencing mode Category Diagnosed serotype
Total reads Number of mapped reads
Number of reads mapped to the corresponding serotype
Percent ratio Average sequence identity
B24 2D Clinical representative
DENV1 20,854 18,025 18,022* 100% 71%*
B49 2D Clinical representative
DENV2 274,669 241,189 237,421 98% 81%
B54 2D Clinical representative
DENV3 283,144 264,987 264,666 100% 88%
B17 2D Clinical representative
DENV4 263,889 230,336 230,317 100% 80%
Table S3 | Sequencing result of control samples obtained by newer version flow cell. a, Newer version of flow cell shows higher total reads yield and sequence identity when sequencing control samples. b, Almost all of the “2D’ reads were successfully mapped to the respective serotype. c, Sequence of representative clinical samples also shows better statistics to almost
all samples. One sample (shown by asterisk) has worse sequence identity compared to the former version. This is due to unsuccessful LAMP amplification.

a
Category Sample Total
aligned
match
Match Insertion Deletion Mismatch % match % insertion % deletion % mismatch
Control D1 236,384 181,778 4,324 21,899 28,383 77% 2% 9% 12%
Control D2 916,128 720,072 24,809 57,943 113,304 79% 3% 6% 12%
Control D3 981,318 801,880 33,231 45,415 100,792 82% 3% 5% 10%
Control D4 258,734 202,995 8,876 12,347 34,516 78% 3% 5% 13%
Total 2,392,564 1,906,725 71,240 137,604 276,995 80% 3% 6% 12%
b
A C G T
A 28,958 31,650 11,003
C 21,260 25,959 17,772
G 29,528 25,354 10,816
T 15,730 33,672 25,293
- 36,082 45,765 41,204 14,553
Table S4 | Patterns of possible sequence errors in the sequence reads using the control samples. a, The overall frequency of the mismatch pattern. b, The detailed base substitution patterns.
MinION reads
Reference genome

a
b
c
Sample origin Total samples
RT-PCR MinION
(same sample as RT-PCR)
Detected Not detected
Detected Not detected Serotype
consistent with RT-PCR
Indonesia 11 7 4
11 0 7
Thai 12 12 0
12 0 12
Vietnam 26 24 2
26 0 24
Sample name Age Sex Clinical
Evidence
RT-PCR MinION
Healthy_01 40 F NA ND ND
Healthy_02 66 M NA ND ND
Healthy_03 66 F NA ND ND
Healthy_04 70 F NA ND ND
Healthy_05 33 F NA ND ND
Healthy_06 77 M NA ND ND
Healthy_08 20 M NA ND ND
Healthy_09 66 M NA ND ND
Healthy_10 17 M NA ND ND
Healthy_11 10 F NA ND ND
Healthy_12 66 F NA ND ND
Healthy_13 10 M NA ND ND
Healthy_14 37 M NA ND ND
Healthy_15 37 F NA ND ND
Healthy_16 67 M NA ND ND
Healthy_17 75 M NA ND ND
Healthy_18 25 M NA ND ND
Healthy_19 30 M NA ND ND
Healthy_20 59 M NA ND ND
Kashiwa_01 45 M NA ND ND
Kashiwa_02 42 F NA ND ND
Kashiwa_03 26 F NA ND ND
Kashiwa_04 33 F NA ND ND
Kashiwa_05 33 F NA ND ND
Kashiwa_06 33 F NA ND ND
Kashiwa_07 42 F NA ND ND
Kashiwa_08 38 F NA ND ND
Kashiwa_09 34 M NA ND ND
Kashiwa_10 58 F NA ND ND
Kashiwa_11 23 M NA ND ND
Kashiwa_12 48 F NA ND ND
Kashiwa_13 41 M NA ND ND
Kashiwa_14 29 F NA ND ND
Sample ID RT-PCR MinION
B24 D1 D1
B49 D2 D2
B54 D3 D3
B17 D4 D4
01 ND D1
11 ND D1
17 NA D1
21 ND D1
B03 D1 D1
B25 D1 D1
B28 D3 D3

d
Sample ID Diagnosed serotype
Total aligned reads
Match Insertion Deletion Mismatch % match % ins % del % mismatch
B24 D1 101,438 75,453 7,708 6,984 11,293 74% 8% 7% 11%
B49 D2 477,863 371,774 12,780 29,674 63,635 78% 3% 6% 13%
B54 D3 336,605 269,114 11,940 18,798 36,753 80% 4% 6% 11%
B17 D4 419,953 319,287 16,861 22,274 61,531 76% 4% 5% 15%
1 D1 14,465 11,080 328 1,302 1,755 77% 2% 9% 12%
11 D1 60,949 47,116 1,204 5,704 6,925 77% 2% 9% 11%
17 D1 43,352 33,500 979 3,666 5,207 77% 2% 8% 12%
21 D1 18,774 14,337 514 1,647 2,276 76% 3% 9% 12%
B03 D1 40,603 31,338 1,210 2,999 5,056 77% 3% 7% 12%
B25 D1 63,718 50,075 1,570 4,529 7,544 79% 2% 7% 12%
B28 D3 114,623 92,477 4,374 5,576 12,196 81% 4% 5% 11%
Total 1,692,343 1,315,551 59,468 103,153 214,171 78% 4% 6% 13%
e
f
Sample ID Sequencing mode
Category Diagnosed serotype
# total reads # mapped reads
# of read
mapped to the corresponding serotype
Mapped ratio Average sequence identity
021 2D Clinical Indonesian
D4 26 11 11 100% 72%
021 Template Clinical Indonesian
D4 372 8 8 100% 67%
021 Complement Clinical
Indonesian D4 66 0 0 - -
g
Illumina RT-PCR
Matched % Unmatched % Total Matched % Unmatched % Not detected % Total
Serotype determined 43 96% 2 4% 45 10 37% 1 4% 16 59% 27
Multiple serotype 6 86% 1 14% 7 0 0% 2 33% 4 67% 6
Serotype undetermined
NA NA NA 0 0% 0 0% 2 100% 2
Not detected NA NA NA 0 0% 0 0% 8 100% 8
Total 49 94% 3 6% 52 10 23% 3 7% 30 70% 43
Sample
Serotype SNP called by MinION
SNP called by Illumina
B24 D1 Den1:10553:G:A Den1:10581:C:G
B49
D2
Den2:10553:C:T Den2:10555:A:G Den2:10560:A:G Den2:10573:G:A
Den2:10555:A:G Den2:10560:A:G Den2:10573:G:A
B54 D3 Den3:10391:T:C Den3:10391:T:C
B17
D4 Not detected Den4:10403:C:T Den4:10415:T:C
01 D1 Not detected Den1:10581:C:G
11 D1 Not detected Den1:10581:C:G
17 D1 Not detected Not detected
21 D1 Not detected Not detected
B03 D1 Den1:10581:C:G Not analyzed
B25 D1 Den1:10581:C:G Den1:10581:C:G
B28 D3 Den3:10391:T:C Den3:10391:T:C

Table S5 | Statistics of the MinION sequencing for clinical samples. a, Results of the analysis using healthy samples, from Indonesia (labeled as Healthy) and from Japan (labeled as Kashiwa). b, c, RT-PCR validation of the MinION results shows that MinION can detect dengue serotype when RT-PCR fails to detect the serotype. d, Patterns of the putative sequence errors are shown. e, The positions and patterns of the SNVs and their validations for the non-multiplexed samples. f, Data from one of the field-analyzed samples are similar with those of laboratory-analyzed. g, Illumina and RT-PCR validation of MinION results for the
multiplexed samples. NA: Not analyzed; ND: Not detected.

Table S6 | Primers used for the LAMP amplification. Primers without barcoding oligos (a), primers containing barcoding oligos for multiplexing (b), primers for RT-PCR validation (c).
a b
c
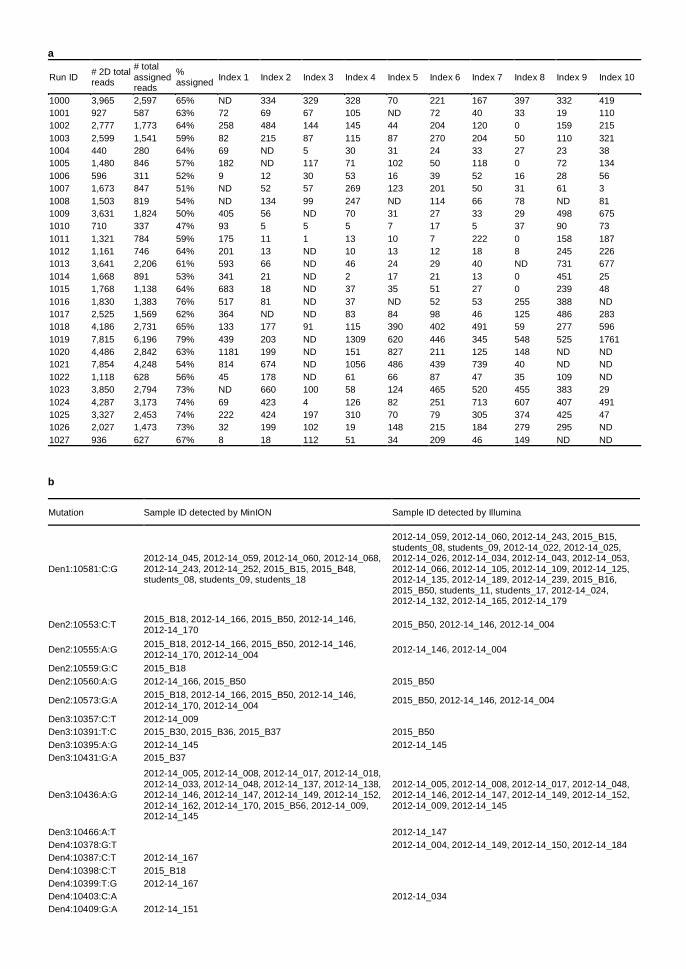
a
Run ID # 2D total reads
# total assigned reads
% assigned
Index 1 Index 2 Index 3 Index 4 Index 5 Index 6 Index 7 Index 8 Index 9 Index 10
1000 3,965 2,597 65% ND 334 329 328 70 221 167 397 332 419
1001 927 587 63% 72 69 67 105 ND 72 40 33 19 110
1002 2,777 1,773 64% 258 484 144 145 44 204 120 0 159 215
1003 2,599 1,541 59% 82 215 87 115 87 270 204 50 110 321
1004 440 280 64% 69 ND 5 30 31 24 33 27 23 38
1005 1,480 846 57% 182 ND 117 71 102 50 118 0 72 134
1006 596 311 52% 9 12 30 53 16 39 52 16 28 56
1007 1,673 847 51% ND 52 57 269 123 201 50 31 61 3
1008 1,503 819 54% ND 134 99 247 ND 114 66 78 ND 81
1009 3,631 1,824 50% 405 56 ND 70 31 27 33 29 498 675
1010 710 337 47% 93 5 5 5 7 17 5 37 90 73
1011 1,321 784 59% 175 11 1 13 10 7 222 0 158 187
1012 1,161 746 64% 201 13 ND 10 13 12 18 8 245 226
1013 3,641 2,206 61% 593 66 ND 46 24 29 40 ND 731 677
1014 1,668 891 53% 341 21 ND 2 17 21 13 0 451 25
1015 1,768 1,138 64% 683 18 ND 37 35 51 27 0 239 48
1016 1,830 1,383 76% 517 81 ND 37 ND 52 53 255 388 ND
1017 2,525 1,569 62% 364 ND ND 83 84 98 46 125 486 283
1018 4,186 2,731 65% 133 177 91 115 390 402 491 59 277 596
1019 7,815 6,196 79% 439 203 ND 1309 620 446 345 548 525 1761
1020 4,486 2,842 63% 1181 199 ND 151 827 211 125 148 ND ND
1021 7,854 4,248 54% 814 674 ND 1056 486 439 739 40 ND ND
1022 1,118 628 56% 45 178 ND 61 66 87 47 35 109 ND
1023 3,850 2,794 73% ND 660 100 58 124 465 520 455 383 29
1024 4,287 3,173 74% 69 423 4 126 82 251 713 607 407 491
1025 3,327 2,453 74% 222 424 197 310 70 79 305 374 425 47
1026 2,027 1,473 73% 32 199 102 19 148 215 184 279 295 ND
1027 936 627 67% 8 18 112 51 34 209 46 149 ND ND
b
Mutation Sample ID detected by MinION Sample ID detected by Illumina
Den1:10581:C:G 2012-14_045, 2012-14_059, 2012-14_060, 2012-14_068, 2012-14_243, 2012-14_252, 2015_B15, 2015_B48, students_08, students_09, students_18
2012-14_059, 2012-14_060, 2012-14_243, 2015_B15, students_08, students_09, 2012-14_022, 2012-14_025, 2012-14_026, 2012-14_034, 2012-14_043, 2012-14_053, 2012-14_066, 2012-14_105, 2012-14_109, 2012-14_125, 2012-14_135, 2012-14_189, 2012-14_239, 2015_B16, 2015_B50, students_11, students_17, 2012-14_024, 2012-14_132, 2012-14_165, 2012-14_179
Den2:10553:C:T 2015_B18, 2012-14_166, 2015_B50, 2012-14_146, 2012-14_170
2015_B50, 2012-14_146, 2012-14_004
Den2:10555:A:G 2015_B18, 2012-14_166, 2015_B50, 2012-14_146, 2012-14_170, 2012-14_004
2012-14_146, 2012-14_004
Den2:10559:G:C 2015_B18
Den2:10560:A:G 2012-14_166, 2015_B50 2015_B50
Den2:10573:G:A 2015_B18, 2012-14_166, 2015_B50, 2012-14_146, 2012-14_170, 2012-14_004
2015_B50, 2012-14_146, 2012-14_004
Den3:10357:C:T 2012-14_009
Den3:10391:T:C 2015_B30, 2015_B36, 2015_B37 2015_B50
Den3:10395:A:G 2012-14_145 2012-14_145
Den3:10431:G:A 2015_B37
Den3:10436:A:G
2012-14_005, 2012-14_008, 2012-14_017, 2012-14_018, 2012-14_033, 2012-14_048, 2012-14_137, 2012-14_138, 2012-14_146, 2012-14_147, 2012-14_149, 2012-14_152, 2012-14_162, 2012-14_170, 2015_B56, 2012-14_009, 2012-14_145
2012-14_005, 2012-14_008, 2012-14_017, 2012-14_048, 2012-14_146, 2012-14_147, 2012-14_149, 2012-14_152, 2012-14_009, 2012-14_145
Den3:10466:A:T 2012-14_147
Den4:10378:G:T 2012-14_004, 2012-14_149, 2012-14_150, 2012-14_184
Den4:10387:C:T 2012-14_167
Den4:10398:C:T 2015_B18
Den4:10399:T:G 2012-14_167
Den4:10403:C:A 2012-14_034
Den4:10409:G:A 2012-14_151

Den4:10413:A:C 2012-14_040
Den4:10472:C:G 2012-14_104
c
Mutation Sample ID detected by MinION Sample ID detected by Illumina
DENV1:10527:C:T 13S03799, 13S03834
DENV1:10581:C:G 13S03834, 13S03857 13S03732, 13S03740, 13S03799, 13S03801, 13S03806, 13S03857
DENV2:10553:C:T 13S03873
DENV2:10555:A:G 13S03873
DENV2:10570:C:T 13S03873
DENV2:10573:G:A 13S03873
DENV3:10403:G:C 13S03866
DENV3:10436:A:G 13S03734, 13S03746, 13S03763, 13S03764, 13S03770, 13S03776, 13S03789, 13S03792, 13S03818, 13S03827, 13S03843, 13S03855, 13S03866
13S03866, 13S03746, 13S03763, 13S03764, 13S03770, 13S03776, 13S03780, 13S03789, 13S03792, 13S03810, 13S03818, 13S03827, 13S03836, 13S03843, 13S03855, 13S03865, 13S03872
DENV4:10388:G:T 13S03748, 13S03754, 13S03756, 13S03781, 13S03825 13S03748, 13S03754, 13S03756, 13S03766, 13S03795, 13S03820, 13S03833, 13S03845, 13S03846, 13S03854, 13S03868, 13S03825, 13S03859
DENV4:10405:C:T 13S03825, 13S03859
d
Mutation Sample ID detected by MinION Sample ID detected by Illumina
DENV1:10527:C:T 01-0777 01-0777, 02-0083
DENV1:10581:C:G 02-0083 01-0777, 02-0083
DENV2:10553:C:T 02-0074 02-0074
DENV2:10555:A:G 02-0074 02-0074
DENV2:10568:G:A 02-0074, 03-0067, 03-0164 02-0074, 03-0067, 03-0164
DENV2:10571:T:C 03-0164 03-0164
DENV2:10573:G:A 02-0074
DENV2:10577:G:C 02-0074 02-0074
DENV2:10578:A:G 02-0074
DENV3:10436:A:G 02-0163
DENV4:10388:G:T 01-0122, 03-0031 01-0122, 03-0031
Table S7 | Results of MinION analysis by the multiplex analysis for clinical samples. a, The number of sequences associated with the indicated barcoding oligos. b, c, d, SNVs detected from multiplexed MinION reads. The positions and patterns of the SNVs and their validation analyses are shown for the indicated samples from Indonesia (b), Vietnam (c), and Thailand (d).
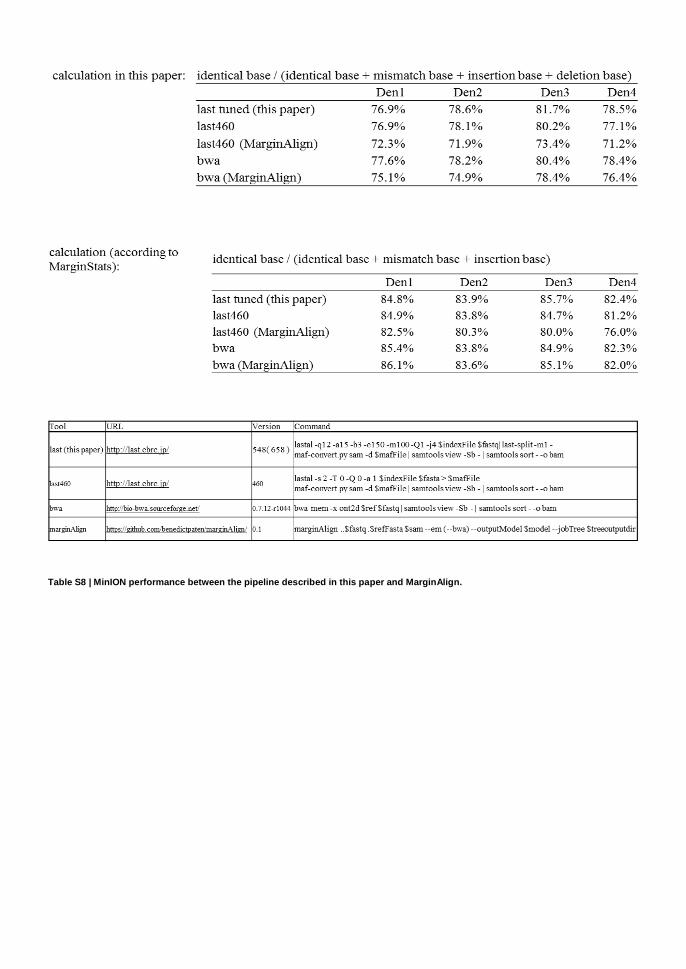
Table S8 | MinION performance between the pipeline described in this paper and MarginAlign.

Category #of samples
Diagnosed serotypes # (%)
Serotype
detected %
Serotype
elusive % ND %
NS1+ 67 49 73% 6 9% 12 18%
Ig+ 60 40 67% 6 10% 14 23%
No evidence 14 2 14% 0 0% 12 86%
Total 141 91 65% 12 8% 38 27%
Table S9 | Serotyping results and medical evidence

Year Region Total samples Target genes Serotype Genotype Amino Acid Reference
2004 Malaysia 101 E protein DENV1 Ic (98%) II (2%)
D37, K120, E157 D37, T88, D157, K120, T225, S339, V345
Boon-Teong Teoh (2013)
1974-2001 Thailand 105 E protein DENV2 Asian I (96.2%)
Asian/American (3.8%)
Chunlin Zhang
(2006)
2003-2008 Vietnam 187 E protein DENV2 Asian I (74.3%)
Asian/American (24.6%)
K83, N203, K226, E228,
Y346 N83, D203, T226, G228, H346
Vu Thi Ty Hang (2010)
2004 Jakarta 10 E protein DENV3 I V68, V169, K231, S301,
A303, V479
Chwan-Chuen King (2008)
1998 Taiwan 4 E protein DENV3 II P124, Y132, D154, V160, V169, N270,
V479
Chwan-Chuen King (2008)
1994 Thailand 2 E protein DENV3 II V68, P124, D154, V160, N270, V479
Chwan-Chuen King (2008)
2001 Malaysia 5 E protein DENV4 IIA V108, L120, I335, D384, V455, L461
Sazaly AbuBakar (2002)
1998-2002 Bangkok 53 E protein DENV4 I (90.5%) III (9.5%)
Chonticha Klungthong (2004)
Table S10 | Genotyping of each DENV serotype

Flow cell version Price Number of experiment Cost per experiment
FLO_MAP002 $1,998.00 2 $999.00
FLO_MAP003 $1,998.00 2 $999.00
FLO_MAP103 $900.00 1 $900.00
FLO_MAP103.48 $24,000.00 48 $500.00
FLO_MAP104 $900.00 1 $900.00
FLO_MAP104.48 $24,000.00 48 $500.00
Reagent version Price Number of experiment Cost per experiment
SQK_MAP004 $499.00 3 $166.33
SQK_MAP005 $599.00 6 $99.83
SQK_MAP006 $599.00 6 $99.83
SQK_MAP007 $599.00 6 $99.83
Table S11 | Price of MinION flow cell and reagents

Method S1 | RT-PCR protocol
SuperScript® One-Step RT-PCR System with Platinum® Taq DNA Polymerase
https://www.thermofisher.com/order/catalog/product/10928042?ICID=search-product
2X Reaction Mix 25 μL
Template RNA 1 μL
Sense Primer (10 μM) 1 μL
Anti-sense Primer (10 μM) 1 μL
RT/ Platinum® Taq Mix 0.5 μL
Autoclaved distilled water 6.5 μL
Perform 1 cycle of:
50°C for 30 minutes
94°C for 2 minutes
Perform 40 cycles of:
Denature: 94°C for 30 seconds
Annealing: 53°C for 30 seconds
Extension: 72°C for 1 minute/kb
Perform 1 cycle of 72ºC for 2 minutes