Serological Monitoring to assess efficiency of vaccination ... · Department of Animal Health -...
16
Ministry of Agriculture, Livestock and Food Supply Secretariat of Animal and Plant Health and Inspection Serological Monitoring to assess efficiency of vaccination against foot-and-mouth disease in the free zone Final Report Department of Animal Health Brasília, November, 2011
Transcript of Serological Monitoring to assess efficiency of vaccination ... · Department of Animal Health -...

Ministry of Agriculture, Livestock and Food Supply
Secretariat of Animal and Plant Health and Inspection
Serological Monitoring to assess efficiency of vaccination against foot-and-mouth
disease in the free zone
Final Report
Department of Animal Health
Brasília, November, 2011

Federal Republic of Brazil Ministry of Agriculture, Livestock and Food Supply Secretariat of Animal and Plant Health and Inspection
2 Department of Animal Health - Esplanada dos Ministérios – Ministry of Agriculture, Livestock, and Food Supply - Block A (annex) - Brasília – DF zip code:: 70.043-900 - tel:+55 61 3218-2701 - fax:+55 61 3226-3446
Department of Animal Health
Serological Monitoring to assess efficiency of vaccination against foot-and-mouth disease in the free zone -
Final Report - 2010/2011
1. Introduction
As of 2005, under DSA/SDA/MAPA coordination and with support of the PANAFTOSA, State Veterinary Services
(SVEs) have been carrying out serum-epidemiological studies with aim at monitoring effectiveness of
vaccination campaigns against the foot-and-mouth disease (FMD) in the Units of the Federation (UFs) that
make up the disease’s free zone. These studies are part of a set of management activities implemented by the
National Program for the Eradication and Prevention of Foot-and-mouth Disease (PNEFA) and; in addition,
they seek to satisfy health certification commitments agreed with countries that import beef cattle. Similar to
the first survey carried out in 2005, this study included all UFs that are part of the FMD free zone with
vaccination.
2. Goal
To estimate immunity coverage of bovine population between 6 and 24 months old of the UFs located in the
foot-and-mouth disease free zone with vaccination.
3. Related documents
• Evaluation of population immunity resulting from vaccination campaigns against the foot-and-mouth
disease. Final report, August 2007. http://www.agricultura.gov.br/arq_editor/file/Aniamal/programa%20nacional%20sanidade%20aftosa/Assessment%20of%20the%20population%20immunity.pdf
• Epidemiological study to evaluate efficiency of vaccination against the foot-and-mouth disease in the
free zone – Guide for Standardization of Activities / August, 2010.
4. Time-frame
Planning, sample collection and laboratory analysis activities were conducted between August, 2010 and
September, 2011. Sample collection, specifically, was concentrated in September and October, 2010 (96% of
total samples), before the November vaccination stage and distant as much as possible from the previous
vaccination stage, which took place in May, 2010, as depicted in Figure 01. Thus, the samples were collected
in third final period between vaccination stages, allowing us to assess the time period of lesser expectation
regarding immunity coverage of the bovine population.
In all of the UFs, immunity coverage was assessed for the three types of viruses that are used in the vaccines
traded in the country (virus O, A and C). The work involved with preparing and delivering samples to
LANAGRO/MG was carried out between October and December 2010, and the laboratory results for virus O
and A were made available in April 2011 and for virus C, in the beginning of September of 2011.

Federal Republic of Brazil Ministry of Agriculture, Livestock and Food Supply Secretariat of Animal and Plant Health and Inspection
3 Department of Animal Health - Esplanada dos Ministérios – Ministry of Agriculture, Livestock, and Food Supply - Block A (annex) - Brasília – DF zip code:: 70.043-900 - tel:+55 61 3218-2701 - fax:+55 61 3226-3446
Department of Animal Health
FM
D V
acc
inati
on
Sta
ge
FM
D V
acc
inati
on
Sta
ge
FM
D V
acc
inati
on
Sta
ge
FM
D V
acc
inati
on
Sta
ge
0
200
400
600
800
1000
1200
1400
1600
1st
Ha
lf
2n
d H
alf
1st
Ha
lf
2n
d H
alf
1st
Ha
lf
2n
d H
alf
1st
Ha
lf
2n
d H
alf
1st
Ha
lf
2n
d H
alf
1st
Ha
lf
2n
d H
alf
1st
Ha
lf
2n
d H
alf
1st
Ha
lf
2n
d H
alf
1st
Ha
lf
2n
d H
alf
1st
Ha
lf
2n
d H
alf
1st
Ha
lf
2n
d H
alf
1st
Ha
lf
2n
d H
alf
Jan Feb Mar Apr May Jun Jul Aug Sep Oct Nov Dec
Bo
vin
es
sam
ple
d
Sampling activities
Figure 01. Time-frame of sample collection, with emphasis on vaccination months, 2010
5. Methods
Independent studies were carried out for each UF of the FMD free zone with vaccination. Specifically in UFs
located on international border regions, two independent studies were carried out: one on the region made
up by municipalities located on the border, and another on the region encompassing other municipalities in
the state.
The DSA/SDA/MAPA, with PANAFTOSA´s support, was responsible for coming up with the sample model and
choosing the rural properties. These activities were carried out based on the databases of farms provided by
the SVEs involved, which were responsible for all field activities, including sample collection and gathering
information such as the age of the animals, estimated number of vaccinations of each sampled bovine, brand
of the vaccine used in the last two vaccination stages, size of the herd, among others.
For each UF and international border region, a stratified sample was determined according to age (6 to 12
months and 13 to 24 months) and herd size (up to 50 animals and more than 50 animals), in order to estimate
the amount of protected animals within each population of the survey. The chart below shows a summary of
the parameters used to determine the sample size. The total expected amount of samples for each
subpopulation (UF) involved is presented in Table 1.
Stratum
Age group Herd Size
Expected percentage
of protected animals Parameters used to determine sample size
Up to 50 bovines 70% Confidence Level =95% 6 to 12
months old More than 50 bovines 75% Lab test parameters:
Up to 50 bovines 80% Sensitivity and Specificity = 0.8333 13 to 24
months old More than 50 bovines 85%
Sampling error: 0.085

Federal Republic of Brazil Ministry of Agriculture, Livestock and Food Supply Secretariat of Animal and Plant Health and Inspection
4 Department of Animal Health - Esplanada dos Ministérios – Ministry of Agriculture, Livestock, and Food Supply - Block A (annex) - Brasília – DF zip code:: 70.043-900 - tel:+55 61 3218-2701 - fax:+55 61 3226-3446
Department of Animal Health
Holdings 6-to-12 m. Bovines 13 to 24 m. bovines Total Bovines
Up to 50 bovines 11 14 8 22
50+ bovines 17 103 68 171
Total 28 117 76 193
Up to 50 bovines 9 11 7 18
50+ bovines 17 102 72 174
Total 26 113 79 192
AC Total 54 230 155 385
Up to 50 bovines 27 30 24 54
50+ bovines 14 73 67 140
Total 41 103 91 194
Up to 50 bovines 40 48 32 80
50+ bovines 12 72 48 120
Total 52 120 80 200
Up to 50 bovines 18 21 15 36
50+ bovines 16 92 68 160
Total 34 113 83 196
Up to 50 bovines 7 9 5 14
50+ bovines 17 93 81 174
Total 24 102 86 188
Up to 50 bovines 24 30 18 48
50+ bovines 15 89 61 150
Total 39 119 79 198
Up to 50 bovines 11 14 8 22
50+ bovines 17 100 70 170
Total 28 114 78 192
Up to 50 bovines 3 4 2 6
50+ bovines 18 110 74 184
Total 21 114 76 190
MS Total 49 228 154 382
Up to 50 bovines 4 6 2 8
50+ bovines 19 117 73 190
Total 23 123 75 198
Up to 50 bovines 5 7 3 10
50+ bovines 18 115 67 182
Total 23 122 70 192
MT Total 46 245 145 390
Up to 50 bovines 6 7 5 12
50+ bovines 18 108 72 180
Total 24 115 77 192
Up to 50 bovines 63 77 49 126
50+ bovines 9 56 34 90
Total 72 133 83 216
Up to 50 bovines 30 35 25 60
50+ bovines 14 78 62 140
Total 44 113 87 200
PR Total 116 246 170 416
Up to 50 bovines 22 25 19 44
50+ bovines 15 84 66 150
Total 37 109 85 194
Up to 50 bovines 10 14 6 20
50+ bovines 17 108 66 174
Total 27 122 72 194
Up to 50 bovines 18 25 10 35
50+ bovines 16 105 58 163
Total 34 130 68 198
RO Total 61 252 140 392
Up to 50 bovines 19 24 14 38
50+ bovines 16 89 71 160
Total 35 113 85 198
Up to 50 bovines 39 50 28 78
50+ bovines 12 71 52 123
Total 51 121 80 201
RS Total 86 234 165 399
Up to 50 bovines 48 54 42 96
50+ bovines 11 58 52 110
Total 59 112 94 206
Up to 50 bovines 21 27 15 42
50+ bovines 16 106 54 160
Total 37 133 69 202
Up to 50 bovines 9 12 6 18
50+ bovines 18 111 69 180
Total 27 123 75 198
Total 786 2584 1748 4332
Rio
Gra
nd
e d
o S
ul
Border
Non-border
Sergipe
São Paulo
Tocantins
Pará
Pa
ran
á
Border
Non-border
Rio de Janeiro
Ro
nd
ôn
ia
Border
Non-border
Goiás
Minas Gerais
Ma
to G
ross
o d
o S
ul
Border
Non-border
Ma
to G
ross
o Border
Non-border
Acr
eBorder
Non-border
Bahia
Distrito Federal
Espírito Santo
State Region CategorySample
Table 01. Estimates of samples for each subpopulation involved in the FMD vaccination efficiency study

Federal Republic of Brazil Ministry of Agriculture, Livestock and Food Supply Secretariat of Animal and Plant Health and Inspection
5 Department of Animal Health - Esplanada dos Ministérios – Ministry of Agriculture, Livestock, and Food Supply - Block A (annex) - Brasília – DF zip code:: 70.043-900 - tel:+55 61 3218-2701 - fax:+55 61 3226-3446
Department of Animal Health
The analytical method used to assess the immunity level of the bovine population was the enzyme-linked
immunosorbent assay (ELISA-LPB) standardized by PANAFTOSA to detect specific antibodies against proteins of the
virus capsid (structural or capsid proteins). Information on such assay is presented in the final report published by
DSA/SDA/MAPA in 2007. In addition, Figure 2 shows a logistic regression function resulting from the statistical
analysis between the indirect (level of antibodies) and direct response (outcome of the PGP - podal generalization
test), revealing the existence of significant co-relationship between circulating antibody titers and PGP protection.
0%
10%
20%
30%
40%
50%
60%
70%
80%
90%
100%
1.00 1.10 1.20 1.30 1.40 1.50 1.60 1.70 1.80 1.90 2.00 2.10 2.20 2.30 2.40 2.50 2.60 2.70
Exp
ect
ati
on
s o
f P
rote
ctio
n (
EP
P)
ELISA CFL Titers
O Virus
A Virus
C Virus
Figure 02. Expectation of protection – ELISA LPB (polyclonal detector), according to FMD types of viruses (O, A and C)
Source: PANAFTOSA
The model may be used both as a regression function and a discriminating function. In the first situation, we
may estimate the probability of being protected based on knowing its antibody titers, and, in the second
situation, by first establishing a cut-off value (or discriminating) and then classifying, based on knowing a
bovine’s antibody titers, if such animal belongs to the population of protected or not protected bovine
whenever exposed to 10.000 bovine infectious doses (Bid 50%) of the FMD virus.
The sensitivity and specificity of the diagnostic test used to assess the immunity level of the bovine population
are determined by the cut-off point that is going to be used in order to classify, based on antibody titers
measured by ELISA-LPB, if the bovine belongs to the population of protected or not protected . Bovine which

Federal Republic of Brazil Ministry of Agriculture, Livestock and Food Supply Secretariat of Animal and Plant Health and Inspection
6 Department of Animal Health - Esplanada dos Ministérios – Ministry of Agriculture, Livestock, and Food Supply - Block A (annex) - Brasília – DF zip code:: 70.043-900 - tel:+55 61 3218-2701 - fax:+55 61 3226-3446
Department of Animal Health
serum reveal titer below the cut-off or discriminating value are classified as not protected, whereas those with
titer equal or above the cut-off or discriminating value are classified as protected. The sample size determined
for the investigation also depends on the sensitivity and specificity of the diagnostic method.
During the planning stage of this study we considered the country’s experience accumulated from studies
conducted since 2005. Initially, we decided to consider, in determining the size of bovine sample, figures for
sensitivity and specificity of the diagnostic method as equal to 0.8333 for evaluation of any of the valences
present in the vaccines against the FMD disease that are manufactured and used in Brazil. At first, the
intention was to quickly define the information on the samples size to begin field collection activities and,
within laboratories, proceed with determining the cut-off point to be used to evaluate each valence,
corresponding to the sensitivity and specificity considered to determine the size of the sample.
Following that, handling three different dilutions with bovine serums, determined by using different cut-off
point for each valence of vaccine strains, would affect the laboratory’s performance with regards to how fast it
could analyze the samples collected. In this context, we decided to use titer 2.1 as the cut-off point for ELISA-
LPB, for any of the vaccine strains. Respectively corresponding to that cut-off value, we have the strains: O1
Campos, A24 Cruzeiro and C3 Indaial, expectations of protection 0.9272; 0.8599 and 0.8577. Based on such
protection expectations, and using the regression logistic function, we established sensitivity and specificity
values for each one of the vaccine strains, considering the cut-off titer as ≥ 2.1 with ELISA-LPB, as shown in the
chart below:
Source: PANAFTOSA
Once independent tests have been carried out for each virus strain in each of the subpopulations, the method to
classify the bovine as truly protected or not protected may be through individual, series or parallel tests. For
individual interpretation, we use the sensitivity and specificity values presented in the previous chart to calculate
the real prevalence. The adoption of tests in series or in parallel imply in sensitivity and specificity values resulting
from the combination of the tests, according to the follow possibilities:
Sensitivity and specificity values and 95% confidence limits for the three types of viruses.
Titer with ELISA-LPB (Cut off point ≥ 2.1)
Sensitivity (%) Specificity (%) Vaccine strain
Value Lowest limit Highest limit Value Lowest limit Highest limit
O1 Campos 81.67 74.74 88.59 85.71 78.23 93.20
A24 Cruzeiro 70.80 66.27 75.33 91.49 83.51 99.47
C3 Indaial 65.64 58.98 72.31 69.44 54.40 84.49

Federal Republic of Brazil Ministry of Agriculture, Livestock and Food Supply Secretariat of Animal and Plant Health and Inspection
7 Department of Animal Health - Esplanada dos Ministérios – Ministry of Agriculture, Livestock, and Food Supply - Block A (annex) - Brasília – DF zip code:: 70.043-900 - tel:+55 61 3218-2701 - fax:+55 61 3226-3446
Department of Animal Health
Sensitivity Specificity
• Evaluation of the three tests in parallel 98.2% 54.5%
• Evaluation of the three tests in series 38.0% 99.6%
• Evaluation of tests O and A in parallel: 94.6% 78.4%
• Evaluation of tests O and C in parallel: 93.7% 59.5%
• Evaluation of tests A and C in parallel: 90.0% 63.5%
• Evaluation of tests O and A in series: 57.8% 98.8%
• Evaluation of tests O and C in series: 53.6% 95.6%
• Evaluation of tests A and C in series: 46.5% 97.4%
Out of the figures found, we may observe that the best balance of sensitivity and specificity value is obtained
by using two tests, two by two, in parallel; thus choosing this method for interpretation of the outcomes of the
laboratory tests employed. The use of three tests in parallel or in series produces expressive losses in
specificity and sensitivity values, respectively. On the other hand, using tests two by two and in series leads to
losses in sensitivity values.
In order to determine confidence limits for the real proportion of protected animals we used the method
proposed by Lew and Levy (1989)1, “Bayesian” estimator, as an estimator of the real proportion of protected
animals, instead of the traditional maximum likelihood estimator of the true prevalence and its variance in the
evaluation of screening studies. To calculate the corrected prevalences (CP) the following programs were used:
X(PLORE)2 and EpiTools epidemiological calculators
3, selection “Bayesian estimation of true prevalence from
survey testing with one or two tests”.
6. Results and Discussions
Table 2 provides information on the samples collected from each subpopulation. There was good
correspondence between the total expected number of samples and the total number collected (comparing
with Table 01). Generally speaking, small differences between the expected and the total amount of bovine
samples collected amidst the age groups being addressed were found in Bahia (four samples), Federal District
(four samples), Mato Grosso do Sul (two samples), Mato Grosso (one sample), Paraná (two samples) and Rio
Grande do Sul (two samples). The average time-frame between collection and the last vaccination varied from
3.3 months on the Mato Grosso do Sul border to 5.2 months on the Rio Grande do Sul border. The average
time frame for the entire foot-and-mouth disease free zone was of 4.3 months.
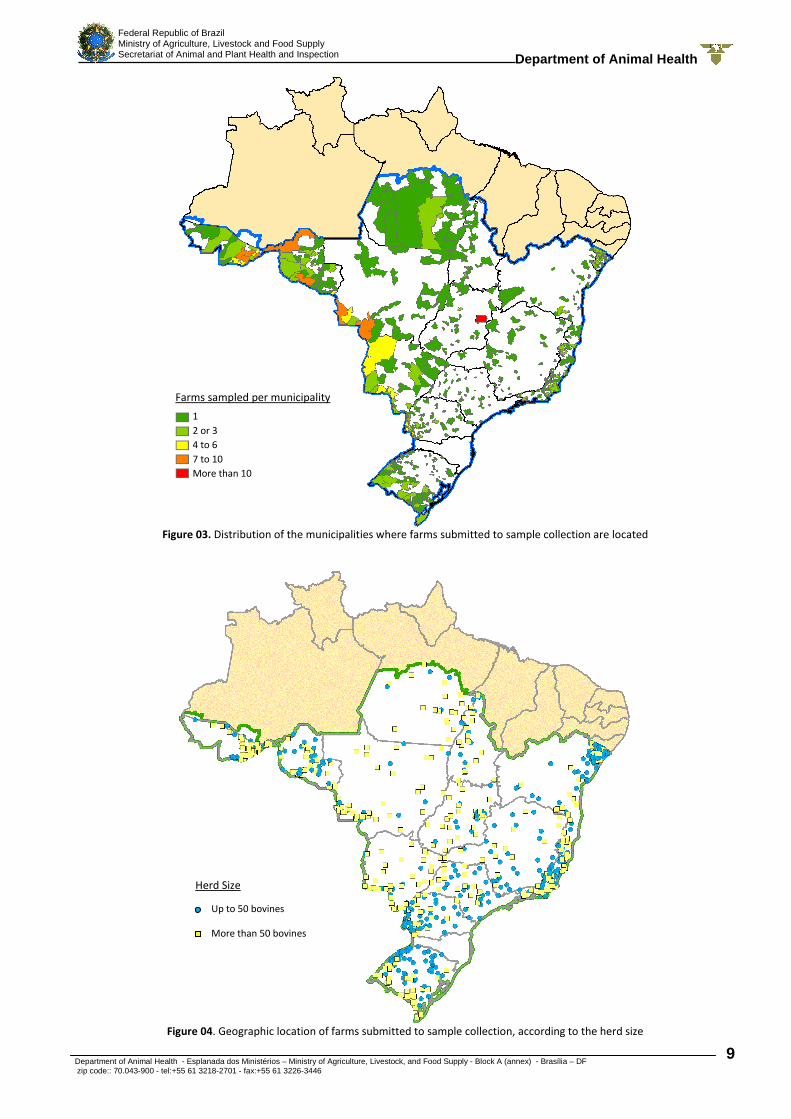
Figures 3 and 4 allow evaluating the geographic distribution of the municipalities where the farms, from which
samples were collected, are located; and show their space distribution according to the herd size (up to 50
bovines and more than 50 bovines).
1 Lew, R. A. & Levy, P. S. (1989) Estimation of prevalence on the basis of screening tests. Statistics in Medicine, v. 8, 1225-1230.
2 David Meredith. (2001) Department of Mathematics, San Francisco State University San Francisco. CA 94132
3 Sergeant, ESG, 2009. Epitools epidemiological calculators. AusVet Animal Health Services and Australian Biosecurity Cooperative
Research Centre for Emerging Infectious Disease. Available at: http://epitools.ausvet.com.au.

Federal Republic of Brazil Ministry of Agriculture, Livestock and Food Supply Secretariat of Animal and Plant Health and Inspection
8 Department of Animal Health - Esplanada dos Ministérios – Ministry of Agriculture, Livestock, and Food Supply - Block A (annex) - Brasília – DF zip code:: 70.043-900 - tel:+55 61 3218-2701 - fax:+55 61 3226-3446
Department of Animal Health
Holdings 6-to-12 m. Bovines 13 to 24 m. bovines Total Bovines
Up to 50 bovines 11 14 8 22 141
50+ bovines 17 103 68 171 135
Total 28 117 76 193 137
Up to 50 bovines 9 11 7 18 131
50+ bovines 17 102 72 174 126
Total 26 113 79 192 128
AC Total 54 230 155 385 133
Up to 50 bovines 26 34 26 60 138
50+ bovines 15 65 69 134 132
Total 41 99 95 194 136
Up to 50 bovines 40 48 30 78 148
50+ bovines 12 70 48 118 151
Total 52 118 78 196 149
Up to 50 bovines 18 21 15 36 106
50+ bovines 16 92 68 160 117
Total 34 113 83 196 111
Up to 50 bovines 7 9 5 14 112
50+ bovines 17 93 81 174 114
Total 24 102 86 188 114
Up to 50 bovines 24 30 18 48 110
50+ bovines 15 89 61 150 114
Total 39 119 79 198 112
Up to 50 bovines 10 13 7 20 88
50+ bovines 18 102 70 172 106
Total 28 115 77 192 100
Up to 50 bovines 3 4 2 6 113
50+ bovines 18 111 73 184 112
Total 21 115 75 190 112
MS Total 49 230 152 382 105
Up to 50 bovines 4 6 2 8 154
50+ bovines 19 117 73 190 154
Total 23 123 75 198 154
Up to 50 bovines 5 7 3 10 151
50+ bovines 18 114 68 182 151
Total 23 121 71 192 151
MT Total 46 244 146 390 152
Up to 50 bovines 6 7 5 12 129
50+ bovines 18 108 72 180 128
Total 24 115 77 192 128
Up to 50 bovines 63 77 49 126 124
50+ bovines 9 53 35 88 128
Total 72 130 84 214 125
Up to 50 bovines 30 35 25 60 129
50+ bovines 14 78 62 140 131
Total 44 113 87 200 130
PR Total 116 243 171 414 127
Up to 50 bovines 20 24 16 40 138
50+ bovines 17 85 69 154 136
Total 37 109 85 194 137
Up to 50 bovines 10 14 6 20 140
50+ bovines 17 108 66 174 144
Total 27 122 72 194 143
Up to 50 bovines 18 25 10 35 143
50+ bovines 16 105 58 163 132
Total 34 130 68 198 138
RO Total 61 252 140 392 140
Até 50 bovinos 17 21 13 34 151
Mais de 50 bovinos 18 93 71 164 160
Total 35 114 84 198 155
Up to 50 bovines 39 51 27 78 144
50+ bovines 12 67 54 121 156
Total 51 118 81 199 146
RS Total 86 232 165 397 150
Up to 50 bovines 44 56 40 96 121
50+ bovines 15 60 50 110 122
Total 59 116 90 206 121
Up to 50 bovines 21 27 15 42 104
50+ bovines 16 106 54 160 115
Total 37 133 69 202 109
Up to 50 bovines 9 12 6 18 129
50+ bovines 18 117 63 180 124
Total 27 129 69 198 126
Total 786 2584 1740 4324 130
Sergipe
São Paulo
Ma
to G
ross
o d
o S
ul
Ma
to G
ross
o
Non-border
Pará
Border
Pa
ran
áA
cre
Region
Ro
nd
ôn
iaR
io G
ran
de
do
Su
lSample
State
Border
Average time between vaccination
and sampling (days)
Border
Non-border
Tocantins
Non-border
Rio de Janeiro
Border
Non-border
Border
Non-border
Bahia
Distrito Federal
Espírito Santo
Goiás
Minas Gerais
Border
Non-border
Category
Table 02. Total amount of collected samples, per herd size and age groups, and average time-lapse between collection
and the last vaccination against foot-and-mouth disease on that farms
Federal Republic of Brazil Ministry of Agriculture, Livestock and Food Supply Secretariat of Animal and Plant Health and Inspection
9 Department of Animal Health - Esplanada dos Ministérios – Ministry of Agriculture, Livestock, and Food Supply - Block A (annex) - Brasília – DF zip code:: 70.043-900 - tel:+55 61 3218-2701 - fax:+55 61 3226-3446
Department of Animal Health
Figure 03. Distribution of the municipalities where farms submitted to sample collection are located
Figure 04. Geographic location of farms submitted to sample collection, according to the herd size
Farms sampled per municipality
1
2 or 3
4 to 6
7 to 10
More than 10
Herd Size
Up to 50 bovines
More than 50 bovines
Federal Republic of Brazil Ministry of Agriculture, Livestock and Food Supply Secretariat of Animal and Plant Health and Inspection
10 Department of Animal Health - Esplanada dos Ministérios – Ministry of Agriculture, Livestock, and Food Supply - Block A (annex) - Brasília – DF zip code:: 70.043-900 - tel:+55 61 3218-2701 - fax:+55 61 3226-3446
Department of Animal Health
73%71% 70%
90%
84% 84%
0%
10%
20%
30%
40%
50%
60%
70%
80%
90%
100%
O A C O A C
6 to 12 m 13 to 24 m
Tested Protected Averege LL HLO 2584 1725 67% 73% 68% 78%A 2584 1880 73% 71% 63% 62%C 2584 2017 78% 70% 62% 78%O 1740 1482 85% 90% 87% 93%A 1740 1508 87% 84% 77% 90%C 1740 1588 91% 84% 77% 90%
OPCP (CI 95%)
6 to 12 m
13 to 24 m
Age VírusBovines
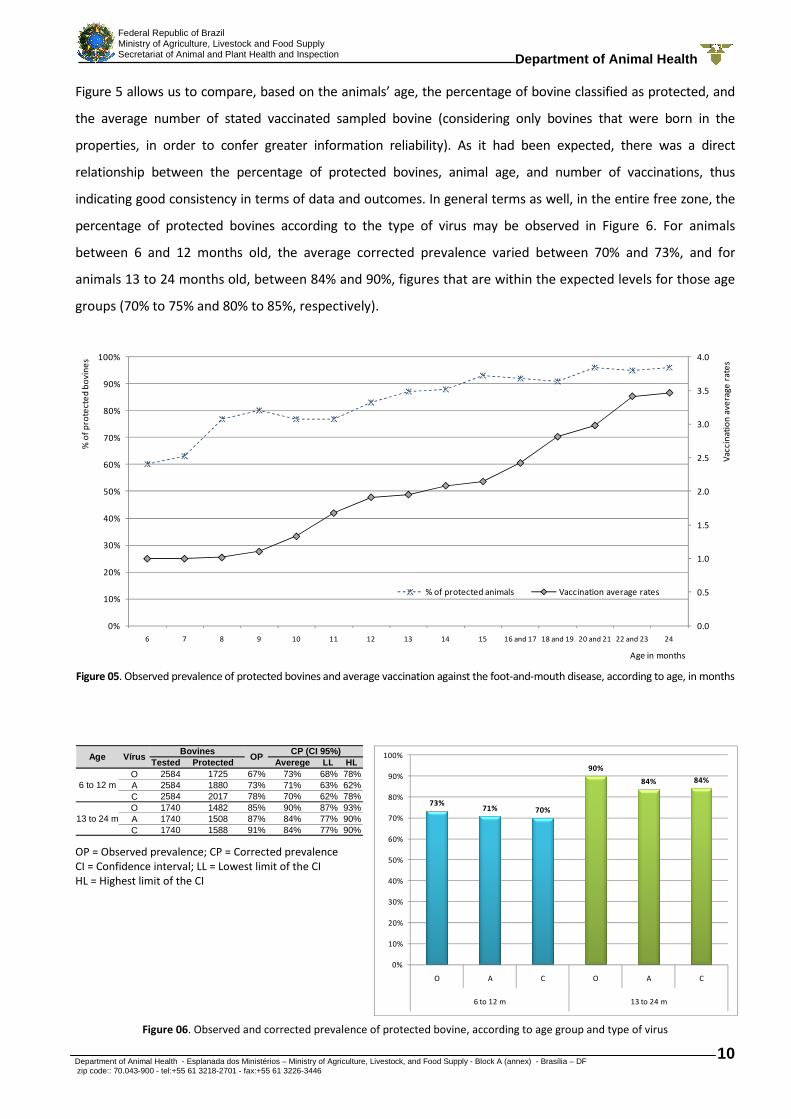
Figure 5 allows us to compare, based on the animals’ age, the percentage of bovine classified as protected, and
the average number of stated vaccinated sampled bovine (considering only bovines that were born in the
properties, in order to confer greater information reliability). As it had been expected, there was a direct
relationship between the percentage of protected bovines, animal age, and number of vaccinations, thus
indicating good consistency in terms of data and outcomes. In general terms as well, in the entire free zone, the
percentage of protected bovines according to the type of virus may be observed in Figure 6. For animals
between 6 and 12 months old, the average corrected prevalence varied between 70% and 73%, and for
animals 13 to 24 months old, between 84% and 90%, figures that are within the expected levels for those age
groups (70% to 75% and 80% to 85%, respectively).
0.0
0.5
1.0
1.5
2.0
2.5
3.0
3.5
4.0
0%
10%
20%
30%
40%
50%
60%
70%
80%
90%
100%
6 7 8 9 10 11 12 13 14 15 16 and 17 18 and 19 20 and 21 22 and 23 24
Va
cc
ina
tio
n a
ve
rag
e r
ate
s
% o
f p
rote
cte
d b
ov
ine
s
Age in months
% of protected animals Vaccination average rates
Figure 05. Observed prevalence of protected bovines and average vaccination against the foot-and-mouth disease, according to age, in months
Figure 06. Observed and corrected prevalence of protected bovine, according to age group and type of virus
OP = Observed prevalence; CP = Corrected prevalence
CI = Confidence interval; LL = Lowest limit of the CI
HL = Highest limit of the CI
Federal Republic of Brazil Ministry of Agriculture, Livestock and Food Supply Secretariat of Animal and Plant Health and Inspection
11 Department of Animal Health - Esplanada dos Ministérios – Ministry of Agriculture, Livestock, and Food Supply - Block A (annex) - Brasília – DF zip code:: 70.043-900 - tel:+55 61 3218-2701 - fax:+55 61 3226-3446
Department of Animal Health
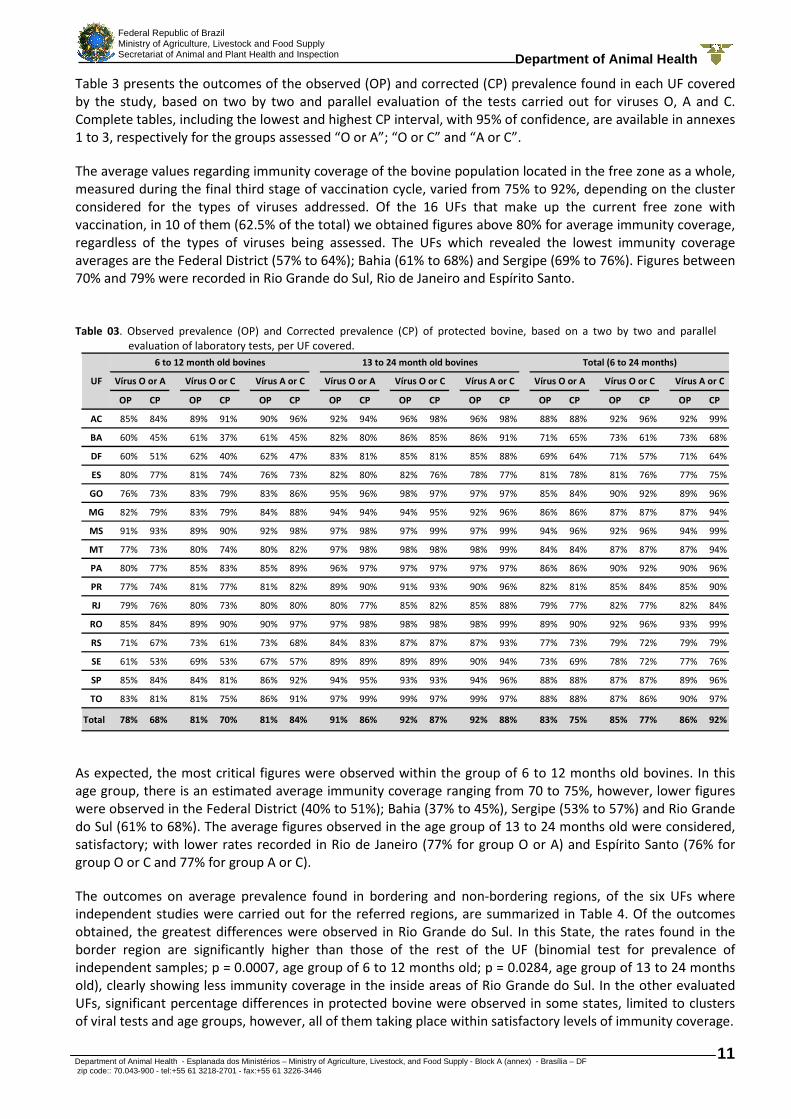
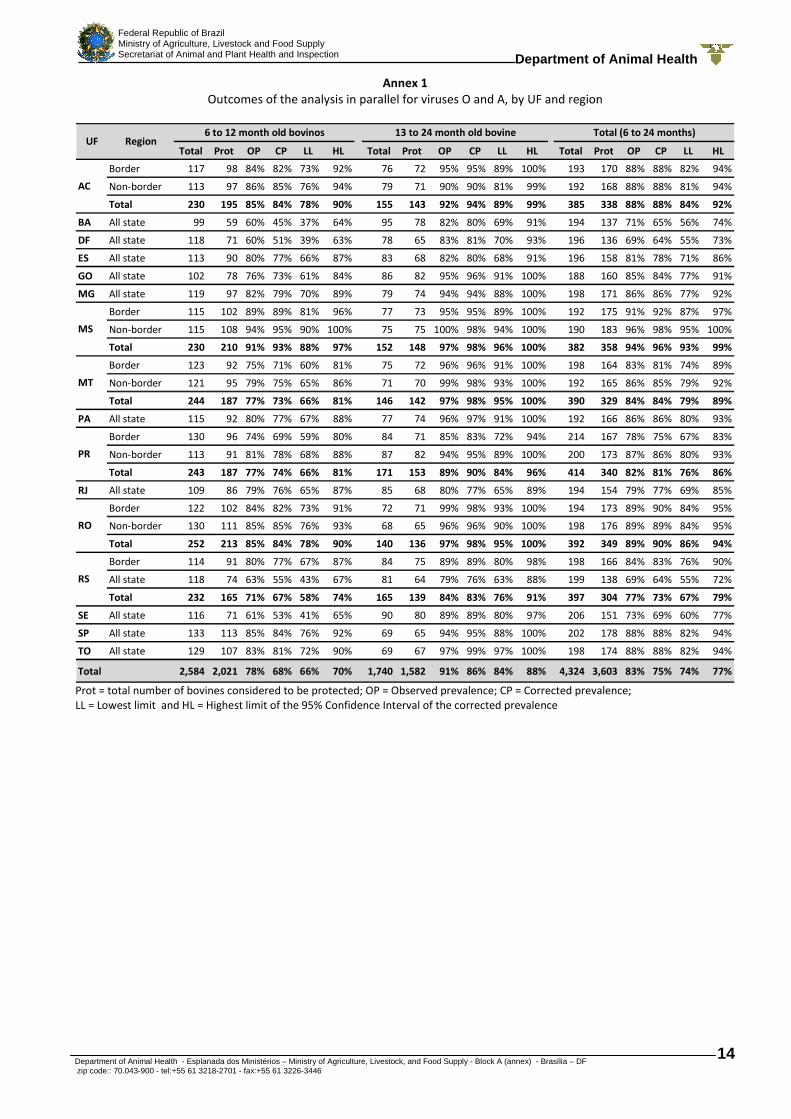
Table 3 presents the outcomes of the observed (OP) and corrected (CP) prevalence found in each UF covered
by the study, based on two by two and parallel evaluation of the tests carried out for viruses O, A and C.
Complete tables, including the lowest and highest CP interval, with 95% of confidence, are available in annexes
1 to 3, respectively for the groups assessed “O or A”; “O or C” and “A or C”.
The average values regarding immunity coverage of the bovine population located in the free zone as a whole,
measured during the final third stage of vaccination cycle, varied from 75% to 92%, depending on the cluster
considered for the types of viruses addressed. Of the 16 UFs that make up the current free zone with
vaccination, in 10 of them (62.5% of the total) we obtained figures above 80% for average immunity coverage,
regardless of the types of viruses being assessed. The UFs which revealed the lowest immunity coverage
averages are the Federal District (57% to 64%); Bahia (61% to 68%) and Sergipe (69% to 76%). Figures between
70% and 79% were recorded in Rio Grande do Sul, Rio de Janeiro and Espírito Santo.
Table 03. Observed prevalence (OP) and Corrected prevalence (CP) of protected bovine, based on a two by two and parallel
evaluation of laboratory tests, per UF covered.
OP CP OP CP OP CP OP CP OP CP OP CP OP CP OP CP OP CP
AC 85% 84% 89% 91% 90% 96% 92% 94% 96% 98% 96% 98% 88% 88% 92% 96% 92% 99%
BA 60% 45% 61% 37% 61% 45% 82% 80% 86% 85% 86% 91% 71% 65% 73% 61% 73% 68%
DF 60% 51% 62% 40% 62% 47% 83% 81% 85% 81% 85% 88% 69% 64% 71% 57% 71% 64%
ES 80% 77% 81% 74% 76% 73% 82% 80% 82% 76% 78% 77% 81% 78% 81% 76% 77% 75%
GO 76% 73% 83% 79% 83% 86% 95% 96% 98% 97% 97% 97% 85% 84% 90% 92% 89% 96%
MG 82% 79% 83% 79% 84% 88% 94% 94% 94% 95% 92% 96% 86% 86% 87% 87% 87% 94%
MS 91% 93% 89% 90% 92% 98% 97% 98% 97% 99% 97% 99% 94% 96% 92% 96% 94% 99%
MT 77% 73% 80% 74% 80% 82% 97% 98% 98% 98% 98% 99% 84% 84% 87% 87% 87% 94%
PA 80% 77% 85% 83% 85% 89% 96% 97% 97% 97% 97% 97% 86% 86% 90% 92% 90% 96%
PR 77% 74% 81% 77% 81% 82% 89% 90% 91% 93% 90% 96% 82% 81% 85% 84% 85% 90%
RJ 79% 76% 80% 73% 80% 80% 80% 77% 85% 82% 85% 88% 79% 77% 82% 77% 82% 84%
RO 85% 84% 89% 90% 90% 97% 97% 98% 98% 98% 98% 99% 89% 90% 92% 96% 93% 99%
RS 71% 67% 73% 61% 73% 68% 84% 83% 87% 87% 87% 93% 77% 73% 79% 72% 79% 79%
SE 61% 53% 69% 53% 67% 57% 89% 89% 89% 89% 90% 94% 73% 69% 78% 72% 77% 76%
SP 85% 84% 84% 81% 86% 92% 94% 95% 93% 93% 94% 96% 88% 88% 87% 87% 89% 96%
TO 83% 81% 81% 75% 86% 91% 97% 99% 99% 97% 99% 97% 88% 88% 87% 86% 90% 97%
Total 78% 68% 81% 70% 81% 84% 91% 86% 92% 87% 92% 88% 83% 75% 85% 77% 86% 92%
Vírus A or C Vírus O or A Vírus O or C Vírus A or CUF
6 to 12 month old bovines 13 to 24 month old bovines Total (6 to 24 months)
Vírus O or A Vírus O or C Vírus A or C Vírus O or A Vírus O or C
As expected, the most critical figures were observed within the group of 6 to 12 months old bovines. In this
age group, there is an estimated average immunity coverage ranging from 70 to 75%, however, lower figures
were observed in the Federal District (40% to 51%); Bahia (37% to 45%), Sergipe (53% to 57%) and Rio Grande
do Sul (61% to 68%). The average figures observed in the age group of 13 to 24 months old were considered,
satisfactory; with lower rates recorded in Rio de Janeiro (77% for group O or A) and Espírito Santo (76% for
group O or C and 77% for group A or C).
The outcomes on average prevalence found in bordering and non-bordering regions, of the six UFs where
independent studies were carried out for the referred regions, are summarized in Table 4. Of the outcomes
obtained, the greatest differences were observed in Rio Grande do Sul. In this State, the rates found in the
border region are significantly higher than those of the rest of the UF (binomial test for prevalence of
independent samples; p = 0.0007, age group of 6 to 12 months old; p = 0.0284, age group of 13 to 24 months
old), clearly showing less immunity coverage in the inside areas of Rio Grande do Sul. In the other evaluated
UFs, significant percentage differences in protected bovine were observed in some states, limited to clusters
of viral tests and age groups, however, all of them taking place within satisfactory levels of immunity coverage.

Federal Republic of Brazil Ministry of Agriculture, Livestock and Food Supply Secretariat of Animal and Plant Health and Inspection
12 Department of Animal Health - Esplanada dos Ministérios – Ministry of Agriculture, Livestock, and Food Supply - Block A (annex) - Brasília – DF zip code:: 70.043-900 - tel:+55 61 3218-2701 - fax:+55 61 3226-3446
Department of Animal Health
Table 04. Observed prevalence (OP) and Corrected prevalence (CP) of protected bovines, based on a two by two and parallel evaluation
of laboratory tests, according to bordering and non-bordering regions.
OP CP OP CP OP CP OP CP OP CP OP CP OP CP OP CP OP CPBorder 84% 82% 85% 83% 85% 90% 95% 95% 96% 96% 96% 97% 88% 88% 90% 92% 90% 96%
Non-border 86% 85% 93% 95% 94% 97% 90% 90% 96% 96% 96% 97% 88% 88% 94% 97% 95% 98%
Total 85% 84% 89% 91% 90% 96% 92% 94% 96% 98% 96% 98% 88% 88% 92% 9 6% 92% 99%Border 89% 89% 85% 83% 88% 93% 95% 95% 96% 96% 95% 97% 91% 92% 90% 91% 91% 97%
Non-border 94% 95% 92% 94% 96% 98% 100% 98% 99% 97% 100% 98% 96% 98% 95% 98% 97% 99%
Total 91% 93% 89% 90% 92% 98% 97% 98% 97% 99% 97% 99% 94% 96% 92% 9 6% 94% 99%Border 75% 71% 80% 73% 80% 80% 96% 96% 97% 97% 97% 97% 83% 81% 86% 86% 86% 92%
Non-border 79% 75% 81% 75% 81% 82% 99% 98% 99% 97% 99% 97% 86% 85% 88% 88% 88% 94%
Total 77% 73% 80% 74% 80% 82% 97% 98% 98% 98% 98% 99% 84% 84% 87% 8 7% 87% 94%Border 74% 69% 80% 73% 79% 79% 85% 83% 87% 86% 87% 91% 78% 75% 83% 79% 82% 85%
Non-border 81% 78% 83% 79% 82% 85% 94% 95% 94% 95% 93% 96% 87% 86% 88% 89% 87% 93%
Total 77% 74% 81% 77% 81% 82% 89% 90% 91% 93% 90% 96% 82% 81% 85% 8 4% 85% 90%Border 84% 82% 85% 83% 87% 92% 99% 98% 99% 97% 99% 97% 89% 90% 90% 92% 91% 97%
Non-border 85% 85% 92% 95% 92% 97% 96% 96% 97% 96% 97% 97% 89% 89% 94% 97% 94% 98%
Total 85% 84% 89% 90% 90% 97% 97% 98% 98% 98% 98% 99% 89% 90% 92% 9 6% 93% 99%Border 80% 77% 83% 79% 83% 86% 89% 89% 93% 94% 93% 96% 84% 83% 87% 87% 87% 94%
Non-border 63% 55% 64% 43% 64% 50% 79% 76% 81% 76% 81% 83% 69% 64% 71% 57% 71% 64%
Total 71% 67% 73% 61% 73% 68% 84% 83% 87% 87% 87% 93% 77% 73% 79% 7 2% 79% 79%
Total 78% 68% 81% 70% 81% 84% 91% 86% 92% 87% 92% 88% 83% 75% 85% 7 7% 86% 92%
6 to 12 month old bovinesState Region
AC
MS
RO
RS
Vírus O or A Vírus O or C Vírus A or C
MT
PR
13 to 24 month old bovinesVírus O or A Vírus O or C Vírus A or C
Total (6 to 24 months)Vírus O or A Vírus O or C Vírus A or C
The outcomes observed for immunity coverage of the bovine population, according the herd size, may be
assessed in table 5. Such as we have observed in previous studies, immunity coverage of the bovine population
in herds with more than 50 animals has shown to be greater than such coverage found in bovine populations
of properties having up to 50 animals (p < 0.0001). Significant differences were observed in the Federal District
(p = 0.0187); Minas Gerais (p < 0.0001); Paraná (p = 0,0004); Rio de Janeiro (p = 0.0076); Rondônia (p =
0.0289); Rio Grande do Sul (p = 0.0186); Sergipe (p = 0.0175) and São Paulo (p = 0.0138). The small number of
observations of herds with up to 50 animals in Goiás, Mato Grosso, Mato Grosso do Sul, Pará and Tocantins,
did not allow for an accurate evaluation of these states.
Table 05. Observed prevalence of protected bovine, according to size of herd based on a two by two and parallel evaluation of
laboratory tests on the three virus strains
.
Bovine population in herds of up to 50 bovines Bovine population in herds of more than 50 bovines UF
Tested Protected Observed prevalence Tested Protected Observed prevalence
Acre 40 34 85% 345 321 93%
Bahia 60 41 68% 134 101 75%
Federal District 78 48 62% 118 91 77%
Espírito Santo 36 28 78% 160 133 83%
Goiás 14 11 79% 174 158 91%
Minas Gerais 48 32 67% 150 142 95%
Mato Grosso do Sul 26 25 96% 356 338 95%
Mato Grosso 18 15 83% 372 324 87%
Pará 12 10 83% 180 163 91%
Paraná 186 146 78% 228 207 91%
Rio de Janeiro 40 27 68% 154 132 86%
Rondônia 55 47 85% 337 316 94%
Rio Grande do Sul 112 80 71% 285 234 82%
Sergipe 96 68 71% 110 93 85%
São Paulo 42 33 79% 160 147 92%
Tocantins 18 14 78% 180 165 92%
Total 881 659 75% 3,443 3,065 89%
Federal Republic of Brazil Ministry of Agriculture, Livestock and Food Supply Secretariat of Animal and Plant Health and Inspection
13 Department of Animal Health - Esplanada dos Ministérios – Ministry of Agriculture, Livestock, and Food Supply - Block A (annex) - Brasília – DF zip code:: 70.043-900 - tel:+55 61 3218-2701 - fax:+55 61 3226-3446
Department of Animal Health
7. Final comments
The outcomes reveal satisfactory immunity coverage for foot-and-mouth disease in the bovine population
between 6 to 24 months old, located in most of the states within the FMD free zone with vaccination.
However, with aim at improving the rates of immunity protection, vaccination stages shall be strengthened in
some UFs, particularly toward the young animal population of the states of Bahia, the Federal District, Espírito
Santo, Paraná (border), Rio de Janeiro, Rio Grande do Sul (non border) and Sergipe. Particularly in the state of
Rio de Janeiro and the non-bordering region of Rio Grande do Sul, low levels of immunity protection were
recorded within both age groups, thus revealing the need for reviewing vaccination campaigns in those
locations.
In general, the bovine population of herds with up to 50 bovines presented the lowest immunity protection
rates, revealing the need for the SVEs to strengthen and expand their strategies to provide for small rural
properties, particularly in the Federal District (62%); Minas Gerais (67%); Bahia (68%); Rio de Janeiro (68%); Rio
Grande do Sul (71%) and Sergipe (71%).
Federal Republic of Brazil Ministry of Agriculture, Livestock and Food Supply Secretariat of Animal and Plant Health and Inspection
14 Department of Animal Health - Esplanada dos Ministérios – Ministry of Agriculture, Livestock, and Food Supply - Block A (annex) - Brasília – DF zip code:: 70.043-900 - tel:+55 61 3218-2701 - fax:+55 61 3226-3446
Department of Animal Health
Annex 1
Outcomes of the analysis in parallel for viruses O and A, by UF and region
Total Prot OP CP LL HL Total Prot OP CP LL HL Total Prot OP CP LL HL
Border 117 98 84% 82% 73% 92% 76 72 95% 95% 89% 100% 193 170 88% 88% 82% 94%
Non-border 113 97 86% 85% 76% 94% 79 71 90% 90% 81% 99% 192 168 88% 88% 81% 94%
Total 230 195 85% 84% 78% 90% 155 143 92% 94% 89% 99% 385 338 88% 88% 84% 92%
BA All state 99 59 60% 45% 37% 64% 95 78 82% 80% 69% 91% 194 137 71% 65% 56% 74%
DF All state 118 71 60% 51% 39% 63% 78 65 83% 81% 70% 93% 196 136 69% 64% 55% 73%
ES All state 113 90 80% 77% 66% 87% 83 68 82% 80% 68% 91% 196 158 81% 78% 71% 86%
GO All state 102 78 76% 73% 61% 84% 86 82 95% 96% 91% 100% 188 160 85% 84% 77% 91%
MG All state 119 97 82% 79% 70% 89% 79 74 94% 94% 88% 100% 198 171 86% 86% 77% 92%
Border 115 102 89% 89% 81% 96% 77 73 95% 95% 89% 100% 192 175 91% 92% 87% 97%
Non-border 115 108 94% 95% 90% 100% 75 75 100% 98% 94% 100% 190 183 96% 98% 95% 100%
Total 230 210 91% 93% 88% 97% 152 148 97% 98% 96% 100% 382 358 94% 96% 93% 99%
Border 123 92 75% 71% 60% 81% 75 72 96% 96% 91% 100% 198 164 83% 81% 74% 89%
Non-border 121 95 79% 75% 65% 86% 71 70 99% 98% 93% 100% 192 165 86% 85% 79% 92%
Total 244 187 77% 73% 66% 81% 146 142 97% 98% 95% 100% 390 329 84% 84% 79% 89%
PA All state 115 92 80% 77% 67% 88% 77 74 96% 97% 91% 100% 192 166 86% 86% 80% 93%
Border 130 96 74% 69% 59% 80% 84 71 85% 83% 72% 94% 214 167 78% 75% 67% 83%
Non-border 113 91 81% 78% 68% 88% 87 82 94% 95% 89% 100% 200 173 87% 86% 80% 93%
Total 243 187 77% 74% 66% 81% 171 153 89% 90% 84% 96% 414 340 82% 81% 76% 86%
RJ All state 109 86 79% 76% 65% 87% 85 68 80% 77% 65% 89% 194 154 79% 77% 69% 85%
Border 122 102 84% 82% 73% 91% 72 71 99% 98% 93% 100% 194 173 89% 90% 84% 95%
Non-border 130 111 85% 85% 76% 93% 68 65 96% 96% 90% 100% 198 176 89% 89% 84% 95%
Total 252 213 85% 84% 78% 90% 140 136 97% 98% 95% 100% 392 349 89% 90% 86% 94%
Border 114 91 80% 77% 67% 87% 84 75 89% 89% 80% 98% 198 166 84% 83% 76% 90%
All state 118 74 63% 55% 43% 67% 81 64 79% 76% 63% 88% 199 138 69% 64% 55% 72%
Total 232 165 71% 67% 58% 74% 165 139 84% 83% 76% 91% 397 304 77% 73% 67% 79%
SE All state 116 71 61% 53% 41% 65% 90 80 89% 89% 80% 97% 206 151 73% 69% 60% 77%
SP All state 133 113 85% 84% 76% 92% 69 65 94% 95% 88% 100% 202 178 88% 88% 82% 94%
TO All state 129 107 83% 81% 72% 90% 69 67 97% 99% 97% 100% 198 174 88% 88% 82% 94%
Total 2,584 2,021 78% 68% 66% 70% 1,740 1,582 91% 86% 84% 88% 4,324 3,603 83% 75% 74% 77%
Total (6 to 24 months)
RS
RO
PR
MT
MS
AC
RegionUF6 to 12 month old bovinos 13 to 24 month old bovine
Prot = total number of bovines considered to be protected; OP = Observed prevalence; CP = Corrected prevalence;
LL = Lowest limit and HL = Highest limit of the 95% Confidence Interval of the corrected prevalence

Federal Republic of Brazil Ministry of Agriculture, Livestock and Food Supply Secretariat of Animal and Plant Health and Inspection
15 Department of Animal Health - Esplanada dos Ministérios – Ministry of Agriculture, Livestock, and Food Supply - Block A (annex) - Brasília – DF zip code:: 70.043-900 - tel:+55 61 3218-2701 - fax:+55 61 3226-3446
Department of Animal Health
Annex 2
Outcomes of the analysis in parallel for viruses O and C, by UF and region
Total Prot OP CP LL HL Total Prot OP CP LL HL Total Prot OP CP LL HL
Border 117 100 85% 83% 71% 96% 76 73 96% 96% 88% 100% 193 173 90% 92% 84% 99%
Non-border 113 105 93% 95% 87% 100% 79 76 96% 96% 89% 100% 192 181 94% 97% 93% 100%
Total 230 205 89% 91% 84% 98% 155 149 96% 98% 94% 100% 385 354 92% 96% 92% 100%
BA All state 99 60 61% 37% 20% 55% 95 82 86% 85% 71% 98% 194 142 73% 61% 48% 74%
DF All state 118 73 62% 40% 23% 56% 78 66 85% 81% 65% 98% 196 139 71% 57% 44% 70%
ES All state 113 91 81% 74% 59% 89% 83 68 82% 76% 59% 94% 196 159 81% 76% 65% 87%
GO All state 102 85 83% 79% 65% 94% 86 84 98% 97% 91% 100% 188 169 90% 92% 85% 99%
MG All state 119 99 83% 79% 66% 93% 79 74 94% 95% 85% 100% 198 173 87% 87% 79% 96%
Border 115 98 85% 83% 70% 96% 77 74 96% 96% 88% 100% 192 172 90% 91% 84% 99%
Non-border 115 106 92% 94% 86% 100% 75 74 99% 97% 90% 100% 190 180 95% 98% 93% 100%
Total 230 204 89% 90% 83% 97% 152 148 97% 99% 94% 100% 382 352 92% 96% 93% 100%
Border 123 98 80% 73% 58% 88% 75 73 97% 97% 89% 100% 198 171 86% 86% 76% 95%
Non-border 121 98 81% 75% 61% 90% 71 70 99% 97% 90% 100% 192 168 88% 88% 79% 96%
Total 244 196 80% 74% 64% 85% 146 143 98% 98% 95% 100% 390 339 87% 87% 81% 93%
PA All state 115 98 85% 83% 70% 96% 77 75 97% 97% 90% 100% 192 173 90% 92% 85% 99%
Border 130 104 80% 73% 59% 88% 84 73 87% 86% 71% 100% 214 177 83% 79% 68% 89%
Non-border 113 94 83% 79% 65% 93% 87 82 94% 95% 87% 100% 200 176 88% 89% 80% 97%
Total 243 198 81% 77% 67% 87% 171 155 91% 93% 86% 100% 414 353 85% 84% 77% 91%
RJ All state 109 87 80% 73% 57% 89% 85 72 85% 82% 66% 97% 194 159 82% 77% 66% 88%
Border 122 104 85% 83% 71% 96% 72 71 99% 97% 90% 100% 194 175 90% 92% 86% 99%
Non-border 130 120 92% 95% 87% 100% 68 66 97% 96% 88% 100% 198 186 94% 97% 93% 100%
Total 252 224 89% 90% 84% 97% 140 137 98% 98% 94% 100% 392 361 92% 96% 93% 100%
Border 114 95 83% 79% 66% 93% 84 78 93% 94% 85% 100% 198 173 87% 87% 79% 96%
All state 118 75 64% 43% 26% 60% 81 66 81% 76% 58% 93% 199 141 71% 57% 44% 70%
Total 232 170 73% 61% 49% 73% 165 144 87% 87% 77% 97% 397 314 79% 72% 64% 81%
SE All state 116 80 69% 53% 36% 70% 90 80 89% 89% 77% 100% 206 160 78% 72% 61% 84%
SP All state 133 112 84% 81% 69% 94% 69 64 93% 93% 82% 100% 202 176 87% 87% 78% 96%
TO All state 129 104 81% 75% 60% 89% 69 68 99% 97% 90% 100% 198 172 87% 86% 78% 95%
Total 2,584 2,086 81% 70% 68% 72% 1,740 1,609 92% 87% 85% 89% 4,324 3,695 85% 77% 76% 79%
RS
Total (6 to 24 months)
MS
MT
PR
RO
AC
UF Region6 to 12 month old bovinos 13 to 24 month old bovine
Prot = total number of bovines considered to be protected; OP = Observed prevalence; PC = Corrected prevalence;
LL = Lowest limit and HL = Highest limit of the 95% Confidence Interval of the corrected prevalence

Federal Republic of Brazil Ministry of Agriculture, Livestock and Food Supply Secretariat of Animal and Plant Health and Inspection
16 Department of Animal Health - Esplanada dos Ministérios – Ministry of Agriculture, Livestock, and Food Supply - Block A (annex) - Brasília – DF zip code:: 70.043-900 - tel:+55 61 3218-2701 - fax:+55 61 3226-3446
Department of Animal Health
Annex 3
Outcomes of the analysis in parallel for viruses A and C, according to UF and region
Total Prot OP CP LL HL Total Prot OP CP LL HL Total Prot OP CP LL HL
Border 117 100 85% 90% 80% 100% 76 73 96% 97% 90% 100% 193 173 90% 96% 91% 100%
Non-border 113 106 94% 97% 91% 100% 79 76 96% 97% 90% 100% 192 182 95% 98% 95% 100%
Total 230 206 90% 96% 92% 100% 155 149 96% 98% 95% 100% 385 355 92% 99% 96% 100%
BA All state 99 60 61% 45% 26% 63% 95 82 86% 91% 80% 100% 194 142 73% 68% 56% 80%
DF All state 118 73 62% 47% 30% 64% 78 66 85% 88% 74% 100% 196 139 71% 64% 51% 77%
ES All state 113 86 76% 73% 58% 89% 83 65 78% 77% 60% 100% 196 151 77% 75% 64% 87%
GO All state 102 85 83% 86% 74% 99% 86 83 97% 97% 91% 100% 188 168 89% 96% 90% 100%
MG All state 119 100 84% 88% 77% 99% 79 73 92% 96% 87% 100% 198 173 87% 94% 87% 100%
Border 115 101 88% 93% 43% 100% 77 73 95% 97% 89% 100% 192 174 91% 97% 92% 100%
Non-border 115 110 96% 98% 93% 100% 75 75 100% 98% 92% 100% 190 185 97% 99% 96% 100%
Total 230 211 92% 98% 94% 100% 152 148 97% 99% 95% 100% 382 359 94% 99% 97% 100%
Border 123 98 80% 80% 67% 93% 75 73 97% 97% 90% 100% 198 171 86% 92% 85% 99%
Non-border 121 98 81% 82% 70% 95% 71 70 99% 97% 91% 100% 192 168 88% 94% 87% 100%
Total 244 196 80% 82% 72% 91% 146 143 98% 99% 95% 100% 390 339 87% 94% 89% 98%
PA All state 115 98 85% 89% 79% 100% 77 75 97% 97% 91% 100% 192 173 90% 96% 92% 100%
Border 130 103 79% 79% 66% 92% 84 73 87% 91% 80% 100% 214 176 82% 85% 76% 94%
Non-border 113 93 82% 85% 72% 97% 87 81 93% 96% 89% 100% 200 174 87% 93% 87% 100%
Total 243 196 81% 82% 73% 91% 171 154 90% 96% 91% 100% 414 350 85% 90% 84% 95%
RJ All state 109 87 80% 80% 66% 94% 85 72 85% 88% 75% 100% 194 159 82% 84% 75% 94%
Border 122 106 87% 92% 83% 100% 72 71 99% 97% 91% 100% 194 177 91% 97% 93% 100%
Non-border 130 120 92% 97% 91% 100% 68 66 97% 97% 89% 100% 198 186 94% 98% 95% 100%
Total 252 226 90% 97% 92% 100% 140 137 98% 99% 95% 100% 392 363 93% 99% 97% 100%
Border 114 95 83% 86% 75% 98% 84 78 93% 96% 88% 100% 198 173 87% 94% 87% 100%
All state 118 75 64% 50% 33% 67% 81 66 81% 83% 67% 98% 199 141 71% 64% 51% 76%
Total 232 170 73% 68% 57% 80% 165 144 87% 93% 86% 100% 397 314 79% 79% 72% 87%
SE All state 116 78 67% 57% 40% 74% 90 81 90% 94% 85% 100% 206 159 77% 76% 65% 87%
SP All state 133 115 86% 92% 83% 100% 69 65 94% 96% 87% 100% 202 180 89% 96% 90% 100%
TO All state 129 111 86% 91% 82% 100% 69 68 99% 97% 90% 100% 198 179 90% 97% 92% 100%
Total 2,584 2,098 81% 84% 81% 86% 1,740 1,605 92% 88% 86% 90% 4,324 3,703 86% 92% 90% 94%
RS
Total (6 to 24 months)
MS
MT
PR
RO
AC
UF Region6 to 12 month old bovinos 13 to 24 month old bovine
Prot = total number of bovines considered to be protected; OP = Observed prevalence; CP = Corrected prevalence;
LL = Lowest limit and HL = Highest limit of the 95% Confidence Interval of the corrected prevalence