SEROLOGICAL DIAGNOSIS OF CHRONIC ATROPHIC GASTRITIS ...
26
SEROLOGICAL DIAGNOSIS OF CHRONIC ATROPHIC GASTRITIS RELATED TO HISTOLOGICAL EVALUATION: A CLINICAL STUDY ON 10,000 PATIENTS IN PRIMARY CARE SETTING Barchi Alberto Capasso Mario Cesario Silvia MoreMED, 10 aprile 2018
Transcript of SEROLOGICAL DIAGNOSIS OF CHRONIC ATROPHIC GASTRITIS ...

SEROLOGICAL DIAGNOSIS OF CHRONIC ATROPHIC GASTRITIS RELATED TO
HISTOLOGICAL EVALUATION:A CLINICAL STUDY ON 10,000 PATIENTS
IN PRIMARY CARE SETTING
Barchi AlbertoCapasso MarioCesario Silvia
MoreMED, 10 aprile 2018
ChronicAtrophic Gastritis
Atrophy with Fibrosis Atrophy with Intestinal Metaplasia
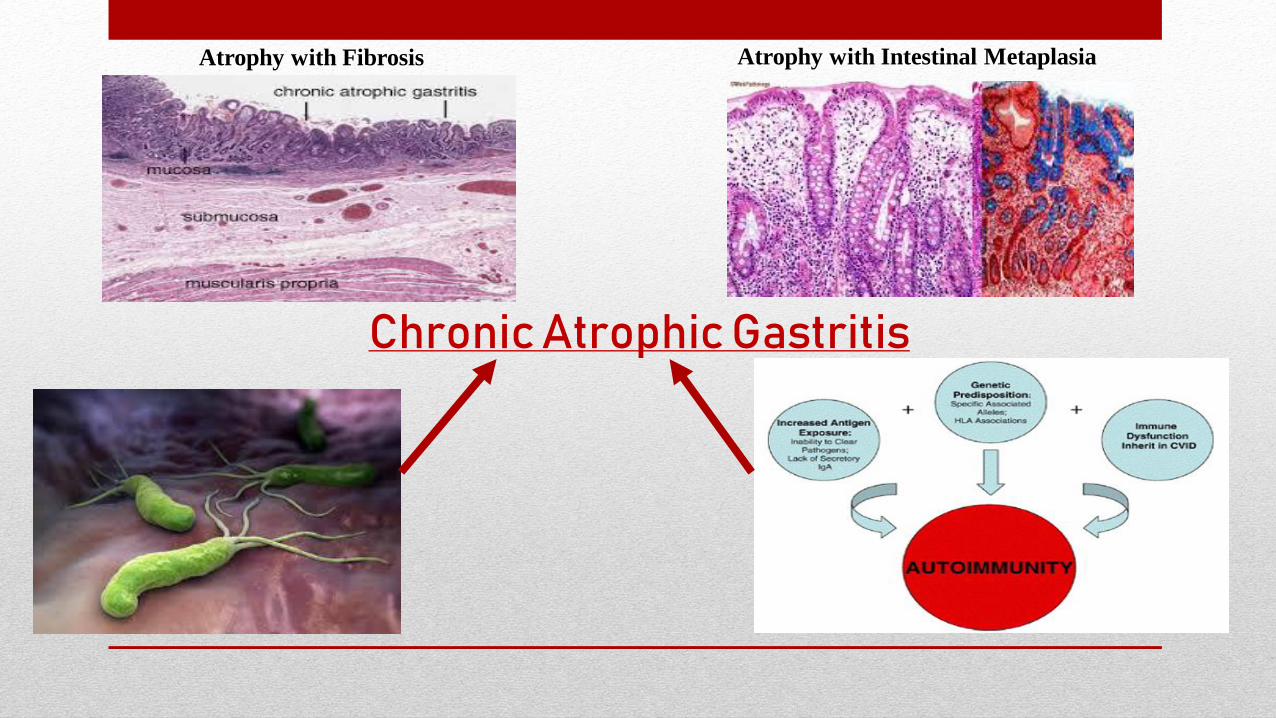
Normal Gastric Mucosa
Chronic Gastritis
Atrophic Gastritis
Intestinal Metaplasia
Dysplasia
Gastric Adenocarcinoma
The Multi-step of gastric carcinogenesis: “ Correa’s cascade”
H. pylori
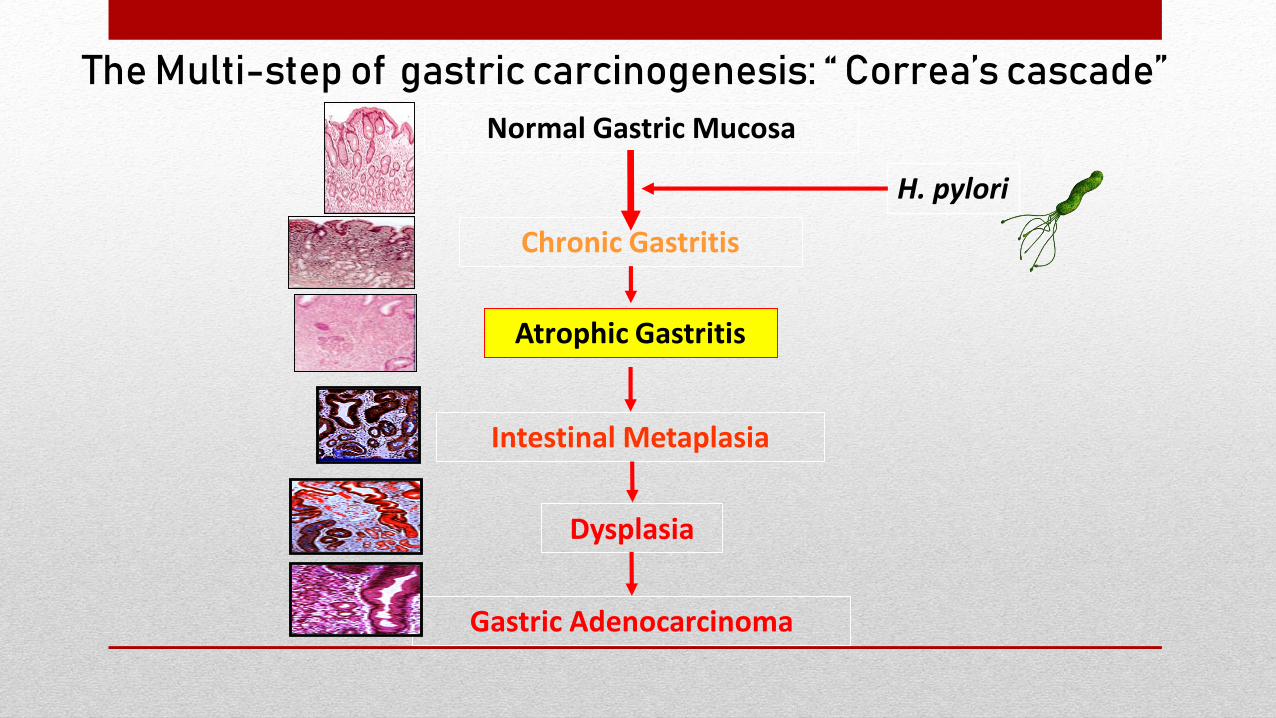
Gastric Cancer: Epidemiology
• Gastric Cancer is a relevant medical
issue worldwide.
951.594 diagnosis of GC
723.073 deaths
• In Italy 13.001 new cases, with 9.917 deaths.
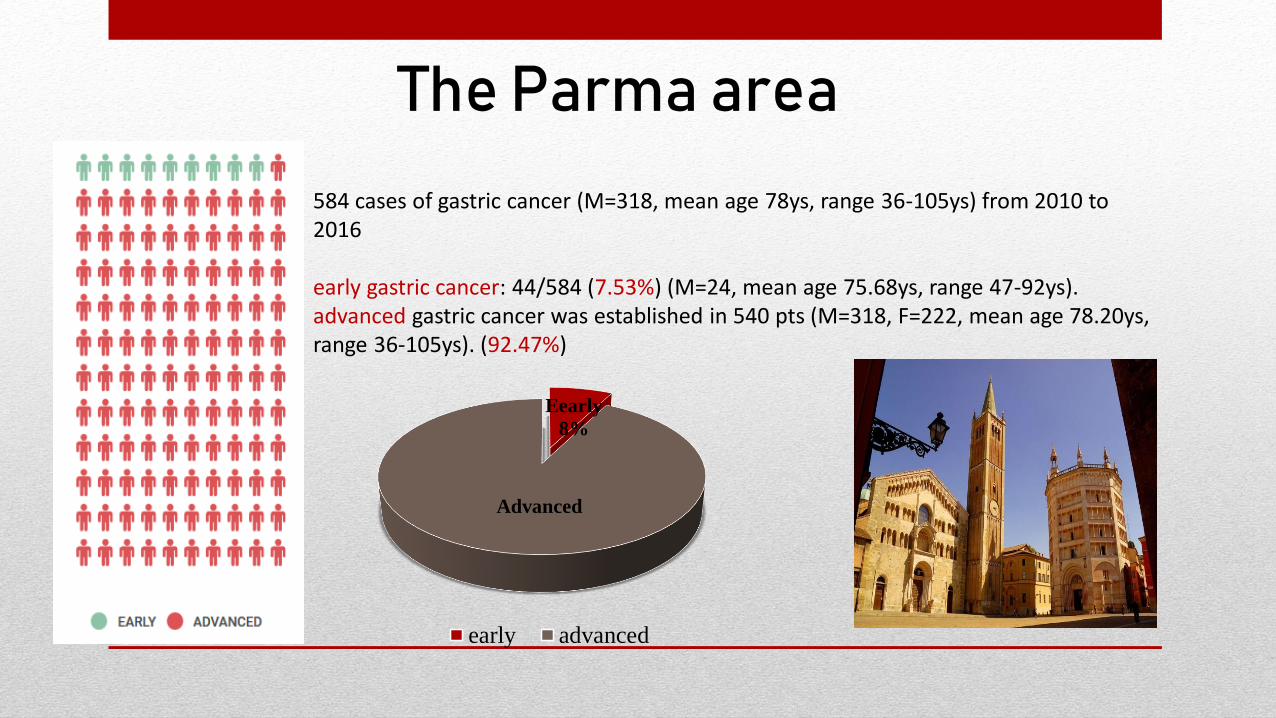
584 cases of gastric cancer (M=318, mean age 78ys, range 36-105ys) from 2010 to 2016
early gastric cancer: 44/584 (7.53%) (M=24, mean age 75.68ys, range 47-92ys). advanced gastric cancer was established in 540 pts (M=318, F=222, mean age 78.20ys, range 36-105ys). (92.47%)
The Parma area
Eearly
8%
Advanced
early advanced
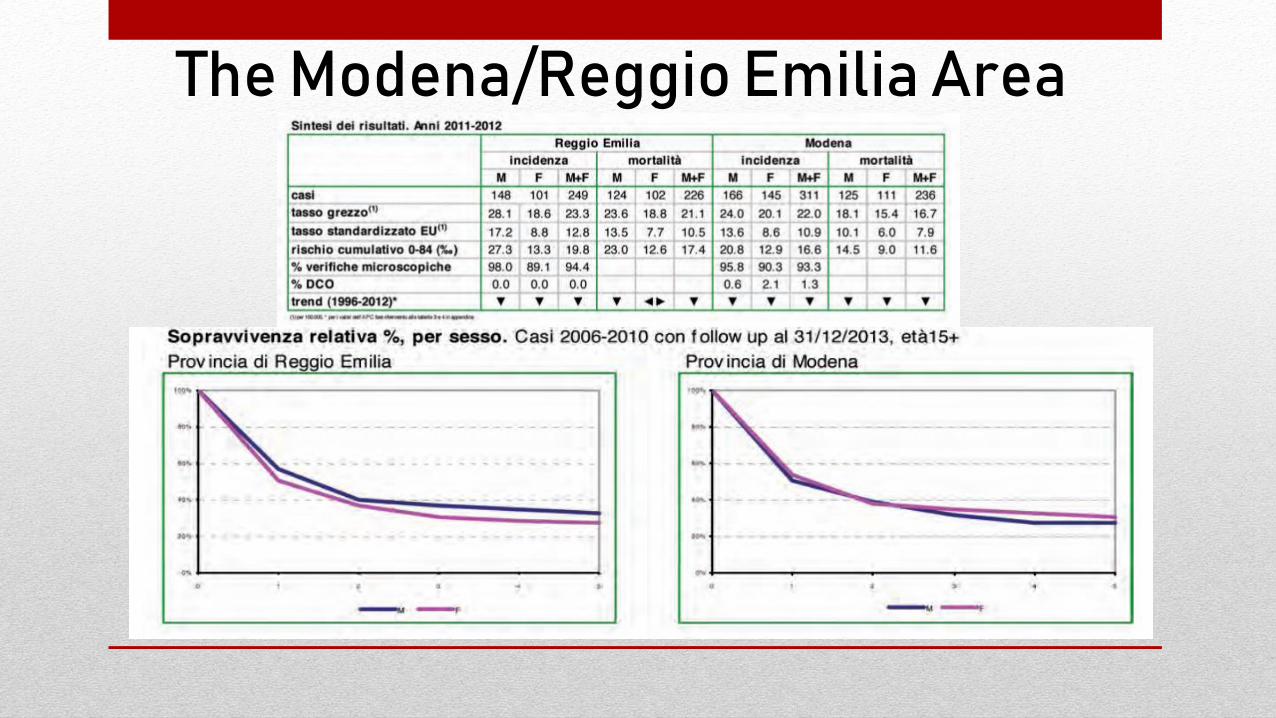
The Modena/Reggio Emilia Area
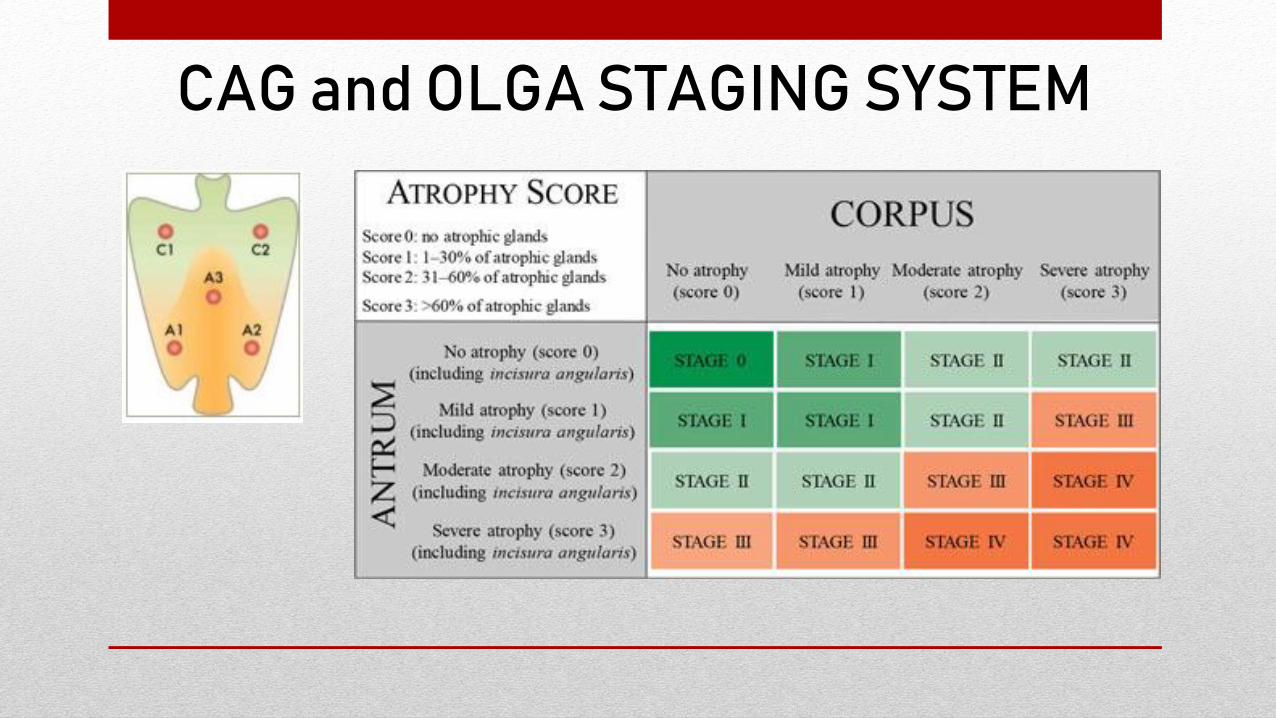
CAG and OLGA STAGING SYSTEM
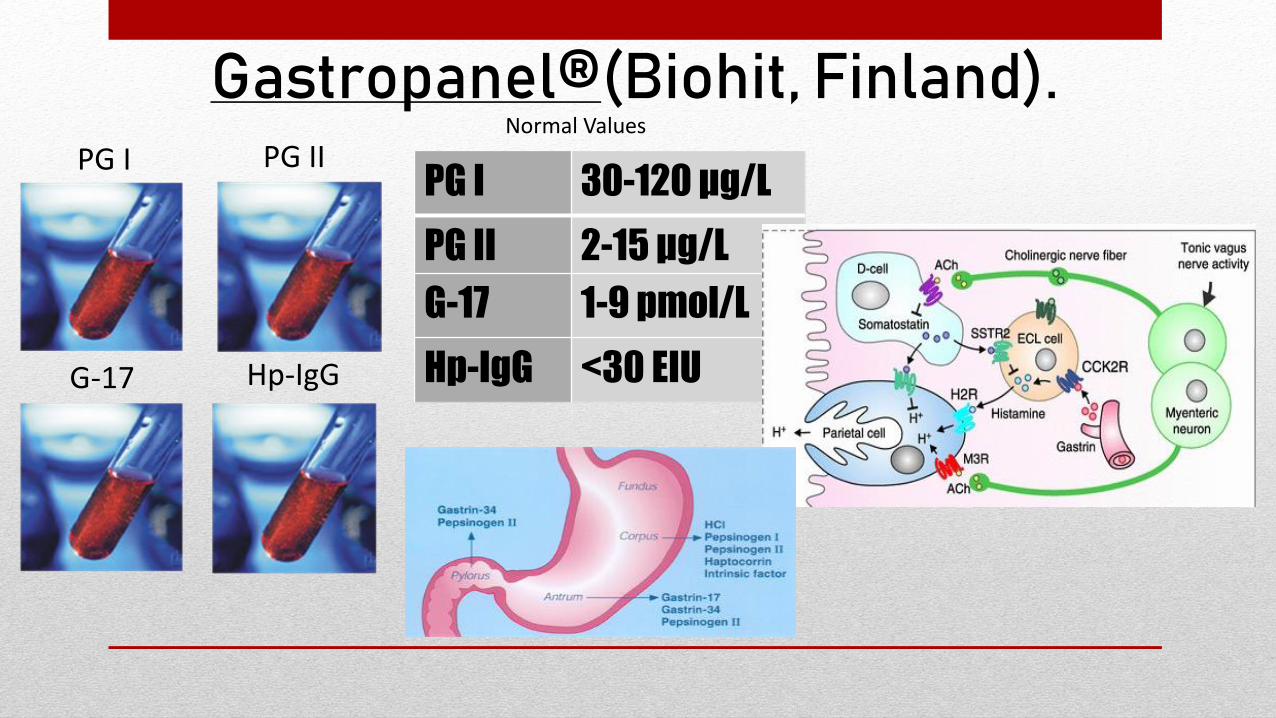
Gastropanel®(Biohit, Finland).
PG I 30-120 μg/L
PG II 2-15 μg/L
G-17 1-9 pmol/L
Hp-IgG <30 EIU
Normal Values
PG I PG II
G-17 Hp-IgG
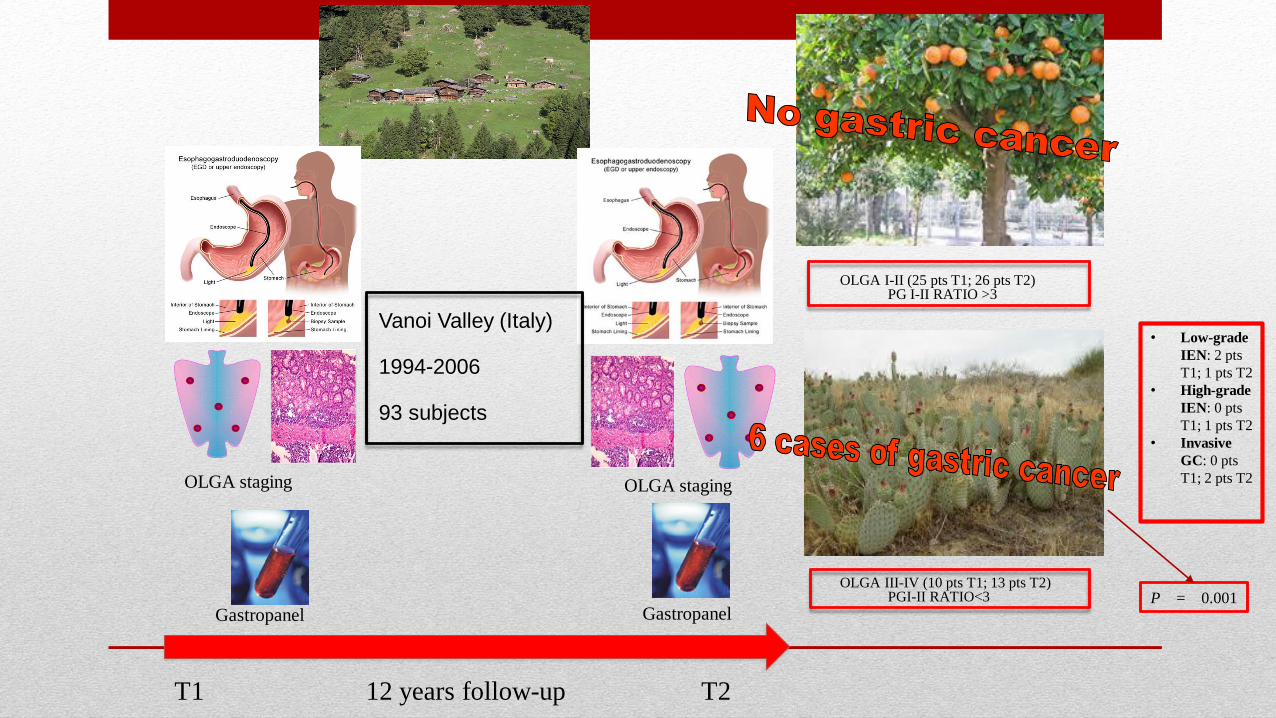
OLGA I-II (25 pts T1; 26 pts T2) PG I-II RATIO >3
OLGA III-IV (10 pts T1; 13 pts T2)PGI-II RATIO<3
T1 12 years follow-up T2
Vanoi Valley (Italy)
1994-2006
93 subjects
Gastropanel Gastropanel
OLGA staging OLGA staging
• Low-grade
IEN: 2 pts
T1; 1 pts T2
• High-grade
IEN: 0 pts
T1; 1 pts T2
• Invasive
GC: 0 pts
T1; 2 pts T2
P = 0.001
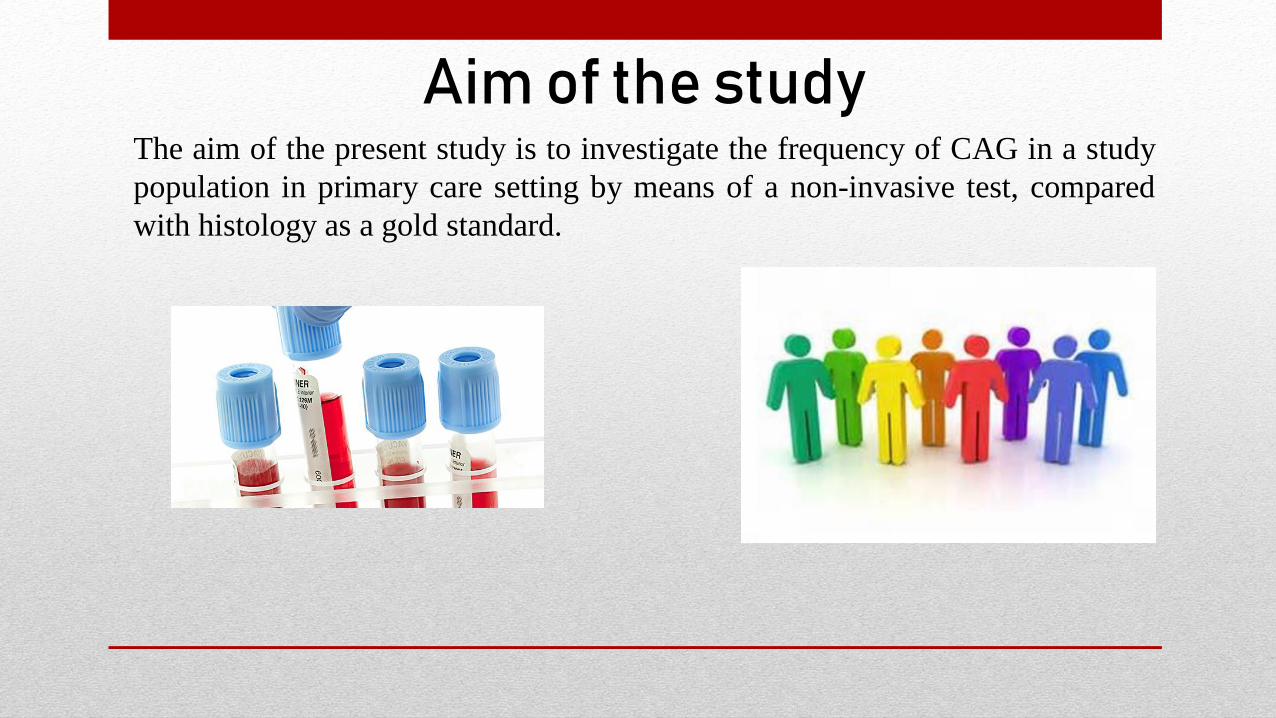
The aim of the present study is to investigate the frequency of CAG in a study
population in primary care setting by means of a non-invasive test, compared
with histology as a gold standard.
Aim of the study
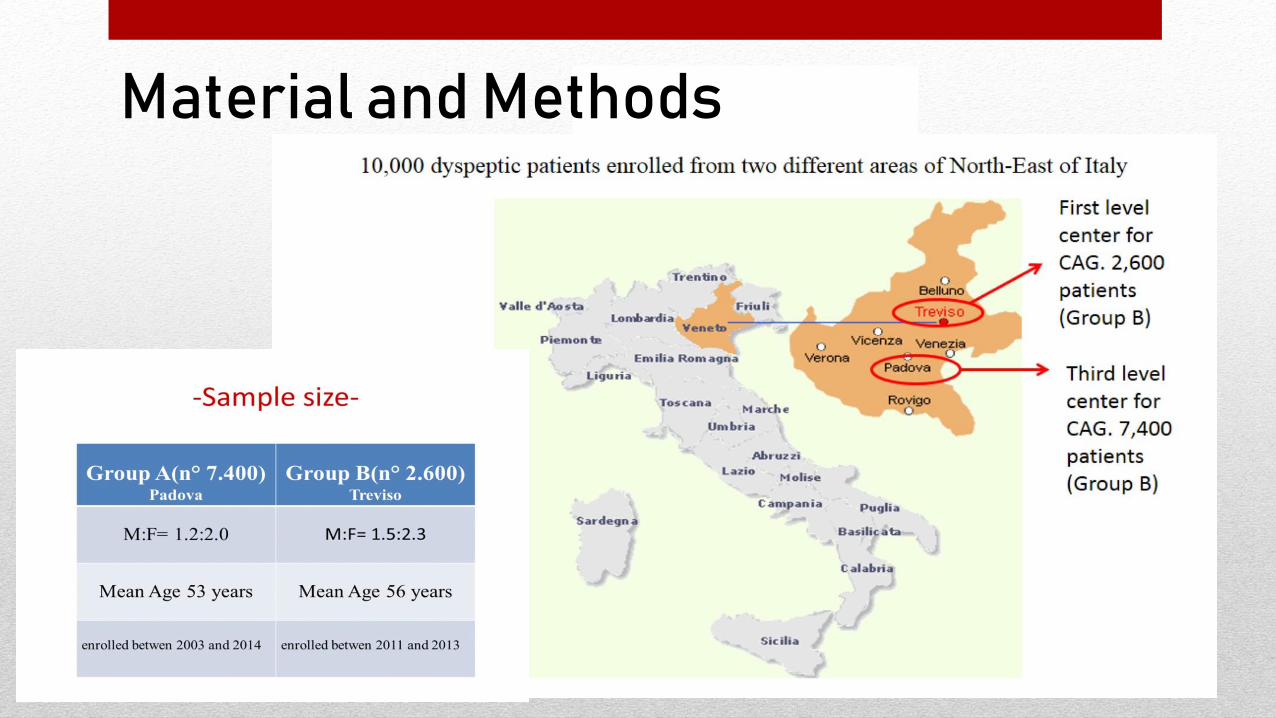
Material and Methods
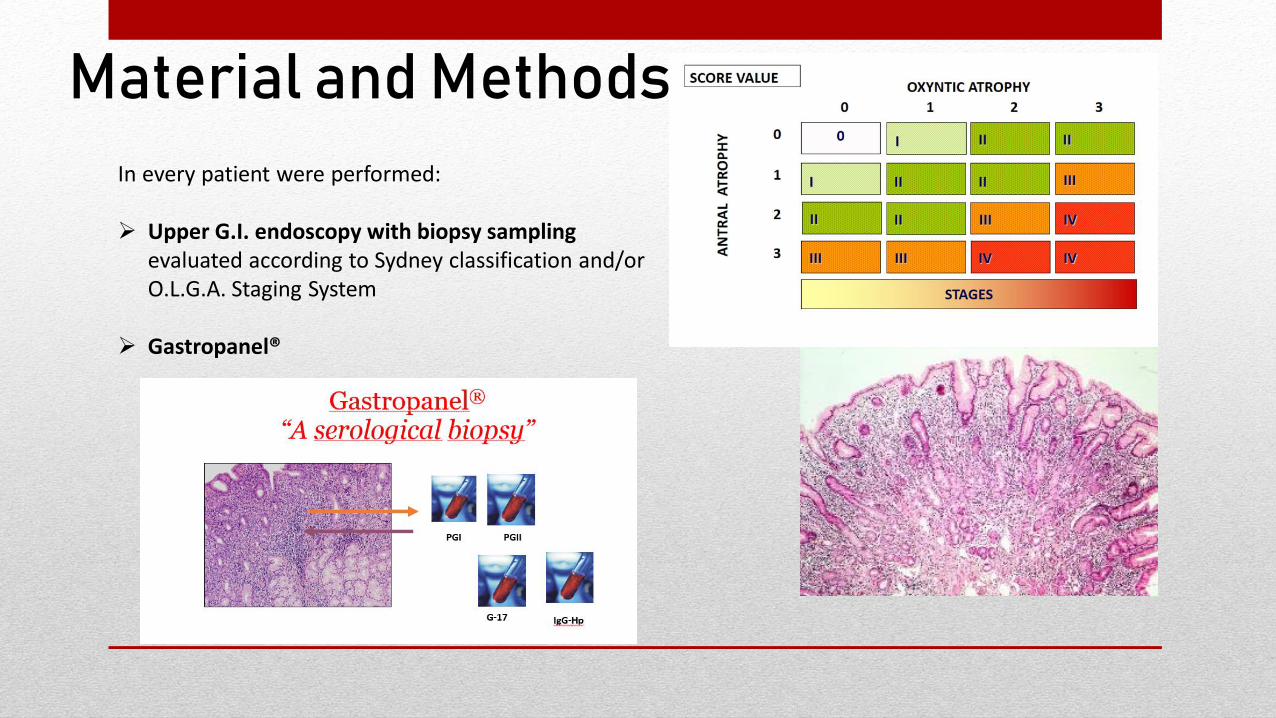
Material and Methods
In every patient were performed:
➢ Upper G.I. endoscopy with biopsy samplingevaluated according to Sydney classification and/or O.L.G.A. Staging System
➢ Gastropanel®

The normal values: PGI: 30-120 µg/L, PGII: 2-15 µg/L, G-17: 1-9 pmol/L, Hp-IgG: < 30 U/L.
SEROLOGICAL DIAGNOSIS OF BODY CAG WAS MADE BY:
Low levels of PGI (PGI < 25 µg/L) as well as high levels ofG-17 (G-17 > 14 pmol/L) were considered diagnostic forCAG
➢ PG I serum levels < 25 µg/L
➢ G-17 concentrations > 14 pmol/L
Material and Methods
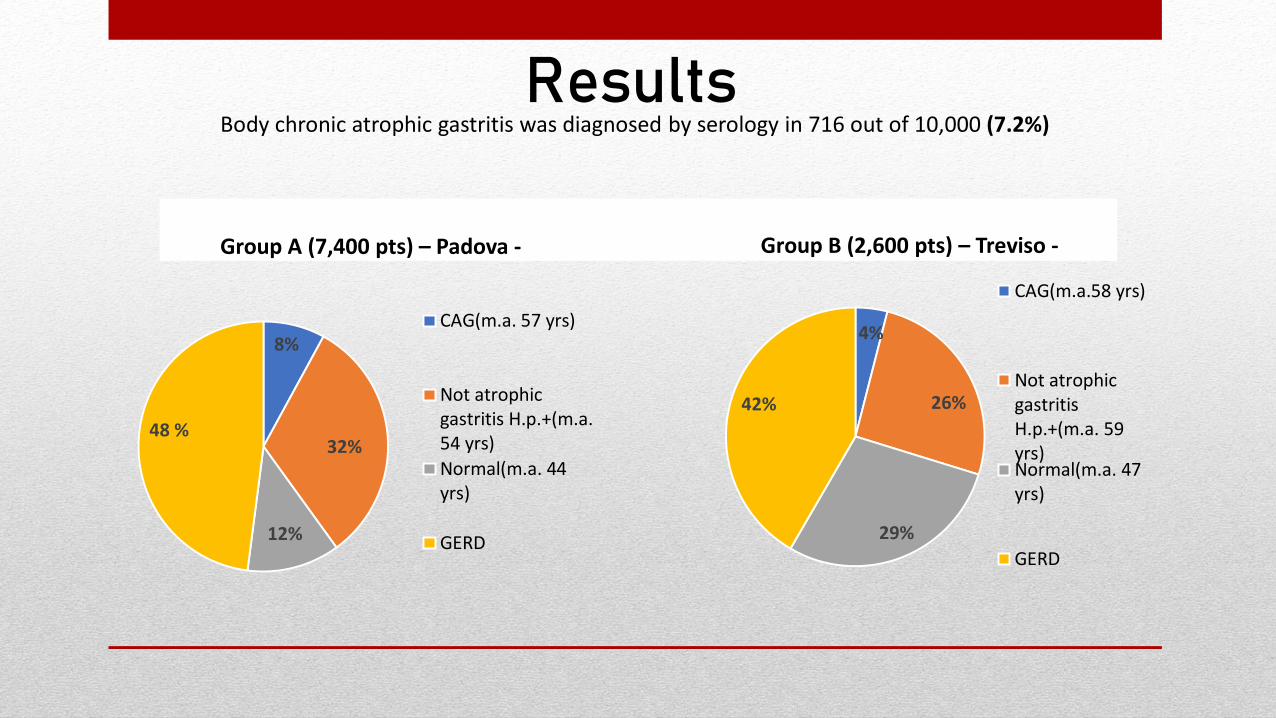
Group A (7,400 pts) – Padova - Group B (2,600 pts) – Treviso -
8%
32%
12%
48 %
CAG(m.a. 57 yrs)
Not atrophicgastritis H.p.+(m.a.54 yrs)
Normal(m.a. 44yrs)
GERD
Body chronic atrophic gastritis was diagnosed by serology in 716 out of 10,000 (7.2%)Results
4%
26%
29%
42%
CAG(m.a.58 yrs)
Not atrophicgastritisH.p.+(m.a. 59yrs)Normal(m.a. 47yrs)
GERD
p < 0.05
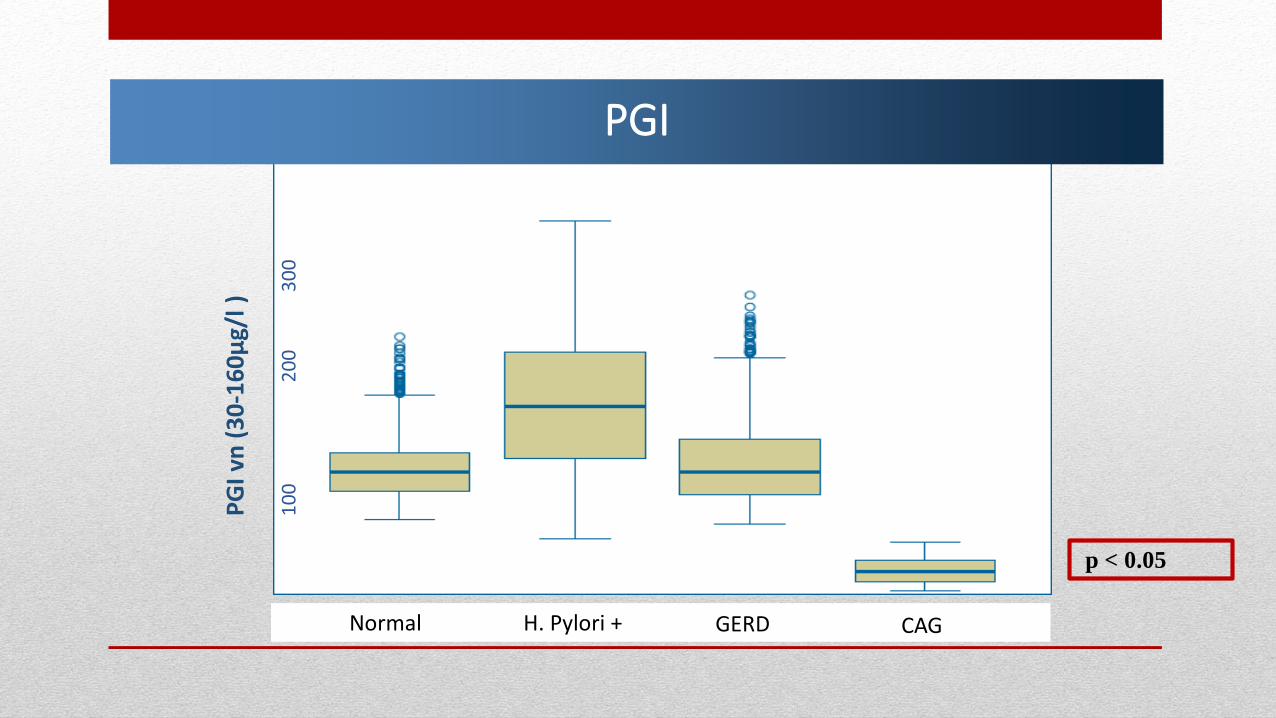
PGI
Controllo H. pylorii positivi GERD CAGNormal H. Pylori + GERD CAG
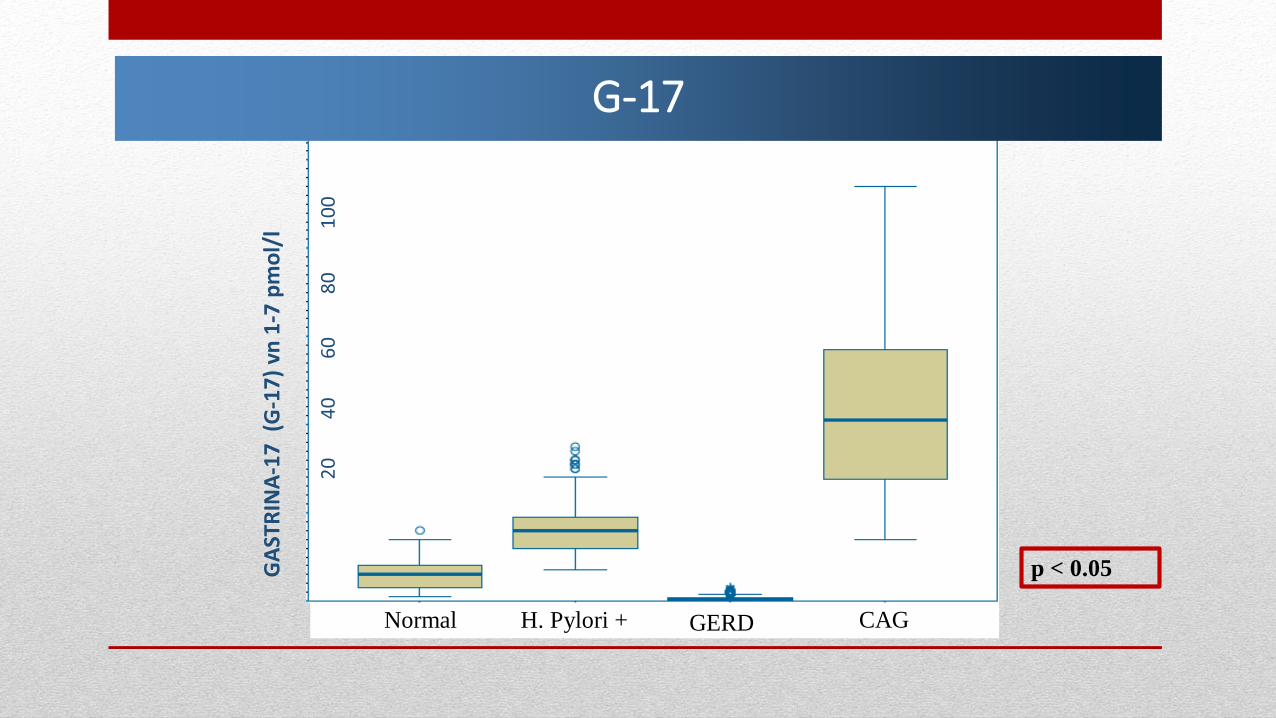
G-17
Controllo H. pylorii positivi GERD Normal H. Pylori + GERD CAG
p < 0.05
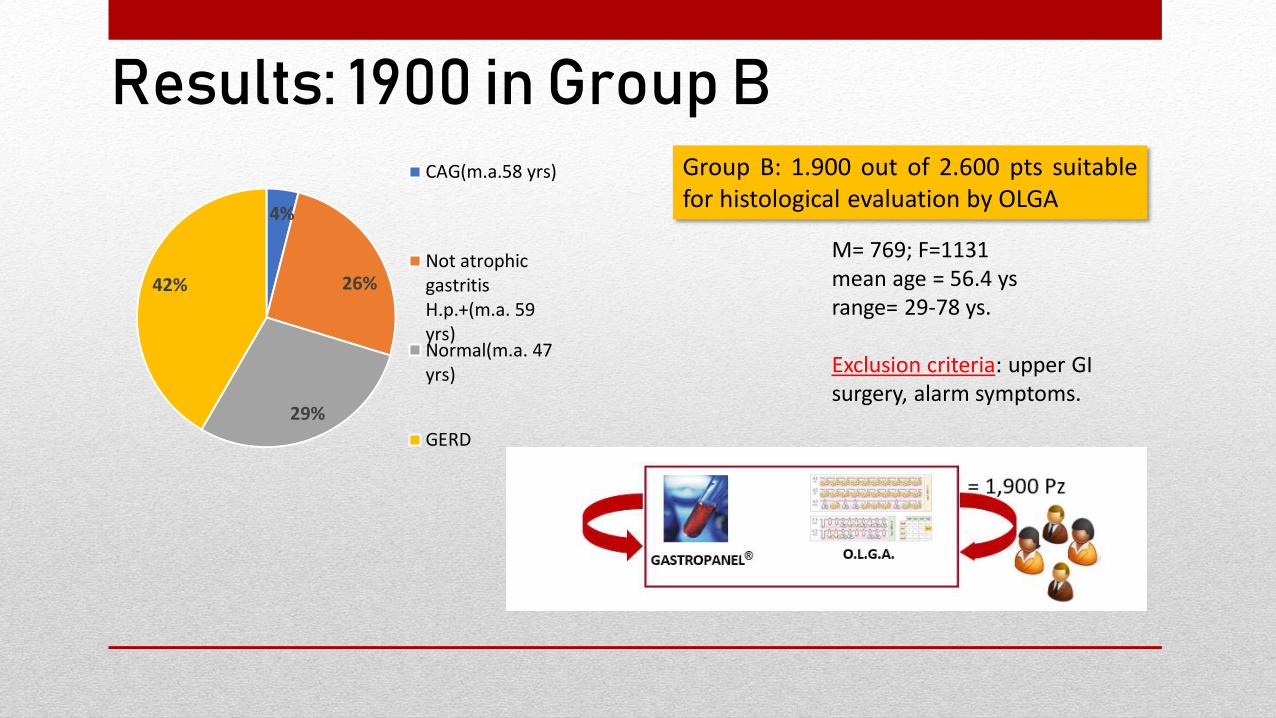
Group B: 1.900 out of 2.600 pts suitablefor histological evaluation by OLGA
M= 769; F=1131mean age = 56.4 ysrange= 29-78 ys.
Exclusion criteria: upper GI surgery, alarm symptoms.
Results: 1900 in Group B
4%
26%
29%
42%
CAG(m.a.58 yrs)
Not atrophicgastritisH.p.+(m.a. 59yrs)Normal(m.a. 47yrs)
GERD
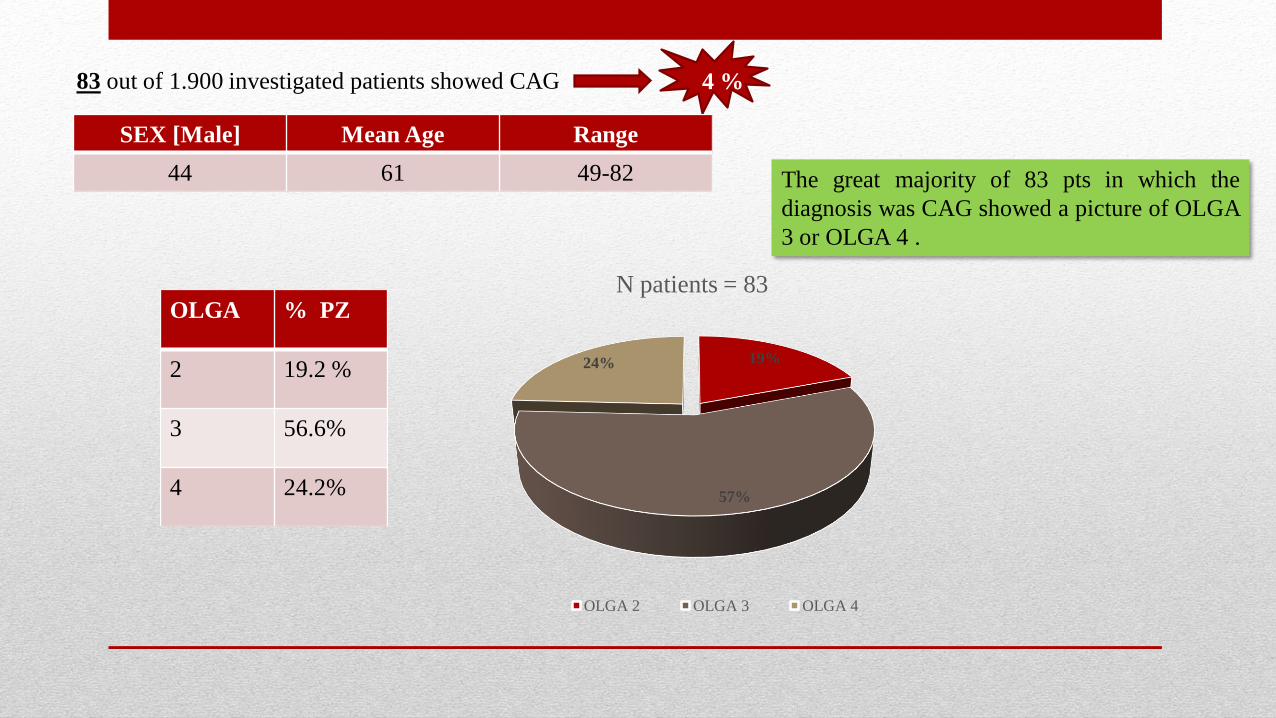
4 %
SEX [Male] Mean Age Range
44 61 49-82
19%
57%
24%
N patients = 83
OLGA 2 OLGA 3 OLGA 4
OLGA % PZ
2 19.2 %
3 56.6%
4 24.2%
The great majority of 83 pts in which the
diagnosis was CAG showed a picture of OLGA
3 or OLGA 4 .
83 out of 1.900 investigated patients showed CAG

The relationship between PGI levels and OLGA stage shows a statistically significant difference between the stages OLGA 0, 1, 2 and the stages 3 and 4.
OLGA STAGING PGI mean values (pmol/L)
OLGA 0 72.45
OLGA 1 85.95
OLGA 2 47.38
OLGA 3 16.00
OLGA 4 10.10p< 0.001
Results
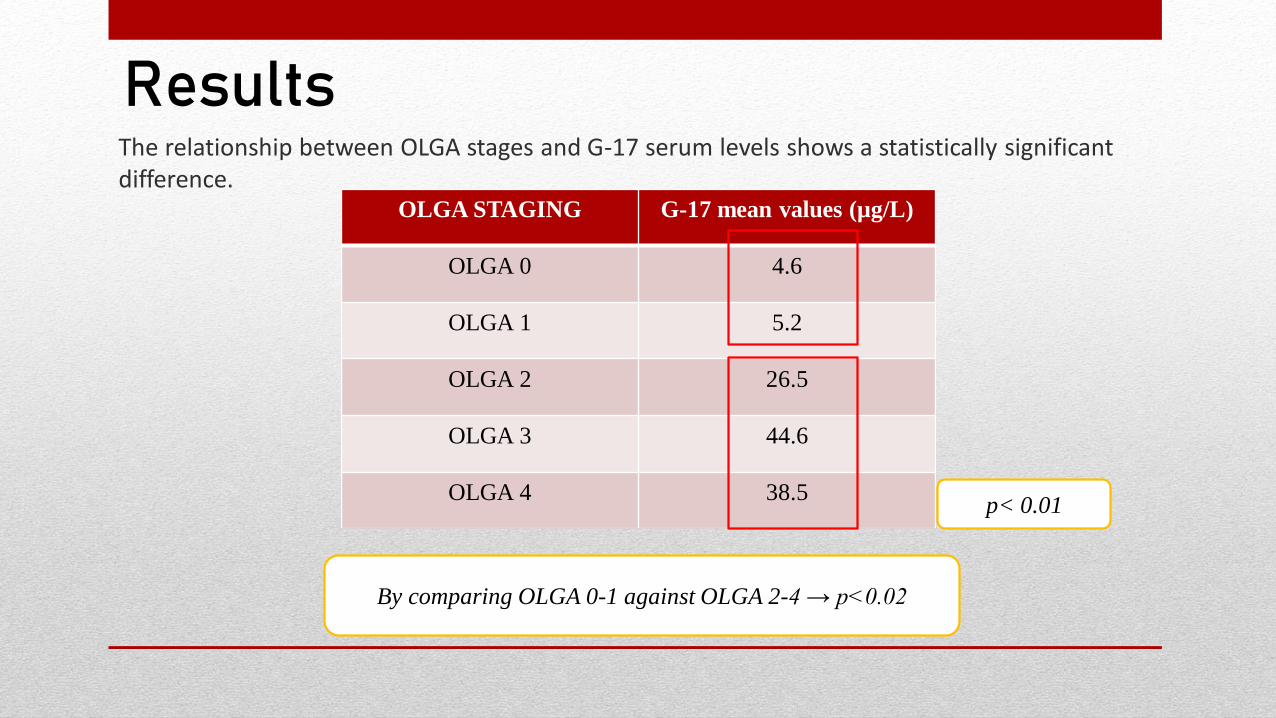
ResultsThe relationship between OLGA stages and G-17 serum levels shows a statistically significant difference.
OLGA STAGING G-17 mean values (µg/L)
OLGA 0 4.6
OLGA 1 5.2
OLGA 2 26.5
OLGA 3 44.6
OLGA 4 38.5p< 0.01
By comparing OLGA 0-1 against OLGA 2-4 → p<0.02
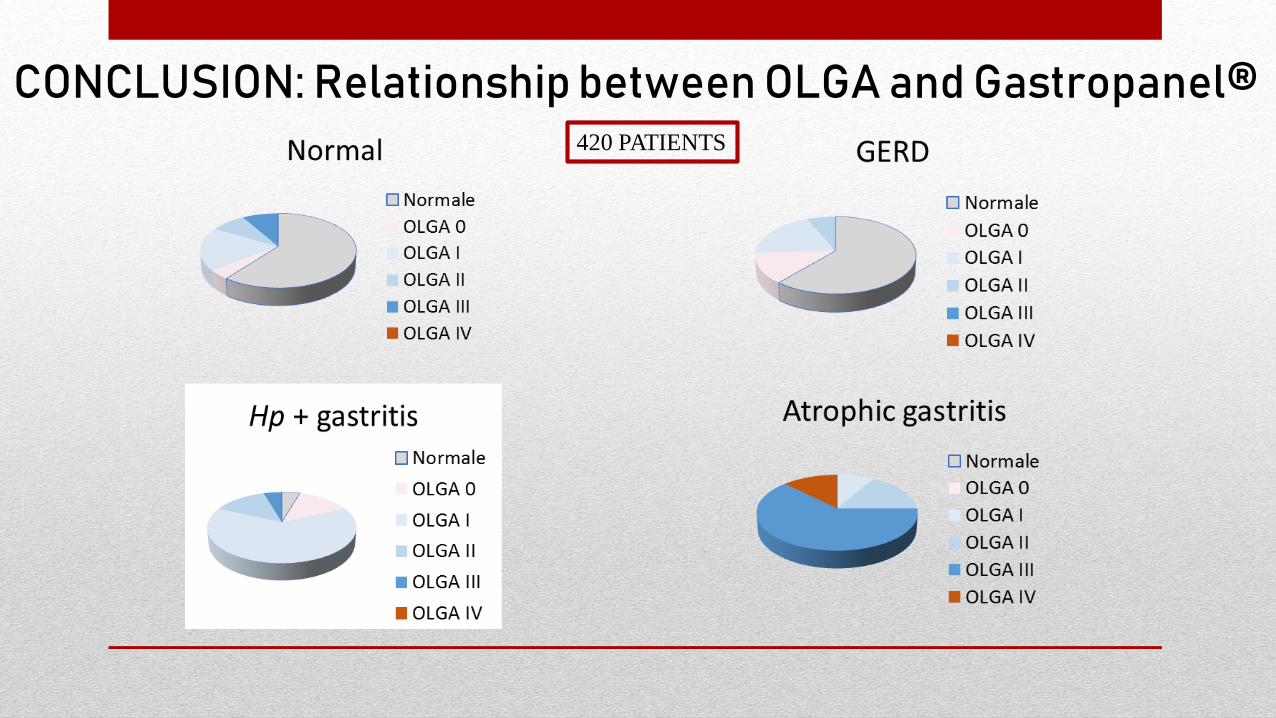
CONCLUSION: Relationship between OLGA and Gastropanel®420 PATIENTS
In a primary care setting a picture of CAG was found in above 7.2% of patients inagreement with previous studies
The higher frequency in Group A could be explained by different referenceevaluation of Centers. First Level (Treviso) vs Third Level (Padova)
Subjects affected by CAG show higher mean age in comparison with bothpatients with H.p. related non atrophic gastritis and normal population in bothsettings
Statistically significant relationship (p<0.02) was found between atrophichistological damage according with OLGA staging and serological values byGastropanel.
CONCLUSIONS
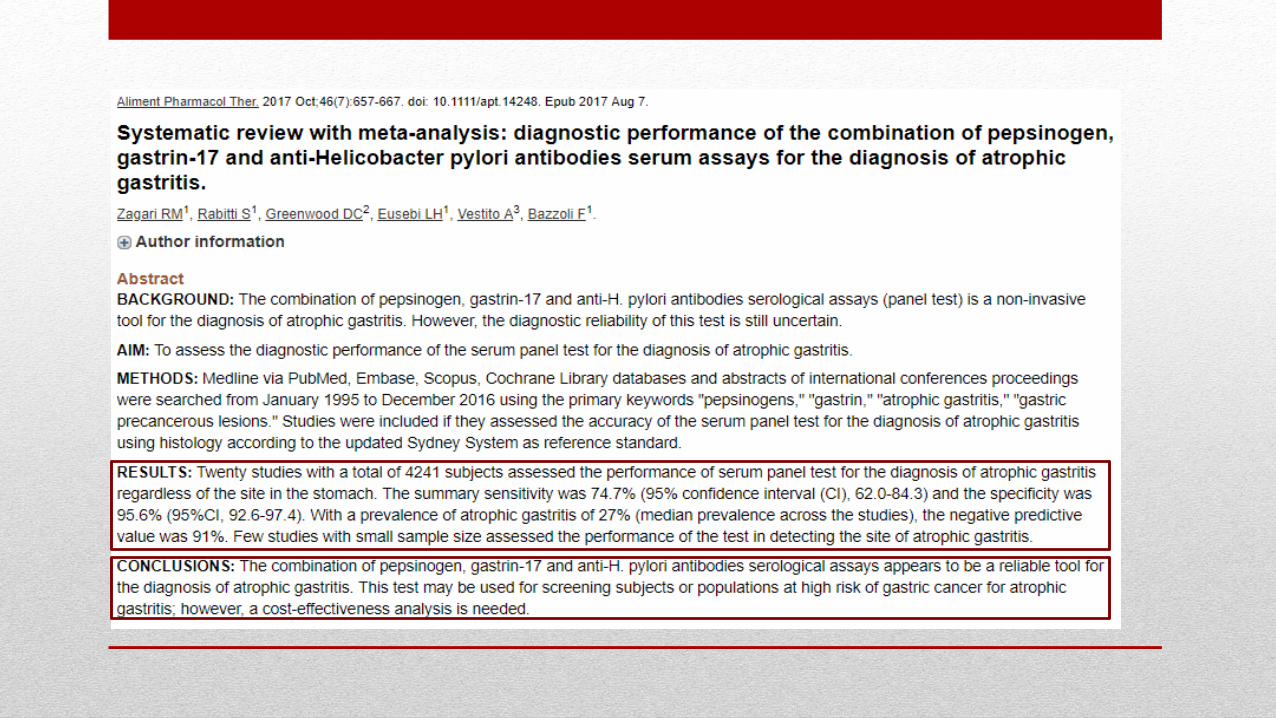
BIBLIOGRAPHY1. Zagari, R. M., et al. "Systematic review with meta‐analysis: diagnostic performance of the combination of
pepsinogen, gastrin‐17 and anti‐Helicobacter pylori antibodies serum assays for the diagnosis of atrophic
gastritis." Alimentary pharmacology & therapeutics 46.7 (2017): 657-667.
2. Rugge, Massimo, et al. "Gastritis staging in clinical practice: the OLGA staging system." Gut 56.5 (2007):
631-636.
3. Correa, Pelayo. "Human gastric carcinogenesis: a multistep and multifactorial process—first American
Cancer Society award lecture on cancer epidemiology and prevention." Cancer research 52.24 (1992):
6735-6740.
4. Rugge, Massimo, et al. "Gastritis OLGA‐staging and gastric cancer risk: a twelve‐year clinico‐pathological
follow‐up study." Alimentary pharmacology & therapeutics 31.10 (2010): 1104-1111.
5. Crafa, P., et al. "Clinical trends and burden of death in gastric cancer: A 6 years survey." HELICOBACTER.
Vol. 22. 111 RIVER ST, HOBOKEN 07030-5774, NJ USA: WILEY, 2017.
6. Karimi P, Islami F, Anandasabapathy S, Freedman ND et al Gastric Cancer: Descriptive Epidemiology,
Risk Factors, Screening, and Prevention. Cancer Epidemiol Biomarkers Prev. 2014 May;23(5):700-13.
7. Mazzucco, W., et al. "Il Registro incontra i Sindaci: l’iniziativa di comunicazione del Registro Tumori di
Palermo e Provincia."Riunione Scientifica Annuale AIRTUM.. 2015.
Il nostro gruppo

Grazie per l’attenzione!