Sequential sampling of visual objects during sustained attention · The TRF method, which uses...
19
RESEARCH ARTICLE Sequential sampling of visual objects during sustained attention Jianrong Jia 1,2,3,4 , Ling Liu 1,2,3 , Fang Fang 1,2,3,4 , Huan Luo 1,2,3 * 1 School of Psychological and Cognitive Sciences, Peking University, Beijing, China, 2 IDG/McGovern Institute for Brain Research, Peking University, Beijing, China, 3 Beijing Key Laboratory of Behavior and Mental Health, Peking University, Beijing, China, 4 Peking–Tsinghua Center for Life Sciences, Peking University, Beijing, China * [email protected] Abstract In a crowded visual scene, attention must be distributed efficiently and flexibly over time and space to accommodate different contexts. It is well established that selective attention enhances the corresponding neural responses, presumably implying that attention would persistently dwell on the task-relevant item. Meanwhile, recent studies, mostly in divided attentional contexts, suggest that attention does not remain stationary but samples objects alternately over time, suggesting a rhythmic view of attention. However, it remains unknown whether the dynamic mechanism essentially mediates attentional processes at a general level. Importantly, there is also a complete lack of direct neural evidence reflecting whether and how the brain rhythmically samples multiple visual objects during stimulus processing. To address these issues, in this study, we employed electroencephalography (EEG) and a temporal response function (TRF) approach, which can dissociate responses that exclu- sively represent a single object from the overall neuronal activity, to examine the spatiotem- poral characteristics of attention in various attentional contexts. First, attention, which is characterized by inhibitory alpha-band (approximately 10 Hz) activity in TRFs, switches between attended and unattended objects every approximately 200 ms, suggesting a sequential sampling even when attention is required to mostly stay on the attended object. Second, the attentional spatiotemporal pattern is modulated by the task context, such that alpha-mediated switching becomes increasingly prominent as the task requires a more uni- form distribution of attention. Finally, the switching pattern correlates with attentional behav- ioral performance. Our work provides direct neural evidence supporting a generally central role of temporal organization mechanism in attention, such that multiple objects are sequen- tially sorted according to their priority in attentional contexts. The results suggest that selec- tive attention, in addition to the classically posited attentional “focus,” involves a dynamic mechanism for monitoring all objects outside of the focus. Our findings also suggest that attention implements a space (object)-to-time transformation by acting as a series of concatenating attentional chunks that operate on 1 object at a time. PLOS Biology | https://doi.org/10.1371/journal.pbio.2001903 June 28, 2017 1 / 19 a1111111111 a1111111111 a1111111111 a1111111111 a1111111111 OPEN ACCESS Citation: Jia J, Liu L, Fang F, Luo H (2017) Sequential sampling of visual objects during sustained attention. PLoS Biol 15(6): e2001903. https://doi.org/10.1371/journal.pbio.2001903 Academic Editor: Ole Jensen, University of Birmingham, United Kingdom of Great Britain and Northern Ireland Received: December 29, 2016 Accepted: May 31, 2017 Published: June 28, 2017 Copyright: © 2017 Jia et al. This is an open access article distributed under the terms of the Creative Commons Attribution License, which permits unrestricted use, distribution, and reproduction in any medium, provided the original author and source are credited. Data Availability Statement: All relevant data are within the paper and its Supporting Information files. Funding: National Natural Science Foundation of China http://www.nsfc.gov.cn (grant number 31522027 and 31571115). The funder had no role in study design, data collection and analysis, decision to publish, or preparation of the manuscript. Competing interests: The authors have declared that no competing interests exist.
Transcript of Sequential sampling of visual objects during sustained attention · The TRF method, which uses...
RESEARCH ARTICLE
Sequential sampling of visual objects during
sustained attention
Jianrong Jia1,2,3,4, Ling Liu1,2,3, Fang Fang1,2,3,4, Huan Luo1,2,3*
1 School of Psychological and Cognitive Sciences, Peking University, Beijing, China, 2 IDG/McGovern
Institute for Brain Research, Peking University, Beijing, China, 3 Beijing Key Laboratory of Behavior and
Mental Health, Peking University, Beijing, China, 4 Peking–Tsinghua Center for Life Sciences, Peking
University, Beijing, China
Abstract
In a crowded visual scene, attention must be distributed efficiently and flexibly over time
and space to accommodate different contexts. It is well established that selective attention
enhances the corresponding neural responses, presumably implying that attention would
persistently dwell on the task-relevant item. Meanwhile, recent studies, mostly in divided
attentional contexts, suggest that attention does not remain stationary but samples objects
alternately over time, suggesting a rhythmic view of attention. However, it remains unknown
whether the dynamic mechanism essentially mediates attentional processes at a general
level. Importantly, there is also a complete lack of direct neural evidence reflecting whether
and how the brain rhythmically samples multiple visual objects during stimulus processing.
To address these issues, in this study, we employed electroencephalography (EEG) and a
temporal response function (TRF) approach, which can dissociate responses that exclu-
sively represent a single object from the overall neuronal activity, to examine the spatiotem-
poral characteristics of attention in various attentional contexts. First, attention, which is
characterized by inhibitory alpha-band (approximately 10 Hz) activity in TRFs, switches
between attended and unattended objects every approximately 200 ms, suggesting a
sequential sampling even when attention is required to mostly stay on the attended object.
Second, the attentional spatiotemporal pattern is modulated by the task context, such that
alpha-mediated switching becomes increasingly prominent as the task requires a more uni-
form distribution of attention. Finally, the switching pattern correlates with attentional behav-
ioral performance. Our work provides direct neural evidence supporting a generally central
role of temporal organization mechanism in attention, such that multiple objects are sequen-
tially sorted according to their priority in attentional contexts. The results suggest that selec-
tive attention, in addition to the classically posited attentional “focus,” involves a dynamic
mechanism for monitoring all objects outside of the focus. Our findings also suggest that
attention implements a space (object)-to-time transformation by acting as a series of
concatenating attentional chunks that operate on 1 object at a time.
PLOS Biology | https://doi.org/10.1371/journal.pbio.2001903 June 28, 2017 1 / 19
a1111111111
a1111111111
a1111111111
a1111111111
a1111111111
OPENACCESS
Citation: Jia J, Liu L, Fang F, Luo H (2017)
Sequential sampling of visual objects during
sustained attention. PLoS Biol 15(6): e2001903.
https://doi.org/10.1371/journal.pbio.2001903
Academic Editor: Ole Jensen, University of
Birmingham, United Kingdom of Great Britain and
Northern Ireland
Received: December 29, 2016
Accepted: May 31, 2017
Published: June 28, 2017
Copyright: © 2017 Jia et al. This is an open access
article distributed under the terms of the Creative
Commons Attribution License, which permits
unrestricted use, distribution, and reproduction in
any medium, provided the original author and
source are credited.
Data Availability Statement: All relevant data are
within the paper and its Supporting Information
files.
Funding: National Natural Science Foundation of
China http://www.nsfc.gov.cn (grant number
31522027 and 31571115). The funder had no role
in study design, data collection and analysis,
decision to publish, or preparation of the
manuscript.
Competing interests: The authors have declared
that no competing interests exist.
Author summary
In a crowded visual scene, attention must be efficiently and flexibly distributed over time
and space to accommodate different contexts in a task. Recent studies have proposed that
attention is a dynamic process that organizes copious information temporally. However,
how the brain coordinates attention among multiple visual objects and whether this
dynamic mechanism mediates attention at a general level remain largely unknown. In this
study, we analyze electroencephalography (EEG) recordings during a multi-object selec-
tive attention task to extract object-specific neuronal responses. We demonstrate that
attention rhythmically switches between visual objects every approximately 200 ms. Fur-
thermore, the spatiotemporal sampling profile of attention adaptively changes in various
task contexts and correlates with behavioral performance during attention. Our work pro-
vides direct neural evidence supporting the idea that multiple objects are sequentially
sorted according to their priority in attentional contexts. The results suggest that attention
is intrinsically dynamic, acting as a series of concatenating chunks of attention that oper-
ate on 1 object at a time to maintain awareness of the whole scene.
Introduction
The brain has limited processing capacity, yet it is constantly confronted with enormous
amounts of information. Attentional mechanisms are therefore needed to selectively enhance
the most task-relevant information [1–4]. It is well established that attention increases the neu-
ral response to a stimulus so that the attended-to representation is enhanced and wins the
competition for the limited neural resources [3,5–9]. These findings presumably imply that,
during sustained selective attentional tasks in which subjects are instructed to focus on one
location over others, attention would persistently dwell on the task-relevant location.
However, a growing number of studies have taken a different perspective by focusing on
the temporal aspects of attention. These experiments propose that, rather than remaining sta-
tionary, attention is essentially a highly dynamic and flexible process that organizes and struc-
tures complex information in the temporal dimension. For example, even when attention is
sustained on 1 location, the stimulus is sampled periodically rather than continuously [10].
Moreover, several recent studies have used a time-resolved psychophysical measurement to
disclose rhythms in attentional behavioral performance (i.e., behavioral oscillations), suggest-
ing that multiple locations, features, and objects are sampled alternately in various phases of
the attentional rhythm [11–17]. Together, these new findings suggest that sustained attention,
in addition to the classically posited attentional “focus,” might contain a dynamic mechanism
for monitoring all locations or objects outside the focus [13,18,19]. However, most of the evi-
dence supporting the rhythmic multi-item sampling view is based on behavioral measure-
ments [11,13,14,16,17,20] or pre-target brain activities [19,21], and there is a lack of direct
neural evidence for sequential attentional modulation during stimulus processing. Moreover,
this sampling mechanism should be flexible enough to accommodate changing behavioral de-
mands, yet it remains unknown how the brain dynamically coordinates attentional resources
among multiple objects to efficiently sample the external world in various task contexts. It is
also important to know whether the rhythmic sampling mechanism mediates attention at a
general level rather than just under certain circumstances (e.g., divided attention).
We employed electroencephalography (EEG), a time-resolved brain technique, to access
the spatiotemporal characteristics of attention. Notably, a key challenge of this technique lies
in how to disentangle temporally overlapping responses from multiple neuronal sources (e.g.,
Serial-like monitoring of multiple visual objects
PLOS Biology | https://doi.org/10.1371/journal.pbio.2001903 June 28, 2017 2 / 19
Abbreviations: BI, behavioral index; EEG,
electroencephalography; FDR, false discovery rate;
MEG, magnetoencephalography; MOT, multiple
object tracking; NI, neuronal index; TRF, temporal
response function.

mixed responses from multiple items). In other words, we need to extract the neural activity
that exclusively represents a single spatial location or an object in a visual display from the
overall EEG responses. The temporal response function (TRF) method, which has recently
been used in several auditory studies, is able to dissociate the neural correlates of individual
auditory streams from an auditory scene consisting of concurrent speech streams [22–24].
Recently, using similar methods, ongoing visual transients were surprisingly found to elicit
long-lasting 10 Hz echoes in neuronal responses [25]. Motivated by these studies, we employed
covert sustained visual attentional paradigms in combination with the TRF method to over-
come the limitations of EEG and to address the issue.
We are mainly interested in 2 issues: how attention is allocated to multiple visual objects
over time during a sustained selective attentional task and whether the spatiotemporal atten-
tion profile is flexibly modulated in different task contexts. Our results reveal robust spatio-
temporal attention profiles during stimulus processing, characterized by inhibitory alpha-
band (approximately 10 Hz) activity switching between attended and unattended locations
every 200 ms, suggesting that attention monitors all spatial locations by sampling them in a
temporally dissociated way. Moreover, this attentional switching pattern becomes increasingly
prominent as the task requires a more uniform distribution of attention over locations, sup-
porting the idea that the spatiotemporal distribution of attention is flexibly adjusted in differ-
ent contexts. Critically, the neuronal switching pattern correlates with attentional behavioral
performance. Finally, this attentional profile is not limited to the spatial dimension but is
maintained in a multiple object tracking (MOT) task, suggesting the presence of a general tem-
poral organization mechanism for multi-object attention. Our findings thus speak to a gener-
ally central function of sequential sampling in the attentional mechanism.
Results
We recorded 64-channel EEG signals from human subjects fixating on a central spot while 2
discs were displayed simultaneously, 1 in the left and 1 in the right visual field. As shown in
Fig 1A, at the beginning of each trial, a central arrow cue (Experiment 1: 100% validity; Ex-
periment 2: 75% validity) indicated which side (left or right) the subjects should attend to for
target detection. The target appeared at a random time in 25% of the 5-s trials. Subjects were
requested to maintain a central fixation and to detect whether a target square appeared, indi-
cated by pressing 1 of 2 response buttons at the end of each trial. The contrast of the target
square (i.e., relative to the luminance of the background disc) was adjusted across trials (using
a 3-down-1-up staircase procedure) so that the overall detection performance was maintained
at around 80%. In Experiment 1 (100% cue validity), the target only appeared in the cued disc,
whereas in Experiment 2 (75% cue validity), the target appeared in the cued disc with 75%
probability and in the uncued disc with 25% probability. Subjects were informed of the cue
validity before the experiment began.
Critically, the luminance of both the attended and unattended discs was independently
modulated for 5 s, resulting in 2 independent 5-s random temporal sequences (Fig 1B). Next,
we used the TRF approach [22,24] to calculate and separate neural impulse responses for the
attended and unattended visual sequences (att TRF versus unatt TRF) from the same EEG
recordings (Fig 1C). The TRF method, which uses linear regression to quantify the stimulus–
response relationships, models the neural impulse response function (i.e., the brain response
to a unit increase in luminance in a stimulus sequence). This approach has been used in previ-
ous studies [22,24,25]. To avoid the influence of the onset EEG response, which may bias the
estimated TRF results, we extracted the middle part of the 5-s EEG trial responses (0.5–4.5 s)
for further TRF calculation (S1 Fig).
Serial-like monitoring of multiple visual objects
PLOS Biology | https://doi.org/10.1371/journal.pbio.2001903 June 28, 2017 3 / 19

Experiment 1 (100% cue validity): Attention-elicited alpha inhibition
Eighteen subjects participated in Experiment 1 (100% attentional cue validity). Fig 2A illus-
trates the TRFs for attended (upper panel) and unattended (lower panel) visual sequences
(black line), which represent the brain response for each unit increase in luminance in the
stimulus sequence as a function of time lag (0–0.8 s). The TRF responses became flat and noisy
when the relation between the stimulus sequence and the corresponding trial recordings was
shuffled (blue lines), supporting the idea that the estimated TRF represents a genuine stimu-
lus-specific tracking response.
Next, we performed a spectrotemporal analysis on the TRFs to examine their fine dynamic
structures as a function of frequency (0–30 Hz) and time (0–0.8 s); this was done for each sub-
ject separately. The TRFs for both attended and unattended sequences demonstrated strong
alpha-band (8–12 Hz) activation (Fig 2B), consistent with previous results [25]. When compar-
ing the spectrotemporal power profiles between att and unatt TRFs, we observed significant
alpha-band inhibition (att < unatt) within the first 200 ms, followed by a rebound trend
(att> unatt) in the next 200 ms (Fig 2C). Topographical mapping of the alpha-band inhibition
revealed that the attentional effects occurred mainly over parietal electrodes (Fig 2D). In con-
junction with the results of previous studies that have revealed the inhibitory function of
induced alpha-band activity in spatial attention [26–29], our TRF results (i.e., att–unatt alpha
inhibition) suggest that, during selective attention, the unattended visual sequence is inhibited
by increasing the alpha activity in the neural impulse response relative to the response of the
attended sequence. When we examined the attention-related TRF effects for left and right
Fig 1. Experimental paradigm for Experiments 1 and 2 and illustration of the temporal response function (TRF) approach. (A) A
central arrow cue appeared at the beginning of each trial to indicate which side (left or right) the subject should covertly attend to for subsequent
target detection. Two discs were then presented simultaneously in the left and right visual fields for 5 seconds, during which time subjects were
instructed to detect the appearance of a target square within the discs by pressing 1 of 2 response keys at the end of each trial. The target
occurred at a random time so that subjects had to maintain their attention on the discs. Across trials, the contrast of the target square relative to
the momentary disc luminance was adjusted to maintain 80% detection performance. For 100% cue validity (Experiment 1), the target only
appeared in the cued disc; for 75% cue validity (Experiment 2), the target appeared in the cued disc 75% of the time and in the uncued disc 25%
of the time. (B) The luminance of the 2 discs was independently and randomly modulated throughout the trial, resulting in 2 independent 5 s
random temporal sequences (example sequences are shown; top: attended visual stimulus luminance sequence, bottom: unattended visual
stimulus luminance sequence). At the same time, electroencephalography (EEG) responses were recorded. (C) The TRF approach was used
to calculate the impulse brain response for the attended (top, att) and unattended (bottom, unatt) visual sequences. TRF characterizes the brain
response to a unit increase in luminance in a stimulus sequence, with the time axis representing the latency after each transient unit. Note that
the att TRF and unatt TRF were derived from the same EEG responses but were separated based on the corresponding stimulus luminance
sequence (see panel B).
https://doi.org/10.1371/journal.pbio.2001903.g001
Serial-like monitoring of multiple visual objects
PLOS Biology | https://doi.org/10.1371/journal.pbio.2001903 June 28, 2017 4 / 19
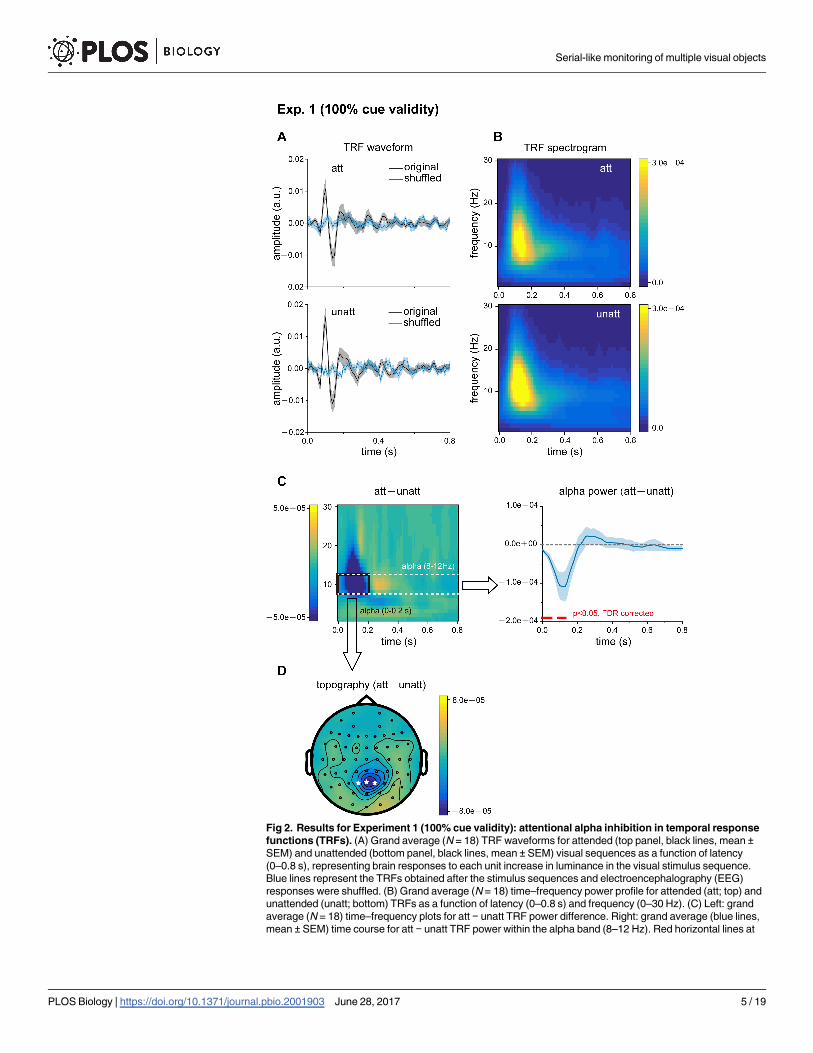
Fig 2. Results for Experiment 1 (100% cue validity): attentional alpha inhibition in temporal response
functions (TRFs). (A) Grand average (N = 18) TRF waveforms for attended (top panel, black lines, mean ±SEM) and unattended (bottom panel, black lines, mean ± SEM) visual sequences as a function of latency
(0–0.8 s), representing brain responses to each unit increase in luminance in the visual stimulus sequence.
Blue lines represent the TRFs obtained after the stimulus sequences and electroencephalography (EEG)
responses were shuffled. (B) Grand average (N = 18) time–frequency power profile for attended (att; top) and
unattended (unatt; bottom) TRFs as a function of latency (0–0.8 s) and frequency (0–30 Hz). (C) Left: grand
average (N = 18) time–frequency plots for att − unatt TRF power difference. Right: grand average (blue lines,
mean ± SEM) time course for att − unatt TRF power within the alpha band (8–12 Hz). Red horizontal lines at
Serial-like monitoring of multiple visual objects
PLOS Biology | https://doi.org/10.1371/journal.pbio.2001903 June 28, 2017 5 / 19
stimuli separately, we still observed alpha inhibition and a similar topographical distribution
(S2 Fig).
Experiment 2 (75% cue validity): Alpha inhibition followed by alpha
rebound
The protocol for Experiment 2 was exactly the same as that of Experiment 1 (Fig 1A), except
that the attentional cue validity decreased to 75%. Twenty subjects participated in Experiment
2 and were informed of the target distribution probability (i.e., 75%) before the experiment.
Similar to Experiment 1, the luminance of the 2 discs was independently and randomly modu-
lated so that the att TRF and unatt TRF could be estimated separately from the same EEG
recordings (Fig 1C). Att TRF, compared to unatt TRF, again showed alpha-band inhibition
within the first 200 ms (Fig 3A), similar to Experiment 1 (Fig 2C). However, to our surprise,
immediately after the initial alpha inhibition (dotted red box), there appeared to be a signifi-
cant att–unatt alpha rebound during the following 200 ms (dotted black box), indicating that
attention switches to the unattended visual object by increasing the inhibitory alpha-band
activities on the attended object.
In sum, by examining the TRFs for attended and unattended visual sequences from the
same EEG responses in these 2 experiments, we discovered that the neural impulse responses
differ between attended and unattended stimuli, as manifested mainly in the alpha-band pro-
files. Attention first dwells on the attended stimulus by producing inhibitory alpha activity on
the unattended stimulus (significant for both Experiment 1 and Experiment 2) and then subse-
quently switches to the unattended stimulus by exerting inhibition on the attended stimulus
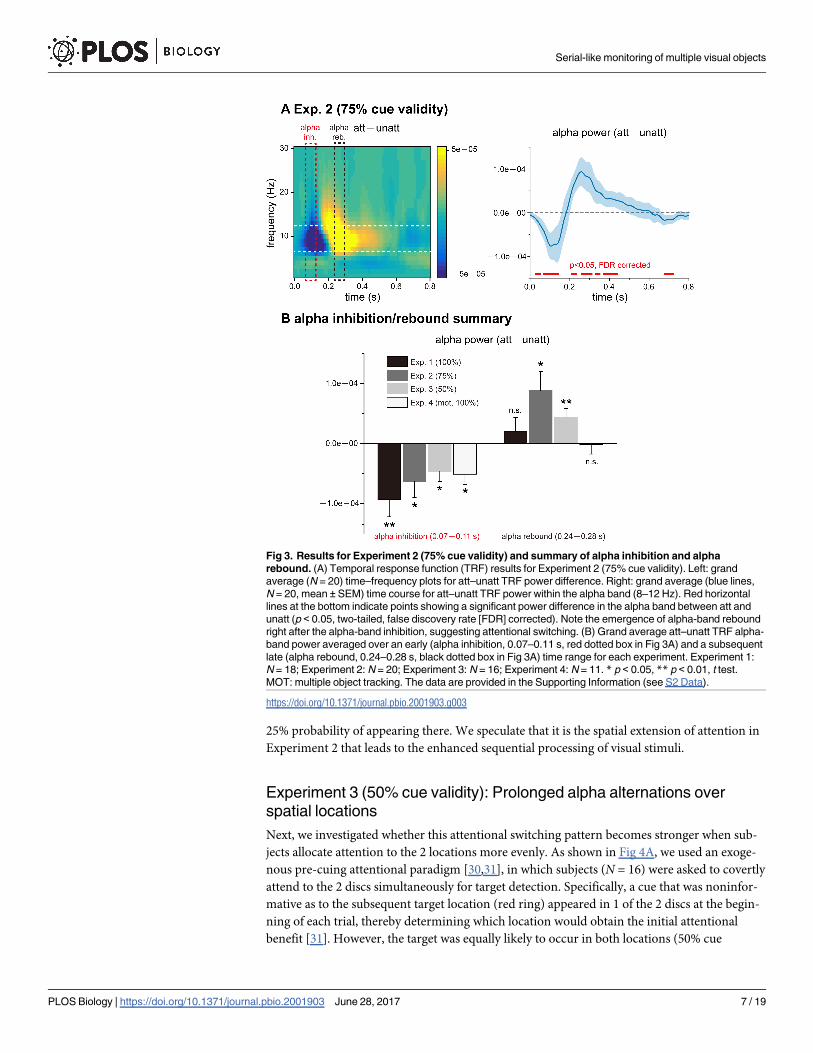
(not statistically significant in Experiment 1, statistically significant in Experiment 2). Fig 3B
summarizes the initial alpha inhibition and the subsequent alpha rebound for both experi-
ments, as well as for Experiments 3 and 4 (One-sample t test; Alpha inhibition: t = −3.27,
p = 0.005, Cohen’s d = −0.77 for Experiment 1; t = −2.42, p = 0.03, Cohen’s d = −0.54 for
Experiment 2; t = −2.82, p = 0.01, Cohen’s d = −0.71 for Experiment 3; t = −3.03, p = 0.01,
Cohen’s d = −0.91 for Experiment 4; Alpha rebound: t = 0.92, p = 0.37, Cohen’s d = 0.22 for
Experiment 1; t = 2.82, p = 0.01, Cohen’s d = 0.63 for Experiment 2; t = 3.12, p = 0.007, Cohen’s
d = 0.78 for Experiment 3; t = −0.12, p = 0.91, Cohen’s d = −0.04 for Experiment 4). Notably,
the alpha-rebound effects were different across experiments (two-way ANOVA, Att�experi-
ment interaction effect, F = 2.44, p = 0.07, partial η2 = 0.11).
A recent study revealed sustained alpha echoes in TRFs and their attentional enhancement
effects [25]. We therefore reexamined our results and also observed alpha echoes in the later
temporal range of TRFs (0.3–0.6 ms) and an increase in alpha power (att> unatt), but it was
not statistically significant (S3 Fig).
What is the reason for the observed difference in the TRFs between the 2 experiments? We
hypothesize that the difference in the cue validity (100% versus 75%) in the 2 experiments
resulted in different attentional distribution in space, which in turn led to the distinct temporal
course of attentional sampling. Specifically, in Experiment 1, with 100% cue validity, subjects
assigned all of their attention to the cued object, whereas in Experiment 2, with 75% cue valid-
ity, subjects also needed to allocate some attention to the uncued side, because the target had a
the bottom indicate points showing significant power differences in the alpha-band between att and unatt
(p < 0.05, two-tailed, false discovery rate [FDR] corrected). (D) Grand average distribution map for initial 200
ms alpha-band inhibition (mean alpha-band att − unatt TRF power difference within the first 200 ms, black
box in Fig 2C). White stars indicate channels with the strongest attentional alpha inhibition effects. The data
are provided in the Supporting Information (see S1 Data).
https://doi.org/10.1371/journal.pbio.2001903.g002
Serial-like monitoring of multiple visual objects
PLOS Biology | https://doi.org/10.1371/journal.pbio.2001903 June 28, 2017 6 / 19
25% probability of appearing there. We speculate that it is the spatial extension of attention in
Experiment 2 that leads to the enhanced sequential processing of visual stimuli.
Experiment 3 (50% cue validity): Prolonged alpha alternations over
spatial locations
Next, we investigated whether this attentional switching pattern becomes stronger when sub-
jects allocate attention to the 2 locations more evenly. As shown in Fig 4A, we used an exoge-
nous pre-cuing attentional paradigm [30,31], in which subjects (N = 16) were asked to covertly
attend to the 2 discs simultaneously for target detection. Specifically, a cue that was noninfor-
mative as to the subsequent target location (red ring) appeared in 1 of the 2 discs at the begin-
ning of each trial, thereby determining which location would obtain the initial attentional
benefit [31]. However, the target was equally likely to occur in both locations (50% cue
Fig 3. Results for Experiment 2 (75% cue validity) and summary of alpha inhibition and alpha
rebound. (A) Temporal response function (TRF) results for Experiment 2 (75% cue validity). Left: grand
average (N = 20) time–frequency plots for att–unatt TRF power difference. Right: grand average (blue lines,
N = 20, mean ± SEM) time course for att–unatt TRF power within the alpha band (8–12 Hz). Red horizontal
lines at the bottom indicate points showing a significant power difference in the alpha band between att and
unatt (p < 0.05, two-tailed, false discovery rate [FDR] corrected). Note the emergence of alpha-band rebound
right after the alpha-band inhibition, suggesting attentional switching. (B) Grand average att–unatt TRF alpha-
band power averaged over an early (alpha inhibition, 0.07–0.11 s, red dotted box in Fig 3A) and a subsequent
late (alpha rebound, 0.24–0.28 s, black dotted box in Fig 3A) time range for each experiment. Experiment 1:
N = 18; Experiment 2: N = 20; Experiment 3: N = 16; Experiment 4: N = 11. * p < 0.05, ** p < 0.01, t test.
MOT: multiple object tracking. The data are provided in the Supporting Information (see S2 Data).
https://doi.org/10.1371/journal.pbio.2001903.g003
Serial-like monitoring of multiple visual objects
PLOS Biology | https://doi.org/10.1371/journal.pbio.2001903 June 28, 2017 7 / 19

Fig 4. Experiment 3 (50% cue validity) and Experiment 4 (100% cue validity, multiple object tracking
[MOT]). (A) In Experiment 3 (50% cue validity), subjects fixated on a central point and covertly attended to 2
discs presented in the left and right visual fields for target detection. Subjects were instructed to simultaneously
pay attention to both discs and were informed that the target would be equally likely to appear within the discs
and that the initial cue would not predict the target location. After a noninformative red circle cue (cue validity:
50%) appeared around 1 of the 2 discs, the luminance of the 2 discs was independently and randomly
modulated for 5 s (top: cued visual sequence; bottom: uncued visual sequence), during which time subjects
were instructed to monitor a randomly occurring target. (B) Grand average (N = 16) time–frequency plots for
cued–uncued TRF power difference in Experiment 3 (cue validity: 50%). Note the prolonged alpha-band
switching (blue–red pattern), suggesting that attentional shifting is enhanced when attention is evenly distributed
across the 2 spatial locations (50% cue validity). (C) In Experiment 4 (MOT experiment), a red circle cue at
the beginning of each trial indicated which disc the subjects should covertly attend to for subsequent target
detection. The 2 disks were then moved randomly and smoothly across the screen for 5 s, during which time the
subjects were instructed to detect the appearance of a target within the cued disc. Here, the cue validity was
100%, which means that the target only appeared in the cued disk, similar to Experiment 1. (D) Experiment 4
results. Top: Grand average (N = 11) time–frequency plots for att–unatt TRF power difference. Bottom: grand
average (blue lines, N = 11, mean ±SEM) time course for att–unatt TRF power within the alpha band (8–12 Hz).
Serial-like monitoring of multiple visual objects
PLOS Biology | https://doi.org/10.1371/journal.pbio.2001903 June 28, 2017 8 / 19
validity). We then examined the temporal relationship in the TRFs between the cued and
uncued stimulus sequences.
The cued TRF, compared to the uncued TRF, showed an alpha-band pattern of inhibition
followed by rebound within the first 400 ms (Fig 4B), replicating the results of Experiment 1
and Experiment 2 (Fig 2C and Fig 3A). Notably, another sequence of alpha inhibition followed
by a rebound then appeared after the first 400 ms, indicating that the cued–uncued alpha-
band alternation became more enduring over time. Thus, attentional switching between loca-
tions becomes more temporally persistent when attention is instructed to evenly distributed
across the 2 spatial locations (50% cue validity).
Moreover, the 2 disc stimuli in all 3 experiments were presented in the left and right visual
fields, and therefore, the observed attentional switching could have been solely caused by inter-
hemispheric competition [32]. To address this issue, we ran a control experiment (N = 13) in
which the 2 discs were presented in the upper and lower visual fields within the same visual
hemifield (S4 Fig). The same alpha-band alternating pattern was observed, thus arguing
against the interpretation of interhemispheric competition.
Experiment 4 (100% cue validity, MOT): Object-based alpha sampling
After establishing the sensitivity of the alpha-band activity in the TRFs to spatial attention (i.e.,
attention to multiple spatial locations) in the 3 experiments, we asked whether the observed
attention-related inhibitory alpha effects could be extended to object space. We employed an
MOT paradigm to address this issue [33,34]. As shown in Fig 4C, at the beginning of each
trial, a cue (red ring, 100% cue validity) indicated which disc the subjects (N = 11) should
attend to for target detection. The 2 discs, whose luminance was again randomly modulated in
time, then underwent random smooth motion across the screen for 5 s, from which the TRF
was calculated for the attended and unattended discs. Interestingly, we observed similar att–
unatt alpha inhibition in the TRFs during the first 200 ms, as well as a subsequent nonsignifi-
cant rebound in alpha power (Fig 4D), parallel to the findings in Experiment 1 (Fig 2C, 100%
cue validity). The results thus suggest that the observed alpha-based profile is not confined to
space-based attention but presumably reflects a more general mechanism underlying object-
based attention.
Relation to attentional behavioral effects
Finally, to further evaluate the role of the alpha-band switching profile (i.e., alpha inhibition
followed by rebound) in attentional allocation, we calculated the correlation coefficients
between the behavioral (behavioral index, BI) and TRF (neuronal index, NI) results across
individual subjects. Specifically, the BI for each subject was calculated by comparing the
adjusted target contrast between attended and unattended (Contrastunatt−Contrastatt), and
the NI was represented by calculating the difference between the alpha inhibition and subse-
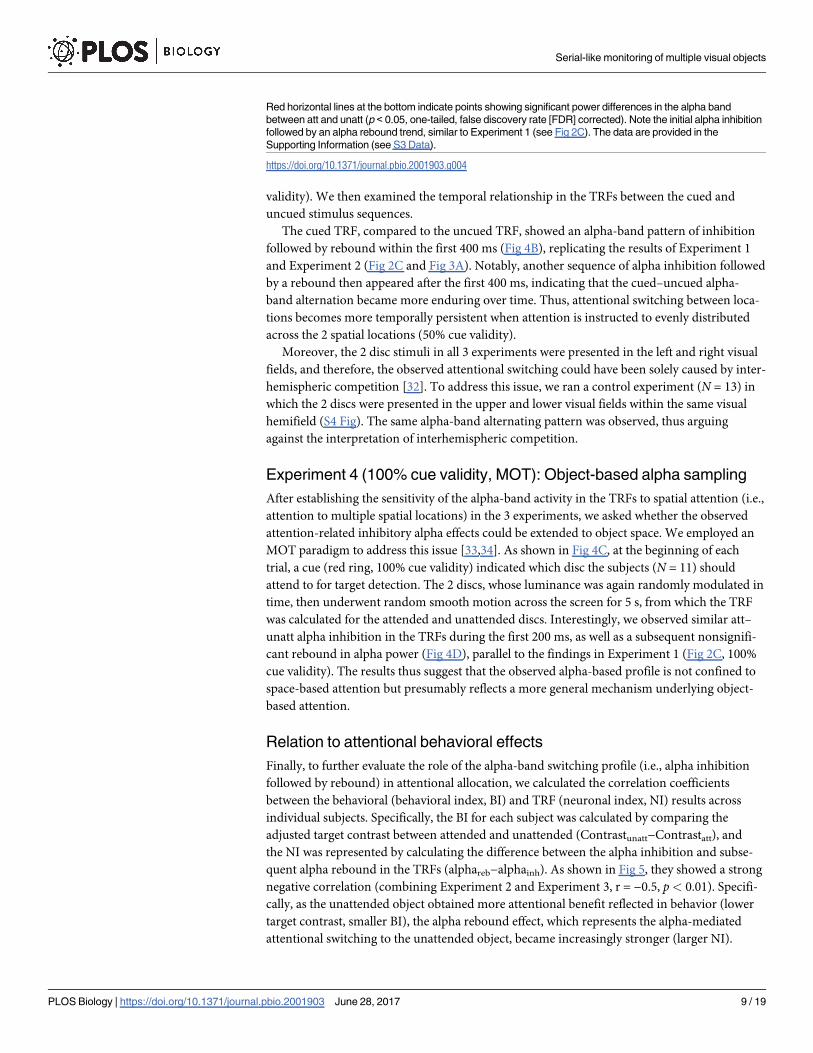
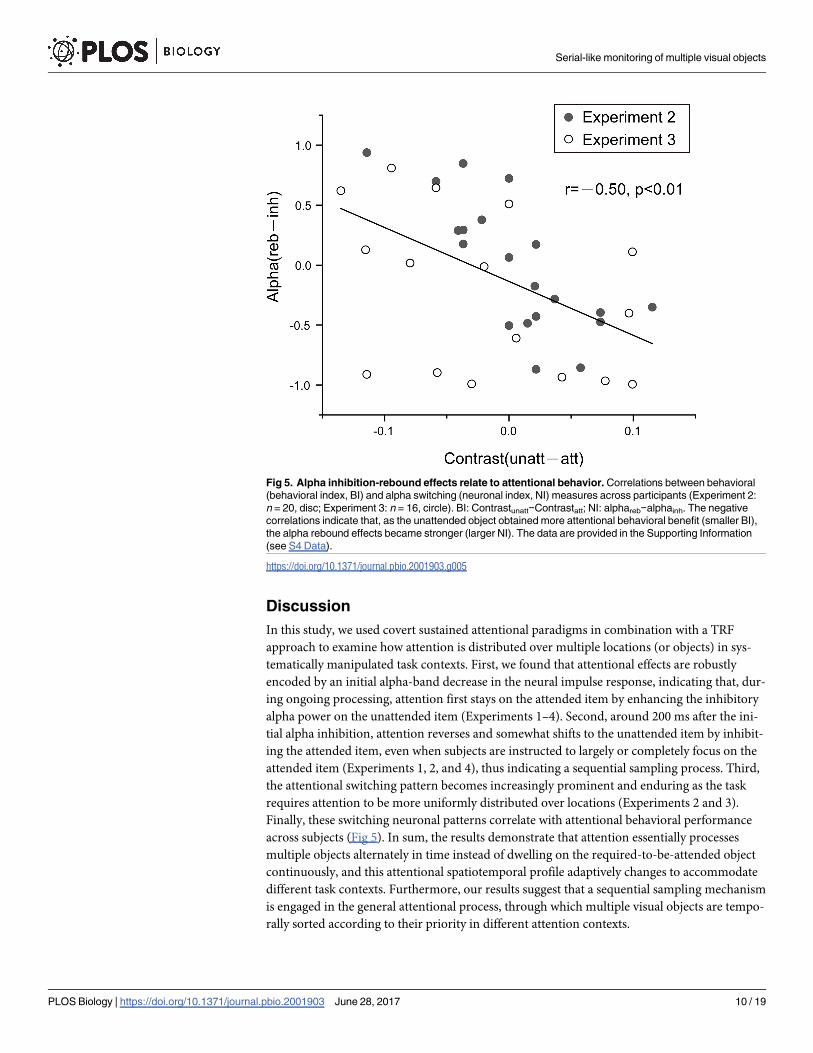
quent alpha rebound in the TRFs (alphareb−alphainh). As shown in Fig 5, they showed a strong
negative correlation (combining Experiment 2 and Experiment 3, r = −0.5, p< 0.01). Specifi-
cally, as the unattended object obtained more attentional benefit reflected in behavior (lower
target contrast, smaller BI), the alpha rebound effect, which represents the alpha-mediated
attentional switching to the unattended object, became increasingly stronger (larger NI).
Red horizontal lines at the bottom indicate points showing significant power differences in the alpha band
between att and unatt (p < 0.05, one-tailed, false discovery rate [FDR] corrected). Note the initial alpha inhibition
followed by an alpha rebound trend, similar to Experiment 1 (see Fig 2C). The data are provided in the
Supporting Information (see S3 Data).
https://doi.org/10.1371/journal.pbio.2001903.g004
Serial-like monitoring of multiple visual objects
PLOS Biology | https://doi.org/10.1371/journal.pbio.2001903 June 28, 2017 9 / 19
Discussion
In this study, we used covert sustained attentional paradigms in combination with a TRF
approach to examine how attention is distributed over multiple locations (or objects) in sys-
tematically manipulated task contexts. First, we found that attentional effects are robustly
encoded by an initial alpha-band decrease in the neural impulse response, indicating that, dur-
ing ongoing processing, attention first stays on the attended item by enhancing the inhibitory
alpha power on the unattended item (Experiments 1–4). Second, around 200 ms after the ini-
tial alpha inhibition, attention reverses and somewhat shifts to the unattended item by inhibit-
ing the attended item, even when subjects are instructed to largely or completely focus on the
attended item (Experiments 1, 2, and 4), thus indicating a sequential sampling process. Third,
the attentional switching pattern becomes increasingly prominent and enduring as the task
requires attention to be more uniformly distributed over locations (Experiments 2 and 3).
Finally, these switching neuronal patterns correlate with attentional behavioral performance
across subjects (Fig 5). In sum, the results demonstrate that attention essentially processes
multiple objects alternately in time instead of dwelling on the required-to-be-attended object
continuously, and this attentional spatiotemporal profile adaptively changes to accommodate
different task contexts. Furthermore, our results suggest that a sequential sampling mechanism
is engaged in the general attentional process, through which multiple visual objects are tempo-
rally sorted according to their priority in different attention contexts.
Fig 5. Alpha inhibition-rebound effects relate to attentional behavior. Correlations between behavioral
(behavioral index, BI) and alpha switching (neuronal index, NI) measures across participants (Experiment 2:
n = 20, disc; Experiment 3: n = 16, circle). BI: Contrastunatt−Contrastatt; NI: alphareb−alphainh. The negative
correlations indicate that, as the unattended object obtained more attentional behavioral benefit (smaller BI),
the alpha rebound effects became stronger (larger NI). The data are provided in the Supporting Information
(see S4 Data).
https://doi.org/10.1371/journal.pbio.2001903.g005
Serial-like monitoring of multiple visual objects
PLOS Biology | https://doi.org/10.1371/journal.pbio.2001903 June 28, 2017 10 / 19
We used a TRF method to extract item-based neural responses. Specifically, each item of
interest (e.g., a location or an object) was independently modulated by a temporal sequence
randomly generated in each trial, and linear regressions were used to model the stimulus–
response mapping. TRF thus enables the neural representation that exclusively and robustly
follows the specific item to be extracted from the noisy EEG signal. Notably, instead of repre-
senting the brain response over the course of a trial, the TRF actually represents the neural
impulse response, with the time axis representing the latency after each transient unit in the
stimulus. Specifically, each stimulus frame of the temporal sequence acts as an onset probe to
assess the associated elicited response. The computed TRF response, by counting all transients
throughout the whole trial, would then characterize the brain response for each transient unit
during ongoing stimulus processing at the attended location (att TRF) or the unattended loca-
tion (unatt TRF). Moreover, after removing the grand-averaged evoked TRF responses, we
observed a similar alpha-mediated switching pattern (S5 Fig), thus indicating that the observed
spectrotemporal patterns are not merely caused by the time-locked components.
In Experiments 1 and 2, when subjects were instructed to attend largely to 1 location, each
transient unit at the attended location was processed earlier (alpha inhibition within the first
200 ms) than at the unattended location (alpha rebound within the next 200 ms). In Experi-
ment 3, when the 2 locations were equally task-relevant, the TRF responses mainly reflect the
initial attentional capture effects at the cued location. Specifically, given the independent ran-
dom modulation of luminance at the 2 locations over the course of each trial, the overall influ-
ence of the ongoing luminance transients on TRF responses would then be balanced between
the 2 locations, leaving the TRF responses dominated by the initial attentional capture effects.
Consequently, the cued and uncued locations in Experiment 3 would correspond to the at-
tended and unattended locations in Experiments 1 and 2, respectively, but with different atten-
tional distributions (50% versus 100% and 75%). Taken together, all 3 experiments (1–3)
revealed an att-followed-by-unatt sequential activation profile, suggesting that attention sorts
neural representations of multiple locations along the temporal dimension according to their
attentional priority in various task contexts.
Most importantly, our results support a generally central function of the sequential sam-
pling mechanism in attention. First, the sequential sampling mechanism not only mediates
attentional processing when 2 locations are equally weighted in attention (50% cue validity,
Experiment 3), consistent with previous work [11,13,14,16,17], but is also essentially engaged
in classical selective attentional paradigms, during which time attention focuses mainly on one
location over the other (100% cue validity, 75% cue validity, Experiments 1 and 2). Second, the
sequential mechanism not only organizes attentional allocation over multiple spatial locations
but also mediates the sampling process in object-based space (Experiment 4). Finally, by sys-
tematically manipulating attentional contexts (different cue validities, Experiments 1–3), we
observed a covarying modulation in the sequential sampling profile. Thus, the results not only
suggest that the brain adaptably adjusts the temporal dynamics of attentional allocation among
objects to optimize performance but also further confirms the essential connections between
sequential sampling and attention. In sum, during sustained attention tasks, when subjects
mainly focus on 1 of many items throughout the trial, attention still intrinsically and rhythmi-
cally allocates resources to the out-of-focus items. This mechanism makes sense, given that, to
survive in a complex environment, it is important to monitor all potentially relevant parts of
the world, instead of solely focusing on the task at hand. This view is also in line with a recent
model proposing an oscillation-based temporal organization mechanism for processing task-
irrelevant inputs [18,35].
Furthermore, our results constitute direct and novel neural evidence for the rhythmic atten-
tion view [10,21]. Several previous studies based on behavioral measurements [11,13,16],
Serial-like monitoring of multiple visual objects
PLOS Biology | https://doi.org/10.1371/journal.pbio.2001903 June 28, 2017 11 / 19
including our own [14,17], have demonstrated rich oscillatory profiles in attentional perfor-
mance (i.e., behavioral oscillations), implying that attention rhythmically monitors multiple
locations, features, or objects. Recently, an important magnetoencephalography (MEG) study
showed that the ongoing pre-target gamma-band activities were out of phase in the theta band
(4 Hz) for detected versus missed targets [19], which also supports the rhythmic attention
view. However, the results mainly focus on pre-target baseline activities that essentially re-
present ongoing background signals; hence, there is still a lack of direct neural evidence for
whether and how the brain temporally mediates multiple visual objects during ongoing stimu-
lus processing. Instead, our results demonstrate that the brain organizes multiple visual objects
in time (i.e., sequential sampling) according to their attentional priority (i.e., attended before
unattended) during ongoing stimulus processing, thus providing direct neural evidence. Fur-
thermore, our results show that the sequential sampling profile adaptively changes to accom-
modate different attentional contexts, further confirming their close connections.
Another key aspect of our observations concerns the inhibitory role of alpha-band activity
in attention. It is acknowledged, with evidence from both human and animal studies, that
alpha-band responses are closely related to inhibitory functions in various cognitive processes
[26–29]. A recent study even disclosed inhibitory alpha-band pulses in behavioral performance
during attentional tasks [17]. The inhibitory nature of alpha-band activity has been proposed
as a mechanism that converts spatial representations into a temporal code by periodically gat-
ing the information flow [35–37]. Meanwhile, a recent experiment revealed long-lasting alpha
activity in the TRF responses (“alpha echoes”), which are indeed enhanced by attention [25].
We speculate that the difference between their results and ours (inhibition versus enhance-
ment) mainly occurred because we examined the dynamic structure of the alpha activity,
whereas the previous study focused on the overall alpha-echo power averaged over time; in-
deed, it is quite plausible that both effects coexist (e.g., see S3 Fig). Furthermore, previous pio-
neering EEG work has revealed that the phase of pre-target alpha-band activity modulates
subsequent visual perception, which mainly reflects the extent of temporal alignment between
the target and the background attentional excitatory state. Here, we examined the post-stimu-
lus responses instead, and our findings indicate that inhibitory alpha-band activity mediates
the multi-object sequential sampling process, such that each visual object is sequentially
selected by enhancing the inhibitory alpha-band power on the others.
Low-frequency rhythms, such as the delta and theta bands, have been postulated to consti-
tute the cycle of attentional selection by periodically modulating cortical excitability and seg-
menting inputs into temporal chunks [38–42]. In support, several recent psychophysical
studies have demonstrated rhythmic attentional sampling in behavioral performance [11–
14,16,17] and long serial-dependence effects in visual perception [43]. In this study, the atten-
tional selection cycle, consisting of initial alpha inhibition and subsequent alpha rebound,
lasted approximately 400 ms, which also corresponds to a low-frequency rhythm. Further-
more, we found that low-frequency attentional switching was maintained in object-based
attention, also consistent with a recent behavioral oscillation study [11,13].
In conclusion, the neural mechanisms of sustained attention are usually investigated by
assessing how attention modulates overall neuronal responses or pre-stimulus neuronal activity.
Here, we provide novel and direct neural evidence that, instead of dwelling on 1 item in a sta-
tionary way, attention explores multiple visual objects in a “serial-like” manner by producing
inhibitory alpha-band activity to each object in turn. Moreover, the spatiotemporal sampling
profiles are modulated adaptively in various task contexts and correlate with behavioral perfor-
mance. Our results imply the discrete nature of attention [10,44,45] and suggest that attention
acts as a temporal sequence concatenated by discrete, alpha-mediated attentional chunks, each
of which operates on 1 object at a time, conceptually similar to the discrete chunking model
Serial-like monitoring of multiple visual objects
PLOS Biology | https://doi.org/10.1371/journal.pbio.2001903 June 28, 2017 12 / 19
proposed for working memory [46–48]. Finally, and importantly, our study supports a generally
central function of temporal organization mechanism in multi-object attention.
Materials and methods
Participants
Seventy-eight adults aged 18–24 were recruited from Peking University. Eighteen subjects par-
ticipated in Experiment 1; 20 participated in Experiment 2; 16 participated in Experiment 3;
13 participated in the control experiment for Experiment 3; and 11 participated in Experiment
4. Some subjects attended more than 1 experiment. All participants had normal or corrected-
to-normal vision and had no history of psychiatric or neurological disorders. All experiments
were carried out in accordance with the Declaration of Helsinki. All participants provided
written informed consent prior to the start of the experiment, which was approved by the
Research Ethics Committee at Peking University (2015-03-05c2).
Stimuli and tasks
Subjects sat in a dark room in front of a CRT monitor (100 Hz refresh rate), and their heads
were stabilized using a chin rest. In each trial, subjects were requested to maintain fixation on
a central point and to covertly monitor the appearance of a target square (side length of 3.75˚
in Experiment 1–3; side length of 3˚ in Experiment 4) within 1 of the 2 peripheral discs (5.5˚)
that were presented at 7.5˚ to either side of the fixation point (Fig 1A). The target square was
presented for 0.5 s and occurred at a random time between 0.25 s and 4.25 s of the 5 s trial in
25% of the trials. At the end of each trial, subjects pressed 1 of 2 buttons to report whether they
had detected the target. Across trials, the contrast of the target square (i.e., target luminance
relative to the momentary background disc luminance) was adjusted according to the detec-
tion accuracy (using a 3-down-1-up staircase procedure), so that the overall target detection
performance was maintained at around 80%.
All subjects were instructed to keep the number of eye blinks to a minimum during the
experimental trials. Eye movements were monitored using an EyeLink 1000 eye tracker (SR
Research), and fixation was required within a 1˚ visual angle of the fixation point to initiate the
experimental trials. The results showed that the participants maintained good fixation on the
central cross (within 1˚) throughout the experimental trials.
Experiments 1 and 2. At the beginning of each trial, a central arrow cue (1-s duration)
was presented to indicate the disc (left or right) within which the target would appear later. In
Experiment 1 (cue validity of 100%), the target would only be presented in the cued disc and
never in the uncued disc. Subjects were informed of the cue validity and thus were aware that
they only needed to covertly attend to the cued disc for target detection while ignoring the
other disc throughout the 5-s trial. Experiment 2 was the same as Experiment 1, except that the
cue validity was 75%. The target appeared in the cued disc with a 75% probability and in the
uncued disc with a 25% probability. Subjects were also informed of the cue validity before the
experiment.
Experiment 3. In Experiment 3, the target occurred in the 2 discs with equal probability,
and therefore, subjects had to attend to both discs simultaneously for target detection. At the
beginning of each trial, a red ring, serving as a noninformative peripheral cue, appeared for 0.1
s around 1 of the 2 discs so that attention was reset to the corresponding disc [31]. Subjects
were informed that the cue in the experiment was 50% in validity and would not predict the
target location. In the control experiment for Experiment 3, the 2 discs (side length of 3.75˚)
were presented on 1 side of the fixation point (either left or right) and above and below the
horizontal meridian (4.5˚ in radius at 10.6˚ in eccentricity) (S4 Fig, left side).
Serial-like monitoring of multiple visual objects
PLOS Biology | https://doi.org/10.1371/journal.pbio.2001903 June 28, 2017 13 / 19
Experiment 4. Experiment 4 was the same as Experiment 1, except that, after the central
cue, the 2 discs moved constantly (19.2˚/s) across the screen in random directions (Fig 4C).
The disc bounced to reverse direction when it touched the edge of the screen or the other disc.
The cue validity was 100%, which means that the target would only be presented in the cued
disc and would never occur in the uncued disc. Subjects were informed of the cue validity and
only needed to covertly attend to the cued disc for target detection while ignoring the other
disc throughout the 5-s trial.
Luminance modulation. To extract the object-based impulse response using the TRF
technique, the luminance of the 2 discs was independently modulated in time each time the
frame refreshed (100 Hz monitor refresh rate), according to 2 randomly generated temporal
sequences. The CRT refresh rate of 100 Hz allowed us to present temporal frequencies ranging
between 0 and 50 Hz. Each randomly generated sequence was tailored to have equal power at
all frequencies by normalizing the amplitudes of its Fourier components before applying an
inverse Fourier transform. Luminance sequences ranged from black (0 cd/m2) to white (84.6
cd/m2).
EEG recording
EEG was recorded continuously using 2 BrainAmp amplifiers and a 64-channel ActiCap
(BrainProducts). Horizontal and vertical electrooculograms were recorded by 2 additional
electrodes around the subjects’ eyes. EEG data were offline band-pass filtered between 2 and
50 Hz. Independent component analysis was performed independently for each subject to
remove eye-movement and artifact components, and the remaining components were back-
projected onto the EEG electrode space. All channels were then referenced to the average value
of all channels. The EEG was downsampled to 100 Hz before TRF estimation with the stimulus
sequences. The stimulus time points for the 4 s before the last 0.5 s of the sequence were en-
tered in the TRF estimation, which was computed at all lags between 0 and 0.8 s. The selection
of EEG time points was intended to eliminate the influence of onset and offset responses on
the TRF computation.
Data analysis
TRF computation. The mapping between the stimuli luminance input and the recorded
EEG data output were analyzed using the multivariate temporal response function (mTRF)
toolbox [23,24]. The TRF describes the brain’s linear transformation of a stimulus input, S(t),
to the neural response output, R(t), as R(t) = TRF � S(t), where � denotes the convolution oper-
ator. Specifically, the TRF computations were performed by a regularized linear regression
between the stimulus luminance value and EEG amplitude. A parameter (lambda) was used
to control overfitting in the ridge regression. The lambda value was set to 1 for all subjects in
the present experiments. Note that the TRF represents an average measure of how the brain
responds to a unit change in luminance as a function of latency. The stimulus luminance val-
ues and EEG signals were concatenated across trials and then normalized before TRF calcula-
tion, so the TRFs were in arbitrary units.
Time–frequency analysis. The obtained TRF responses were then analyzed with
MATLAB (MathWorks, Inc., Natick, Massachusetts), using the FieldTrip toolbox [49] and
wavelet toolbox functions to examine their spectrotemporal power profiles. We analyzed the
TRFs for each condition and for each channel within each subject.
To assess the TRF profiles as a function of time (latency of 0–0.8 s) and frequency (0–30
Hz), the TRF temporal profile for each condition was transformed using the continuous com-
plex Gaussian wavelet transform (Wavelet toolbox, MATLAB), with frequencies ranging from
Serial-like monitoring of multiple visual objects
PLOS Biology | https://doi.org/10.1371/journal.pbio.2001903 June 28, 2017 14 / 19

1 to 30 Hz in increments of 1 Hz. The power profiles of the TRFs (squared absolute value) as a
function of time and frequency were then extracted from the output of the wavelet transform.
Differences in the power profile between the att and unatt conditions were calculated. This
time–frequency analysis was performed for each condition, for each channel, and for each sub-
ject separately. The grand mean of time–frequency power was then averaged across subjects.
Based on the scalp distribution of the alpha power difference between the att and unatt con-
ditions in the first 200 ms (e.g., Fig 2D shows the results of Experiment 1), data from electrodes
Pz, P1, and P2 were selected for further analysis in Experiments 1, 2, and 4. In Experiment 3
and its control experiment, the CPz, Cz, and FCz electrodes showed more prominent effects
and were selected for further analysis.
Correlation between behavior and alpha switching effects. Two indices (BI and NI)
were calculated for each subject. Data from Experiment 2 and Experiment 3 were combined to
increase the sample size. Experiment 1 was not included because the target only occurred in
the attended side (100% cue validity) and the behavioral results for the unattended condition
could not be examined.
Specifically, the BI, which characterizes the attentional behavioral difference between
attended and unattended conditions, was calculated as BI = Contrastunatt−Contrastatt, within
which the contrast refers to the adjusted contrast for the target when it occurred in the
attended or unattended object. The NI, which characterizes the normalized difference between
alpha rebound and alpha inhibition in the TRF results, was calculated as NI ¼ jrebj� jinhjjrebjþjinhj. A corre-
lation analysis between BI and NI across subjects was then performed.
Statistical procedures. To validate that the calculated TRFs were not artifacts, a randomi-
zation procedure was used to shuffle the relationship between trial EEG responses and the cor-
responding stimulus temporal sequence (Fig 2A). In the point-by-point statistics of the time
course shown in Fig 2C, Fig 3A and Fig 4D, we corrected all repeated tests in an analysis using
the false discovery rate [50]. The alpha inhibition and subsequent alpha rebound shown in Fig
3B were extracted from the average around the trough (70~110 ms) and the peak (250~290
ms) of the alpha power time course. Statistical differences in alpha inhibition and rebound
were examined with t tests against 0. Paired t tests were used to compare the magnitude of the
alpha echo between the conditions shown in S3 Fig. All error bars and intervals reflect the
standard error of the mean across subjects.
Supporting information
S1 Fig. Trial-averaged ERP responses. Top: ERP waveforms as a function of time (0–5 s).
Bottom: Distribution map for the initial ERP onset response, mainly derived from posterior
visual channels. Note that to avoid the influence of the onset and offset response, which may
bias the estimated temporal response function (TRF) results, we extracted the middle part (red
rectangle) of the 5-s EEG trial responses (0.5–4.5 s) for further TRF calculation. The data are
provided in the Supporting Information (see S5 Data).
(TIF)
S2 Fig. Control analysis for induced alpha & attentional effects in TRFs for left and right
stimuli separately. (A) Left: Power spectrum of the EEG during the 5-s stimulus presentation.
Right: Spatial distribution of induced alpha-band power. (B) Spatial distribution of induced
alpha-band power difference between trials where subjects attended to the left disc and trials
where subject attended to the right disc. Note the alpha-band inhibition in contralateral chan-
nels, consistent with previous findings. (C) Grand average time-frequency plots for attended
(att)–unattended (unatt) TRF power difference (top) and the distribution map for the initial
Serial-like monitoring of multiple visual objects
PLOS Biology | https://doi.org/10.1371/journal.pbio.2001903 June 28, 2017 15 / 19
200 ms alpha-band (dotted white box) inhibition (bottom), for discs presented in the left visual
field. (D) Same as C but for discs presented in the right visual field. Note the similar initial
alpha-band inhibition and similar spatial distribution to those in Fig 2C & 2D. The data are
provided in the Supporting Information (see S6 Data).
(TIF)
S3 Fig. Control analysis for alpha echoes. (A) Alpha echoes in Experiment 1. Grand average
time-frequency power profile for attended (att) TRF (left) and unattended (unatt) TRF (right),
as a function of latency (0.3–0.8 s) and frequency (0–30 Hz). (B) Alpha-echo power (averaged
from 0.3–0.6 s, dotted black rectangle) for att (black bar) and unatt (white bar) TRFs. (C) Same
as (A) but for Experiment 2. (D) Same as (B) but for Experiment 2. Note the larger overall
alpha echoes in both experiments, similar to the results of VanRullen and MacDonald (2012).
The data are provided in the Supporting Information (see S7 Data).
(TIF)
S4 Fig. Control experiment for Experiment 3. Left: Subjects fixated on a central point and
covertly attended to two discs presented in the upper and lower visual field, within the same
visual hemifield. Subjects were instructed to pay attention to the two discs simultaneously and
were informed that the target was equally likely to appear within both and that the initial cue
would not predict the target location. After an uninformative red circle cue (cue validity: 50%)
appeared in one of the two discs, the luminance of the two discs was independently and ran-
domly modulated for 5 seconds. Right: Grand average (N = 13) time-frequency plots for cued–
uncued TRF power difference. Note the same alpha-band alternating pattern, thus arguing
against the interpretation of interhemispheric competition for Experiment 3. The data are pro-
vided in the Supporting Information (see S8 Data).
(TIF)
S5 Fig. Time-frequency power profile (Att-Unatt) after removing evoked components.
Left: Experiment 1 (cue validity: 100%; N = 18); Middle: Experiment 2 (cue validity: 75%;
N = 20); Right: Experiment 1 (cue validity: 50%; N = 16). The data are provided in the Support-
ing Information (see S9 Data).
(TIF)
S1 Data. Data for Fig 2.
(XLSX)
S2 Data. Data for Fig 3.
(XLSX)
S3 Data. Data for Fig 4.
(XLSX)
S4 Data. Data for Fig 5.
(XLSX)
S5 Data. Data for S1 Fig.
(XLSX)
S6 Data. Data for S2 Fig.
(XLSX)
S7 Data. Data for S3 Fig.
(XLSX)
Serial-like monitoring of multiple visual objects
PLOS Biology | https://doi.org/10.1371/journal.pbio.2001903 June 28, 2017 16 / 19
S8 Data. Data for S4 Fig.
(XLSX)
S9 Data. Data for S5 Fig.
(XLSX)
Acknowledgments
We thank Michael Crosse and Dr. Nai Ding for TRF technique consultation and Dr. Saskia
Haegens for helpful suggestions.
Author Contributions
Conceptualization: Jianrong Jia, Fang Fang, Huan Luo.
Formal analysis: Jianrong Jia, Huan Luo.
Funding acquisition: Huan Luo.
Investigation: Jianrong Jia, Fang Fang, Huan Luo.
Methodology: Jianrong Jia, Huan Luo.
Software: Ling Liu.
Supervision: Huan Luo.
Visualization: Jianrong Jia, Huan Luo.
Writing – original draft: Jianrong Jia, Fang Fang, Huan Luo.
Writing – review & editing: Jianrong Jia, Ling Liu, Fang Fang, Huan Luo.
References
1. Carrasco M. Visual attention: the past 25 years. Vision Res. 2011; 51: 1484–525. https://doi.org/10.
1016/j.visres.2011.04.012 PMID: 21549742
2. Chun MM, Marois R. The dark side of visual attention. Curr Opin Neurobiol. 2002; 12: 184–189. https://
doi.org/10.1016/S0959-4388(02)00309-4 PMID: 12015235
3. Desimone R, Duncan J. Neural mechanisms of selective visual attention. Annu Rev Neurosci. 1995; 18:
193–222. https://doi.org/10.1146/annurev.ne.18.030195.001205 PMID: 7605061
4. Marois R, Ivanoff J. Capacity limits of information processing in the brain. Trends Cogn Sci. 2005; 9:
296–305. https://doi.org/10.1016/j.tics.2005.04.010 PMID: 15925809
5. Chen J, He Y, Zhu Z, Zhou T, Peng Y, Zhang X, et al. Attention-Dependent Early Cortical Suppression
Contributes to Crowding. J Neurosci. 2014; 34: 10465–10474. https://doi.org/10.1523/JNEUROSCI.
1140-14.2014 PMID: 25100582
6. Fries P, Reynolds JH, Rorie AE, Desimone R. Modulation of oscillatory neuronal synchronization by
selective visual attention. Science. 2001; 291: 1560–1563. https://doi.org/10.1126/science.291.5508.
1560 PMID: 11222864
7. Reynolds JH, Pasternak T, Desimone R. Attention Increases Sensitivity of V4 Neurons. Neuron. 2000;
26: 703–714. https://doi.org/10.1016/S0896-6273(00)81206-4 PMID: 10896165
8. Reynolds JH, Chelazzi L. Attentional modulation of visual processing. Annu Rev Neurosci. 2004; 27:
611–47. https://doi.org/10.1146/annurev.neuro.26.041002.131039 PMID: 15217345
9. Tsotsos JK. Analyzing vision at the complexity level. Behav Brain Sci. 1990; 13: 423–445. https://doi.
org/10.1017/S0140525X00079577
10. VanRullen R, Carlson T, Cavanagh P. The blinking spotlight of attention. Proc Natl Acad Sci. 2007; 104:
19204–19209. https://doi.org/10.1073/pnas.0707316104 PMID: 18042716
11. Drewes J, Zhu W, Wutz A, Melcher D. Dense sampling reveals behavioral oscillations in rapid visual
categorization. Sci Rep. 2015; 5: 16290. https://doi.org/10.1038/srep16290 PMID: 26542183
Serial-like monitoring of multiple visual objects
PLOS Biology | https://doi.org/10.1371/journal.pbio.2001903 June 28, 2017 17 / 19

12. Dugue L, Roberts M, Carrasco M. Attention Reorients Periodically. Curr Biol. 2016; 26: 1595–1601.
https://doi.org/10.1016/j.cub.2016.04.046 PMID: 27265395
13. Fiebelkorn IC, Saalmann YB, Kastner S. Rhythmic Sampling within and between Objects despite Sus-
tained Attention at a Cued Location. Curr Biol. 2013; 23: 2553–2558. https://doi.org/10.1016/j.cub.
2013.10.063 PMID: 24316204
14. Huang Y, Chen L, Luo H. Behavioral Oscillation in Priming: Competing Perceptual Predictions Con-
veyed in Alternating Theta-Band Rhythms. J Neurosci. 2015; 35: 2830–2837. https://doi.org/10.1523/
JNEUROSCI.4294-14.2015 PMID: 25673869
15. Jeurissen D, Self MW, Roelfsema PR. Serial grouping of 2D-image regions with object-based attention
in humans. Kastner S, editor. eLife. 2016; 5: e14320. https://doi.org/10.7554/eLife.14320 PMID:
27291188
16. Landau AN, Fries P. Attention Samples Stimuli Rhythmically. Curr Biol. 2012; 22: 1000–1004. https://
doi.org/10.1016/j.cub.2012.03.054 PMID: 22633805
17. Song K, Meng M, Chen L, Zhou K, Luo H. Behavioral Oscillations in Attention: Rhythmic α Pulses Medi-
ated through θ Band. J Neurosci. 2014; 34: 4837–4844. https://doi.org/10.1523/JNEUROSCI.4856-13.
2014 PMID: 24695703
18. Jensen O, Bonnefond M, VanRullen R. An oscillatory mechanism for prioritizing salient unattended sti-
muli. Trends Cogn Sci. 2012; 16: 200–206. https://doi.org/10.1016/j.tics.2012.03.002 PMID: 22436764
19. Landau AN, Schreyer HM, van Pelt S, Fries P. Distributed Attention Is Implemented through Theta-
Rhythmic Gamma Modulation. Curr Biol. 2015; 25: 2332–2337. https://doi.org/10.1016/j.cub.2015.07.
048 PMID: 26279231
20. Tomassini A, Spinelli D, Jacono M, Sandini G, Morrone MC. Rhythmic Oscillations of Visual Contrast
Sensitivity Synchronized with Action. J Neurosci. 2015; 35: 7019–7029. https://doi.org/10.1523/
JNEUROSCI.4568-14.2015 PMID: 25948254
21. Busch NA, Dubois J, VanRullen R. The Phase of Ongoing EEG Oscillations Predicts Visual Perception.
J Neurosci. 2009; 29: 7869–7876. https://doi.org/10.1523/JNEUROSCI.0113-09.2009 PMID:
19535598
22. Ding N, Simon JZ. Neural coding of continuous speech in auditory cortex during monaural and dichotic
listening. J Neurophysiol. 2012; 107: 78–89. https://doi.org/10.1152/jn.00297.2011 PMID: 21975452
23. Goncalves NR, Whelan R, Foxe JJ, Lalor EC. Towards obtaining spatiotemporally precise responses to
continuous sensory stimuli in humans: A general linear modeling approach to EEG. NeuroImage. 2014;
97: 196–205. https://doi.org/10.1016/j.neuroimage.2014.04.012 PMID: 24736185
24. Lalor EC, Pearlmutter BA, Reilly RB, McDarby G, Foxe JJ. The VESPA: A method for the rapid estima-
tion of a visual evoked potential. NeuroImage. 2006; 32: 1549–1561. https://doi.org/10.1016/j.
neuroimage.2006.05.054 PMID: 16875844
25. VanRullen R, Macdonald JSP. Perceptual Echoes at 10 Hz in the Human Brain. Curr Biol. 2012; 22:
995–999. https://doi.org/10.1016/j.cub.2012.03.050 PMID: 22560609
26. Haegens S, Luther L, Jensen O. Somatosensory anticipatory alpha activity increases to suppress dis-
tracting input. J Cogn Neurosci. 2012; 24: 677–685. https://doi.org/10.1162/jocn_a_00164 PMID:
22066587
27. Handel BF, Haarmeier T, Jensen O. Alpha oscillations correlate with the successful inhibition of unat-
tended stimuli. J Cogn Neurosci. 2011; 23: 2494–2502. https://doi.org/10.1162/jocn.2010.21557 PMID:
20681750
28. Klimesch W. Alpha-band oscillations, attention, and controlled access to stored information. Trends
Cogn Sci. 2012; 16: 606–617. https://doi.org/10.1016/j.tics.2012.10.007 PMID: 23141428
29. Klimesch W, Sauseng P, Hanslmayr S. EEG alpha oscillations: The inhibition–timing hypothesis. Brain
Res Rev. 2007; 53: 63–88. https://doi.org/10.1016/j.brainresrev.2006.06.003 PMID: 16887192
30. Klein RM. Inhibition of return. Trends Cogn Sci. 2000; 4: 138–147. https://doi.org/10.1016/S1364-6613
(00)01452-2 PMID: 10740278
31. Posner MI. Orienting of attention. Q J Exp Psychol. 1980; 32: 3–25. https://doi.org/10.1080/
00335558008248231 PMID: 7367577
32. Alvarez GA, Cavanagh P. Independent resources for attentional tracking in the left and right visual
hemifields. Psychol Sci. 2005; 16: 637–643. https://doi.org/10.1111/j.1467-9280.2005.01587.x PMID:
16102067
33. Cavanagh P, Alvarez G. Tracking multiple targets with multifocal attention. Trends Cogn Sci. 2005; 9:
349–354. https://doi.org/10.1016/j.tics.2005.05.009 PMID: 15953754
34. He S, Cavanagh P, Intriligator J. Attentional resolution and the locus of visual awareness. Nature. 1996;
383: 334–337. https://doi.org/10.1038/383334a0 PMID: 8848045
Serial-like monitoring of multiple visual objects
PLOS Biology | https://doi.org/10.1371/journal.pbio.2001903 June 28, 2017 18 / 19
35. Jensen O, Gips B, Bergmann TO, Bonnefond M. Temporal coding organized by coupled alpha and
gamma oscillations prioritize visual processing. Trends Neurosci. 2014; 37: 357–369. https://doi.org/10.
1016/j.tins.2014.04.001 PMID: 24836381
36. Samaha J, Postle BR. The Speed of Alpha-Band Oscillations Predicts the Temporal Resolution of
Visual Perception. Curr Biol. 2015; 25: 2985–2990. https://doi.org/10.1016/j.cub.2015.10.007 PMID:
26526370
37. Zumer JM, Scheeringa R, Schoffelen J-M, Norris DG, Jensen O. Occipital Alpha Activity during Stimu-
lus Processing Gates the Information Flow to Object-Selective Cortex. Vogel E, editor. PLoS Biol. 2014;
12: e1001965. https://doi.org/10.1371/journal.pbio.1001965 PMID: 25333286
38. Buschman TJ, Kastner S. From Behavior to Neural Dynamics: An Integrated Theory of Attention. Neu-
ron. 2015; 88: 127–144. https://doi.org/10.1016/j.neuron.2015.09.017 PMID: 26447577
39. Fries P. Neuronal Gamma-Band Synchronization as a Fundamental Process in Cortical Computation.
Annu Rev Neurosci. 2009; 32: 209–224. https://doi.org/10.1146/annurev.neuro.051508.135603 PMID:
19400723
40. Giraud A-L, Poeppel D. Cortical oscillations and speech processing: emerging computational principles
and operations. Nat Neurosci. 2012; 15: 511–517. https://doi.org/10.1038/nn.3063 PMID: 22426255
41. Schroeder CE, Lakatos P. Low-frequency neuronal oscillations as instruments of sensory selection.
Trends Neurosci. 2009; 32: 9–18. https://doi.org/10.1016/j.tins.2008.09.012 PMID: 19012975
42. Wutz A, Muschter E, van Koningsbruggen MG, Weisz N, Melcher D. Temporal Integration Windows in
Neural Processing and Perception Aligned to Saccadic Eye Movements. Curr Biol. 2016; 26: 1659–
1668. https://doi.org/10.1016/j.cub.2016.04.070 PMID: 27291050
43. Fischer J, Whitney D. Serial dependence in visual perception. Nat Neurosci. 2014; 17: 738–743. https://
doi.org/10.1038/nn.3689 PMID: 24686785
44. Dugue L, McLelland D, Lajous M, VanRullen R. Attention searches nonuniformly in space and in time.
Proc Natl Acad Sci. 2015; 112: 15214–15219. https://doi.org/10.1073/pnas.1511331112 PMID:
26598671
45. VanRullen R. Perceptual Cycles. Trends Cogn Sci. 2016; 20: 723–735. https://doi.org/10.1016/j.tics.
2016.07.006 PMID: 27567317
46. Baddeley A. Working Memory: Theories, Models, and Controversies. Annu Rev Psychol. 2012; 63: 1–
29. https://doi.org/10.1146/annurev-psych-120710-100422 PMID: 21961947
47. Lisman JE, Marco A. P. I. Storage of 7 ± 2 Short-Term Memories in Oscillatory Subcycles. Science.
1995; 267: 1512–1515. https://doi.org/10.1126/science.7878473 PMID: 7878473
48. Zhang W, Luck SJ. Discrete fixed-resolution representations in visual working memory. Nature. 2008;
453: 233–235. https://doi.org/10.1038/nature06860
49. Oostenveld R, Fries P, Maris E, Schoffelen J-M. FieldTrip: Open Source Software for Advanced Analy-
sis of MEG, EEG, and Invasive Electrophysiological Data. Comput Intell Neurosci. 2011; 2011: 1–9.
https://doi.org/10.1155/2011/156869 PMID: 21253357
50. Storey JD. A direct approach to false discovery rates. J R Stat Soc Ser B Stat Methodol. 2002; 64: 479–
498. https://doi.org/10.1111/1467-9868.00346
Serial-like monitoring of multiple visual objects
PLOS Biology | https://doi.org/10.1371/journal.pbio.2001903 June 28, 2017 19 / 19