
Artificiel Neural Networks 2 Morten Nielsen Department of Systems Biology, DTU.
Upload
raven-turnerCategory
view
60download
1description

Sequence encoding, Cross Validation
Morten NielsenBioSys, DTU

Outline
• Sequence encoding– How to represent biological data
• Overfitting– cross-validation
• Method evaluation
Sequence encoding
• Encoding of sequence data– Sparse encoding– Blosum encoding– Sequence profile encoding– Reduced amino acid alphabets

Sparse encoding
Inp Neuron 1 2 3 4 5 6 7 8 9 10 11 12 13 14 15 16 17 18 19 20
AAcid
A 1 0 0 0 0 0 0 0 0 0 0 0 0 0 0 0 0 0 0 0
R 0 1 0 0 0 0 0 0 0 0 0 0 0 0 0 0 0 0 0 0
N 0 0 1 0 0 0 0 0 0 0 0 0 0 0 0 0 0 0 0 0
D 0 0 0 1 0 0 0 0 0 0 0 0 0 0 0 0 0 0 0 0
C 0 0 0 0 1 0 0 0 0 0 0 0 0 0 0 0 0 0 0 0
Q 0 0 0 0 0 1 0 0 0 0 0 0 0 0 0 0 0 0 0 0
E 0 0 0 0 0 0 1 0 0 0 0 0 0 0 0 0 0 0 0 0

BLOSUM encoding (Blosum50 matrix)
A R N D C Q E G H I L K M F P S T W Y V A 4 -1 -2 -2 0 -1 -1 0 -2 -1 -1 -1 -1 -2 -1 1 0 -3 -2 0R -1 5 0 -2 -3 1 0 -2 0 -3 -2 2 -1 -3 -2 -1 -1 -3 -2 -3N -2 0 6 1 -3 0 0 0 1 -3 -3 0 -2 -3 -2 1 0 -4 -2 -3D -2 -2 1 6 -3 0 2 -1 -1 -3 -4 -1 -3 -3 -1 0 -1 -4 -3 -3C 0 -3 -3 -3 9 -3 -4 -3 -3 -1 -1 -3 -1 -2 -3 -1 -1 -2 -2 -1Q -1 1 0 0 -3 5 2 -2 0 -3 -2 1 0 -3 -1 0 -1 -2 -1 -2E -1 0 0 2 -4 2 5 -2 0 -3 -3 1 -2 -3 -1 0 -1 -3 -2 -2G 0 -2 0 -1 -3 -2 -2 6 -2 -4 -4 -2 -3 -3 -2 0 -2 -2 -3 -3H -2 0 1 -1 -3 0 0 -2 8 -3 -3 -1 -2 -1 -2 -1 -2 -2 2 -3I -1 -3 -3 -3 -1 -3 -3 -4 -3 4 2 -3 1 0 -3 -2 -1 -3 -1 3L -1 -2 -3 -4 -1 -2 -3 -4 -3 2 4 -2 2 0 -3 -2 -1 -2 -1 1K -1 2 0 -1 -3 1 1 -2 -1 -3 -2 5 -1 -3 -1 0 -1 -3 -2 -2M -1 -1 -2 -3 -1 0 -2 -3 -2 1 2 -1 5 0 -2 -1 -1 -1 -1 1F -2 -3 -3 -3 -2 -3 -3 -3 -1 0 0 -3 0 6 -4 -2 -2 1 3 -1P -1 -2 -2 -1 -3 -1 -1 -2 -2 -3 -3 -1 -2 -4 7 -1 -1 -4 -3 -2S 1 -1 1 0 -1 0 0 0 -1 -2 -2 0 -1 -2 -1 4 1 -3 -2 -2T 0 -1 0 -1 -1 -1 -1 -2 -2 -1 -1 -1 -1 -2 -1 1 5 -2 -2 0W -3 -3 -4 -4 -2 -2 -3 -2 -2 -3 -2 -3 -1 1 -4 -3 -2 11 2 -3Y -2 -2 -2 -3 -2 -1 -2 -3 2 -1 -1 -2 -1 3 -3 -2 -2 2 7 -1V 0 -3 -3 -3 -1 -2 -2 -3 -3 3 1 -2 1 -1 -2 -2 0 -3 -1 4

Sequence encoding (continued)
• Sparse encoding– V:0 0 0 0 0 0 0 0 0 0 0 0 0 0 0 0 0 0 0 1– L:0 0 0 0 0 0 0 0 1 0 0 0 0 0 0 0 0 0 0 0
– V.L=0 (unrelated)
• Blosum encoding– V: 0 -3 -3 -3 -1 -2 -2 -3 -3 3 1 -2 1 -1 -2 -2 0 -3 -1 4
– L:-1 -2 -3 -4 -1 -2 -3 -4 -3 2 4 -2 2 0 -3 -2 -1 -2 -1 1 – V.L = 0.88 (highly related)– V.R = -0.08 (close to unrelated)

Sequence encoding (continued)
• Each amino acids is encoded by 20 variables– This might be highly ineffective– Can this number be reduced without losing
predictive performance?– Use reduced amino acid alphabet
• Charge, volume, hydrophobicity, Chemical descriptors
• Appealing, but in my experience it does not work -)

• A prediction method contains a very large set of parameters
– A matrix for predicting binding for 9meric peptides has 9x20=180 weights
• Over fitting is a problem
Evaluation of predictive performance
yearsTemperature
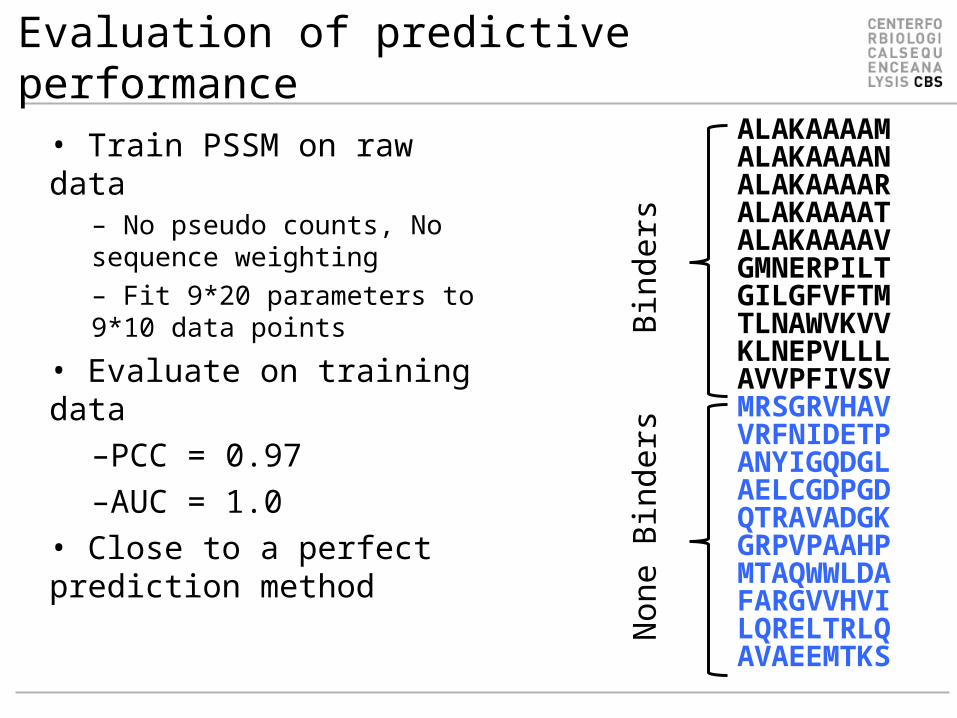
ALAKAAAAMALAKAAAANALAKAAAARALAKAAAATALAKAAAAVGMNERPILTGILGFVFTMTLNAWVKVVKLNEPVLLLAVVPFIVSVMRSGRVHAVVRFNIDETPANYIGQDGLAELCGDPGDQTRAVADGKGRPVPAAHPMTAQWWLDAFARGVVHVILQRELTRLQAVAEEMTKS
Evaluation of predictive performance• Train PSSM on raw data
– No pseudo counts, No sequence weighting– Fit 9*20 parameters to 9*10 data points
• Evaluate on training data–PCC = 0.97–AUC = 1.0
• Close to a perfect prediction method
Bin
ders
Non
e B
ind
ers

AAAMAAKLAAAKNLAAAAAKALAAAARAAAAKLATAALAKAVAAAIPELMRTNGFIMGVFTGLNVTKVVAWLLEPLNLVLKVAVIVSVPFMRSGRVHAVVRFNIDETPANYIGQDGLAELCGDPGDQTRAVADGKGRPVPAAHPMTAQWWLDAFARGVVHVILQRELTRLQAVAEEMTKS
Evaluation of predictive performance• Train PSSM on Permuted data
– No pseudo counts, No sequence weighting– Fit 9*20 parameters to 9*10 data points
• Evaluate on training data–PCC = 0.97–AUC = 1.0
• Close to a perfect prediction method AND• Same performance as one the original data
Bin
ders
Non
e B
ind
ers

Repeat on large training data (229 ligands)

Cross validation
Train on 4/5 of dataTest/evaluate on 1/5=>Produce 5 different methods each with a different prediction focus

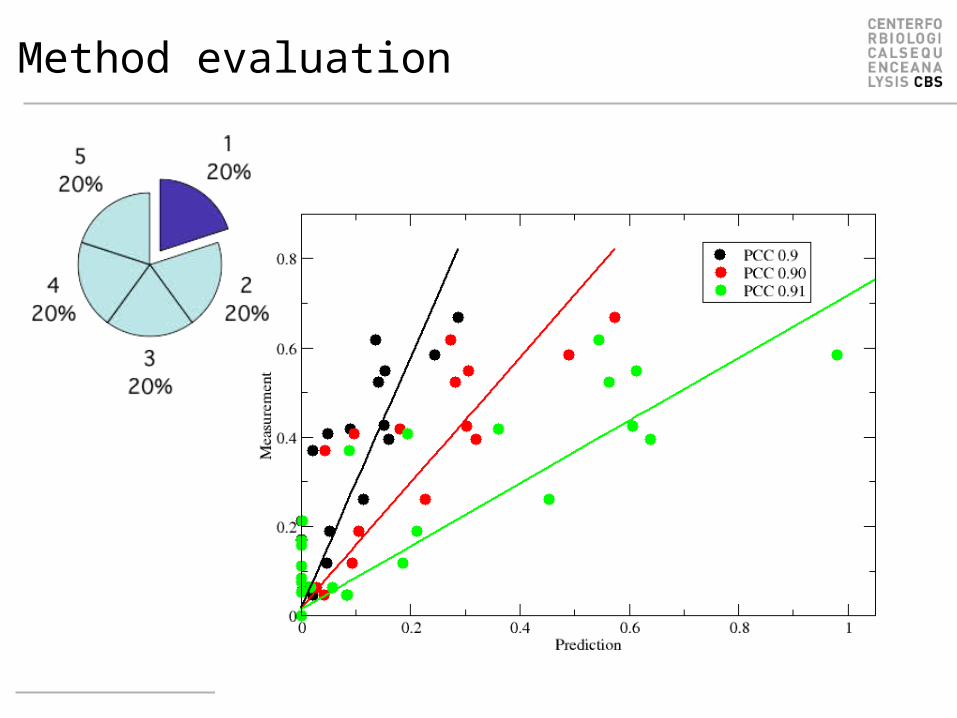
Method evaluation
• Use cross validation• Evaluate on concatenated data and not
as an average over each cross-validated performance
• And even better, use an external evaluation set, that is not part of the training data

Method evaluation
• How is an external evaluation set evaluated on a 5 fold cross-validated training?– The cross-validation generates 5 individual
methods– Predict the evaluation set on each of the 5
methods and take average
Method evaluation

Method evaluation

5 fold training
Which PSSM to choose?

5 fold training. Use them all
Summary
• Define with encoding scheme to use– Sparse, Blosum, reduced alphabet, and
combinations of these
• Deal with over-fitting– Evaluate method using cross-validation– Evaluate external data using method
ensemble