

SeqMonk tools for methylation analysis
20
Transcript of SeqMonk tools for methylation analysis

SeqMonk
2
SeqMonk Data Model
• Conventional data (ChIP-Seq, RNA-Seq etc)– Data is reads (BAM files etc)
– Strand indicates genomic strand
• BS-Seq and related data– Data is methylation calls
– All ‘reads’ are 1bp in length
– Strand indicates meth state (+=meth -=unmeth)
– Original strand comes from the imported file
3

Raw Data
Red = MethBlue = Unmeth
4

Basic Movement Controls
• Move left right– Drag bottom scrollbar– Mouse scroll wheel– Left/Right arrows
• Zoom In– Drag a box and release– Up arrow
• Zoom Out– Right mouse button– Down arrow
• Find a feature– Edit > Find Feature– Control+F
• Change chromosome– Edit > Goto Position– Drag a box in the genome view
5
Genome ViewData View
Chromosome View
Quantitations
Reads / Calls
Annotation

Raw Data Display
View > Data Track Display 6

Quantitation Model
• Probe = Location to make a measurement
• ProbeSet = Collection of probes
• Quantitation associates a value with each probe for each data set.
• Define Probes > Quantitate Probes > Visualise
7

Probe Generation
8
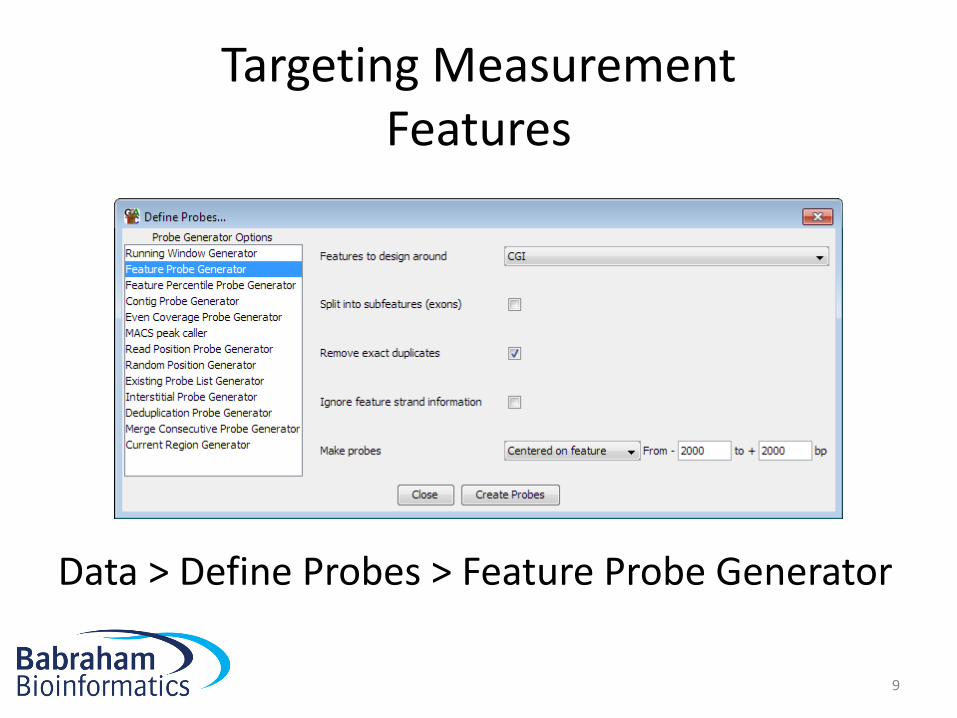
Targeting MeasurementFeatures
Data > Define Probes > Feature Probe Generator
9
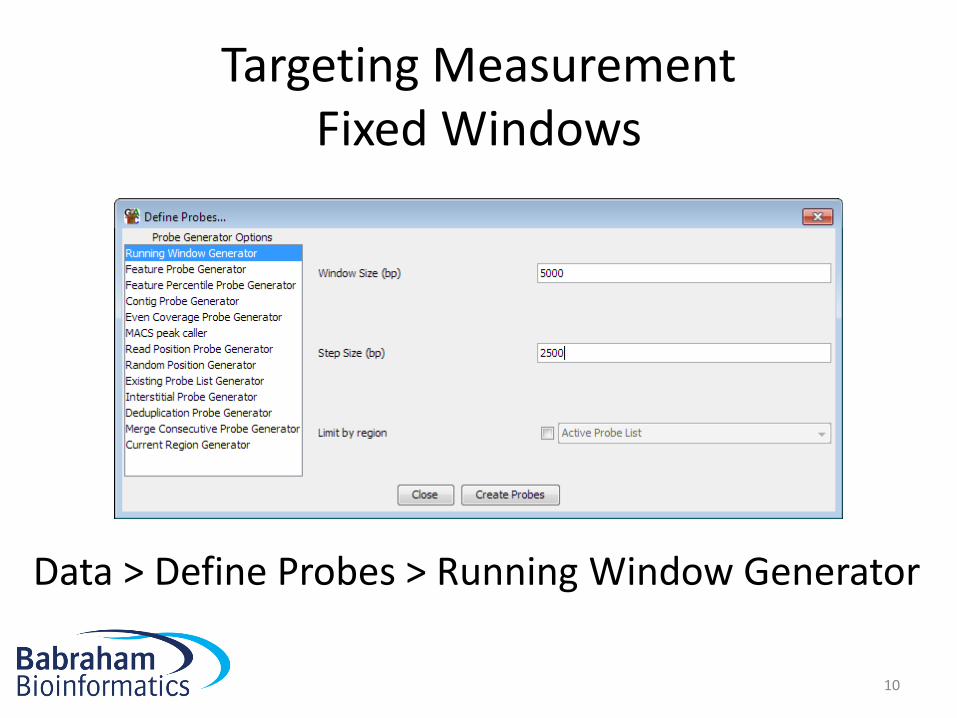
Targeting MeasurementFixed Windows
Data > Define Probes > Running Window Generator
10

Targeting MeasurementFixed number of calls
Data > Define Probes > Even Coverage Probe Generator
11

Targeting MeasurementFixed number of call positions
Data > Define Probes > Read Position Probe Generator
12

Quantitation
13

Methylation MeasurementSimple percentage of all calls
Data > Quantitate Existing Probes > Difference Quantitation
14

Methylation MeasurementMore complex corrected measure
Data > Quantitation Pipelines > Bisulphite methylation over features
15

Visualisation of quantitated methylation
View > Data Track Display
View > Set Data Zoom Level
16

Distributions
Plots > Probe value histogram Plots > Cumulative Distribution Plot
17Plots > Beanplot
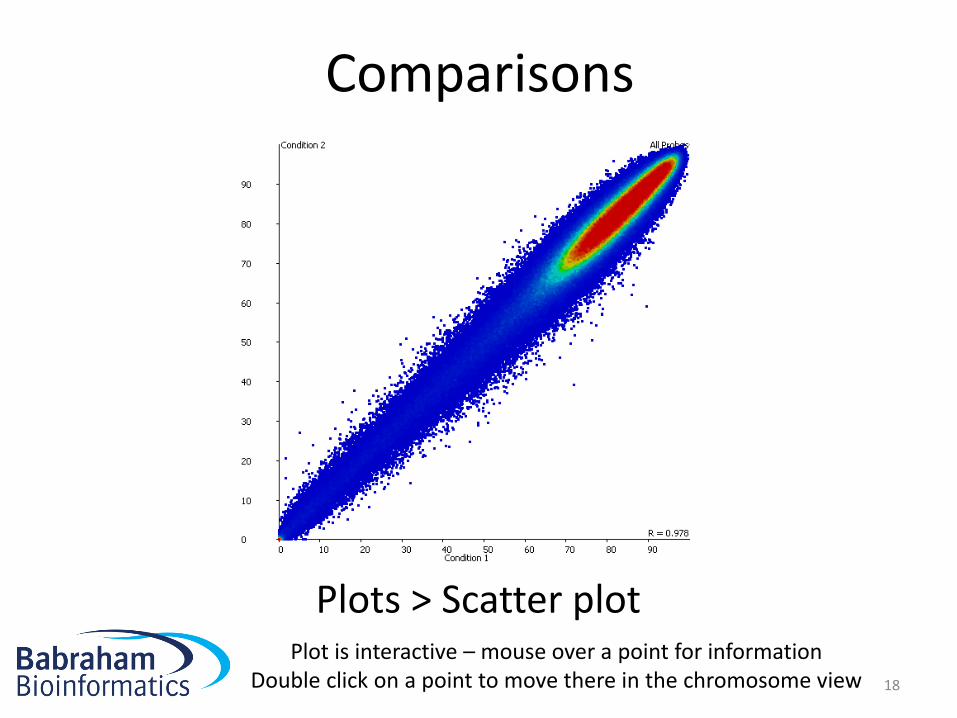
Comparisons
Plots > Scatter plot
18
Plot is interactive – mouse over a point for informationDouble click on a point to move there in the chromosome view

Trend Plots
Plots > Quantitation Trend Plot
19

Clustering
Plots > Hierarchical Clusters
Correlation based (per probe normalised) Euclidean
20


