September 9, 2015 September 8, 2015 Quant...
41
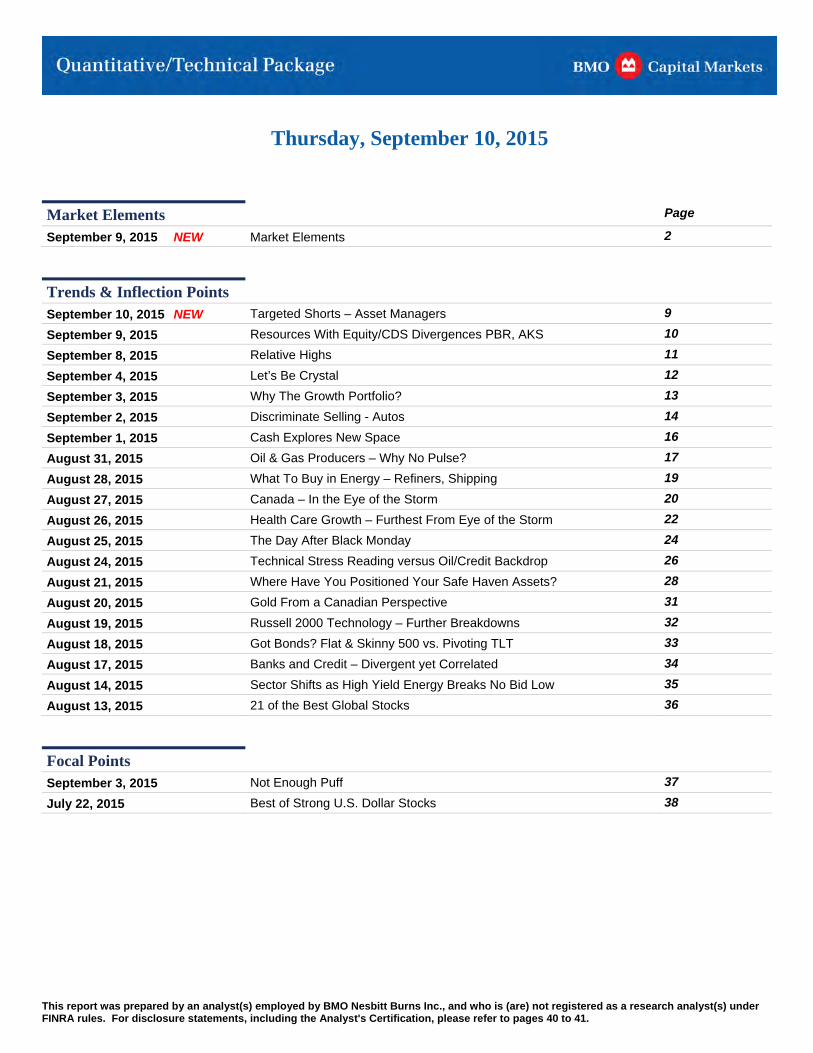
Thursday, September 10, 2015 This report was prepared by an analyst(s) employed by BMO Nesbitt Burns Inc., and who is (are) not registered as a research analyst(s) under FINRA rules. For disclosure statements, including the Analyst's Certification, please refer to pages 40 to 41. uant Dail Q y Market Elements Page September 9, 2015 NEW Market Elements 2 Trends & Inflection Points September 10, 2015 NEW Targeted Shorts – Asset Managers 9 September 9, 2015 Resources With Equity/CDS Divergences PBR, AKS 10 September 8, 2015 Relative Highs 11 September 4, 2015 Let’s Be Crystal 12 September 3, 2015 Why The Growth Portfolio? 13 September 2, 2015 Discriminate Selling - Autos 14 September 1, 2015 Cash Explores New Space 16 August 31, 2015 Oil & Gas Producers – Why No Pulse? 17 August 28, 2015 What To Buy in Energy – Refiners, Shipping 19 August 27, 2015 Canada – In the Eye of the Storm 20 August 26, 2015 Health Care Growth – Furthest From Eye of the Storm 22 August 25, 2015 The Day After Black Monday 24 August 24, 2015 Technical Stress Reading versus Oil/Credit Backdrop 26 August 21, 2015 Where Have You Positioned Your Safe Haven Assets? 28 August 20, 2015 Gold From a Canadian Perspective 31 August 19, 2015 Russell 2000 Technology – Further Breakdowns 32 August 18, 2015 Got Bonds? Flat & Skinny 500 vs. Pivoting TLT 33 August 17, 2015 Banks and Credit – Divergent yet Correlated 34 August 14, 2015 Sector Shifts as High Yield Energy Breaks No Bid Low 35 August 13, 2015 21 of the Best Global Stocks 36 Focal Points September 3, 2015 Not Enough Puff 37 July 22, 2015 Best of Strong U.S. Dollar Stocks 38
Transcript of September 9, 2015 September 8, 2015 Quant...
Thursday, September 10, 2015
This report was prepared by an analyst(s) employed by BMO Nesbitt Burns Inc., and who is (are) not registered as a research analyst(s) under FINRA rules. For disclosure statements, including the Analyst's Certification, please refer to pages 40 to 41.
uant DailQ y
Market Elements Page
September 9, 2015 NEW Market Elements 2
Trends & Inflection Points
September 10, 2015 NEW Targeted Shorts – Asset Managers 9
September 9, 2015 Resources With Equity/CDS Divergences PBR, AKS 10
September 8, 2015 Relative Highs 11
September 4, 2015 Let’s Be Crystal 12
September 3, 2015 Why The Growth Portfolio? 13
September 2, 2015 Discriminate Selling - Autos 14
September 1, 2015 Cash Explores New Space 16
August 31, 2015 Oil & Gas Producers – Why No Pulse? 17
August 28, 2015 What To Buy in Energy – Refiners, Shipping 19
August 27, 2015 Canada – In the Eye of the Storm 20
August 26, 2015 Health Care Growth – Furthest From Eye of the Storm 22
August 25, 2015 The Day After Black Monday 24
August 24, 2015 Technical Stress Reading versus Oil/Credit Backdrop 26
August 21, 2015 Where Have You Positioned Your Safe Haven Assets? 28
August 20, 2015 Gold From a Canadian Perspective 31
August 19, 2015 Russell 2000 Technology – Further Breakdowns 32
August 18, 2015 Got Bonds? Flat & Skinny 500 vs. Pivoting TLT 33
August 17, 2015 Banks and Credit – Divergent yet Correlated 34
August 14, 2015 Sector Shifts as High Yield Energy Breaks No Bid Low 35
August 13, 2015 21 of the Best Global Stocks 36
Focal Points
September 3, 2015 Not Enough Puff 37
July 22, 2015 Best of Strong U.S. Dollar Stocks 38
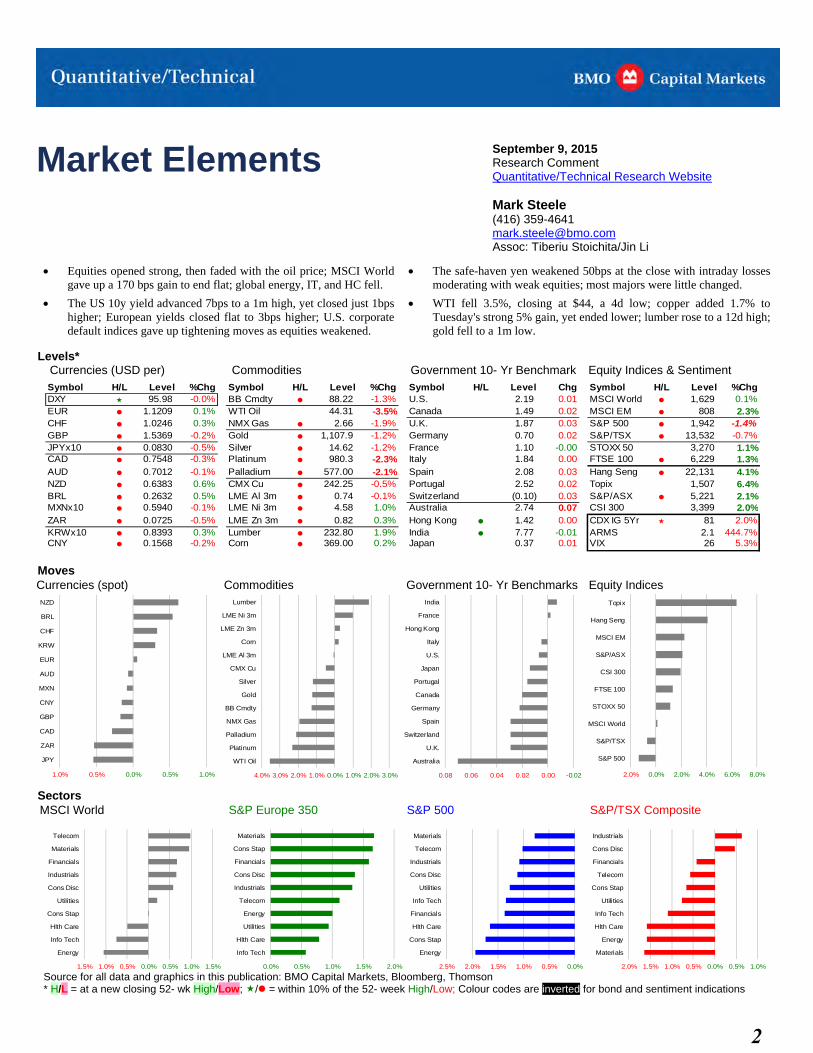
Market Elements September 9, 2015 Research Comment Quantitative/Technical Research Website
Mark Steele (416) 359-4641 [email protected] Assoc: Tiberiu Stoichita/Jin Li
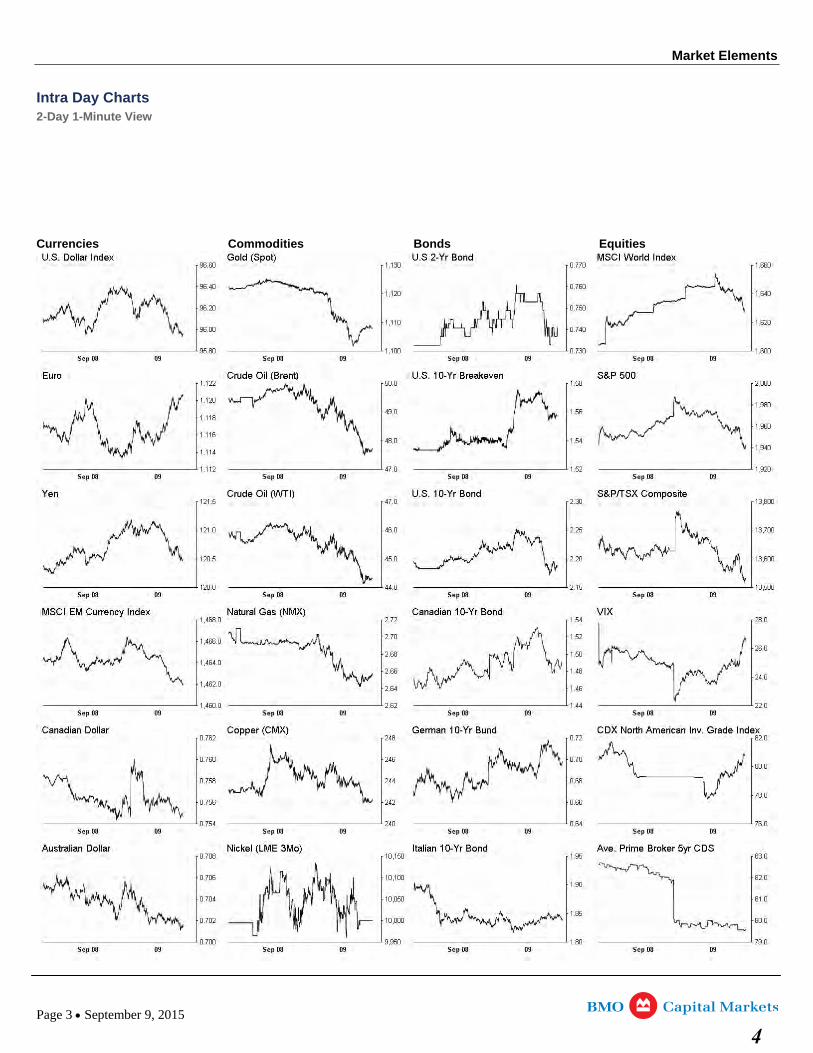
Equities opened strong, then faded with the oil price; MSCI Worldgave up a 170 bps gain to end flat; global energy, IT, and HC fell.
The US 10y yield advanced 7bps to a 1m high, yet closed just 1bpshigher; European yields closed flat to 3bps higher; U.S. corporatedefault indices gave up tightening moves as equities weakened.
The safe-haven yen weakened 50bps at the close with intraday lossesmoderating with weak equities; most majors were little changed.
WTI fell 3.5%, closing at $44, a 4d low; copper added 1.7% toTuesday's strong 5% gain, yet ended lower; lumber rose to a 12d high;gold fell to a 1m low.
Levels* Currencies (USD per) Commodities Government 10- Yr Benchmark Equity Indices & Sentiment
Symbol H/L Level %Chg Symbol H/L Level %Chg Symbol H/L Level Chg Symbol H/L Level %ChgDXY 95.98 -0.0% -1.3% 0.01
-3.5% 0.02
-1.9% 0.03 -1.4% -0.2% -1.2% 0.02 -0.7% -0.5% -1.2% -0.3% -2.3
BB Cmdty 88.22 U.S. 2.19 MSCI World 1,629 0.1%EUR 1.1209 0.1% WTI Oil 44.31 Canada 1.49 MSCI EM 808 2.3%CHF 1.0246 0.3% NMX Gas 2.66 U.K. 1.87 S&P 500 1,942 GBP 1.5369 Gold 1,107.9 Germany 0.70 S&P/TSX 13,532 JPYx10 0.0830 Silver 14.62 France 1.10 -0.00 STOXX 50 3,270 1.1%CAD 0.7548 Platinum 980.3 % Italy 1.84 FTSE 100 6,229 1.30.00 %AUD 0.7012 Palladium 577.00 Spain 2.08 Hang Seng 22,131 4.1%NZD 0.6383 0.6% CMX Cu 242.25 Portugal 2.52 Topix 1,507 6.4%BRL 0.2632 0.5% LME Al 3m 0.74 Switzerland (0.10) S&P/ASX 5,221 2.1%MXNx10 0.5940 LME Ni 3m 4.58 1.0% Australia 2.74 CSI 300 3,399 2.0
-0.1% -2.1% 0.03
-0.5% 0.02 -0.1% 0.03
-0.1% 0.07 %ZAR 0.0725 LME Zn 3m 0.82 0.3% Hong Kong 1.42 CDX IG 5Yr 81 KRWx10 0.8393 0.3% Lumber 232.80 1.9% India 7.77 -0.01 ARMS 2.1 CNY 0.1568 Corn 369.00 0.2% Japan 0.37 VI
-0.5% 0.00 2.0% 444.7% -0.2% 0.01 X 26 5.3%
Moves Currencies (spot) Commodities Government 10- Yr Benchmarks Equity Indices
1.0% 0.5% 0.0% 0.5% 1.0%
JPY
ZAR
CAD
GBP
CNY
MXN
AUD
EUR
KRW
CHF
BRL
NZD
4.0% 3.0% 2.0% 1.0% -0.02
India
France
Hong Kong
Italy
U.S.
Japan
Portugal
Canada
Germany
Spain
Switzerland
U.K.
Australia
0.000.020.040.060.08 2.0%0.0% 1.0% 2.0% 3.0%
WTI Oil
Platinum
Palladium
NMX Gas
BB Cmdty
Gold
Silver
CMX Cu
LME Al 3m
Corn
LME Zn 3m
LME Ni 3m
Lumber
0.0% 2.0% 4.0% 6.0% 8.0%
S&P 500
S&P/TSX
MSCI World
STOXX 50
FTSE 100
CSI 300
S&P/ASX
MSCI EM
Hang Seng
Topix
Sectors MSCI World S&P Europe 350 S&P 500 S&P/TSX Composite
1.5% 1.0% 0.5% 0.0% 0.5% 1.0% 1.5%
Energy
Info Tech
Hlth Care
Cons Stap
Utilities
Cons Disc
Industrials
Financials
Materials
Telecom
2.5% 2.0% 1.5% 1.0% 0.5%0.0% 0.5% 1.0% 1.5% 2.0%
Info Tech
Hlth Care
Utilities
Energy
Telecom
Industrials
Cons Disc
Financials
Cons Stap
Materials
0.0%
Energy
Cons Stap
Hlth Care
Financials
Info Tech
Utilities
Cons Disc
Industrials
Telecom
Materials
2.0% 1.5% 1.0% 0.5% 0.0% 0.5% 1.0%
Materials
Energy
Hlth Care
Info Tech
Utilities
Cons Stap
Telecom
Financials
Cons Disc
Industrials
Source for all data and graphics in this publication: BMO Capital Markets, Bloomberg, Thomson * H/L = at a new closing 52- wk High/Low; / = within 10% of the 52- week High/Low; Colour codes are inverted for bond and sentiment indications
2
Market Elements
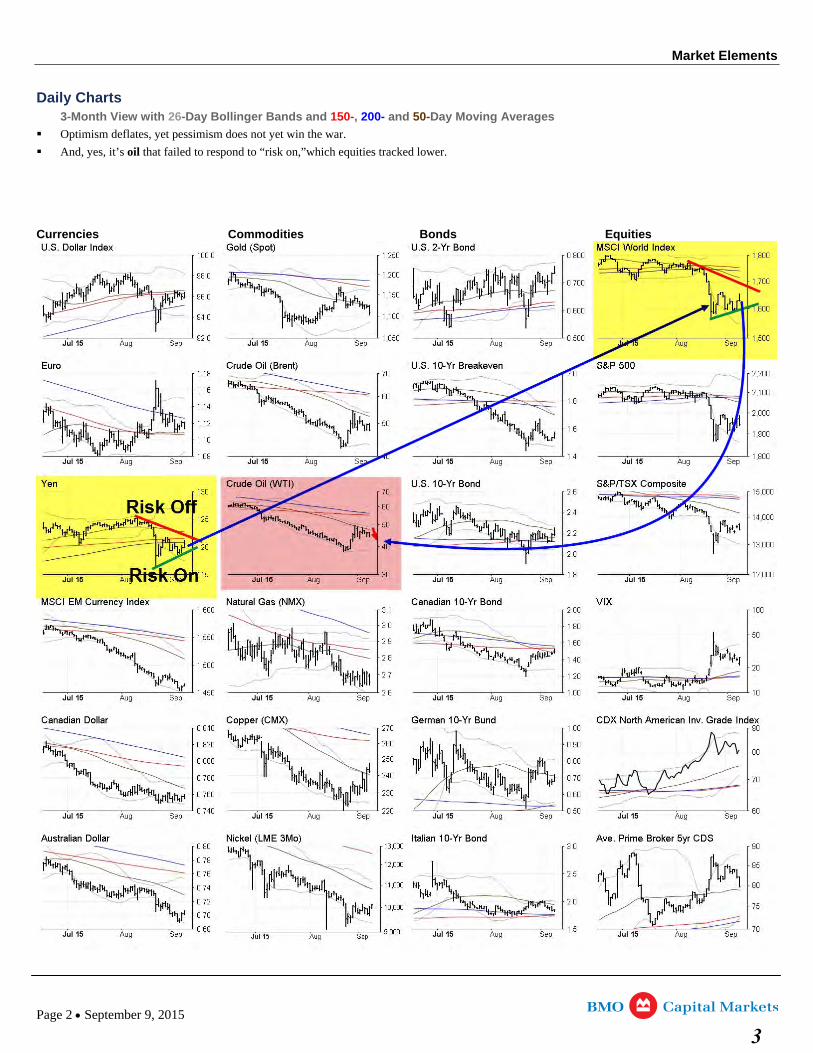
Daily Charts 3-Month View with 26-Day Bollinger Bands and 150-, 200- and 50-Day Moving Averages
Optimism deflates, yet pessimism does not yet win the war.
And, yes, it’s oil that failed to respond to “risk on,”which equities tracked lower.
Currencies Commodities Bonds Equities
Page 2 September 9, 2015
3
Market Elements
Intra Day Charts 2-Day 1-Minute View
Currencies Commodities Bonds Equities
Page 3 September 9, 2015
4
Market Elements
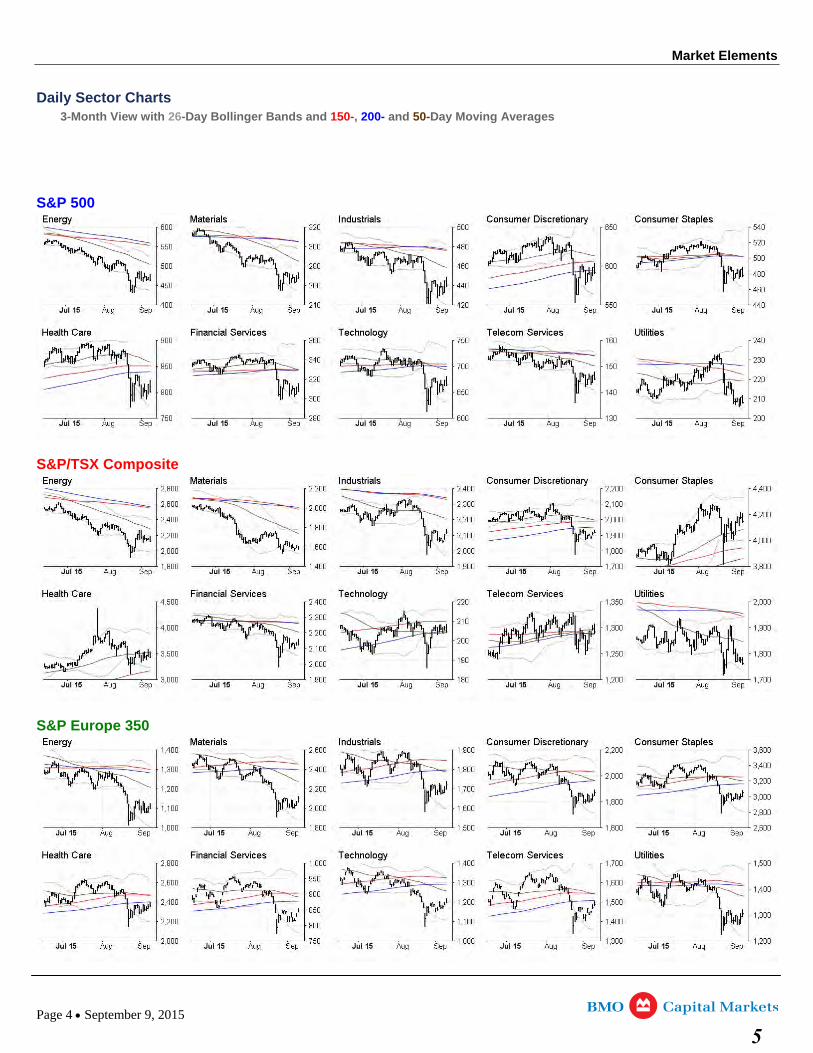
Daily Sector Charts 3-Month View with 26-Day Bollinger Bands and 150-, 200- and 50-Day Moving Averages
S&P 500
S&P/TSX Composite
S&P Europe 350
Page 4 September 9, 2015
5
Market Elements
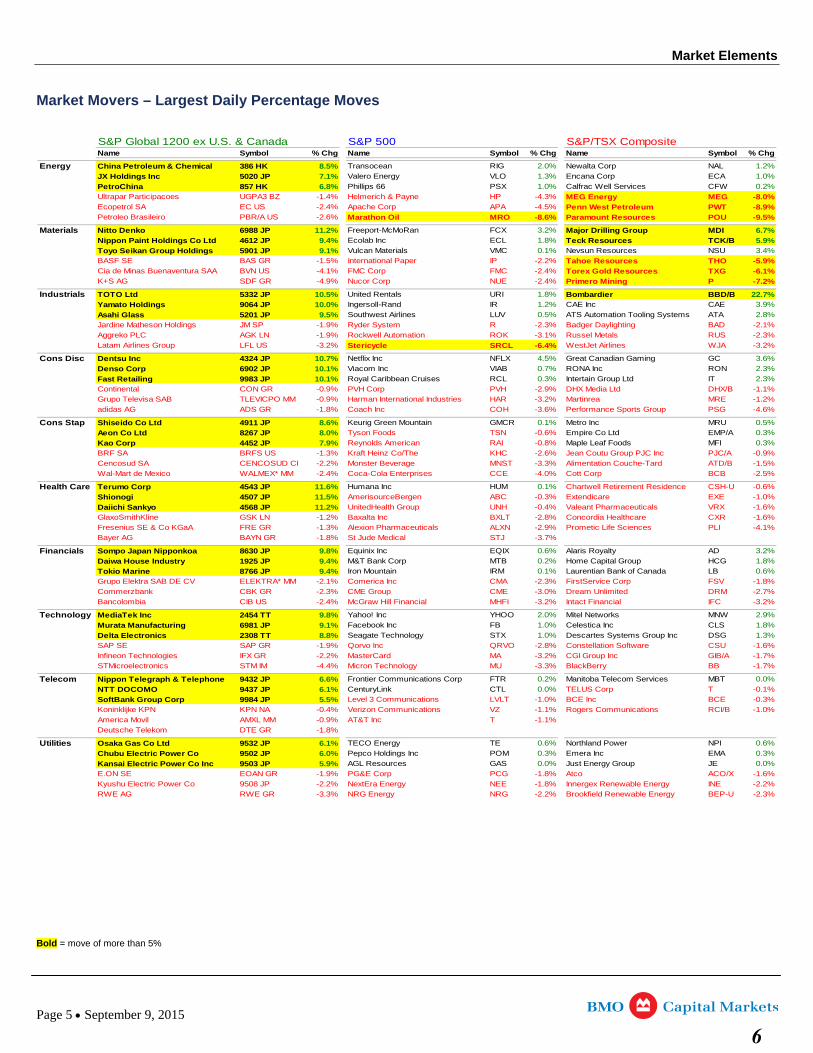
Market Movers – Largest Daily Percentage Moves
S&P Global 1200 ex U.S. & Canada S&P 500 S&P/TSX CompositeName Symbol % Chg Name Symbol % Chg Name Symbol % ChgSECURITY_NAME TICKER Chg SECURITY_NAME Ticker Chg SECURITY_NAME Ticker Chg
Energy China Petroleum & Chemical 386 HK 8.5% Transocean RIG 2.0% Newalta Corp NAL 1.2%
JX Holdings Inc 5020 JP 7.1% Valero Energy VLO 1.3% Encana Corp ECA 1.0%
PetroChina 857 HK 6.8% Phillips 66 PSX 1.0% Calfrac Well Services CFW 0.2%
Petroleo Brasileiro PBR/A U -2 Marathon Oil MRO -8 Paramount Resour POU -9.
Ultrapar Participacoes UGPA3 BZ -1.4% Helmerich & Payne HP -4.3% MEG Energy MEG -8.0%Ecopetrol SA EC US -2.4% Apache Corp APA -4.5% Penn West Petroleum PWT -8.9%
S .6% .6% ces 5%SECURITY_NAME TICKER Chg SECURITY_NAME Ticker Chg SECURITY_NAME Ticker Chg
Materials Nitto Denko 6988 JP 11.2% Freeport-McMoRan FCX 3.2% Major Drilling Group MDI 6.7%
Nippon Paint Holdings Co Ltd 4612 JP 9.4% Ecolab Inc ECL 1.8% Teck Resources TCK/B 5.9%
Toyo Seikan Group Holdings 5901 JP 9.1% Vulcan Materials VMC 0.1% Nevsun Resources NSU 3.4%
K+S AG SDF GR -4 Nucor Corp NUE -2 Primero Mining P -7.
BASF SE BAS GR -1.5% International Paper IP -2.2% Tahoe Resources THO -5.9%Cia de Minas Buenaventura SAA BVN US -4.1% FMC Corp FMC -2.4% Torex Gold Resources TXG -6.1%
.9% .4% 2%SECURITY_NAME TICKER Chg SECURITY_NAME Ticker Chg SECURITY_NAME Ticker ChgIndustrials TOTO Ltd 5332 JP 10.5% United Rentals URI 1.8% Bombardier BBD/B 22.7%
Yamato Holdings 9064 JP 10.0% Ingersoll-Rand IR 1.2% CAE Inc CAE 3.9%
Asahi Glass 5201 JP 9.5% Southwest Airlines LUV 0.5% ATS Automation Tooling Systems ATA 2.8%
Latam Airlines Grou LFL US -3 Stericycle SRCL -6 WestJet Airlines WJA -3.
Jardine Matheson Holdings JM SP -1.9% Ryder System R -2.3% Badger Daylighting BAD -2.1%
Aggreko PLC AGK LN -1.9% Rockwell Automation ROK -3.1% Russel Metals RUS -2.3%
p .2% .4% 2%SECURITY_NAME TICKER Chg SECURITY_NAME Ticker Chg SECURITY_NAME Ticker Chg
Cons Disc Dentsu Inc 4324 JP 10.7% Netflix Inc NFLX 4.5% Great Canadian Gaming GC 3.6%
Denso Corp 6902 JP 10.1% Viacom Inc VIAB 0.7% RONA Inc RON 2.3%
Fast Retailing 9983 JP 10.1% Royal Caribbean Cruises RCL 0.3% Intertain Group Ltd IT 2.3%
adidas AG ADS GR -1 Coach Inc COH -3 Performance Sports PSG -4.
Continental CON GR -0.9% PVH Corp PVH -2.9% DHX Media Ltd DHX/B -1.1%Grupo Televisa SAB TLEVICPO MM -0.9% Harman International Industries HAR -3.2% Martinrea MRE -1.2%
.8% .6% Group 6%SECURITY_NAME TICKER Chg SECURITY_NAME Ticker Chg SECURITY_NAME Ticker Chg
Cons Stap Shiseido Co Ltd 4911 JP 8.6% Keurig Green Mountain GMCR 0.1% Metro Inc MRU 0.5%
Aeon Co Ltd 8267 JP 8.0% Empire Co Ltd EMP/A 0.3%
Kao Corp 4452 JP 7.9% Maple Leaf Foods MFI 0.3%
Wal-Mart de Mexico WALMEX -2 Coca-Cola Enterpris CCE -4 Cott Corp BCB -2.
Tyson Foods TSN -0.6%
Reynolds American RAI -0.8%
BRF SA BRFS US -1.3% Kraft Heinz Co/The KHC -2.6% Jean Coutu Group PJC Inc PJC/A -0.9%
Cencosud SA CENCOSUD CI -2.2% Monster Beverage MNST -3.3% Alimentation Couche-Tard ATD/B -1.5%
* MM .4% es .0% 5%SECURITY_NAME TICKER Chg SECURITY_NAME Ticker Chg SECURITY_NAME Ticker Chg
Health Care Terumo Corp 4543 JP 11.6% Humana Inc HUM 0.1%
Shionogi 4507 JP 11.5%
Daiichi Sankyo 4568 JP 11.2%
Bayer AG BAYN GR -1 St Jude Medical STJ -3
Chartwell Retirement Residence CSH-U -0.6%
AmerisourceBergen ABC -0.3% Extendicare EXE -1.0%
UnitedHealth Group UNH -0.4% Valeant Pharmaceuticals VRX -1.6%
GlaxoSmithKline GSK LN -1.2% Baxalta Inc BXLT -2.8% Concordia Healthcare CXR -1.6%Fresenius SE & Co KGaA FRE GR -1.3% Alexion Pharmaceuticals ALXN -2.9% Prometic Life Sciences PLI -4.1%
.8% .7%SECURITY_NAME TICKER Chg SECURITY_NAME Ticker Chg SECURITY_NAME Ticker Chg
Financials Sompo Japan Nipponkoa 8630 JP 9.8% Equinix Inc EQIX 0.6% Alaris Royalty AD 3.2%
Daiwa House Industry 1925 JP 9.4% M&T Bank Corp MTB 0.2% Home Capital Group HCG 1.8%
Tokio Marine 8766 JP 9.4% Iron Mountain IRM 0.1% Laurentian Bank of Canada LB 0.6%
Bancolombia CIB US -2 McGraw Hill Financi MHFI -3 Intact Financial IFC -3.
Grupo Elektra SAB DE CV ELEKTRA* MM -2.1% Comerica Inc CMA -2.3% FirstService Corp FSV -1.8%
Commerzbank CBK GR -2.3% CME Group CME -3.0% Dream Unlimited DRM -2.7%
.4% al .2% 2%SECURITY_NAME TICKER Chg SECURITY_NAME Ticker Chg SECURITY_NAME Ticker Chg
Technology MediaTek Inc 2454 TT 9.8% Yahoo! Inc YHOO 2.0% Mitel Networks MNW 2.9%
Murata Manufacturing 6981 JP 9.1% Facebook Inc FB 1.0% Celestica Inc CLS 1.8%
Delta Electronics 2308 TT 8.8% Seagate Technology STX 1.0% Descartes Systems Group Inc DSG 1.3%
STMicroelectronics STM IM -4 Micron Technology MU -3 BlackBerry BB -1.
SAP SE SAP GR -1.9% Qorvo Inc QRVO -2.8% Constellation Software CSU -1.6%
Infineon Technologies IFX GR -2.2% MasterCard MA -3.2% CGI Group Inc GIB/A -1.7%.4% .3% 7%SECURITY_NAME TICKER Chg SECURITY_NAME Ticker Chg SECURITY_NAME Ticker Chg
Telecom Nippon Telegraph & Telephone 9432 JP 6.6% Frontier Communications Corp FTR 0.2% Manitoba Telecom Services MBT 0.0%
NTT DOCOMO 9437 JP 6.1% CenturyLink CTL 0.0%
SoftBank Group Corp 9984 JP 5.5%
Deutsche Telekom DTE GR -1
TELUS Corp T -0.1%Level 3 Communications LVLT -1.0% BCE Inc BCE -0.3%
Koninklijke KPN KPN NA -0.4% Verizon Communications VZ -1.1% Rogers Communications RCI/B -1.0%
America Movil AMXL MM -0.9% AT&T Inc T -1.1%
.8%SECURITY_NAME TICKER Chg SECURITY_NAME Ticker Chg SECURITY_NAME Ticker Chg
Utilities Osaka Gas Co Ltd 9532 JP 6.1% TECO Energy TE 0.6% Northland Power NPI 0.6%
Chubu Electric Power Co 9502 JP 6.0% Pepco Holdings Inc POM 0.3% Emera Inc EMA 0.3%
Kansai Electric Power Co Inc 9503 JP 5.9% AGL Resources GAS 0.0% Just Energy Group JE 0.0%
E.ON SE EOAN GR -1.9% PG&E Corp PCG -1.8% Atco ACO/X -1.6%
Kyushu Electric Power Co 9508 JP -2.2% NextEra Energy NEE -1.8% Innergex Renewable Energy INE -2.2%RWE AG RWE GR -3.3% NRG Energy NRG -2.2% Brookfield Renewable Energy BEP-U -2.3%
Bold = move of more than 5%
Page 5 September 9, 2015
6
Market Elements
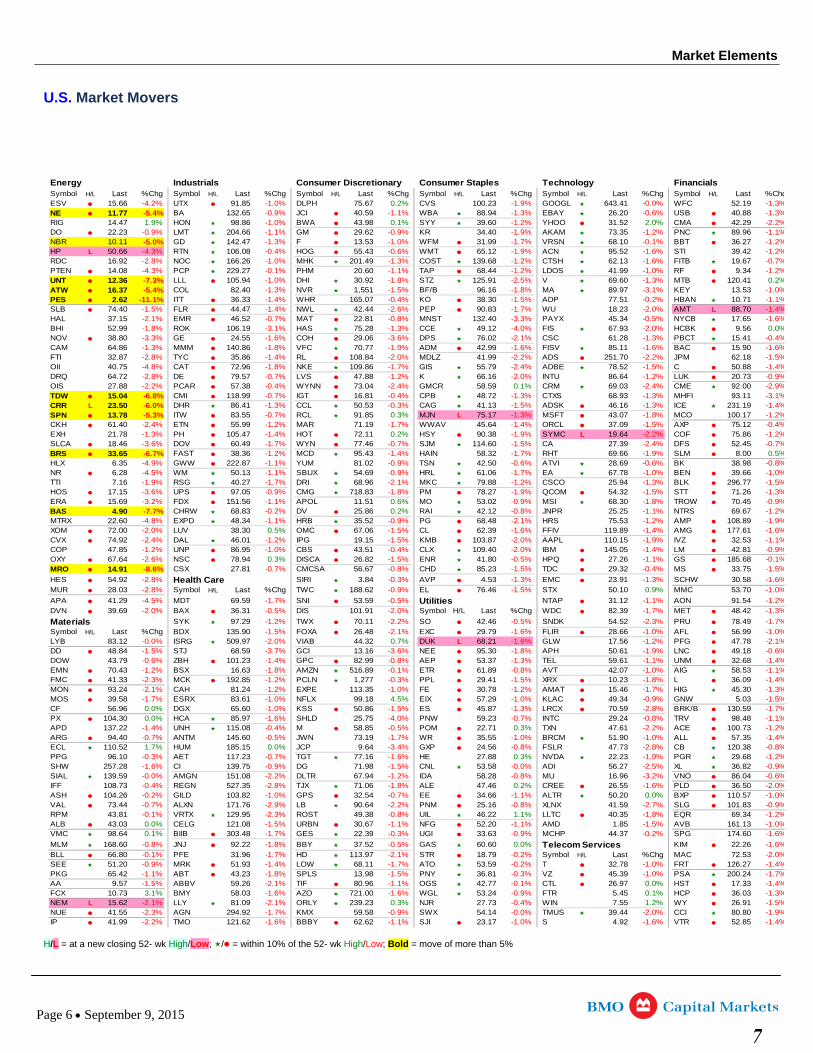
U.S. Market Movers
Energy Industrials Consumer Discretionary Consumer Staples Technology FinancialsSymbol H/L Last %Chg Symbol H/L Last %Chg Symbol H/L Last %Chg Symbol H/L Last %Chg Symbol H/L Last %Chg Symbol H/L Last %ChgESV -4.2% -1.0% -1.9% -0.0% -1.315.66 UTX 91.85 DLPH 75.67 0.2% CVS 100.23 GOOGL 643.41 WFC 52.19 %NE 11.77 BA 132.65 JCI 40.59 WBA 88.94 EBAY 26.20 USB 40.88 -5.4% -0.9% -1.1% -1.3% -0.6% -1.3%RIG 14.47 1.9% HON 98.86 BWA 43.98 0.1% SYY 39.60 YHOO 31.52 2.0% CMA 42.29 -1.0% -1.2% -2.2%DO 22.23 LMT 204.66 GM 29.62 KR 34.40 AKAM 73.35 PNC 89.96 -0.9% -1.1% -0.9% -1.9% -1.2% -1.1%NBR 10.11 GD 142.47 F 13.53 WFM 31.99 VRSN 68.10 BBT 36.27 -5.0% -1.3% -1.0% -1.7% -0.1% -1.2%HP 50.66 RTN 106.08 HOG 55.43 WMT 65.12 ACN 95.52 STI 39.42 L -4.3% -0.4% -0.6% -1.9% -1.6% -1.2%RDC 16.92 NOC 166.26 MHK 201.49 COST 139.68 CTSH 62.13 FITB 19.67 -2.8% -1.0% -1.3% -1.2% -1.6% -0.7%PTEN 14.08 PCP 229.27 PHM 20.60 TAP 68.44 LDOS 41.99 RF 9.34 -4.3% -0.1% -1.1% -1.2% -1.0% -1.2%UNT 12.36 LLL 105.94 DHI 30.92 STZ 125.91 V 69.60 MTB 120.41 0.2 -7.3% -1.0% -1.8% -2.5% -1.3% %ATW 16.37 COL 82.40 NVR 1,551 BF/B 96.16 MA 89.97 KEY 13.53 -5.4% -1.3% -1.5% -1.8% -3.1% -1.0%PES 2.62 ITT 36.33 WHR 165.07 KO 38.30 ADP 77.51 HBAN 10.71 -11.1% -1.4% -0.4% -1.5% -0.2% -1.1%SLB 74.40 FLR 44.47 NWL 42.44 PEP 90.83 WU 18.23 AMT 88.70 -1.5% -1.4% -2.6% -1.7% -2.0% L -1.4%HAL 37.15 EMR 46.52 MAT 22.81 MNST 132.40 PAYX 45.34 NYCB 17.65 -2.1% -0.7% -0.8% -3.3% -0.5% -1.6%BHI 52.99 ROK 106.19 HAS 75.28 CCE 49.12 FIS 67.93 HCBK 9.56 0.0-1.8% -3.1% -1.3% -4.0% -2.0% %NOV 38.80 GE 24.55 COH 29.06 DPS 76.02 CSC 61.28 PBCT 15.41 -3.3% -1.6% -3.6% -2.1% -1.3% -0.4%CAM 64.86 MMM 140.86 VFC 70.77 ADM 42.99 FISV 85.11 BAC 15.90 -1.3% -1.8% -1.9% -1.6% -1.6% -1.6%FTI 32.87 TYC 35.86 RL 108.84 MDLZ 41.99 ADS 251.70 JPM 62.18 -2.8% -1.4% -2.0% -2.2% -2.2% -1.5%OII 40.75 CAT 72.96 NKE 109.86 GIS 55.79 ADBE 78.52 C 50.88 -4.8% -1.8% -1.7% -2.4% -1.5% -1.4%DRQ 64.72 DE 79.57 LVS 47.88 K 66.16 INTU 86.64 LUK 20.73 -2.8% -0.7% -1.2% -2.0% -1.2% -0.9%OIS 27.88 PCAR 57.38 WYNN 73.04 GMCR 58.59 0.1% CRM 69.03 CME 92.00 -2.2% -0.4% -2.4% -2.4% -2.9%TDW 15.04 CMI 118.99 IGT 16.81 CPB 48.72 CTXS 68.93 MHFI 93.11 -6.8% -0.7% -0.4% -1.3% -1.3% -3.1%CRR 23.50 DHR 86.41 CCL 50.53 CAG 41.13 ADSK 46.16 ICE 231.19 L -6.0% -1.3% -0.3% -1.5% -1.3% -1.4%SPN 13.78 ITW 83.55 RCL 91.85 0.3% MJN 75.17 MSFT 43.07 MCO 100.17 -5.3% -0.7% L -1.3% -1.8% -1.2%CKH 61.40 ETN 55.99 MAR 71.19 WWAV 45.64 ORCL 37.09 AXP 75.12 -2.4% -1.2% -1.7% -1.4% -1.5% -0.4%EXH 21.78 PH 105.47 HOT 72.11 0.2% HSY 90.38 SYMC 19.64 COF 75.86 -1.3% -1.4% -1.9% L -2.2% -1.2%SLCA 18.46 DOV 60.49 WYN 77.46 SJM 114.60 CA 27.39 DFS 52.45 -3.6% -1.7% -0.7% -1.5% -2.4% -0.7%BRS 33.65 FAST 38.36 MCD 95.43 HAIN 58.32 RHT 69.66 SLM 8.00 0.5 -6.7% -1.2% -1.4% -1.7% -1.9% %HLX 6.35 GWW 222.87 YUM 81.02 TSN 42.50 ATVI 28.69 BK 38.98 -4.9% -1.1% -0.9% -0.6% -0.6% -0.8%NR 6.28 WM 50.13 SBUX 54.69 HRL 61.06 EA 67.78 BEN 39.66 -4.5% -1.1% -0.9% -1.7% -1.0% -1.0%TTI 7.16 RSG 40.27 DRI 68.96 MKC 79.88 CSCO 25.94 BLK 296.77 -1.9% -1.7% -2.1% -1.2% -1.3% -1.5%HOS 17.15 UPS 97.05 CMG 718.83 PM 78.27 QCOM 54.32 STT 71.26 -3.6% -0.9% -1.8% -1.9% -1.5% -1.3%ERA 15.69 FDX 151.56 APOL 11.51 0.6% MO 53.02 MSI 68.30 TROW 70.45 -3.2% -1.1% -0.9% -1.8% -0.9%BAS 4.90 CHRW 68.83 DV 25.86 0.2% RAI 42.12 JNPR 25.25 NTRS 69.67 -7.7% -0.2% -0.8% -1.1% -1.2%MTRX 22.60 EXPD 48.34 HRB 35.52 PG 68.48 HRS 75.53 AMP 108.89 -4.8% -1.1% -0.9% -2.1% -1.2% -1.9%XOM 72.00 LUV 38.30 0.5% OMC 67.06 CL 62.39 FFIV 119.89 AMG 177.61 -2.0% -1.5% -1.6% -1.4% -1.6%CVX 74.92 DAL 46.01 IPG 19.15 KMB 103.87 AAPL 110.15 IVZ 32.53 -2.4% -1.2% -1.5% -2.0% -1.9% -1.1%COP 47.85 UNP 86.95 CBS 43.51 CLX 109.40 IBM 145.05 LM 42.81 -1.2% -1.0% -0.4% -2.0% -1.4% -0.9%OXY 67.64 NSC 78.94 0.3% DISCA 26.82 ENR 41.80 HPQ 27.26 GS 185.68 -2.6% -1.5% -0.5% -1.1% -0.1%MRO 14.91 CSX 27.81 CMCSA 56.67 CHD 85.23 TDC 29.32 MS 33.75 -8.6% -0.7% -0.8% -1.5% -0.4% -1.5%
HES 54.92 Health Care SIRI 3.84 AVP 4.53 EMC 23.91 SCHW 30.58 -2.8% -0.3% -1.3% -1.3% -1.6%MUR 28.03 Symbol H/L Last %Chg TWC 188.62 EL 76.46 STX 50.10 0.9% MMC 53.70 -2.8% -0.9% -1.5% -1.0%
APA 41.29 MDT 69.59 SNI 53.59 Utilities NTAP 31.12 AON 91.54 -4.5% -1.7% -0.5% -1.1% -1.2%DVN 39.69 BAX 36.31 DIS 101.91 Symbol H/L Last %Chg WDC 82.39 MET 48.42 -2.0% -0.5% -2.0% -1.7% -1.3%
Materials SYK 97.29 TWX 70.11 SO 42.46 SNDK 54.52 PRU 78.49 -1.2% -2.2% -0.5% -2.3% -1.7%Symbol H/L Last %Chg BDX 135.90 FOXA 26.48 EXC 29.79 FLIR 28.66 AFL 56.99 -1.5% -2.1% -1.6% -1.0% -1.0%LYB 83.12 ISRG 509.97 VIAB 44.32 0.7% DUK 68.21 GLW 17.56 PFG 47.78 -0.0% -2.0% L -1.6% -1.2% -2.1%DD 48.84 STJ 68.59 GCI 13.16 NEE 95.30 APH 50.61 LNC 49.18 -1.5% -3.7% -3.6% -1.8% -1.9% -0.6%DOW 43.79 ZBH 101.23 GPC 82.99 AEP 53.37 TEL 59.61 UNM 32.68 -0.6% -1.4% -0.8% -1.3% -1.1% -1.4%EMN 70.43 BSX 16.63 AMZN 516.89 ETR 61.89 AVT 42.07 AIG 58.53 -1.2% -1.8% -0.1% -0.8% -1.0% -1.1%FMC 41.33 MCK 192.85 PCLN 1,277 PPL 29.41 XRX 10.23 L 36.09 -2.3% -1.2% -0.3% -1.5% -1.8% -1.4%MON 93.24 CAH 81.24 EXPE 113.35 FE 30.78 AMAT 15.46 HIG 45.30 -2.1% -1.2% -1.0% -1.2% -1.7% -1.3%MOS 39.58 ESRX 83.61 NFLX 99.18 4.5% EIX 57.29 KLAC 49.34 GNW 5.03 -1.7% -1.0% -1.0% -0.9% -1.5%CF 56.96 0.0% DGX 65.60 KSS 50.86 ES 45.87 LRCX 70.59 BRK/B 130.59 -1.0% -1.5% -1.3% -2.8% -1.7%PX 104.30 0.0% HCA 85.97 SHLD 25.75 PNW 59.23 INTC 29.24 TRV 98.48 -1.6% -4.0% -0.7% -0.8% -1.1%APD 137.22 UNH 115.08 M 58.85 POM 22.71 0.3% TXN 47.61 ACE 100.73 -1.4% -0.4% -0.5% -2.2% -1.2%ARG 94.40 ANTM 145.60 JWN 73.19 WR 35.55 BRCM 51.90 ALL 57.35 -0.7% -0.5% -1.7% -1.0% -1.0% -1.4%ECL 110.52 1.7% HUM 185.15 0.0% JCP 9.64 GXP 24.56 FSLR 47.73 CB 120.38 -3.4% -0.8% -2.8% -0.8%PPG 96.10 AET 117.23 TGT 77.16 HE 27.88 0.3% NVDA 22.23 PGR 29.68 -0.3% -0.7% -1.6% -1.9% -1.2%SHW 257.28 CI 139.75 DG 71.98 CNL 53.58 ADI 56.27 XL 36.82 -1.6% -0.9% -1.5% -0.0% -2.5% -0.9%SIAL 139.59 AMGN 151.08 DLTR 67.94 IDA 58.28 MU 16.96 VNO 86.04 -0.0% -2.2% -1.2% -0.8% -3.2% -0.6%IFF 108.73 REGN 527.35 TJX 71.06 ALE 47.46 0.2% CREE 26.55 PLD 36.50 -0.4% -2.8% -1.8% -1.6% -2.0%ASH 104.26 GILD 103.82 GPS 32.54 EE 34.66 ALTR 50.20 0.0% BXP 110.57 -0.2% -1.0% -0.7% -1.1% -1.0%VAL 73.44 ALXN 171.76 LB 90.64 PNM 25.16 XLNX 41.59 SLG 101.83 -0.7% -2.9% -2.2% -0.8% -2.7% -0.9%RPM 43.81 VRTX 129.95 ROST 49.38 UIL 46.22 1.1% LLTC 40.35 EQR 69.34 -0.1% -2.3% -0.8% -1.8% -1.2%ALB 43.03 0.0% CELG 121.08 URBN 30.67 NFG 52.20 AMD 1.85 AVB 161.13 -1.5% -1.1% -1.1% -1.5% -1.0%VMC 98.64 0.1% BIIB 303.48 GES 22.39 UGI 33.63 MCHP 44.37 SPG 174.60 -1.7% -0.3% -0.9% -0.2% -1.6%
MLM 168.60 JNJ 92.22 BBY 37.52 GAS 60.60 0.0% Telecom Services KIM 22.26 -0.8% -1.8% -0.5% -1.6%BLL 66.80 PFE 31.96 HD 113.97 STR 18.79 Symbol H/L Last %Chg MAC 72.53 -0.1% -1.7% -2.1% -0.2% -2.0%SEE 51.20 MRK 51.93 LOW 68.11 ATO 53.59 T 32.78 FRT 126.27 -0.9% -1.4% -1.7% -0.2% -1.0% -1.4%PKG 65.42 ABT 43.23 SPLS 13.98 PNY 36.81 VZ 45.39 PSA 200.24 -1.1% -1.8% -1.5% -0.3% -1.0% -1.7%AA 9.57 ABBV 59.26 TIF 80.96 OGS 42.77 CTL 26.97 0.0% HST 17.33 -1.5% -2.1% -1.1% -0.1% -1.4%FCX 10.73 3.1% BMY 58.03 AZO 721.00 WGL 53.24 FTR 5.45 0.1% HCP 36.03 -1.6% -1.6% -0.9% -1.3%NEM 15.62 LLY 81.09 ORLY 239.23 0.3% NJR 27.73 WIN 7.55 1.2% WY 26.91 L -2.1% -2.1% -0.4% -1.5%NUE 41.55 AGN 294.92 KMX 59.58 SWX 54.14 TMUS 39.44 CCI 80.80 -2.3% -1.7% -0.9% -0.0% -2.0% -1.9%IP 41.99 TMO 121.62 BBBY 62.62 SJI 23.17 S 4.92 VTR 52.85 -2.2% -1.6% -1.1% -1.0% -1.6% -1.4%
H/L = at a new closing 52- wk High/Low; / = within 10% of the 52- wk High/Low; Bold = move of more than 5%
Page 6 September 9, 2015
7
Market Elements
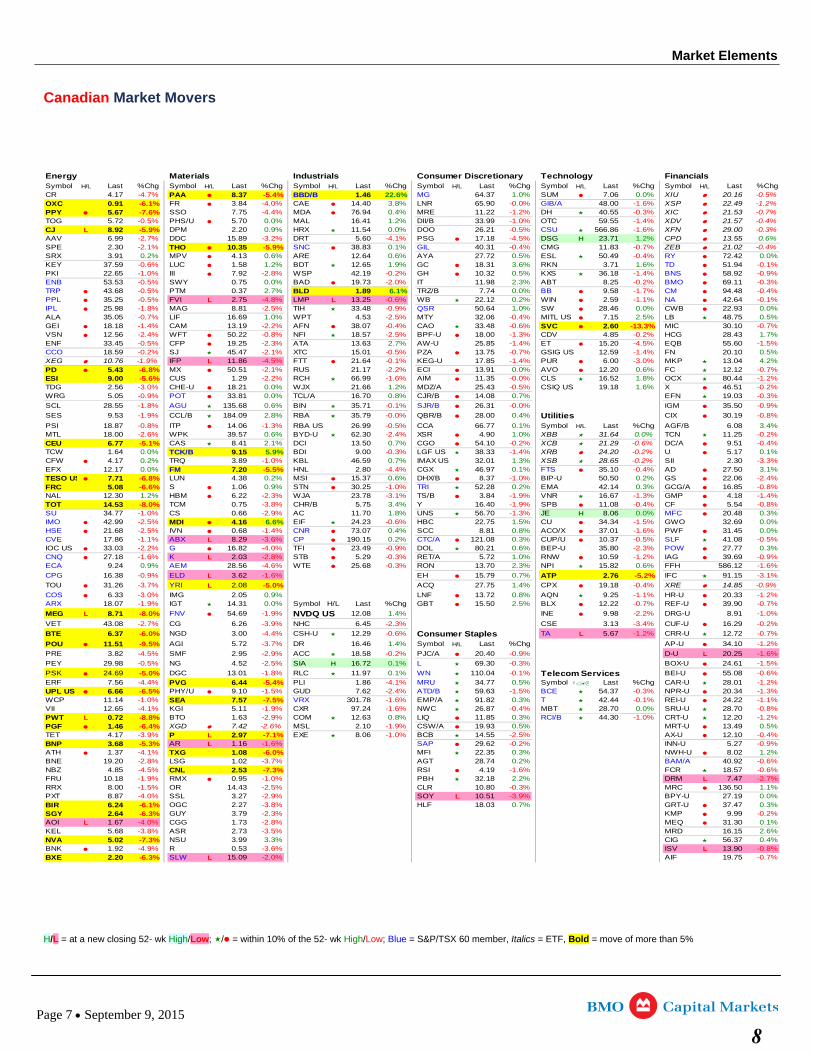
Canadian Market Movers
Energy Materials Industrials Consumer Discretionary Technology FinancialsSymbol H/L Last %Chg Symbol H/L Last %Chg Symbol H/L Last %Chg Symbol H/L Last %Chg Symbol H/L Last %Chg Symbol H/L Last %ChgCR 4.17 -4.7% -5.4% -0.5%
-6.1% -4.0% -0.0% -1.6% -1.2% -7.6% -4.4% -1.2% -0.3% -0.7%
-0.5% -1.0% -1.4% -0.4%L -5.9% -0.5% -1.6% -0.3%
-2.7% -3.2% -4.1% -4.5% -2.1% -5.9% -0.4% -0.7% -0.4%
-0.4%
-0.6% -0.1%-1.0% -2.8% -0.2% -1.4% -0.9%-0.5% -2.0% -0.2% -0.3%
-0.5% -1.7% -0.4%
-0.5% L -4.8% L -0.6% -1.1% -0.1%
-1.8% -2.5% -0.9%
-0.7% -2.5% -0.4%
-1.4% -2.2% -0.4% -0.6% -13.3% -0.7%
-2.4% -0.8% -2.5% -1.3% -0.2%-0.5% -2.3% -1.4% -4.5% -1.5%-0.2% -2.1% -0.5% -0.7% -1.4%
-1.9% L -4.5% -0.1% -1.4% -3.0%
-6.8% -2.1% -2.2% -0.7%-5.6% -2.2% -1.6% -0.0% -1.2%-3.0% -0.5% -0.2%-0.9% -0.3%
-1.8% -0.1% -0.0% -0.9%
-1.9% -0.0% -0.8%
-0.8% -1.3% -0.5%-2.6% -2.4% -0.2%-5.1% -0.2% -0.6% -0.4%
-0.3% -1.4% -0.2%
-1.0% -0.2% -3.3%-5.5% -4.4% -0.4%
PAA 8.37 BBD/B 1.46 22.6% MG 64.37 1.0% SUM 7.06 0.0% XIU 20.16 OXC 0.91 FR 3.84 CAE 14.40 3.8% LNR 65.90 GIB/A 48.00 XSP 22.49 PPY 5.67 SSO 7.75 MDA 76.94 0.4% MRE 11.22 DH 40.55 XIC 21.53 TOG 5.72 PHS/U 5.70 0.0% MAL 16.41 1.2% DII/B 33.99 OTC 59.55 XDV 21.57 CJ 8.92 DPM 2.20 0.9% HRX 11.54 0.0% DOO 26.21 CSU 566.86 XFN 29.00 AAV 6.99 DDC 15.89 DRT 5.60 PSG 17.18 DSG H 23.71 1.2% CPD 13.55 0.6%SPE 2.30 THO 10.35 SNC 38.83 0.1% GIL 40.31 CMG 11.83 ZEB 21.02 SRX 3.91 0.2% MPV 4.13 0.6% ARE 12.64 0.6% AYA 27.72 0.5% ESL 50.49 RY 72.42 0.0%KEY 37.59 LUC 1.58 1.2% BDT 12.65 1.9% GC 18.31 3.6% RKN 3.71 1.6% TD 51.94 PKI 22.65 III 7.92 WSP 42.19 GH 10.32 0.5% KXS 36.18 BNS 58.92 ENB 53.53 SWY 0.75 0.0% BAD 19.73 IT 11.98 2.3% ABT 8.25 BMO 69.11 TRP 43.68 PTM 0.37 2.7% BLD 1.89 6.1% TRZ/B 7.74 0.0% BB 9.58 CM 94.48 PPL 35.25 FVI 2.75 LMP 13.25 WB 22.12 0.2% WIN 2.59 NA 42.64 IPL 25.98 MAG 8.81 TIH 33.48 QSR 50.64 1.0% SW 28.46 0.0% CWB 22.93 0.0%ALA 35.05 LIF 16.69 1.0% WPT 4.53 MTY 32.06 MITL US 7.15 2.5% LB 48.75 0.5%GEI 18.18 CAM 13.19 AFN 38.07 CAO 33.48 SVC 2.60 MIC 30.10 VSN 12.56 WFT 50.22 NFI 18.57 BPF-U 18.00 CDV 4.85 HCG 28.43 1.7%ENF 33.45 CFP 19.25 ATA 13.63 2.7% AW-U 25.85 ET 15.20 EQB 55.60 CCO 18.59 SJ 45.47 XTC 15.01 PZA 13.75 GSIG US 12.59 FN 20.10 0.5%XEG 10.76 IFP 11.86 FTT 21.64 KEG-U 17.85 PUR 6.00 MKP 13.04 4.2%PD 5.43 MX 50.51 RUS 21.17 ECI 13.91 0.0% AVO 12.20 0.6% FC 12.12 ESI 9.00 CUS 1.29 RCH 66.99 AIM 11.35 CLS 16.52 1.8% OCX 80.44 TDG 2.56 CHE-U 18.21 0.0% WJX 21.66 1.2% MDZ/A 25.43 CSIQ US 19.18 1.6% X 46.51 WRG 5.05 POT 33.81 0.0% TCL/A 16.70 0.8% CJR/B 14.08 0.7% EFN 19.03
SCL 28.55 AGU 135.68 0.6% BIN 35.71 SJR/B 26.31 IGM 35.50
SES 9.53 CCL/B 184.09 2.8% RBA 35.79 QBR/B 28.00 0.4% Utilities CIX 30.19
PSI 18.87 ITP 14.06 RBA US 26.99 CCA 66.77 0.1% Symbol H/L Last %Chg AGF/B 6.08 3.4%MTL 18.00 WPK 39.57 0.6% BYD-U 62.30 XSR 4.90 1.0% XBB 31.64 0.0% TCN 11.25 CEU 6.77 CAS 8.41 2.1% DCI 13.50 0.7% CGO 54.10 XCB 21.29 DC/A 9.51 TCW 1.64 0.0% TCK/B 9.15 5.9% BDI 9.00 LGF US 38.33 XRB 24.20 U 5.17 0.1%CFW 4.17 0.2% TRQ 3.89 KBL 46.59 0.7% IMAX US 32.01 1.3% XSB 28.65 SII 2.30 EFX 12.17 0.0% FM 7.20 HNL 2.80 CGX 46.97 0.1% FTS 35.10 AD 27.50 3.1%TESO US -6.8% -1.0% -2.4%
-6.6% -1.0% -0.8%
-2.3% -3.1% -1.9% -1.3% -1.4%-8.0% -3.8% -1.9% -0.4% -0.8%-1.0% -2.9% -1.3%
-2.5% -0.6% -1.5%
-2.5% -1.4% -1.6%
-1.1% L -3.6% -0.5% -0.5%
-2.2% -4.0% -0.9% -2.3%
-1.6% L -2.8% -0.3% -1.2% -0.9%-4.6% -0.3% -1.6%
-0.9% L -1.6% -5.2% -3.1%
-3.7% L -5.0% -0.4% -0.9%
-3.0% -1.1% -1.2%-1.9% -0.7% -0.7%
L -8.0% -1.9% -2.2% -1.0%
-2.7% -3.9% -2.3% -3.4% -0.2%
-6.0% -4.4% -0.6% L -1.2% -0.7%
-9.5% -3.7% -1.2%
-4.5% -2.9% -0.2% -0.9% L -1.6%
-0.5% -2.5% -0.3% -1.5%
-5.0% -1.8% -0.1% -0.6%
-4.4% -5.4% -4.1%
7.71 LUN 4.38 0.2% MSI 15.37 0.6% DHX/B 8.37 BIP-U 50.50 0.2% GS 22.06 FRC 5.08 S 1.06 0.9% STN 30.25 TRI 52.28 0.2% EMA 42.14 0.3% GCG/A 16.85 NAL 12.30 1.2% HBM 6.22 WJA 23.78 TS/B 3.84 VNR 16.67 GMP 4.18 TOT 14.53 TCM 0.75 CHR/B 5.75 3.4% Y 16.40 SPB 11.08 CF 5.54 SU 34.77 CS 0.66 AC 11.70 1.8% UNS 56.70 JE H 8.06 0.0% MFC 20.48 0.3%IMO 42.99 MDI 4.16 6.6% EIF 24.23 HBC 22.75 1.5% CU 34.34 GWO 32.69 0.0%HSE 21.68 IVN 0.68 CNR 73.07 0.4% SCC 8.81 0.8% ACO/X 37.01 PWF 31.45 0.0%CVE 17.86 ABX 8.29 CP 190.15 0.2% CTC/A 121.08 0.3% CUP/U 10.37 SLF 41.08 IOC US 33.03 G 16.82 TFI 23.49 DOL 80.21 0.6% BEP-U 35.80 POW 27.77 0.3%CNQ 27.18 K 2.03 STB 5.29 RET/A 5.72 1.0% RNW 10.59 IAG 39.69 ECA 9.24 0.9% AEM 28.56 WTE 25.68 RON 13.70 2.3% NPI 15.82 0.6% FFH 586.12
CPG 16.38 ELD 3.62 EH 15.79 0.7% ATP 2.76 IFC 91.15
TOU 31.26 YRI 2.08 ACQ 27.75 1.4% CPX 19.18 XRE 14.85
COS 6.33 IMG 2.05 0.9% LNF 13.72 0.8% AQN 9.25 HR-U 20.33 ARX 18.07 IGT 14.31 0.0% Symbol H/L Last %Chg GBT 15.50 2.5% BLX 12.22 REF-U 39.90
MEG 8.71 FNV 54.69 NVDQ US 12.08 1.4% INE 9.98 DRG-U 8.91
VET 43.08 CG 6.26 NHC 6.45 CSE 3.13 CUF-U 16.29
BTE 6.37 NGD 3.00 CSH-U 12.29 Consumer Staples TA 5.67 CRR-U 12.72
POU 11.51 AGI 5.72 DR 16.46 1.4% Symbol H/L Last %Chg AP-U 34.10
PRE 3.82 SMF 2.95 ACC 18.58 PJC/A 20.40 D-U 20.25
PEY 29.98 NG 4.52 SIA H 16.72 0.1% L 69.30 BOX-U 24.61
PSK 24.69 DGC 13.01 RLC 11.97 0.1% WN 110.04 Telecom Services BEI-U 55.08
ERF 7.56 PVG 6.44 PLI 1.86 MRU 34.77 0.5% Symbol Last %Chg CAR-U 28.01 UPL US 6.66 PHY/U 9.10 GUD 7.62 ATD/B 59.63 BCE 54.37 NPR-U 20.34 WCP 11.14 SEA 7.57 VRX 301.78 EMP/A 91.82 0.3% T 42.44 REI-U 24.22 VII 12.65 KGI 5.11 CXR 97.24 NWC 26.87 MBT 28.70 0.0% SRU-U 28.70 PWT 0.72 BTO 1.63 COM 12.63 0.8% LIQ 11.85 0.3% RCI/B 44.30 CRT-U 12.20 PGF 1.46 XGD 7.42 MSL 2.10 CSW/A 19.93 0.5% MRT-U 13.49 0.5%TET 4.17 P 2.97 EXE 8.06 BCB 14.55 AX-U 12.10 BNP 3.68 AR 1.16 SAP 29.62 INN-U 5.27 ATH 1.37 TXG 1.08 MFI 22.35 0.3% NWH-U 8.02 1.2%BNE 19.20 LSG 1.02 AGT 28.74 0.2% BAM/A 40.92 NBZ 4.85 CNL 2.53 RSI 4.19 FCR 18.57 FRU 10.18 RMX 0.95 PBH 32.18 2.2% DRM 7.47 RRX 8.00 OR 14.43 CLR 10.80 MRC 136.50 1.1%PXT 8.87 SSL 3.27 SOY 10.51 BPY-U 27.19 0.0%BIR 6.24 OGC 2.27 HLF 18.03 0.7% GRT-U 37.47 0.3%SGY 2.64 GUY 3.79 KMP 9.99 AOI 1.67 CGG 1.73 MEQ 31.30 0.1%KEL 5.68 ASR 2.73 MRD 16.15 2.6%NVA 5.02 NSU 3.99 3.3% CIG 56.37 0.4%BNK 1.92 R 0.53 ISV 13.90 BXE 2.20 SLW 15.09 AIF 19.75
-1.2% -6.5% -1.5% -2.4% -1.5% -0.3% -1.3%
-1.0% -7.5% -1.6% -0.1% -1.1%-4.1% -1.9% -1.6% -0.4% -0.8%
L -8.8% -2.9% -1.0% -1.2%
-6.4% -2.6% -1.9%
-3.9% L -7.1% -1.0% -2.5% -0.4%-5.3% L -1.6% -0.2% -0.9%
-4.1% -6.0%
-2.8% -3.7% -0.6%-4.5% -7.3% -1.6% -0.6%-1.9% -1.0% L -2.7%-1.5% -2.5% -0.3%
-4.0% -2.9% L -3.9%-6.1% -3.8%
-6.3% -2.3% -0.2%L -4.0% -2.8%
-3.8% -3.5%-7.3%
-4.9% -3.6% L -0.8%-6.3% L -2.0% -0.7%
H/L = at a new closing 52- wk High/Low; / = within 10% of the 52- wk High/Low; Blue = S&P/TSX 60 member, Italics = ETF, Bold = move of more than 5%
Page 7 September 9, 2015
8
Trends & Inflection Points September 10, 2015Research Comment Quantitative/Technical Research Website
Mark Steele (416) 359-4641 [email protected] Assoc: Tiberiu Stoichita/Jin Li
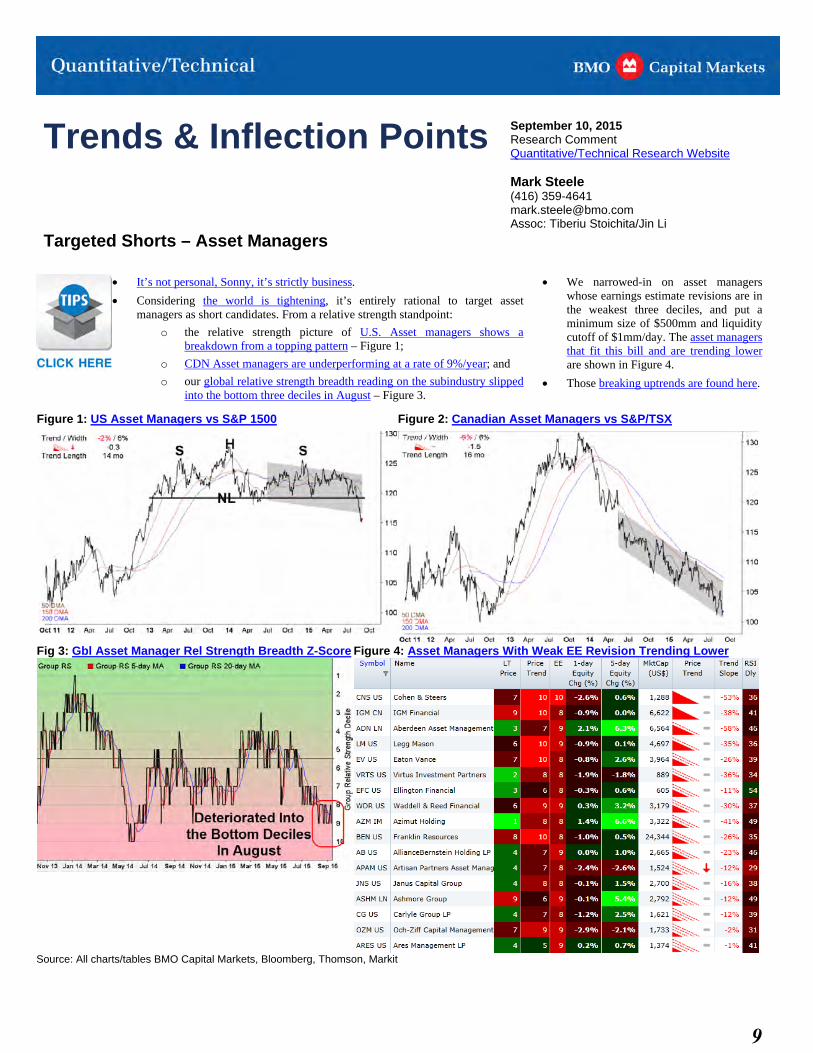
Targeted Shorts – Asset Managers
It’s not personal, Sonny, it’s strictly business.
Considering the world is tightening, it’s entirely rational to target assetmanagers as short candidates. From a relative strength standpoint:
o the relative strength picture of U.S. Asset managers shows abreakdown from a topping pattern – Figure 1;
o CDN Asset managers are underperforming at a rate of 9%/year; and
o our global relative strength breadth reading on the subindustry slippedinto the bottom three deciles in August – Figure 3.
We narrowed-in on asset managerswhose earnings estimate revisions are inthe weakest three deciles, and put aminimum size of $500mm and liquiditycutoff of $1mm/day. The asset managersthat fit this bill and are trending lowerare shown in Figure 4.
Those breaking uptrends are found here.
Figure 1: US Asset Managers vs S&P 1500 Figure 2: Canadian Asset Managers vs S&P/TSX
Fig 3: Gbl Asset Manager Rel Strength Breadth Z-Score Figure 4: Asset Managers With Weak EE Revision Trending Lower
Source: All charts/tables BMO Capital Markets, Bloomberg, Thomson, Markit
9
Trends & Inflection Points September 9, 2015Research Comment Quantitative/Technical Research Website
Mark Steele (416) 359-4641 [email protected] Assoc: Tiberiu Stoichita/Jin Li
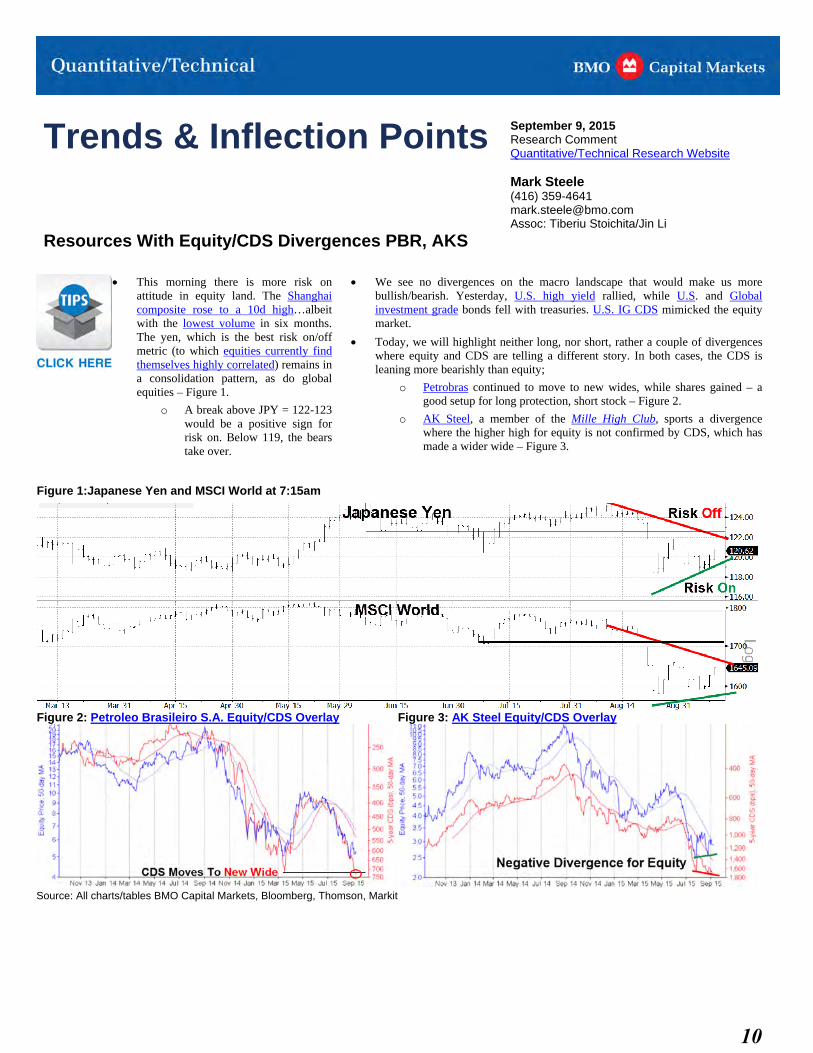
Resources With Equity/CDS Divergences PBR, AKS
This morning there is more risk onattitude in equity land. The Shanghaicomposite rose to a 10d high…albeitwith the lowest volume in six months.The yen, which is the best risk on/offmetric (to which equities currently findthemselves highly correlated) remains ina consolidation pattern, as do globalequities – Figure 1.
o A break above JPY = 122-123would be a positive sign forrisk on. Below 119, the bearstake over.
We see no divergences on the macro landscape that would make us morebullish/bearish. Yesterday, U.S. high yield rallied, while U.S. and Globalinvestment grade bonds fell with treasuries. U.S. IG CDS mimicked the equitymarket.
Today, we will highlight neither long, nor short, rather a couple of divergenceswhere equity and CDS are telling a different story. In both cases, the CDS isleaning more bearishly than equity;
o Petrobras continued to move to new wides, while shares gained – agood setup for long protection, short stock – Figure 2.
o AK Steel, a member of the Mille High Club, sports a divergencewhere the higher high for equity is not confirmed by CDS, which hasmade a wider wide – Figure 3.
Figure 1:Japanese Yen and MSCI World at 7:15am
Figure 2: Petroleo Brasileiro S.A. Equity/CDS Overlay Figure 3: AK Steel Equity/CDS Overlay
Source: All charts/tables BMO Capital Markets, Bloomberg, Thomson, Markit
10
Trends & Inflection Points September 8, 2015Research Comment Quantitative/Technical Research Website
Mark Steele (416) 359-4641 [email protected] Assoc: Tiberiu Stoichita/Jin Li
Relative Highs CLICK HERE for a printer friendly version of this report including research disclosures.
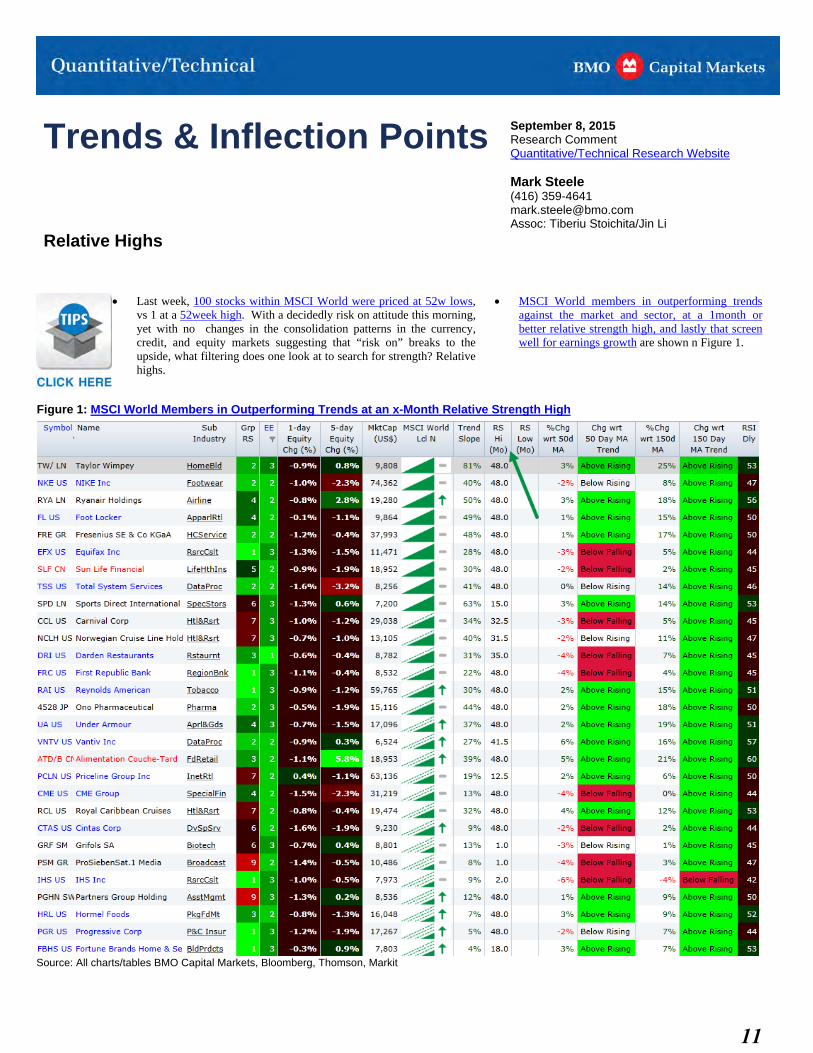
Last week, 100 stocks within MSCI World were priced at 52w lows,vs 1 at a 52week high. With a decidedly risk on attitude this morning,yet with no changes in the consolidation patterns in the currency,credit, and equity markets suggesting that “risk on” breaks to theupside, what filtering does one look at to search for strength? Relativehighs.
MSCI World members in outperforming trendsagainst the market and sector, at a 1month orbetter relative strength high, and lastly that screenwell for earnings growth are shown n Figure 1.
Figure 1: MSCI World Members in Outperforming Trends at an x-Month Relative Strength High
Source: All charts/tables BMO Capital Markets, Bloomberg, Thomson, Markit
11
Trends & Inflection Points September 4, 2015Research Comment Quantitative/Technical Research Website
Mark Steele (416) 359-4641 [email protected] Assoc: Tiberiu Stoichita/Jin Li
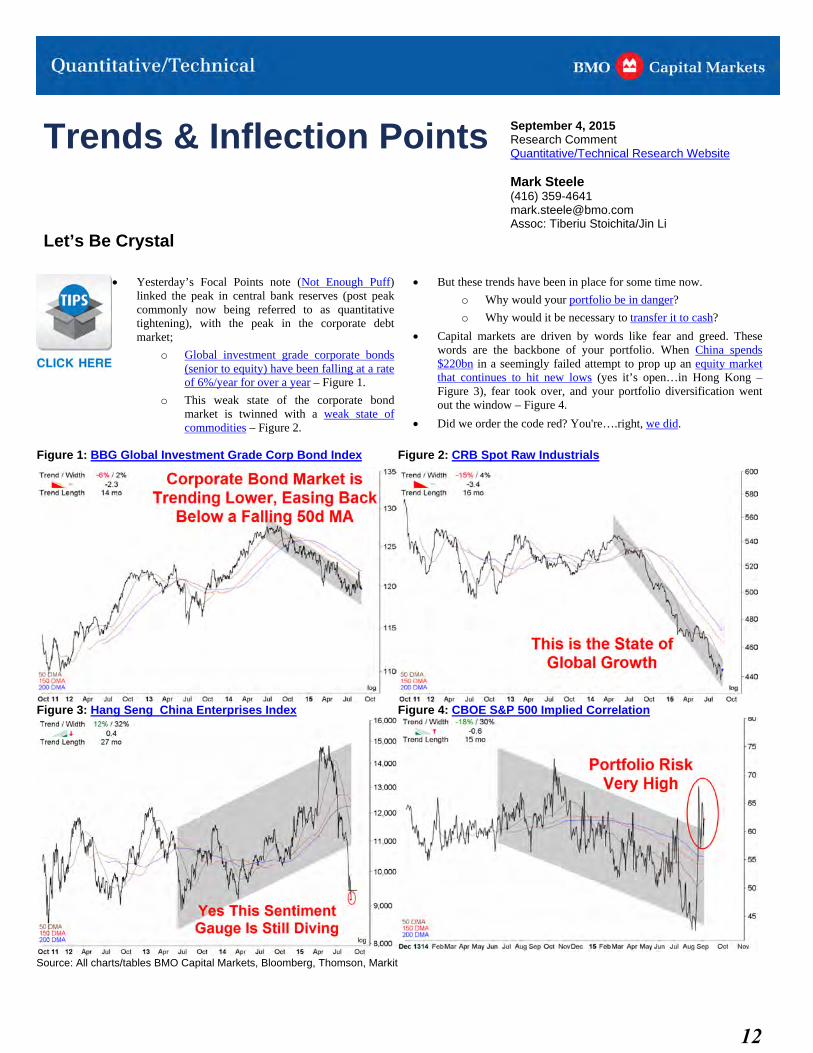
Let’s Be Crystal
Yesterday’s Focal Points note (Not Enough Puff)linked the peak in central bank reserves (post peakcommonly now being referred to as quantitativetightening), with the peak in the corporate debtmarket;
o Global investment grade corporate bonds(senior to equity) have been falling at a rateof 6%/year for over a year – Figure 1.
o This weak state of the corporate bondmarket is twinned with a weak state ofcommodities – Figure 2.
But these trends have been in place for some time now.
o Why would your portfolio be in danger?
o Why would it be necessary to transfer it to cash?
Capital markets are driven by words like fear and greed. Thesewords are the backbone of your portfolio. When China spends$220bn in a seemingly failed attempt to prop up an equity marketthat continues to hit new lows (yes it’s open…in Hong Kong –Figure 3), fear took over, and your portfolio diversification wentout the window – Figure 4.
Did we order the code red? You're….right, we did.
Figure 1: BBG Global Investment Grade Corp Bond Index Figure 2: CRB Spot Raw Industrials
Figure 3: Hang Seng China Enterprises Index Figure 4: CBOE S&P 500 Implied Correlation
Source: All charts/tables BMO Capital Markets, Bloomberg, Thomson, Markit
12
Trends & Inflection Points September 3, 2015Research Comment Quantitative/Technical Research Website
Mark Steele (416) 359-4641 [email protected] Assoc: Tiberiu Stoichita/Jin Li
Why the Growth Portfolio? CLICK HERE for a printer friendly version of this report including research disclosures.
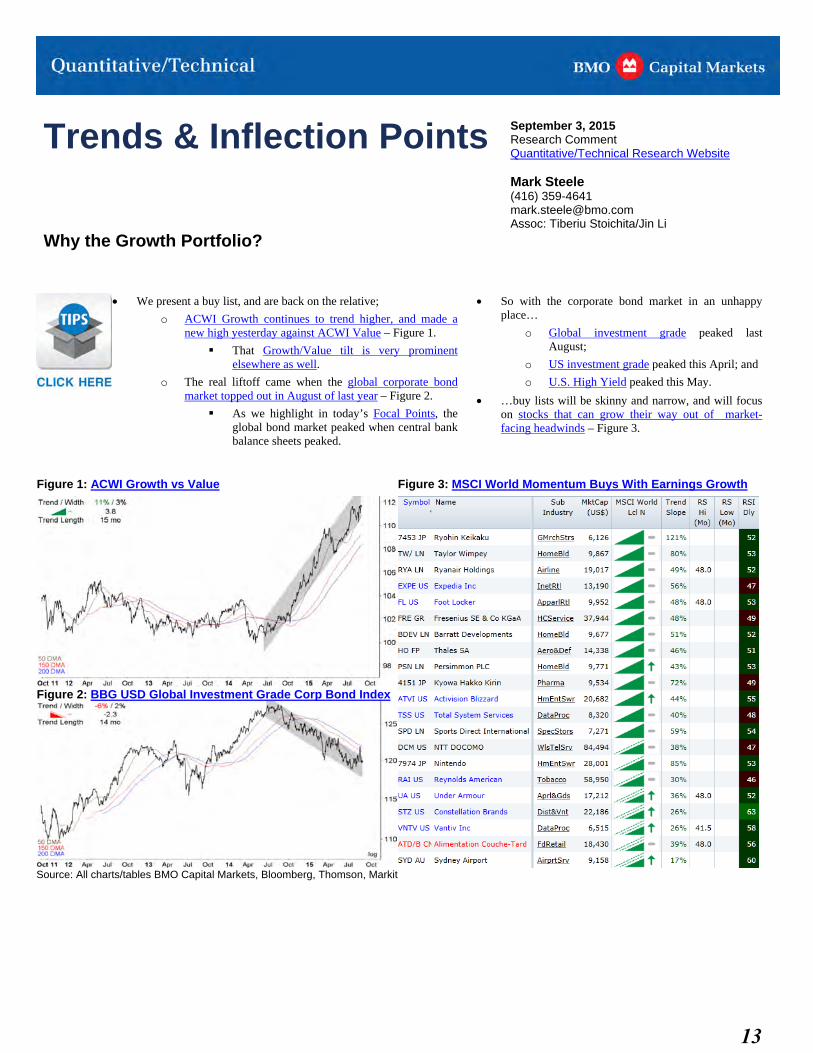
We present a buy list, and are back on the relative;
o ACWI Growth continues to trend higher, and made anew high yesterday against ACWI Value – Figure 1.
That Growth/Value tilt is very prominentelsewhere as well.
o The real liftoff came when the global corporate bondmarket topped out in August of last year – Figure 2.
As we highlight in today’s Focal Points, theglobal bond market peaked when central bankbalance sheets peaked.
So with the corporate bond market in an unhappyplace…
o Global investment grade peaked lastAugust;
o US investment grade peaked this April; and
o U.S. High Yield peaked this May.
…buy lists will be skinny and narrow, and will focus on stocks that can grow their way out of market-facing headwinds – Figure 3.
Figure 1: ACWI Growth vs Value Figure 3: MSCI World Momentum Buys With Earnings Growth
Figure 2: BBG USD Global Investment Grade Corp Bond Index
Source: All charts/tables BMO Capital Markets, Bloomberg, Thomson, Markit
13
Trends & Inflection Points September 2, 2015Research Comment Quantitative/Technical Research Website
Mark Steele (416) 359-4641 [email protected] Assoc: Tiberiu Stoichita/Jin Li
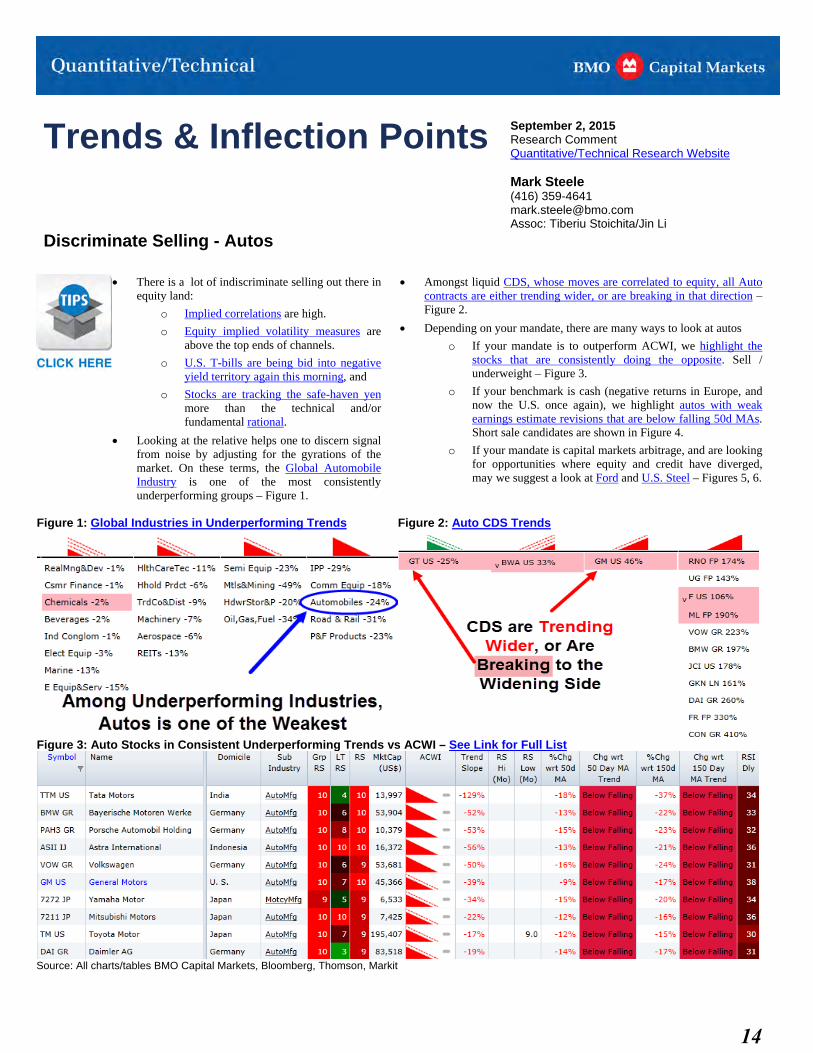
Discriminate Selling - Autos
There is a lot of indiscriminate selling out there inequity land:
o Implied correlations are high.
o Equity implied volatility measures areabove the top ends of channels.
o U.S. T-bills are being bid into negativeyield territory again this morning, and
o Stocks are tracking the safe-haven yenmore than the technical and/orfundamental rational.
Looking at the relative helps one to discern signalfrom noise by adjusting for the gyrations of themarket. On these terms, the Global AutomobileIndustry is one of the most consistentlyunderperforming groups – Figure 1.
Amongst liquid CDS, whose moves are correlated to equity, all Autocontracts are either trending wider, or are breaking in that direction –Figure 2.
Depending on your mandate, there are many ways to look at autos
o If your mandate is to outperform ACWI, we highlight thestocks that are consistently doing the opposite. Sell /underweight – Figure 3.
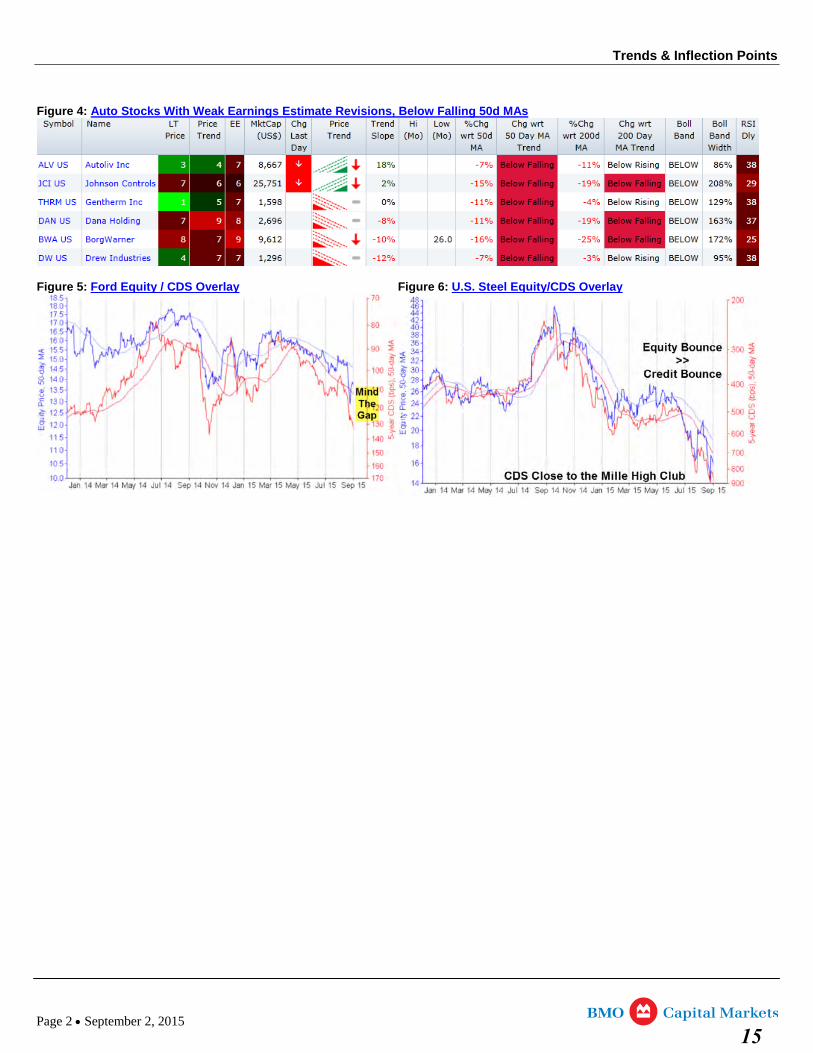
o If your benchmark is cash (negative returns in Europe, andnow the U.S. once again), we highlight autos with weak earnings estimate revisions that are below falling 50d MAs. Short sale candidates are shown in Figure 4.
o If your mandate is capital markets arbitrage, and are lookingfor opportunities where equity and credit have diverged, may we suggest a look at Ford and U.S. Steel – Figures 5, 6.
Figure 1: Global Industries in Underperforming Trends Figure 2: Auto CDS Trends
Figure 3: Auto Stocks in Consistent Underperforming Trends vs ACWI – See Link for Full List
Source: All charts/tables BMO Capital Markets, Bloomberg, Thomson, Markit
14
Trends & Inflection Points
Figure 4: Auto Stocks With Weak Earnings Estimate Revisions, Below Falling 50d MAs
Figure 5: Ford Equity / CDS Overlay Figure 6: U.S. Steel Equity/CDS Overlay
Page 2 September 2, 2015 15

Trends & Inflection Points September 1, 2015Research Comment Quantitative/Technical Research Website
Mark Steele (416) 359-4641 [email protected] Assoc: Tiberiu Stoichita/Jin Li
Cash Explores New Space
Yesterday, and again this morning, U.S. T-bills werebid into negative yield – Figure 1.
o As the market leans toward charging youfor that vault, it’s time to talk cash.
Safe-haven long bonds don’t seem to be behavingquite as well as they should, given the equityturmoil, and no it’s not because of the oil price; ifanything, European government bonds were trashedyesterday before oil surged.
o China is a seller of treasuries.
o Yesterday, one could speculate from thetape and that a Gulf petrostate may havebeen be a seller of bonds.
Corporate credit risk is trending higher, banks and capital marketindustries are breaking down.
o Last week, we highlighted the fact that panic signalingfrom currency volatility shows we are in 2008 territory.
Implied correlation is very high, which means the risk reductiondue to portfolio diversification is not working as it should - Figure 2.
The correlation of equity market returns to returns on the safe-haven yen is very high, and indeed is exploring new space – Fig 3.
Position your portfolio defensively, prepare your buy lists, and yeswith T-bills being bid into negative yield, the market asks you how much cash do you have?
Figure 1: Bid on U.S. T-Bill Maturing November 5, 2015 Figure 2: CBOE S&P 500 Implied Correlation
Figure 3: Rolling 30-Day Correlation of the Safe-Haven Yen and MSCI World
Source: All charts/tables BMO Capital Markets, Bloomberg, Thomson, Markit
16
Trends & Inflection Points August 31, 2015Research Comment Quantitative/Technical Research Website
Mark Steele (416) 359-4641 [email protected] Assoc: Tiberiu Stoichita/Jin Li
Oil & Gas Producers – Why No Pulse? CLICK HERE for a printer friendly version of this report including research disclosures.
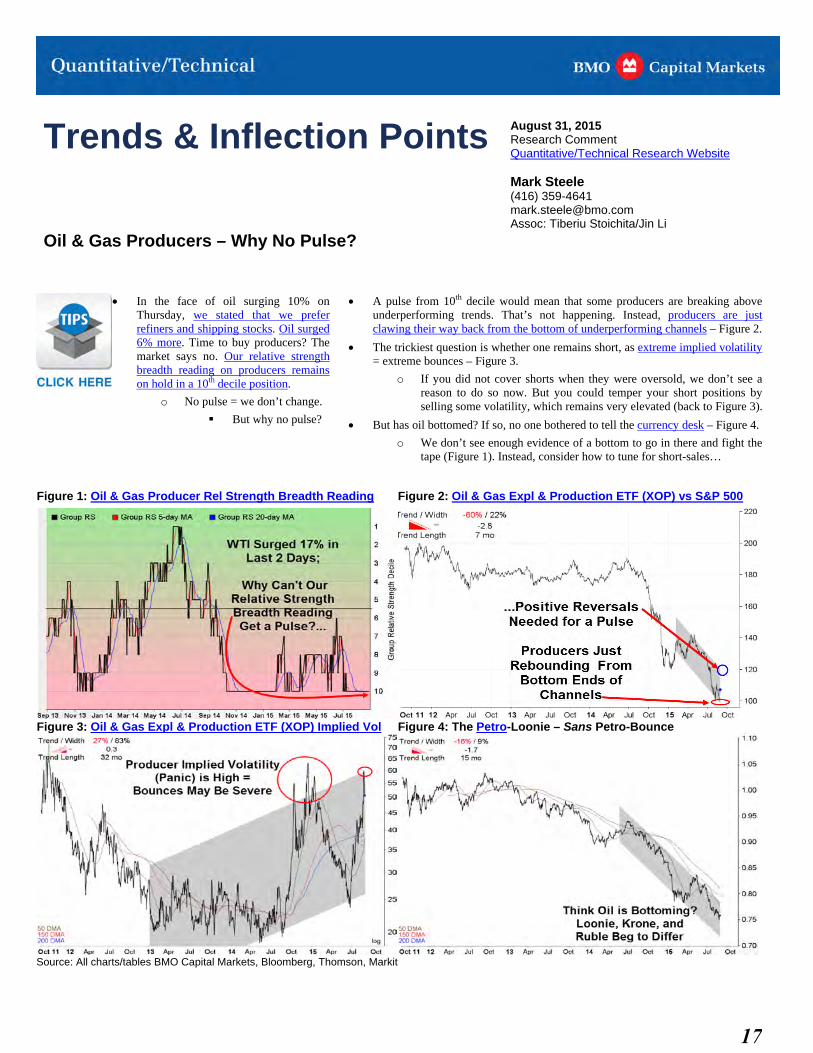
In the face of oil surging 10% onThursday, we stated that we preferrefiners and shipping stocks. Oil surged6% more. Time to buy producers? Themarket says no. Our relative strengthbreadth reading on producers remainson hold in a 10th decile position.
o No pulse = we don’t change.
But why no pulse?
A pulse from 10th decile would mean that some producers are breaking aboveunderperforming trends. That’s not happening. Instead, producers are justclawing their way back from the bottom of underperforming channels – Figure 2.
The trickiest question is whether one remains short, as extreme implied volatility= extreme bounces – Figure 3.
o If you did not cover shorts when they were oversold, we don’t see areason to do so now. But you could temper your short positions byselling some volatility, which remains very elevated (back to Figure 3).
But has oil bottomed? If so, no one bothered to tell the currency desk – Figure 4.
o We don’t see enough evidence of a bottom to go in there and fight thetape (Figure 1). Instead, consider how to tune for short-sales…
Figure 1: Oil & Gas Producer Rel Strength Breadth Reading Figure 2: Oil & Gas Expl & Production ETF (XOP) vs S&P 500
Figure 3: Oil & Gas Expl & Production ETF (XOP) Implied Vol Figure 4: The Petro-Loonie – Sans Petro-Bounce
Source: All charts/tables BMO Capital Markets, Bloomberg, Thomson, Markit
17
Trends & Inflection Points
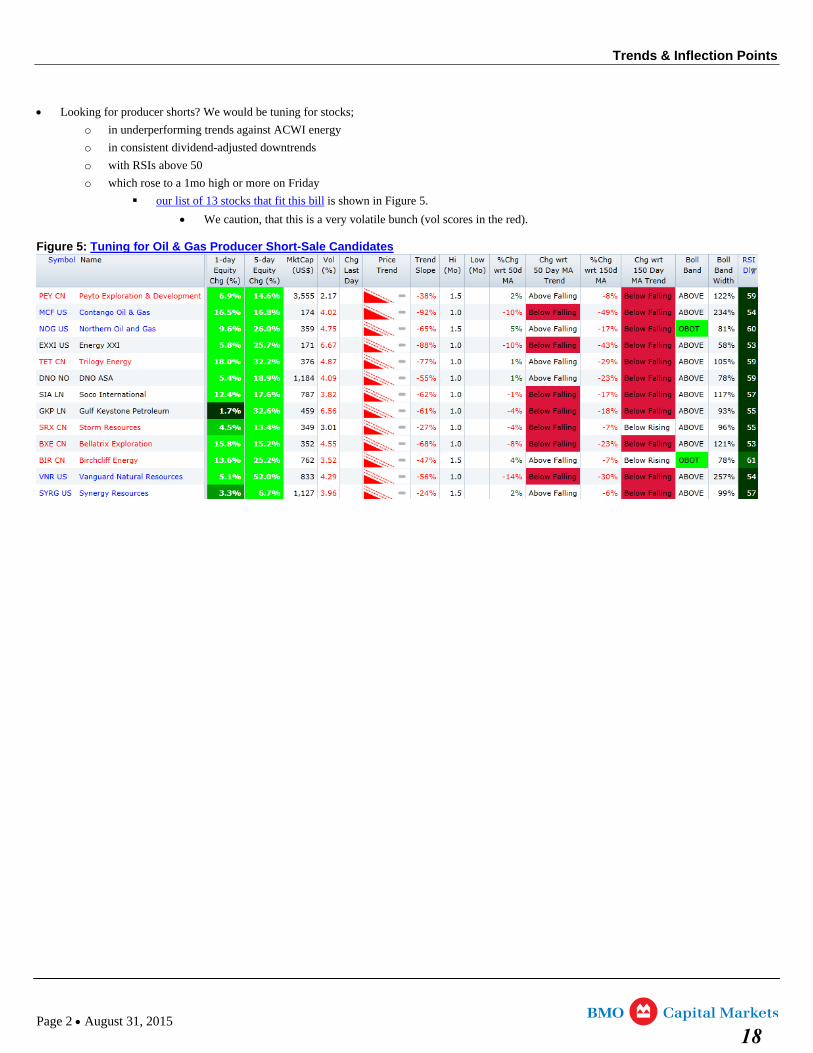
Looking for producer shorts? We would be tuning for stocks;
o in underperforming trends against ACWI energy
o in consistent dividend-adjusted downtrends
o with RSIs above 50
o which rose to a 1mo high or more on Friday
our list of 13 stocks that fit this bill is shown in Figure 5.
We caution, that this is a very volatile bunch (vol scores in the red).
Figure 5: Tuning for Oil & Gas Producer Short-Sale Candidates
Page 2 August 31, 2015
18
Trends & Inflection Points August 28, 2015Research Comment Quantitative/Technical Research Website
Mark Steele (416) 359-4641 [email protected] Assoc: Tiberiu Stoichita/Jin Li
What To Buy in Energy – Refiners, Shipping
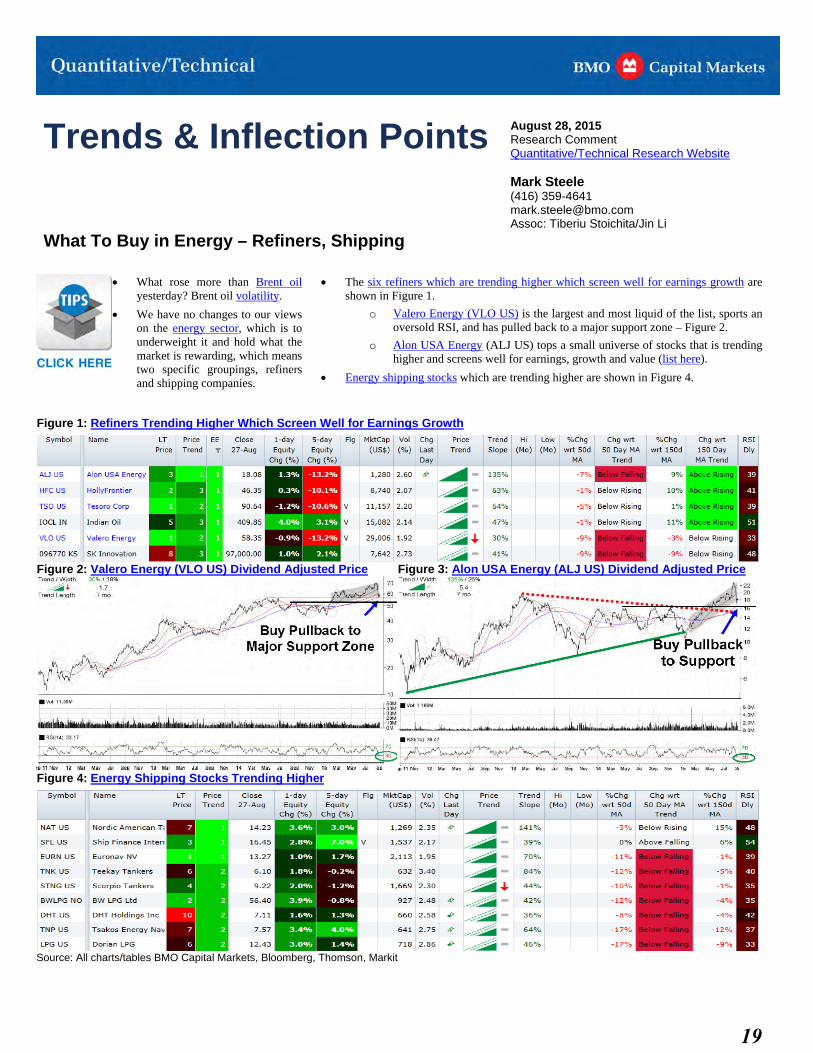
What rose more than Brent oilyesterday? Brent oil volatility.
We have no changes to our viewson the energy sector, which is tounderweight it and hold what themarket is rewarding, which meanstwo specific groupings, refinersand shipping companies.
The six refiners which are trending higher which screen well for earnings growth areshown in Figure 1.
o Valero Energy (VLO US) is the largest and most liquid of the list, sports anoversold RSI, and has pulled back to a major support zone – Figure 2.
o Alon USA Energy (ALJ US) tops a small universe of stocks that is trendinghigher and screens well for earnings, growth and value (list here).
Energy shipping stocks which are trending higher are shown in Figure 4.
Figure 1: Refiners Trending Higher Which Screen Well for Earnings Growth
Figure 2: Valero Energy (VLO US) Dividend Adjusted Price Figure 3: Alon USA Energy (ALJ US) Dividend Adjusted Price
Figure 4: Energy Shipping Stocks Trending Higher
Source: All charts/tables BMO Capital Markets, Bloomberg, Thomson, Markit
19
Trends & Inflection Points August 27, 2015Research Comment Quantitative/Technical Research Website
Mark Steele (416) 359-4641 [email protected] Assoc: Tiberiu Stoichita/Jin Li
Canada – In the Eye of the Storm CLICK HERE for a printer friendly version of this report including research disclosures.
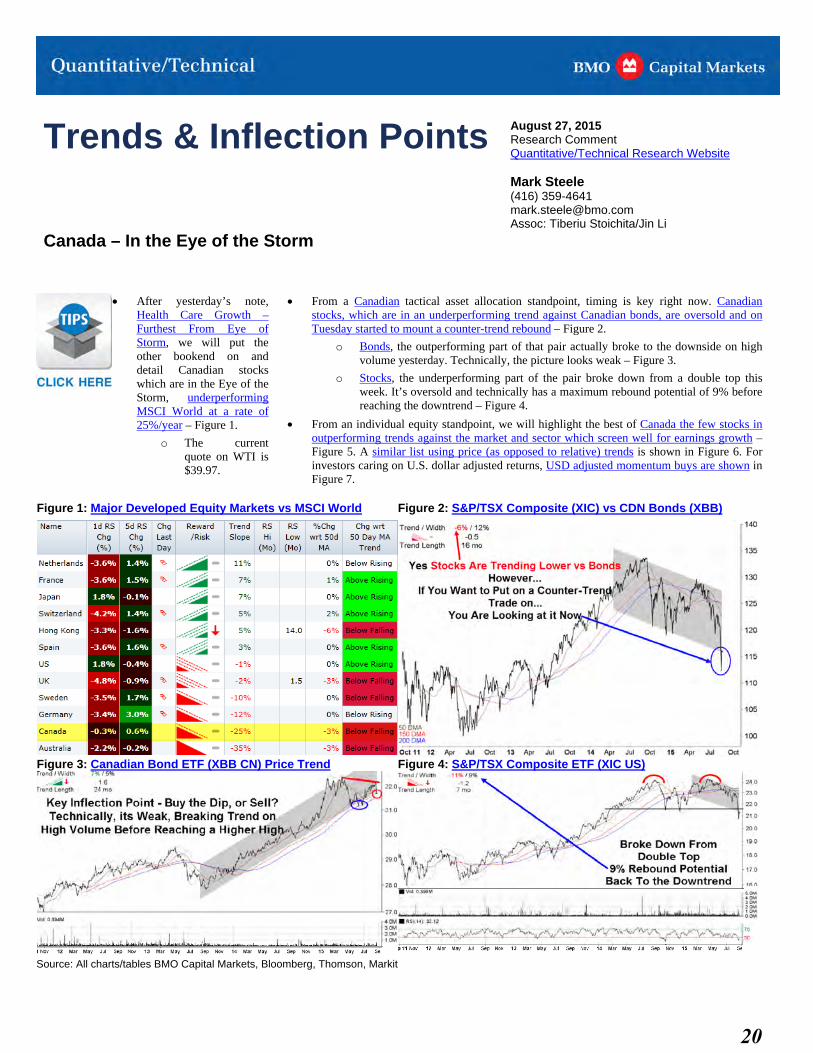
After yesterday’s note,Health Care Growth –Furthest From Eye ofStorm, we will put theother bookend on anddetail Canadian stockswhich are in the Eye of theStorm, underperformingMSCI World at a rate of25%/year – Figure 1.
o The currentquote on WTI is$39.97.
From a Canadian tactical asset allocation standpoint, timing is key right now. Canadianstocks, which are in an underperforming trend against Canadian bonds, are oversold and onTuesday started to mount a counter-trend rebound – Figure 2.
o Bonds, the outperforming part of that pair actually broke to the downside on highvolume yesterday. Technically, the picture looks weak – Figure 3.
o Stocks, the underperforming part of the pair broke down from a double top thisweek. It’s oversold and technically has a maximum rebound potential of 9% beforereaching the downtrend – Figure 4.
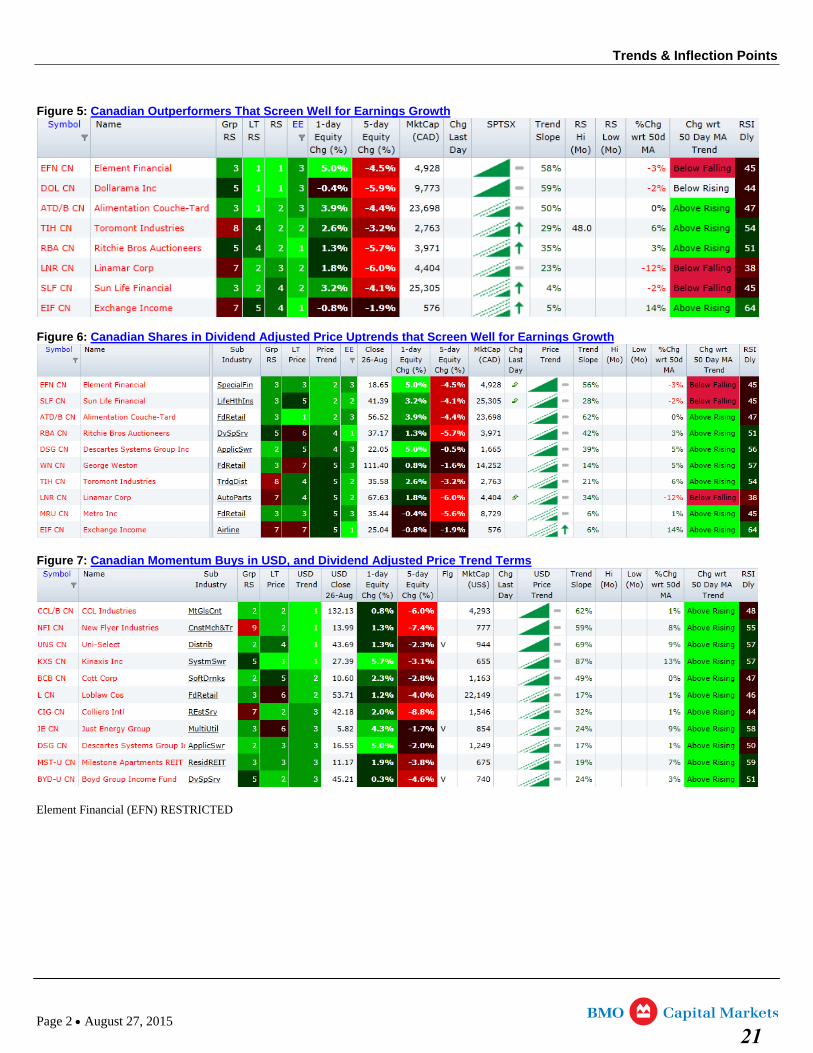
From an individual equity standpoint, we will highlight the best of Canada the few stocks inoutperforming trends against the market and sector which screen well for earnings growth –Figure 5. A similar list using price (as opposed to relative) trends is shown in Figure 6. Forinvestors caring on U.S. dollar adjusted returns, USD adjusted momentum buys are shown inFigure 7.
Figure 1: Major Developed Equity Markets vs MSCI World Figure 2: S&P/TSX Composite (XIC) vs CDN Bonds (XBB)
Figure 3: Canadian Bond ETF (XBB CN) Price Trend Figure 4: S&P/TSX Composite ETF (XIC US)
Source: All charts/tables BMO Capital Markets, Bloomberg, Thomson, Markit
20
Trends & Inflection Points
Figure 5: Canadian Outperformers That Screen Well for Earnings Growth
Figure 6: Canadian Shares in Dividend Adjusted Price Uptrends that Screen Well for Earnings Growth
Figure 7: Canadian Momentum Buys in USD, and Dividend Adjusted Price Trend Terms
Element Financial (EFN) RESTRICTED
Page 2 August 27, 2015 21
Trends & Inflection Points August 26, 2015Research Comment Quantitative/Technical Research Website
Mark Steele (416) 359-4641 [email protected] Assoc: Tiberiu Stoichita/Jin Li
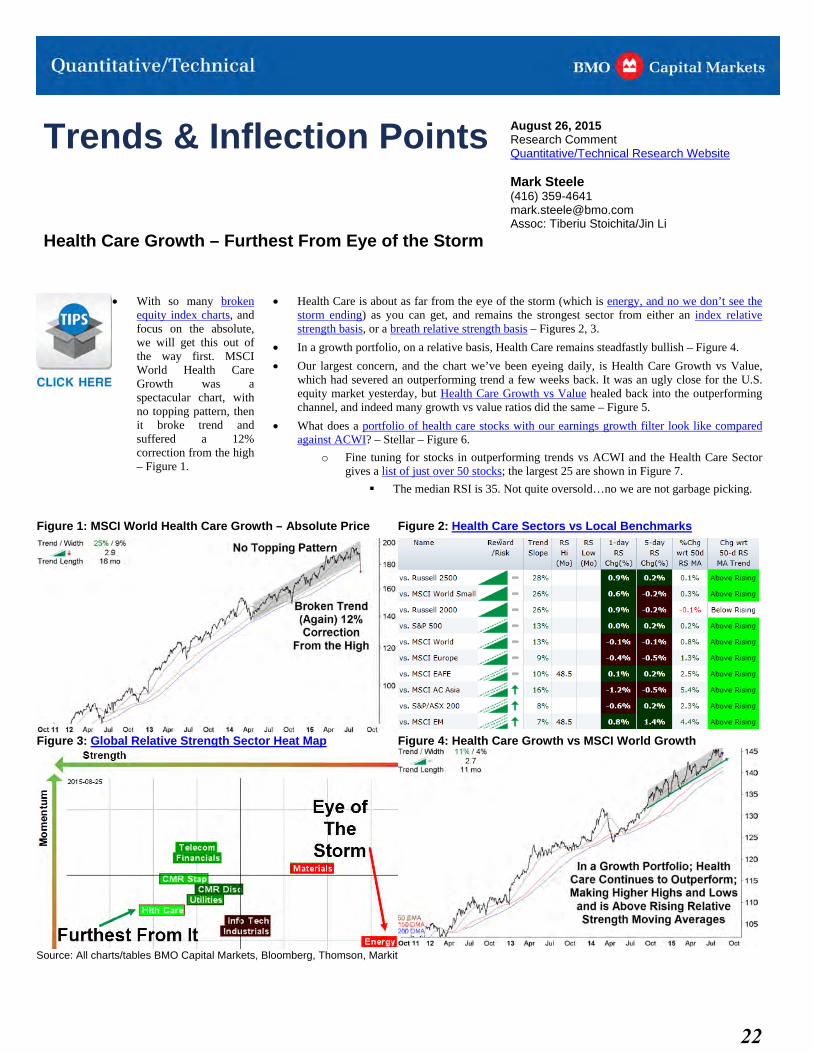
Health Care Growth – Furthest From Eye of the Storm CLICK HERE for a printer friendly version of this report including research disclosures.
With so many brokenequity index charts, andfocus on the absolute,we will get this out ofthe way first. MSCIWorld Health CareGrowth was aspectacular chart, withno topping pattern, thenit broke trend andsuffered a 12% correction from the high– Figure 1.
Health Care is about as far from the eye of the storm (which is energy, and no we don’t see thestorm ending) as you can get, and remains the strongest sector from either an index relativestrength basis, or a breath relative strength basis – Figures 2, 3.
In a growth portfolio, on a relative basis, Health Care remains steadfastly bullish – Figure 4.
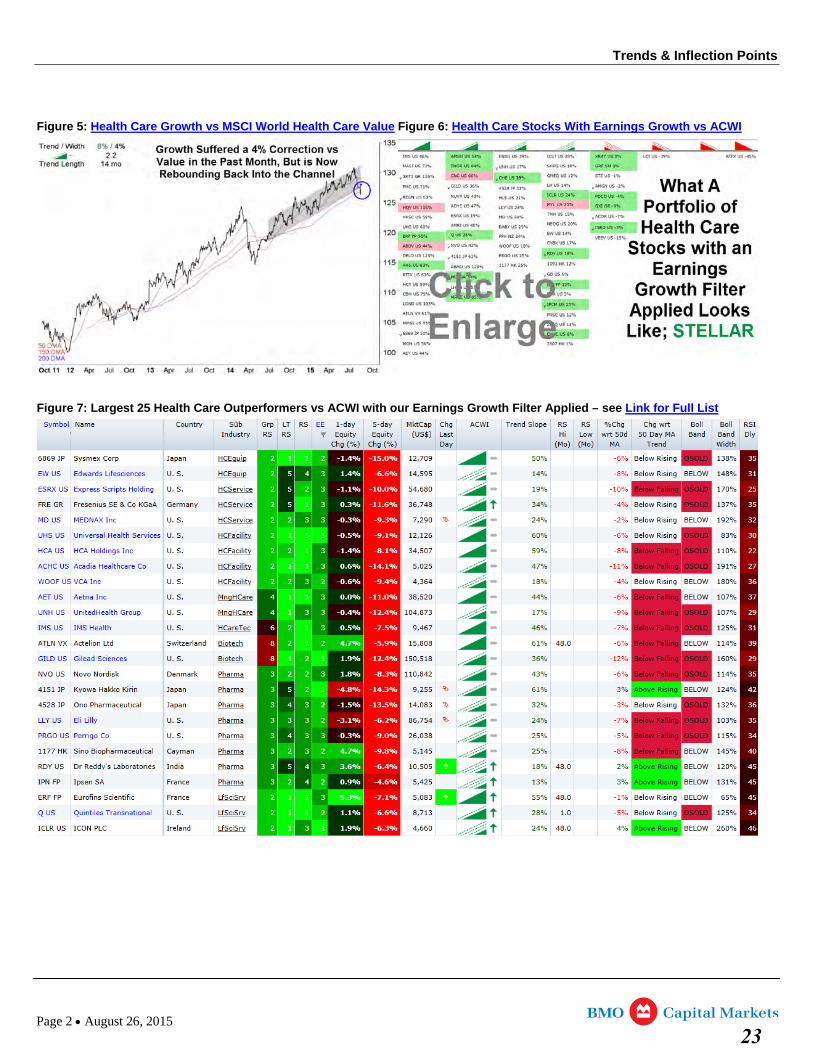
Our largest concern, and the chart we’ve been eyeing daily, is Health Care Growth vs Value,which had severed an outperforming trend a few weeks back. It was an ugly close for the U.S.equity market yesterday, but Health Care Growth vs Value healed back into the outperformingchannel, and indeed many growth vs value ratios did the same – Figure 5.
What does a portfolio of health care stocks with our earnings growth filter look like comparedagainst ACWI? – Stellar – Figure 6.
o Fine tuning for stocks in outperforming trends vs ACWI and the Health Care Sectorgives a list of just over 50 stocks; the largest 25 are shown in Figure 7.
The median RSI is 35. Not quite oversold…no we are not garbage picking.
Figure 1: MSCI World Health Care Growth – Absolute Price Figure 2: Health Care Sectors vs Local Benchmarks
Figure 3: Global Relative Strength Sector Heat Map Figure 4: Health Care Growth vs MSCI World Growth
Source: All charts/tables BMO Capital Markets, Bloomberg, Thomson, Markit
22
Trends & Inflection Points
Figure 5: Health Care Growth vs MSCI World Health Care Value Figure 6: Health Care Stocks With Earnings Growth vs ACWI
Figure 7: Largest 25 Health Care Outperformers vs ACWI with our Earnings Growth Filter Applied – see Link for Full List
Page 2 August 26, 2015
23
Trends & Inflection Points August 25, 2015Research Comment Quantitative/Technical Research Website
Mark Steele (416) 359-4641 [email protected] Assoc: Tiberiu Stoichita/Jin Li
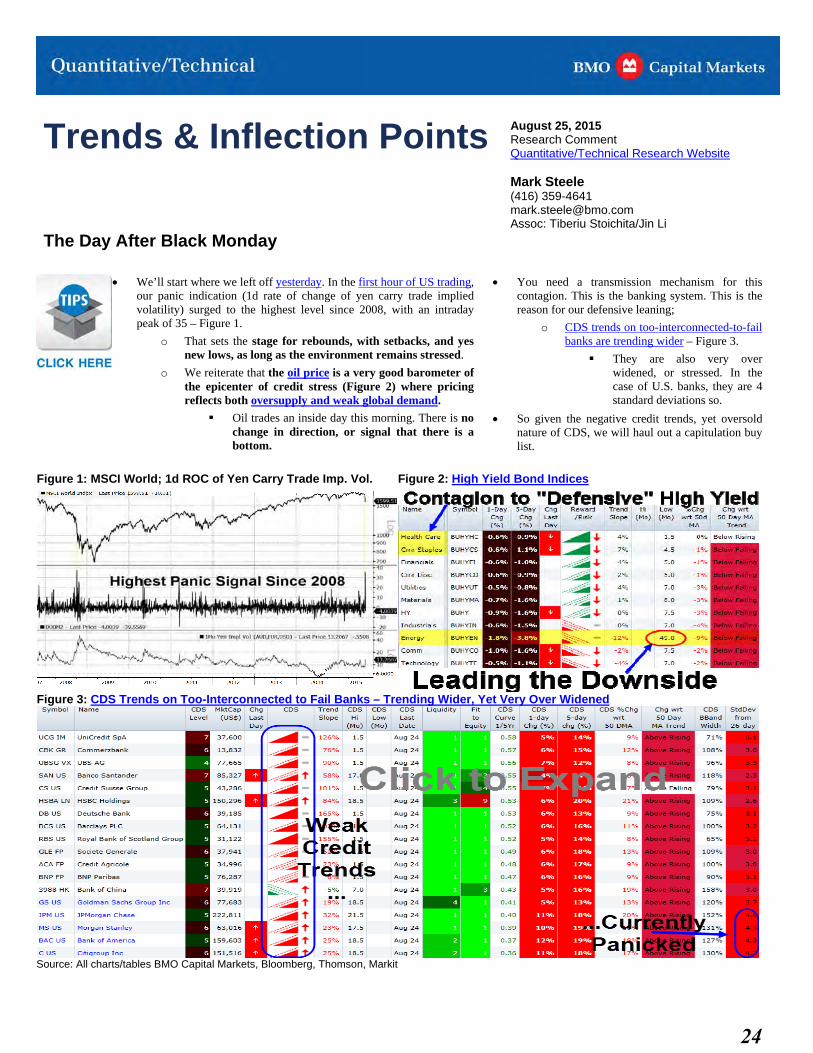
The Day After Black Monday
We’ll start where we left off yesterday. In the first hour of US trading,our panic indication (1d rate of change of yen carry trade impliedvolatility) surged to the highest level since 2008, with an intradaypeak of 35 – Figure 1.
o That sets the stage for rebounds, with setbacks, and yesnew lows, as long as the environment remains stressed.
o We reiterate that the oil price is a very good barometer ofthe epicenter of credit stress (Figure 2) where pricingreflects both oversupply and weak global demand.
Oil trades an inside day this morning. There is nochange in direction, or signal that there is abottom.
You need a transmission mechanism for thiscontagion. This is the banking system. This is thereason for our defensive leaning;
o CDS trends on too-interconnected-to-failbanks are trending wider – Figure 3.
They are also very overwidened, or stressed. In thecase of U.S. banks, they are 4standard deviations so.
So given the negative credit trends, yet oversoldnature of CDS, we will haul out a capitulation buylist.
Figure 1: MSCI World; 1d ROC of Yen Carry Trade Imp. Vol. Figure 2: High Yield Bond Indices
Figure 3: CDS Trends on Too-Interconnected to Fail Banks – Trending Wider, Yet Very Over Widened
Source: All charts/tables BMO Capital Markets, Bloomberg, Thomson, Markit
24
Trends & Inflection Points
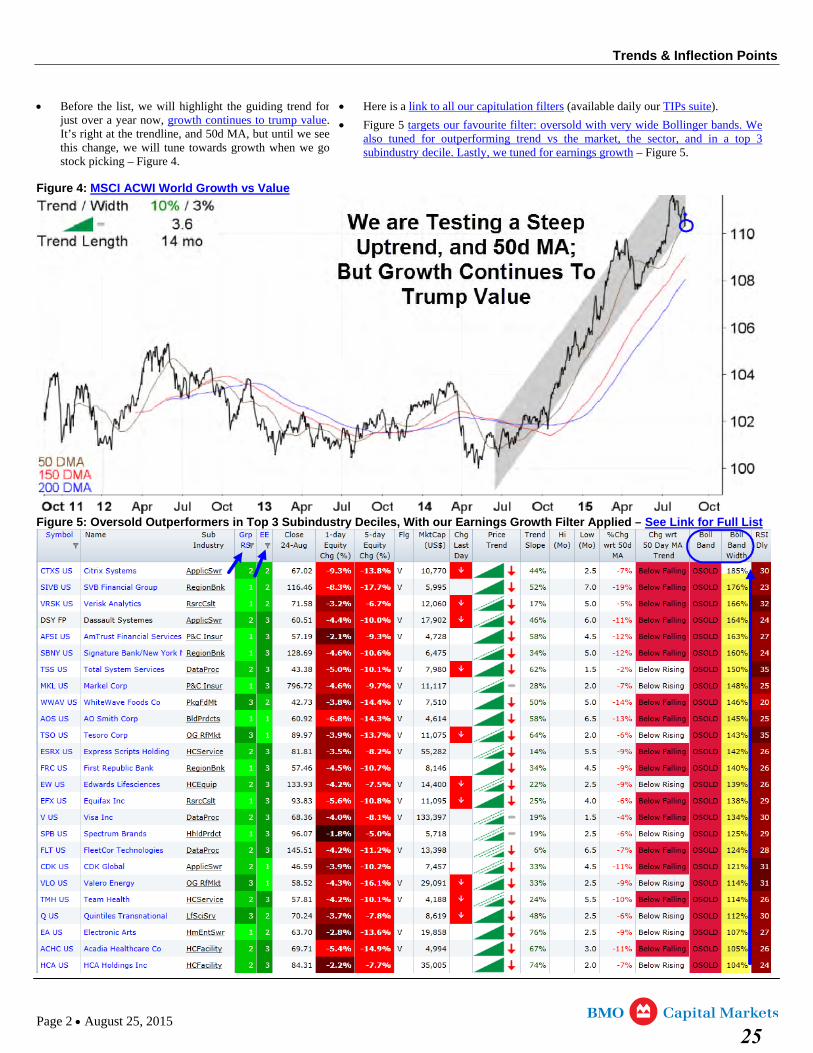
Before the list, we will highlight the guiding trend forjust over a year now, growth continues to trump value.It’s right at the trendline, and 50d MA, but until we seethis change, we will tune towards growth when we gostock picking – Figure 4.
Here is a link to all our capitulation filters (available daily our TIPs suite).
Figure 5 targets our favourite filter: oversold with very wide Bollinger bands. Wealso tuned for outperforming trend vs the market, the sector, and in a top 3subindustry decile. Lastly, we tuned for earnings growth – Figure 5.
Figure 4: MSCI ACWI World Growth vs Value
Figure 5: Oversold Outperformers in Top 3 Subindustry Deciles, With our Earnings Growth Filter Applied – See Link for Full List
Page 2 August 25, 2015
25
Trends & Inflection Points August 24, 2015Research Comment Quantitative/Technical Research Website
Mark Steele (416) 359-4641 [email protected] Assoc: Tiberiu Stoichita/Jin Li
Technical Stress Reading versus Oil/Credit Backdrop CLICK HERE for a printer friendly version of this report including research disclosures.
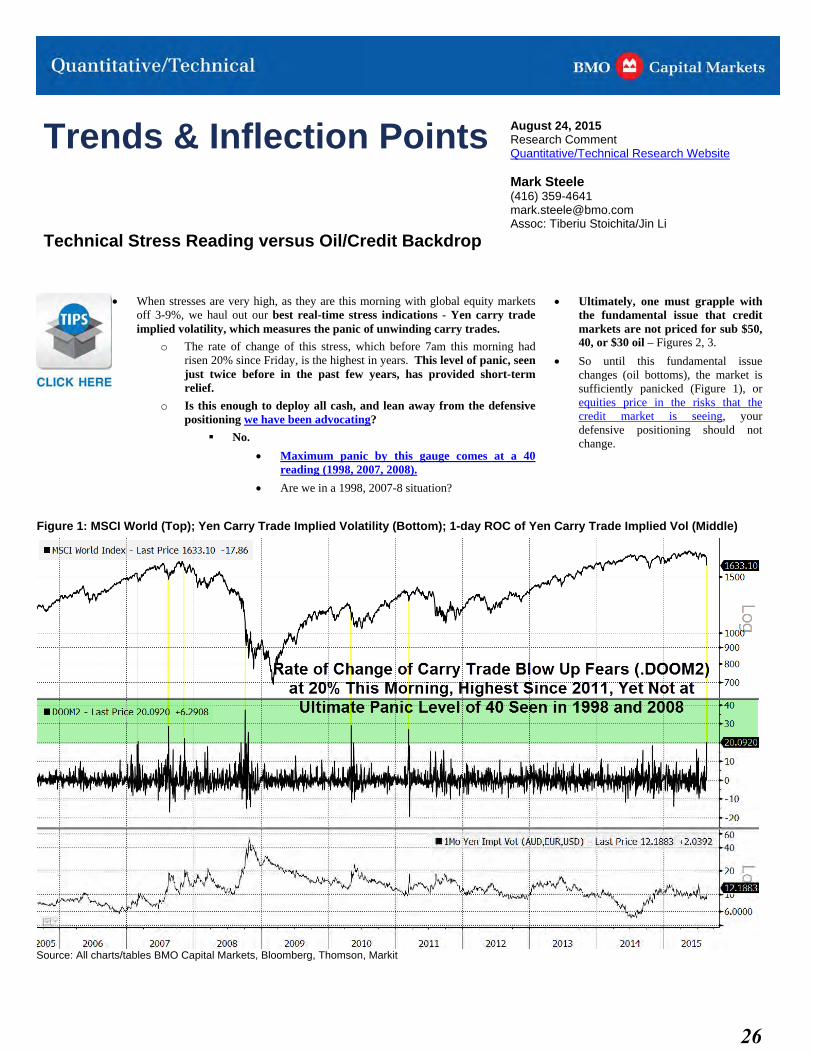
When stresses are very high, as they are this morning with global equity marketsoff 3-9%, we haul out our best real-time stress indications - Yen carry tradeimplied volatility, which measures the panic of unwinding carry trades.
o The rate of change of this stress, which before 7am this morning hadrisen 20% since Friday, is the highest in years. This level of panic, seenjust twice before in the past few years, has provided short-termrelief.
o Is this enough to deploy all cash, and lean away from the defensivepositioning we have been advocating?
No.
Maximum panic by this gauge comes at a 40reading (1998, 2007, 2008).
Are we in a 1998, 2007-8 situation?
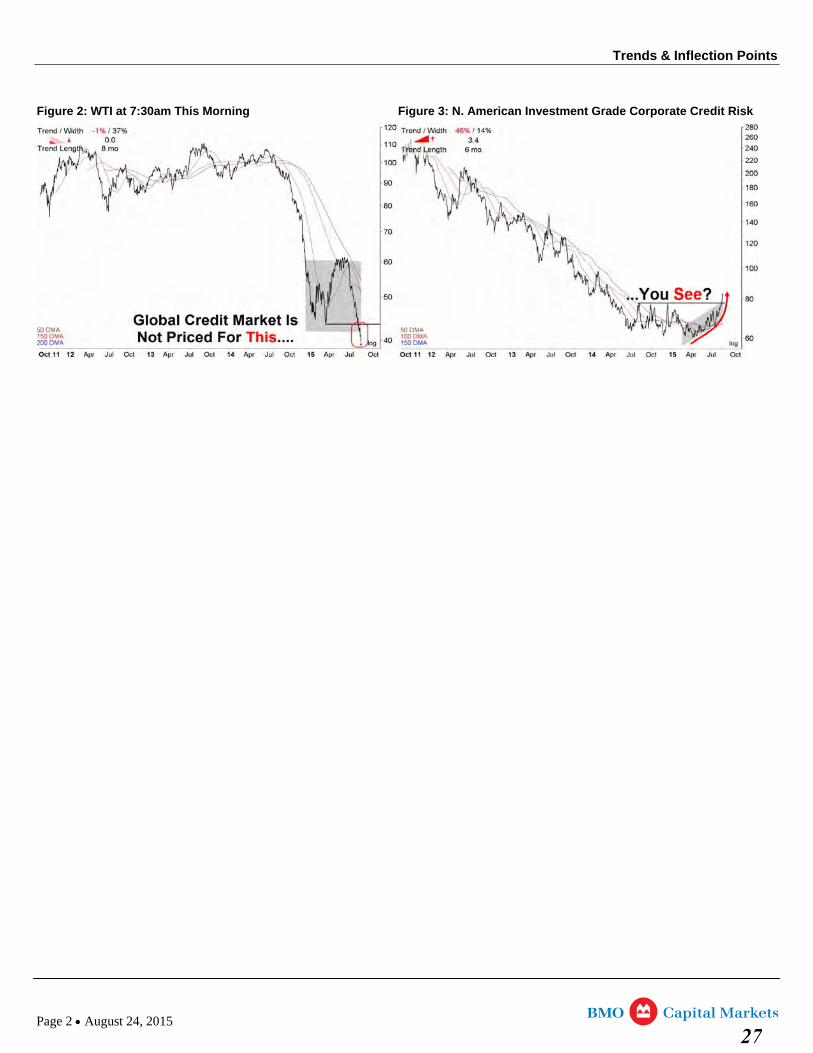
Ultimately, one must grapple withthe fundamental issue that creditmarkets are not priced for sub $50,40, or $30 oil – Figures 2, 3.
So until this fundamental issuechanges (oil bottoms), the market issufficiently panicked (Figure 1), orequities price in the risks that thecredit market is seeing, yourdefensive positioning should notchange.
Figure 1: MSCI World (Top); Yen Carry Trade Implied Volatility (Bottom); 1-day ROC of Yen Carry Trade Implied Vol (Middle)
Source: All charts/tables BMO Capital Markets, Bloomberg, Thomson, Markit
26
Trends & Inflection Points
Figure 2: WTI at 7:30am This Morning Figure 3: N. American Investment Grade Corporate Credit Risk
Page 2 August 24, 2015
27
Trends & Inflection Points August 21, 2015 Research Comment Quantitative/Technical Research Website
Mark Steele (416) 359-4641 [email protected] Assoc: Tiberiu Stoichita/Jin Li
Where Have You Positioned Your Safe Haven Assets? CLICK HERE for a printer friendly version of this report including research disclosures.
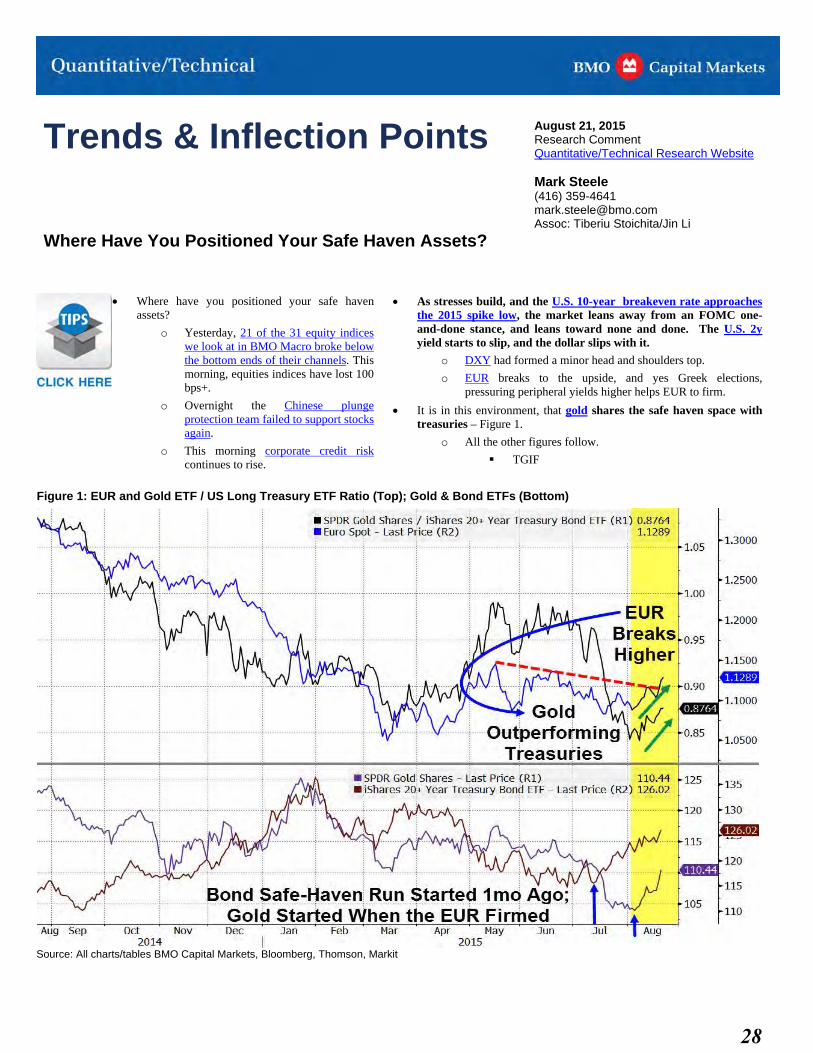
Where have you positioned your safe havenassets?
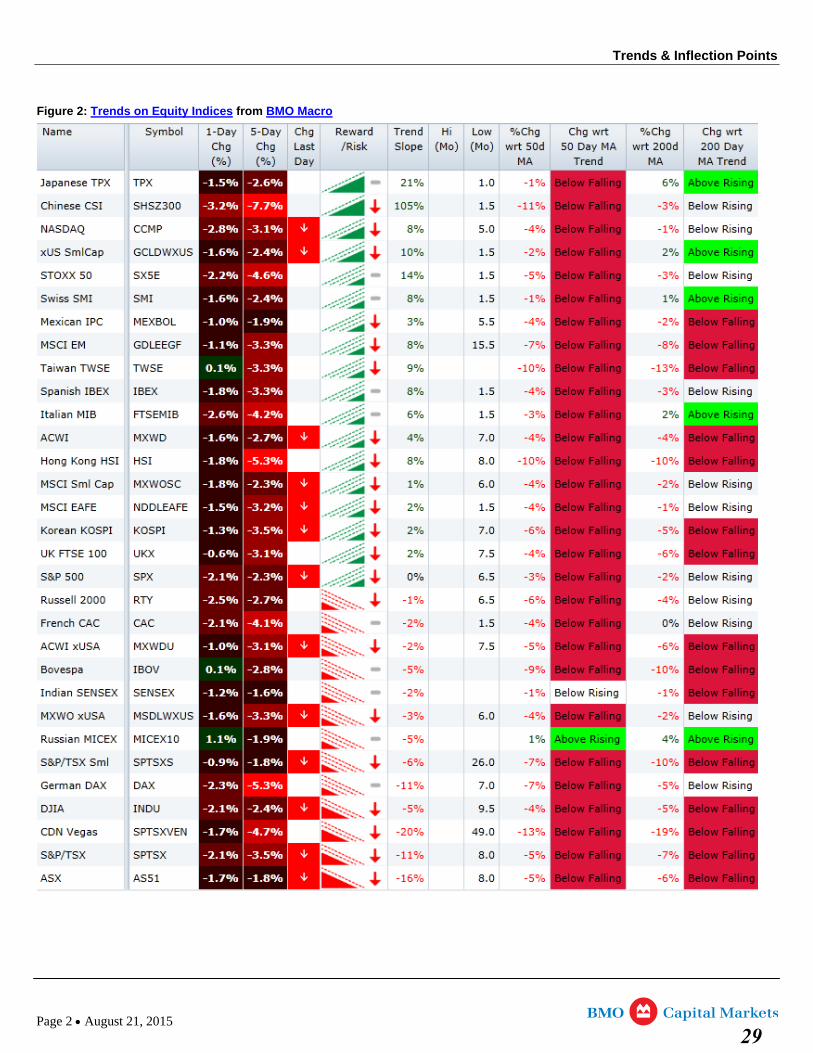
o Yesterday, 21 of the 31 equity indiceswe look at in BMO Macro broke belowthe bottom ends of their channels. Thismorning, equities indices have lost 100bps+.
o Overnight the Chinese plungeprotection team failed to support stocksagain.
o This morning corporate credit riskcontinues to rise.
As stresses build, and the U.S. 10-year breakeven rate approachesthe 2015 spike low, the market leans away from an FOMC one-and-done stance, and leans toward none and done. The U.S. 2yyield starts to slip, and the dollar slips with it.
o DXY had formed a minor head and shoulders top.
o EUR breaks to the upside, and yes Greek elections,pressuring peripheral yields higher helps EUR to firm.
It is in this environment, that gold shares the safe haven space withtreasuries – Figure 1.
o All the other figures follow.
TGIF
Figure 1: EUR and Gold ETF / US Long Treasury ETF Ratio (Top); Gold & Bond ETFs (Bottom)
Source: All charts/tables BMO Capital Markets, Bloomberg, Thomson, Markit
28
Trends & Inflection Points
Figure 2: Trends on Equity Indices from BMO Macro
Page 2 August 21, 2015 29
Trends & Inflection Points
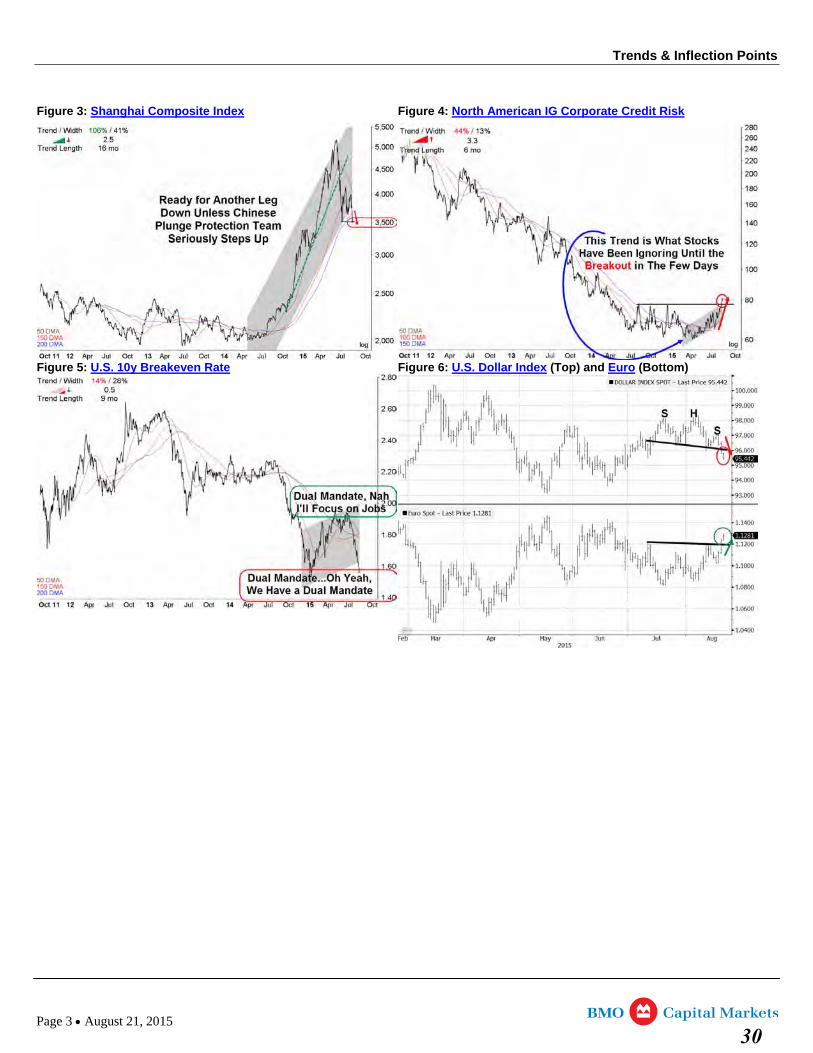
Figure 3: Shanghai Composite Index Figure 4: North American IG Corporate Credit Risk
Figure 5: U.S. 10y Breakeven Rate Figure 6: U.S. Dollar Index (Top) and Euro (Bottom)
Page 3 August 21, 2015 30
Trends & Inflection Points August 20, 2015Research Comment Quantitative/Technical Research Website
Mark Steele (416) 359-4641 [email protected] Assoc: Tiberiu Stoichita/Jin Li
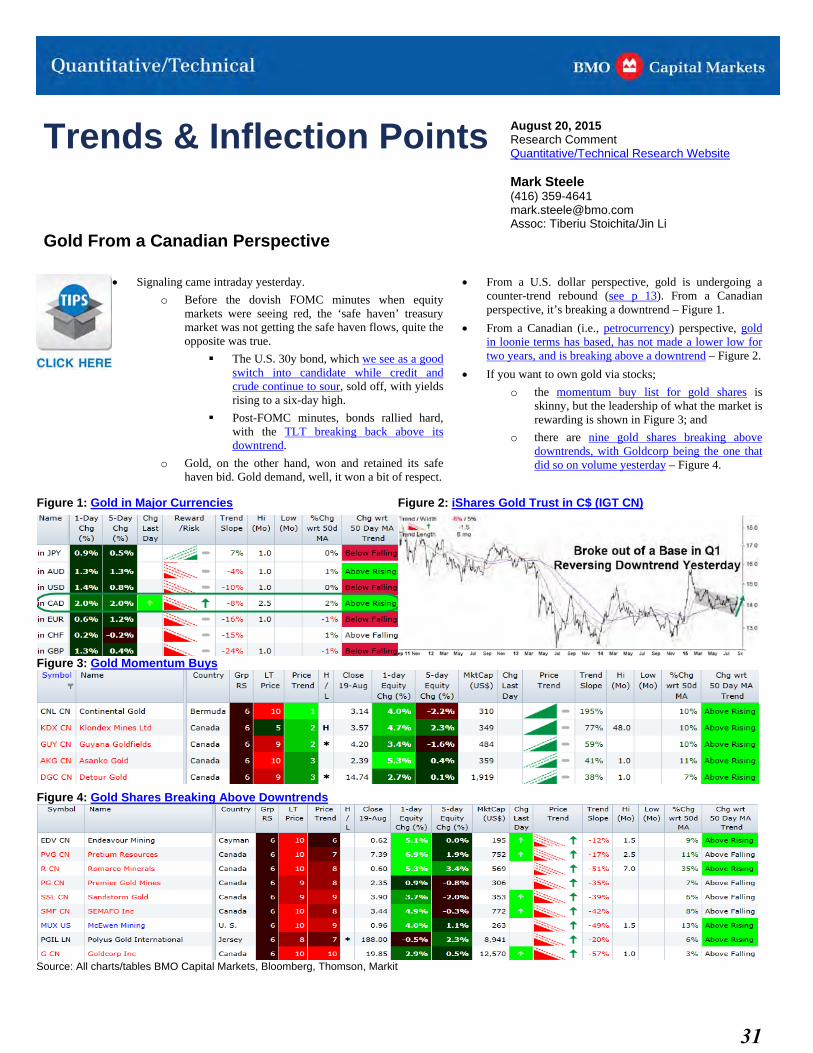
Gold From a Canadian Perspective
Signaling came intraday yesterday.
o Before the dovish FOMC minutes when equitymarkets were seeing red, the ‘safe haven’ treasurymarket was not getting the safe haven flows, quite theopposite was true.
The U.S. 30y bond, which we see as a goodswitch into candidate while credit andcrude continue to sour, sold off, with yieldsrising to a six-day high.
Post-FOMC minutes, bonds rallied hard,with the TLT breaking back above itsdowntrend.
o Gold, on the other hand, won and retained its safehaven bid. Gold demand, well, it won a bit of respect.
From a U.S. dollar perspective, gold is undergoing acounter-trend rebound (see p 13). From a Canadianperspective, it’s breaking a downtrend – Figure 1.
From a Canadian (i.e., petrocurrency) perspective, goldin loonie terms has based, has not made a lower low fortwo years, and is breaking above a downtrend – Figure 2.
If you want to own gold via stocks;
o the momentum buy list for gold shares isskinny, but the leadership of what the market isrewarding is shown in Figure 3; and
o there are nine gold shares breaking abovedowntrends, with Goldcorp being the one thatdid so on volume yesterday – Figure 4.
Figure 1: Gold in Major Currencies Figure 2: iShares Gold Trust in C$ (IGT CN)
Figure 3: Gold Momentum Buys
Figure 4: Gold Shares Breaking Above Downtrends
Source: All charts/tables BMO Capital Markets, Bloomberg, Thomson, Markit
31
Trends & Inflection Points August 19, 2015Research Comment Quantitative/Technical Research Website
Mark Steele (416) 359-4641 [email protected] Assoc: Tiberiu Stoichita/Jin Li
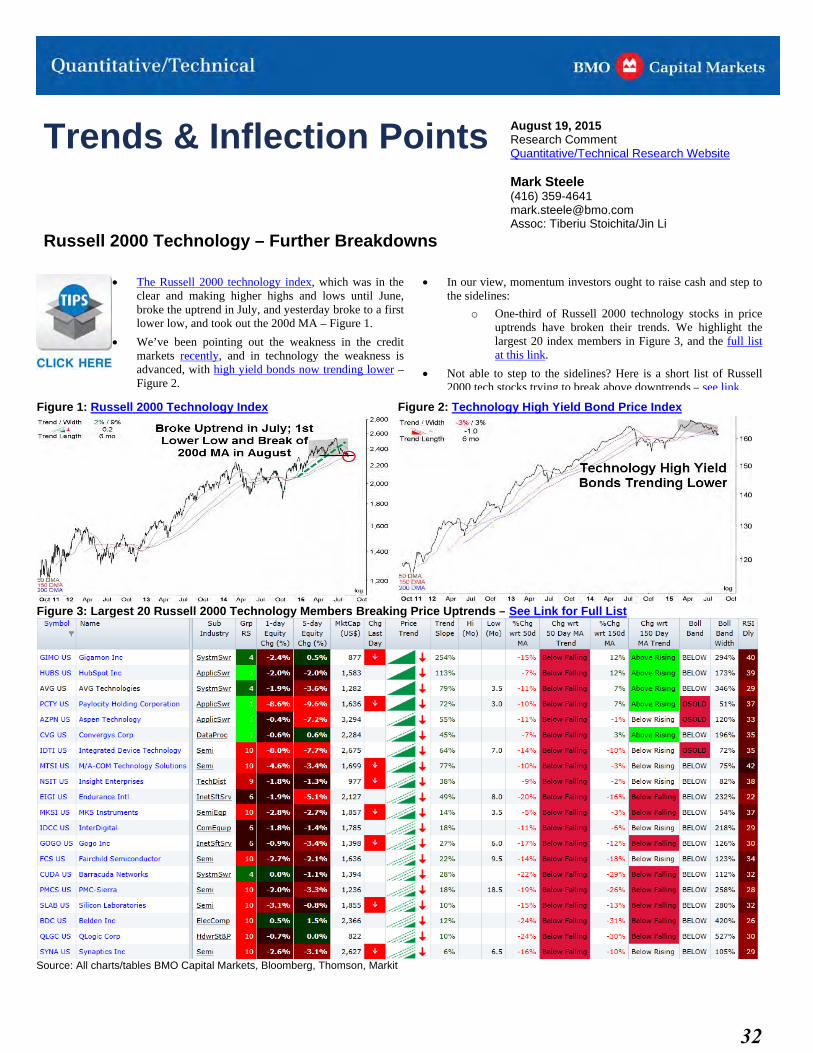
Russell 2000 Technology – Further Breakdowns
The Russell 2000 technology index, which was in theclear and making higher highs and lows until June,broke the uptrend in July, and yesterday broke to a firstlower low, and took out the 200d MA – Figure 1.
We’ve been pointing out the weakness in the creditmarkets recently, and in technology the weakness isadvanced, with high yield bonds now trending lower –Figure 2.
In our view, momentum investors ought to raise cash and step tothe sidelines:
o One-third of Russell 2000 technology stocks in priceuptrends have broken their trends. We highlight thelargest 20 index members in Figure 3, and the full listat this link.
Not able to step to the sidelines? Here is a short list of Russell2000 tech stocks trying to break above downtrends – see link.
Figure 1: Russell 2000 Technology Index Figure 2: Technology High Yield Bond Price Index
Figure 3: Largest 20 Russell 2000 Technology Members Breaking Price Uptrends – See Link for Full List
Source: All charts/tables BMO Capital Markets, Bloomberg, Thomson, Markit
32
Trends & Inflection Points August 18, 2015Research Comment Quantitative/Technical Research Website
Mark Steele (416) 359-4641 [email protected] Assoc: Tiberiu Stoichita/Jin Li
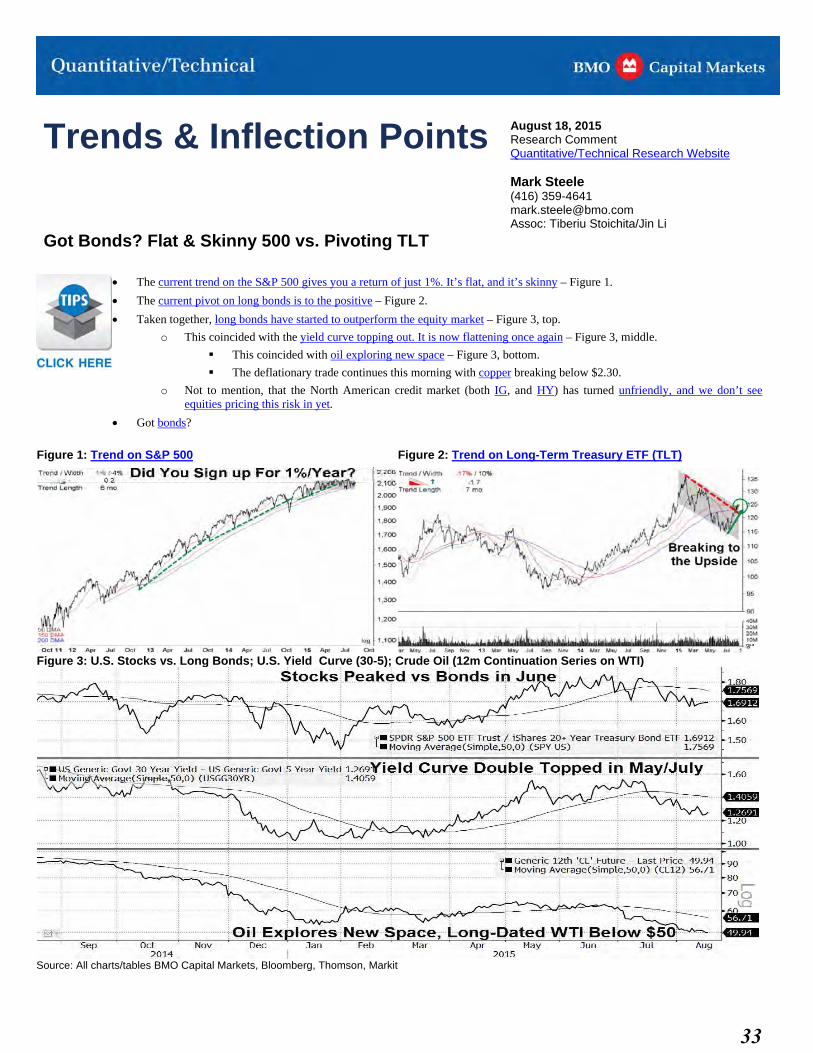
Got Bonds? Flat & Skinny 500 vs. Pivoting TLT
The current trend on the S&P 500 gives you a return of just 1%. It’s flat, and it’s skinny – Figure 1.
The current pivot on long bonds is to the positive – Figure 2.
Taken together, long bonds have started to outperform the equity market – Figure 3, top.
o This coincided with the yield curve topping out. It is now flattening once again – Figure 3, middle.
This coincided with oil exploring new space – Figure 3, bottom.
The deflationary trade continues this morning with copper breaking below $2.30.
o Not to mention, that the North American credit market (both IG, and HY) has turned unfriendly, and we don’t seeequities pricing this risk in yet.
Got bonds?
Figure 1: Trend on S&P 500 Figure 2: Trend on Long-Term Treasury ETF (TLT)
Figure 3: U.S. Stocks vs. Long Bonds; U.S. Yield Curve (30-5); Crude Oil (12m Continuation Series on WTI)
Source: All charts/tables BMO Capital Markets, Bloomberg, Thomson, Markit
33
Trends & Inflection Points August 17, 2015Research Comment Quantitative/Technical Research Website
Mark Steele (416) 359-4641 [email protected] Assoc: Tiberiu Stoichita/Jin Li
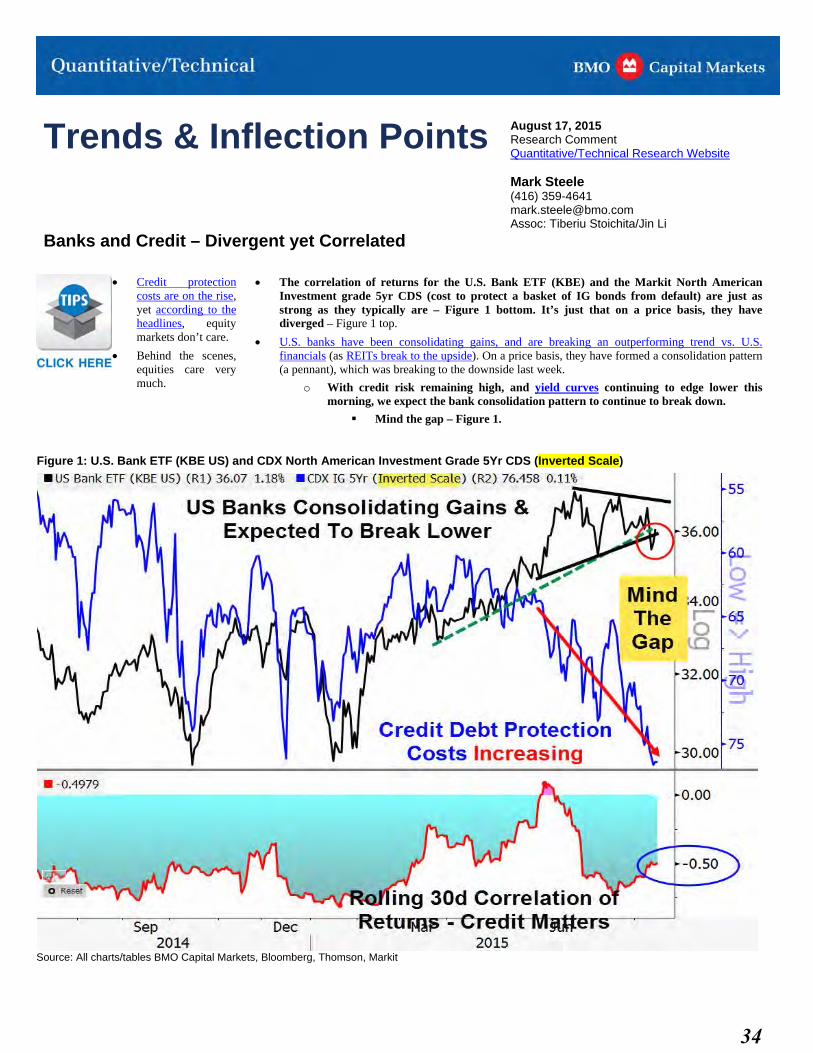
Banks and Credit – Divergent yet Correlated
Credit protectioncosts are on the rise,yet according to theheadlines, equitymarkets don’t care.
Behind the scenes,equities care verymuch.
The correlation of returns for the U.S. Bank ETF (KBE) and the Markit North AmericanInvestment grade 5yr CDS (cost to protect a basket of IG bonds from default) are just asstrong as they typically are – Figure 1 bottom. It’s just that on a price basis, they havediverged – Figure 1 top.
U.S. banks have been consolidating gains, and are breaking an outperforming trend vs. U.S.financials (as REITs break to the upside). On a price basis, they have formed a consolidation pattern(a pennant), which was breaking to the downside last week.
o With credit risk remaining high, and yield curves continuing to edge lower thismorning, we expect the bank consolidation pattern to continue to break down.
Mind the gap – Figure 1.
Figure 1: U.S. Bank ETF (KBE US) and CDX North American Investment Grade 5Yr CDS (Inverted Scale)
Source: All charts/tables BMO Capital Markets, Bloomberg, Thomson, Markit
34
Trends & Inflection Points August 14, 2015Research Comment Quantitative/Technical Research Website
Mark Steele (416) 359-4641 [email protected] Assoc: Tiberiu Stoichita/Jin Li
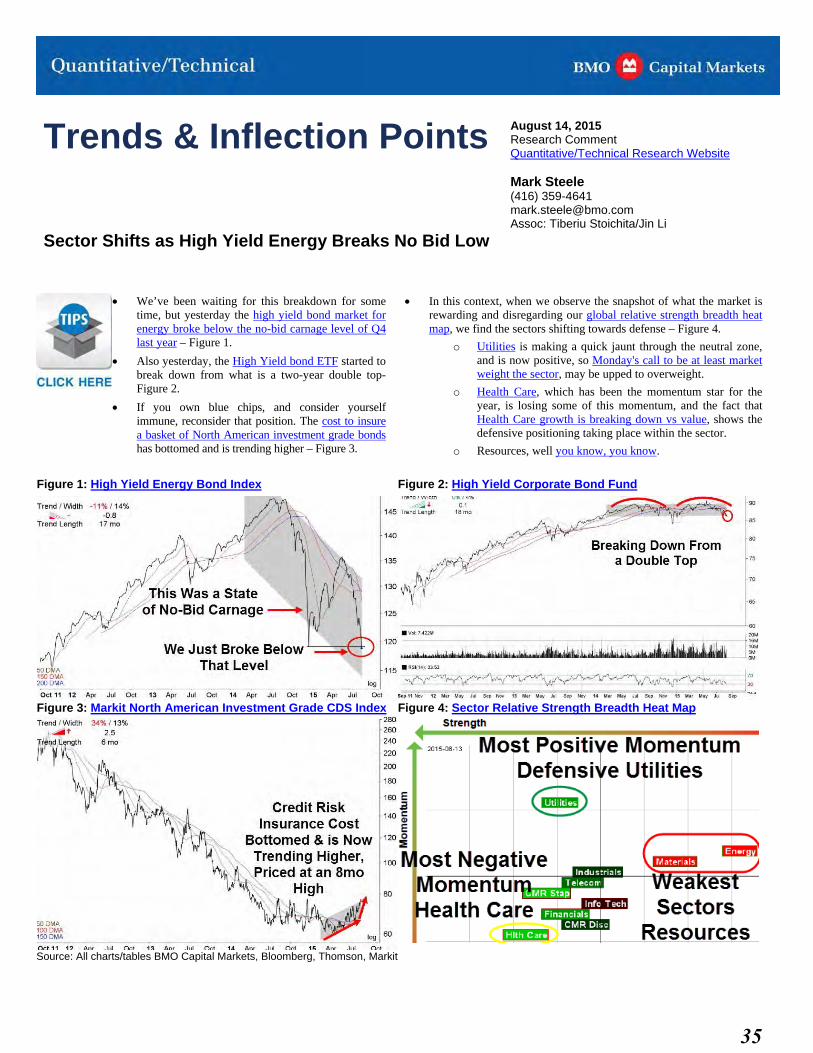
Sector Shifts as High Yield Energy Breaks No Bid Low CLICK HERE for a printer friendly version of this report including research disclosures.
We’ve been waiting for this breakdown for sometime, but yesterday the high yield bond market forenergy broke below the no-bid carnage level of Q4last year – Figure 1.
Also yesterday, the High Yield bond ETF started tobreak down from what is a two-year double top-Figure 2.
If you own blue chips, and consider yourselfimmune, reconsider that position. The cost to insurea basket of North American investment grade bondshas bottomed and is trending higher – Figure 3.
In this context, when we observe the snapshot of what the market isrewarding and disregarding our global relative strength breadth heatmap, we find the sectors shifting towards defense – Figure 4.
o Utilities is making a quick jaunt through the neutral zone,and is now positive, so Monday's call to be at least marketweight the sector, may be upped to overweight.
o Health Care, which has been the momentum star for theyear, is losing some of this momentum, and the fact thatHealth Care growth is breaking down vs value, shows thedefensive positioning taking place within the sector.
o Resources, well you know, you know.
Figure 1: High Yield Energy Bond Index Figure 2: High Yield Corporate Bond Fund
Figure 3: Markit North American Investment Grade CDS Index Figure 4: Sector Relative Strength Breadth Heat Map
Source: All charts/tables BMO Capital Markets, Bloomberg, Thomson, Markit
35
Trends & Inflection Points August 13, 2015Research Comment Quantitative/Technical Research Website
Mark Steele (416) 359-4641 [email protected] Assoc: Tiberiu Stoichita/Jin Li
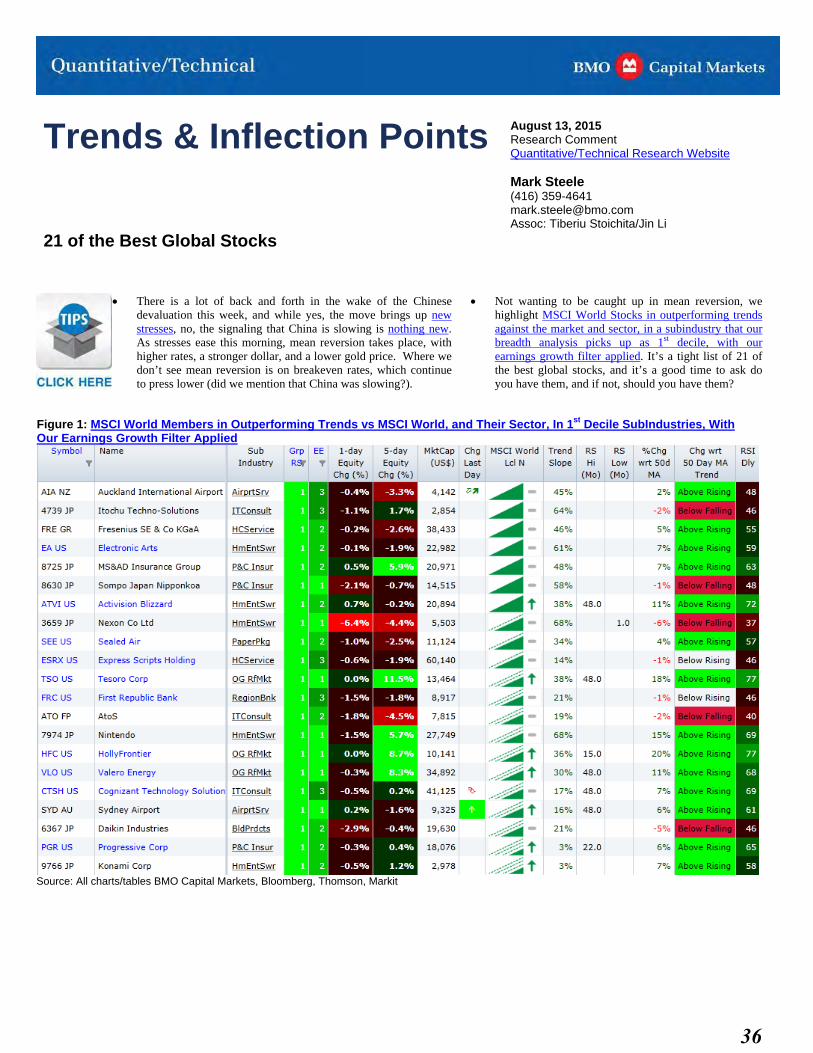
21 of the Best Global Stocks CLICK HERE for a printer friendly version of this report including research disclosures.
There is a lot of back and forth in the wake of the Chinesedevaluation this week, and while yes, the move brings up newstresses, no, the signaling that China is slowing is nothing new.As stresses ease this morning, mean reversion takes place, withhigher rates, a stronger dollar, and a lower gold price. Where wedon’t see mean reversion is on breakeven rates, which continueto press lower (did we mention that China was slowing?).
Not wanting to be caught up in mean reversion, wehighlight MSCI World Stocks in outperforming trendsagainst the market and sector, in a subindustry that ourbreadth analysis picks up as 1st decile, with ourearnings growth filter applied. It’s a tight list of 21 ofthe best global stocks, and it’s a good time to ask doyou have them, and if not, should you have them?
Figure 1: MSCI World Members in Outperforming Trends vs MSCI World, and Their Sector, In 1st Decile SubIndustries, With Our Earnings Growth Filter Applied
Source: All charts/tables BMO Capital Markets, Bloomberg, Thomson, Markit
36
Focal Points Investment & Trading Ideas
September 3, 2015 Research Comment Quantitative/Technical Research Website
Mark Steele (416) 359-4641 [email protected] Assoc: Tiberiu Stoichita/Jin Li
Not Enough Puff
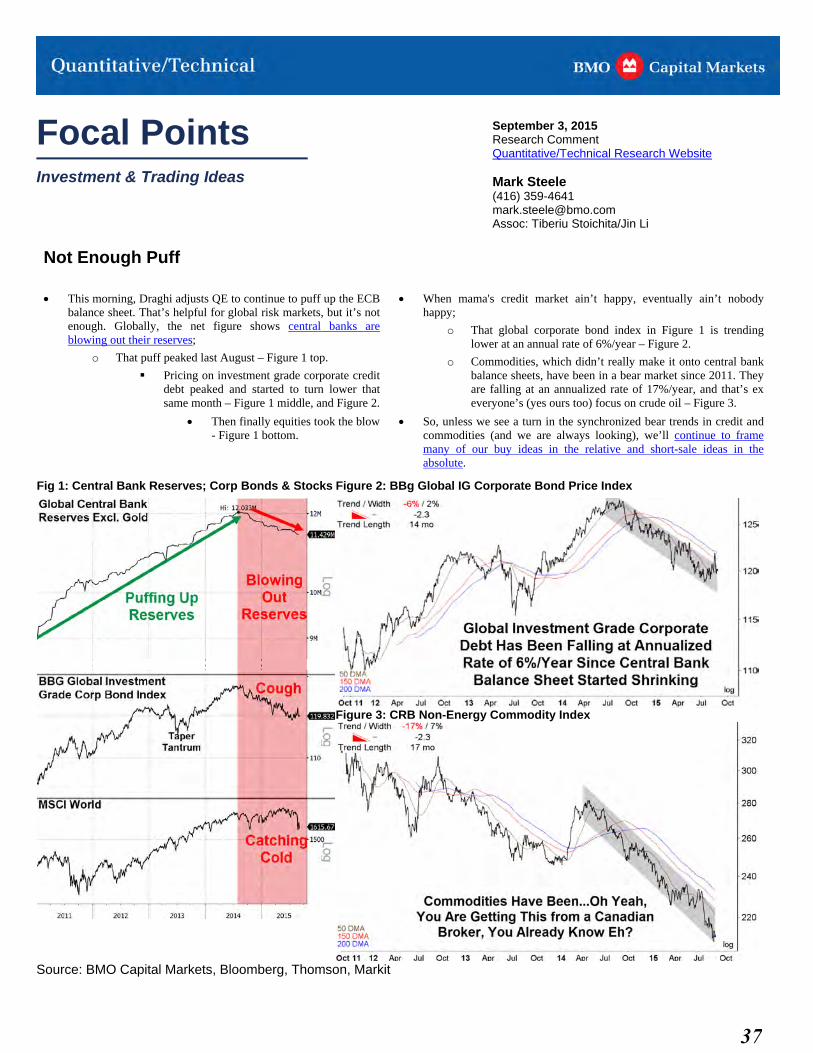
This morning, Draghi adjusts QE to continue to puff up the ECBbalance sheet. That’s helpful for global risk markets, but it’s notenough. Globally, the net figure shows central banks areblowing out their reserves;
o That puff peaked last August – Figure 1 top.
Pricing on investment grade corporate creditdebt peaked and started to turn lower thatsame month – Figure 1 middle, and Figure 2.
Then finally equities took the blow- Figure 1 bottom.
When mama's credit market ain’t happy, eventually ain’t nobodyhappy;
o That global corporate bond index in Figure 1 is trendinglower at an annual rate of 6%/year – Figure 2.
o Commodities, which didn’t really make it onto central bankbalance sheets, have been in a bear market since 2011. Theyare falling at an annualized rate of 17%/year, and that’s exeveryone’s (yes ours too) focus on crude oil – Figure 3.
So, unless we see a turn in the synchronized bear trends in credit andcommodities (and we are always looking), we’ll continue to framemany of our buy ideas in the relative and short-sale ideas in theabsolute.
Fig 1: Central Bank Reserves; Corp Bonds & Stocks Figure 2: BBg Global IG Corporate Bond Price Index
Figure 3: CRB Non-Energy Commodity Index
Source: BMO Capital Markets, Bloomberg, Thomson, Markit
37
Focal Points Investment & Trading Ideas
July 22, 2015 Research Comment Quantitative/Technical Research Website
Mark Steele (416) 359-4641 [email protected] Assoc: Tiberiu Stoichita/Jin Li
Best of Strong U.S. Dollar Stocks
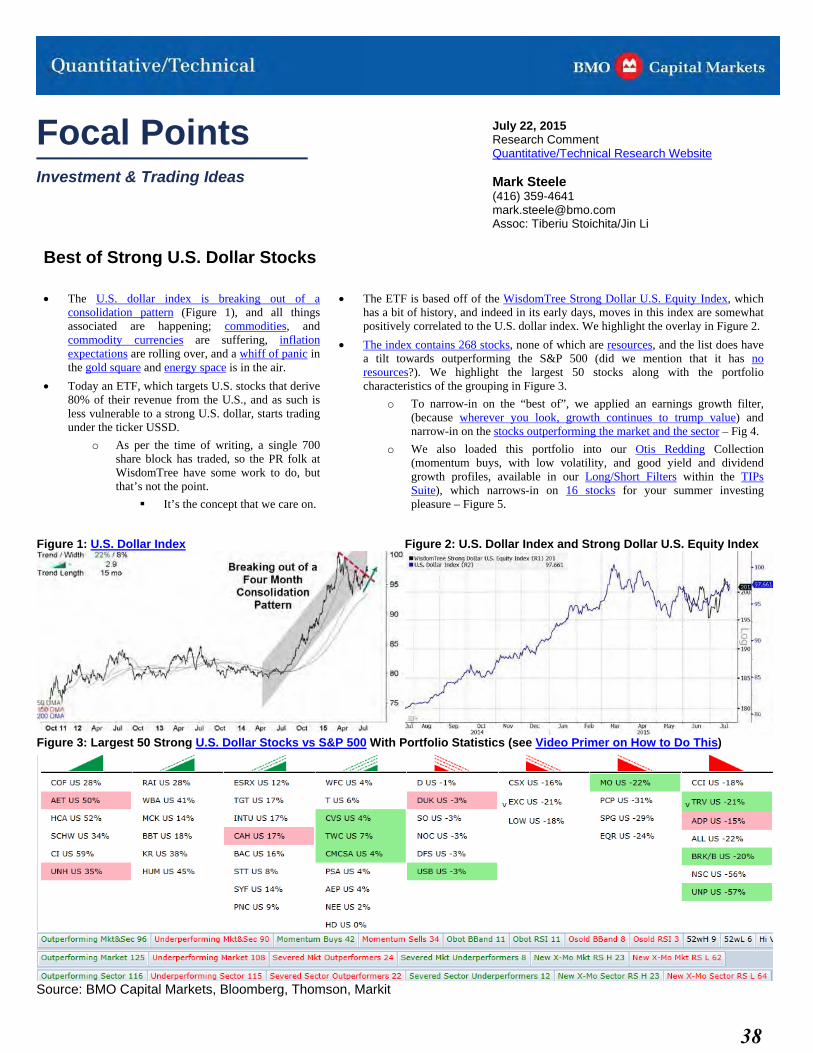
The U.S. dollar index is breaking out of aconsolidation pattern (Figure 1), and all thingsassociated are happening; commodities, andcommodity currencies are suffering, inflationexpectations are rolling over, and a whiff of panic inthe gold square and energy space is in the air.
Today an ETF, which targets U.S. stocks that derive80% of their revenue from the U.S., and as such isless vulnerable to a strong U.S. dollar, starts tradingunder the ticker USSD.
o As per the time of writing, a single 700share block has traded, so the PR folk atWisdomTree have some work to do, butthat’s not the point.
It’s the concept that we care on.
The ETF is based off of the WisdomTree Strong Dollar U.S. Equity Index, whichhas a bit of history, and indeed in its early days, moves in this index are somewhatpositively correlated to the U.S. dollar index. We highlight the overlay in Figure 2.
The index contains 268 stocks, none of which are resources, and the list does havea tilt towards outperforming the S&P 500 (did we mention that it has noresources?). We highlight the largest 50 stocks along with the portfoliocharacteristics of the grouping in Figure 3.
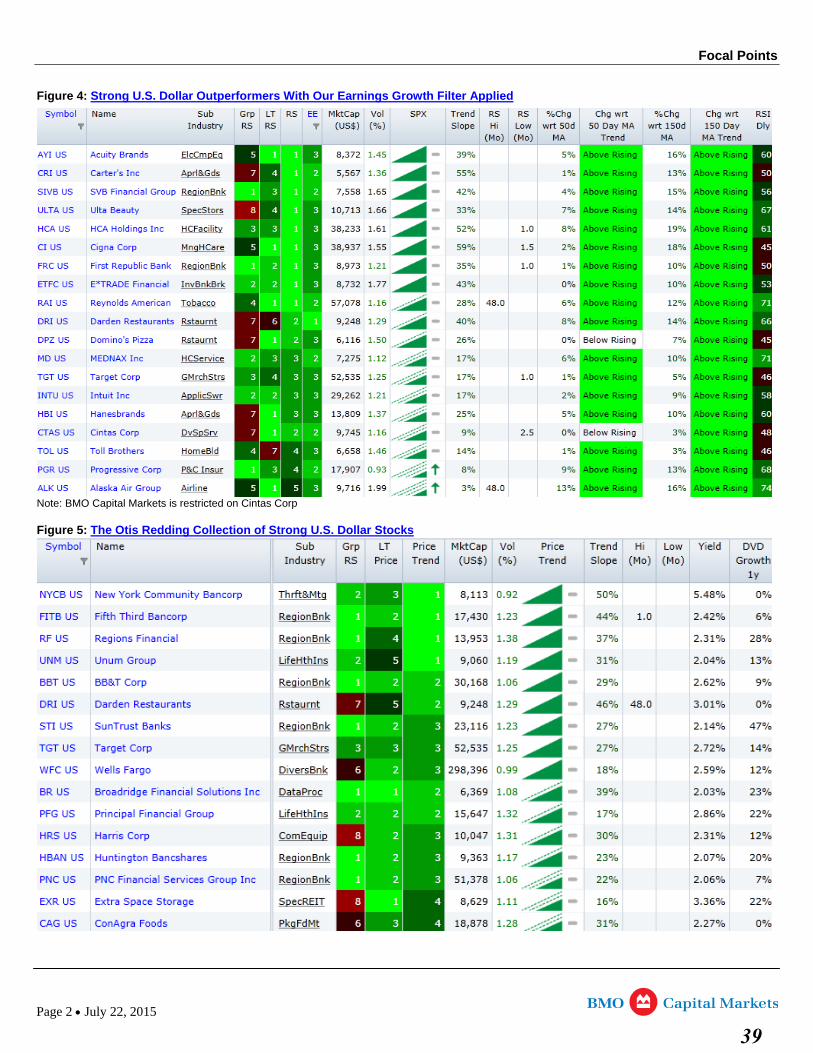
o To narrow-in on the “best of”, we applied an earnings growth filter,(because wherever you look, growth continues to trump value) andnarrow-in on the stocks outperforming the market and the sector – Fig 4.
o We also loaded this portfolio into our Otis Redding Collection(momentum buys, with low volatility, and good yield and dividendgrowth profiles, available in our Long/Short Filters within the TIPsSuite), which narrows-in on 16 stocks for your summer investingpleasure – Figure 5.
Figure 1: U.S. Dollar Index Figure 2: U.S. Dollar Index and Strong Dollar U.S. Equity Index
Figure 3: Largest 50 Strong U.S. Dollar Stocks vs S&P 500 With Portfolio Statistics (see Video Primer on How to Do This)
Source: BMO Capital Markets, Bloomberg, Thomson, Markit
38
http://research-ta.bmocapitalmarkets.com/rsfilterapp/Suite/03c47f65-2088-4db8-b3eb-d1d12000c31f.html
Focal Points
Figure 4: Strong U.S. Dollar Outperformers With Our Earnings Growth Filter Applied
Note: BMO Capital Markets is restricted on Cintas Corp Figure 5: The Otis Redding Collection of Strong U.S. Dollar Stocks
Page 2 July 22, 2015
39
BMO Capital Markets Disclosure Statements
Page 1 September 9, 2015
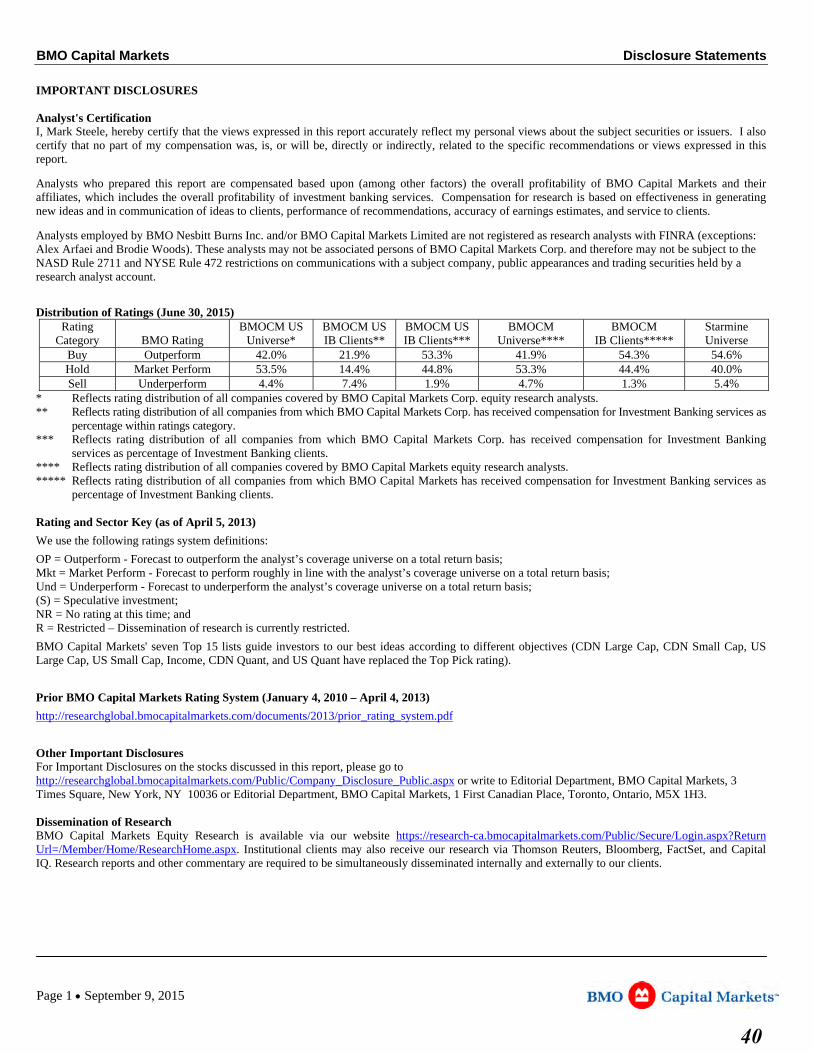
IMPORTANT DISCLOSURES Analyst's Certification I, Mark Steele, hereby certify that the views expressed in this report accurately reflect my personal views about the subject securities or issuers. I also certify that no part of my compensation was, is, or will be, directly or indirectly, related to the specific recommendations or views expressed in this report.
Analysts who prepared this report are compensated based upon (among other factors) the overall profitability of BMO Capital Markets and their affiliates, which includes the overall profitability of investment banking services. Compensation for research is based on effectiveness in generating new ideas and in communication of ideas to clients, performance of recommendations, accuracy of earnings estimates, and service to clients.
Analysts employed by BMO Nesbitt Burns Inc. and/or BMO Capital Markets Limited are not registered as research analysts with FINRA (exceptions: Alex Arfaei and Brodie Woods). These analysts may not be associated persons of BMO Capital Markets Corp. and therefore may not be subject to the NASD Rule 2711 and NYSE Rule 472 restrictions on communications with a subject company, public appearances and trading securities held by a research analyst account.
Distribution of Ratings (June 30, 2015) Rating
Category
BMO Rating BMOCM US
Universe* BMOCM USIB Clients**
BMOCM USIB Clients***
BMOCM Universe****
BMOCM IB Clients*****
Starmine Universe
Buy Outperform 42.0% 21.9% 53.3% 41.9% 54.3% 54.6% Hold Market Perform 53.5% 14.4% 44.8% 53.3% 44.4% 40.0% Sell Underperform 4.4% 7.4% 1.9% 4.7% 1.3% 5.4%
* Reflects rating distribution of all companies covered by BMO Capital Markets Corp. equity research analysts. ** Reflects rating distribution of all companies from which BMO Capital Markets Corp. has received compensation for Investment Banking services as
percentage within ratings category. *** Reflects rating distribution of all companies from which BMO Capital Markets Corp. has received compensation for Investment Banking
services as percentage of Investment Banking clients. **** Reflects rating distribution of all companies covered by BMO Capital Markets equity research analysts. ***** Reflects rating distribution of all companies from which BMO Capital Markets has received compensation for Investment Banking services as
percentage of Investment Banking clients. Rating and Sector Key (as of April 5, 2013)
We use the following ratings system definitions:
OP = Outperform - Forecast to outperform the analyst’s coverage universe on a total return basis; Mkt = Market Perform - Forecast to perform roughly in line with the analyst’s coverage universe on a total return basis; Und = Underperform - Forecast to underperform the analyst’s coverage universe on a total return basis; (S) = Speculative investment; NR = No rating at this time; and R = Restricted – Dissemination of research is currently restricted.
BMO Capital Markets' seven Top 15 lists guide investors to our best ideas according to different objectives (CDN Large Cap, CDN Small Cap, US Large Cap, US Small Cap, Income, CDN Quant, and US Quant have replaced the Top Pick rating).
Prior BMO Capital Markets Rating System (January 4, 2010 – April 4, 2013)
http://researchglobal.bmocapitalmarkets.com/documents/2013/prior_rating_system.pdf
Other Important Disclosures For Important Disclosures on the stocks discussed in this report, please go to http://researchglobal.bmocapitalmarkets.com/Public/Company_Disclosure_Public.aspx or write to Editorial Department, BMO Capital Markets, 3 Times Square, New York, NY 10036 or Editorial Department, BMO Capital Markets, 1 First Canadian Place, Toronto, Ontario, M5X 1H3. Dissemination of Research BMO Capital Markets Equity Research is available via our website https://research-ca.bmocapitalmarkets.com/Public/Secure/Login.aspx?Return Url=/Member/Home/ResearchHome.aspx. Institutional clients may also receive our research via Thomson Reuters, Bloomberg, FactSet, and Capital IQ. Research reports and other commentary are required to be simultaneously disseminated internally and externally to our clients.
40
Page 2 September 9, 2015
General Disclaimer “BMO Capital Markets” is a trade name used by the BMO Investment Banking Group, which includes the wholesale arm of Bank of Montreal and its subsidiaries BMO Nesbitt Burns Inc., BMO Capital Markets Limited in the U.K. and BMO Capital Markets Corp. in the U.S. BMO Nesbitt Burns Inc., BMO Capital Markets Limited and BMO Capital Markets Corp are affiliates. Bank of Montreal or its subsidiaries (“BMO Financial Group”) has lending arrangements with, or provide other remunerated services to, many issuers covered by BMO Capital Markets. The opinions, estimates and projections contained in this report are those of BMO Capital Markets as of the date of this report and are subject to change without notice. BMO Capital Markets endeavours to ensure that the contents have been compiled or derived from sources that we believe are reliable and contain information and opinions that are accurate and complete. However, BMO Capital Markets makes no representation or warranty, express or implied, in respect thereof, takes no responsibility for any errors and omissions contained herein and accepts no liability whatsoever for any loss arising from any use of, or reliance on, this report or its contents. Information may be available to BMO Capital Markets or its affiliates that is not reflected in this report. The information in this report is not intended to be used as the primary basis of investment decisions, and because of individual client objectives, should not be construed as advice designed to meet the particular investment needs of any investor. This material is for information purposes only and is not an offer to sell or the solicitation of an offer to buy any security. BMO Capital Markets or its affiliates will buy from or sell to customers the securities of issuers mentioned in this report on a principal basis. BMO Capital Markets or its affiliates, officers, directors or employees have a long or short position in many of the securities discussed herein, related securities or in options, futures or other derivative instruments based thereon. The reader should assume that BMO Capital Markets or its affiliates may have a conflict of interest and should not rely solely on this report in evaluating whether or not to buy or sell securities of issuers discussed herein.
Additional Matters To Canadian Residents: BMO Nesbitt Burns Inc. furnishes this report to Canadian residents and accepts responsibility for the contents herein subject to the terms set out above. Any Canadian person wishing to effect transactions in any of the securities included in this report should do so through BMO Nesbitt Burns Inc. The following applies if this research was prepared in whole or in part by David Round, Edward Sterck or Brendan Warn: This research is not prepared subject to Canadian disclosure requirements. This research is prepared by BMO Capital Markets Limited and subject to the regulations of the Financial Conduct Authority (FCA) in the United Kingdom. FCA regulations require that a firm providing research disclose its ownership interest in the issuer that is the subject of the research if it and its affiliates own 5% or more of the equity of the issuer. Canadian regulations require that a firm providing research disclose its ownership interest in the issuer that is the subject of the research if it and its affiliates own 1% or more of the equity of the issuer that is the subject of the research. Therefore BMO Capital Markets Limited will disclose its and its affiliates’ ownership interest in the subject issuer only if such ownership exceeds 5% of the equity of the issuer. To U.S. Residents: BMO Capital Markets Corp. furnishes this report to U.S. residents and accepts responsibility for the contents herein, except to the extent that it refers to securities of Bank of Montreal. Any U.S. person wishing to effect transactions in any security discussed herein should do so through BMO Capital Markets Corp. To U.K. Residents: In the UK this document is published by BMO Capital Markets Limited which is authorised and regulated by the Financial Conduct Authority. The contents hereof are intended solely for the use of, and may only be issued or passed on to, (I) persons who have professional experience in matters relating to investments falling within Article 19(5) of the Financial Services and Markets Act 2000 (Financial Promotion) Order 2005 (the “Order”) or (II) high net worth entities falling within Article 49(2)(a) to (d) of the Order (all such persons together referred to as “relevant persons”). The contents hereof are not intended for the use of and may not be issued or passed on to, retail clients. Unauthorized reproduction, distribution, transmission or publication without the prior written consent of BMO Capital Markets is strictly prohibited. Click here for data vendor disclosures when referenced within a BMO Capital Markets research document.
ADDITIONAL INFORMATION IS AVAILABLE UPON REQUEST BMO Financial Group (NYSE, TSX: BMO) is an integrated financial services provider offering a range of retail banking, wealth management, and investment and corporate banking products. BMO serves Canadian retail clients through BMO Bank of Montreal and BMO Nesbitt Burns. In the United States, personal and commercial banking clients are served by BMO Harris Bank N.A., Member FDIC. Investment and corporate banking services are provided in Canada and the US through BMO Capital Markets.
BMO Capital Markets is a trade name used by BMO Financial Group for the wholesale banking businesses of Bank of Montreal, BMO Harris Bank N.A, BMO Ireland Plc, and Bank of Montreal (China) Co. Ltd. and the institutional broker dealer businesses of BMO Capital Markets Corp. (Member SIPC), and BMO Capital Markets GKST Inc. (Member SIPC) in the U.S., BMO Nesbitt Burns Inc. (Member Canadian Investor Protection Fund) in Canada, Europe and Asia, BMO Capital Markets Limited in Europe and Australia and BMO Advisors Private Limited in India.
“Nesbitt Burns” is a registered trademark of BMO Nesbitt Burns Corporation Limited, used under license. “BMO Capital Markets” is a trademark of Bank of Montreal, used under license. "BMO (M-Bar roundel symbol)" is a registered trademark of Bank of Montreal, used under license
® Registered trademark of Bank of Montreal in the United States, Canada and elsewhere. TM Trademark Bank of Montreal
©COPYRIGHT 2015 BMO CAPITAL MARKETS CORP.
Financial GroupA member of BMO
41