September 26 2017 - Workforce Solutions for North … · September 26, 2017 9:30 a.m. – 1:00 p...
103
NORTH CENTRAL TEXAS WORKFORCE BOARD OF DIRECTORS MEETING September 26, 2017
Transcript of September 26 2017 - Workforce Solutions for North … · September 26, 2017 9:30 a.m. – 1:00 p...

NORTH CENTRAL TEXAS WORKFORCE
BOARD OF DIRECTORS
MEETING
September 26, 2017

North Central Texas Workforce Board of Directors Meeting Agenda
In accordance with the Americans with Disabilities Act, we invite all attendees to advise us of any special accommodations due to disability. The meeting place is accessible to persons with disabilities. If assistance is needed to participate, please call the office of the Workforce Solutions for North Central Texas at (817) 695-9184. Please submit your request as far as possible in advance of the meeting you wish to attend. Workforce Solutions for North Central Texas Board may discuss, deliberate, and take all appropriate action on any matter listed on this agenda and may convene into closed executive session in accordance with the Texas Open Meetings Act.
616 Six Flags Drive, Arlington, TX 76011 September 26, 2017 9:30 a.m. – 1:00 p.m.
Transportation Council Room
Call to Order – Roger Harris, Chair
1. Special Recognition and Introductions
Kathee Mills
Debbie Reyna
2. Declare Conflicts of Interest
3. Consent Items a. Approval of the Minutes from the July 25, 2017 Meeting b. Board Policy on On-the-Job Training (OJT) for Non-Custodial Parents
4. Committee Reports
a. Executive Committee – Roger Harris Discussion, Consideration, and Possible Action Regarding:
Subsequent Certification Approval
Review of Contract with NCTCOG
Executive Director Performance Review
b. Strategic Leadership and Business Development – Kenny Weldon Discussion, Consideration, and Possible Action Regarding:
BDU Business Intelligence Webinar – Brandi Harrison
CRM Update
SDF Update
Targeted Occupation List
c. Oversight and Accountability Committee – Carlton Tidwell Discussion, Consideration, and Possible Action Regarding:
Performance Update
Financial Update
FY 2018 Budget
Acceptance of Controls Matrix
d. Workforce Development Committee – Jason Gomez Discussion, Consideration, and Possible Action Regarding:
Presentation – Summer Earn and Learn Program

Workforce Board of Directors Meeting Agenda Page 2
5. Executive Director's Report
Report on Activities in Response to Hurricane Harvey
TWC Conference Reminder
LaserFiche
AEP Award
P3 Initiative 6. Announcement of Executive Session
As authorized by Section 551.071 to consult with the Board’s attorney for legal advice on any matter listed on the agenda, pending or contemplated litigation, settlement offers, or any matter in which the duty of the Board’s attorney to the Board under the Texas Disciplinary Rules of Professional Conduct of the State Bar of Texas clearly conflict with the provisions of Chapter 551 of the Texas Open Meetings Act. As authorized by Section 551.074 of the Texas Open Meetings Act the Board will convene in closed session to deliberate the appointment, employment, evaluation, reassignment, duties, discipline, or dismissal of a public officer or employee who has not requested a public hearing in lieu of the closed session.
7. Action as a Result of Executive Session 8. Other Business BREAK – Reconvene meeting in the Metroplex Conference Room for Board Development 9. Board Development – Carlton Schwab – Executive Director, Economic Development Council Adjourn

North Central Texas Workforce Board of Directors
1
Meeting Minutes 616 Six Flags Drive, Arlington, TX 76011
July 25, 2017 9:30 a.m. – 1:00 p.m.
Transportation Council Room
BOARD MEMBERS PRESENT:
Roger Harris, Chair Meera Ananthaswamy David Bristol, Vice Chair Gae Goodwin Mickey Hillock Chip Evans Aaron Thibault Lisa Huffaker John Rattan Elaine Zweig Brenda Kihl Roselyn Lane Mike Hinojosa Jason Gomez LaShanda Reed-Larry Rolanda Greer Lakeitria Luter Ada Lawniczak Jennifer Suguitan Kenny Weldon Ron Smitherman Carlton Tidwell
Catherine Tietjen
BOARD MEMBERS NOT PRESENT:
Scott McCune Tracey Kirsch Larry Barnett Emily Klement James Henderson Earl Woolbright David Pietruszynski Robert Hill Tony Mobly CHIEF ELECTED OFFICIALS PRESENT: None
Call to Order – Roger Harris, Chair Roger Harris called the meeting to order at 9:34 a.m. CDT.
1. Special Recognition and Introductions
Roger Harris recognized board member Elaine Zweig for fifteen years of service on the Workforce Board. David Setzer recognized staff member Debra Kosarek as a Quality Texas Foundation Fellow and her 25 years of service with them.
2. Special Presentation
EMSI – Workforce Analytics Althea Chaderton introduced Connie Sharp with EMSI, a workforce data analytics company. Connie Sharp gave a presentation on career

North Central Texas Workforce Board of Directors
2
exploration and labor market information tools. In response to a question from David Bristol regarding access, trial analysis data can be acquired through Workforce staff, Danielle Stellrecht or Althea Chaderton. Mickey Hillock asked about subscriptions for businesses. Kay O’Dell informed the Board that this information is also available through Workforce Development as a business service and through requests to Business Development staff, a Workforce Center, an email, or through a direct request on our dfwjobs.com website. Roger Harris asked about vacancies due to retirement. Connie Sharp demonstrated how the tool could benchmark retirement statistics in the region. Data is updated quarterly from the federal government. Connie Sharp stated that data is requested 49% from higher education, 35% from EDCs, and 16% from workforce boards including TWC.
3. Declare Conflicts of Interest
No conflict of interest declared.
4. Consent Items a. Approval of the Minutes of the May 23, 2017 Meeting b. Approval of Policy for Priority for Child Care Services c. Approval of Policy on Progress Toward Successful Completion of
Educational and Training Programs
Ron Smitherman moved to approve consent items. The motion was seconded by Roselyn Lane and approved unanimously.
5. Committee Reports
a. Executive Committee – Roger Harris Discussion, Consideration, and Possible Action Regarding:
Clarification Regarding Signatory Authority for Official Documents and Agreements Roger Harris announced the decision of the Executive Committee to authorize the Board Chair and/or designee to sign official financial documents such as Memorandums of Understanding (MOUs).
Participation of the Board on a State and National Level Roger Harris encouraged Board members to participate in state and national workforce board organizations and attend conferences. Attendance at this level gives insight into the larger scope of workforce boards. The next Texas Associations of Workforce Boards (TAWB) conference is next week in Houston, and the TWC Annual Conference is in November in Dallas. Kay O’Dell sends newsletters to the Board members and legislative announcements are distributed if they are related to the local board.

North Central Texas Workforce Board of Directors
3
If interested in attending any of the conferences, Board members are to contact Kay O’Dell.
Results of Texas Workforce Commission (TWC) Monitoring Visit Roger Harris announced that the staff was sent a TWC management letter and there were no findings during the monitoring review. Congratulations to all staff.
b. Strategic Leadership and Business Development – Kenny Weldon
Discussion, Consideration, and Possible Action Regarding:
Skills Development Fund Report Kenny Weldon reported there are seven million dollars in active grants with additional funding expected before the end of summer. The partnership with Collin College is a partner in obtaining program grants. Kent Andersen announced that he will attend the TWC two-day meeting on skills development changes and funding with Brandi Harrison this week.
Labor Market Information Report Kenny Weldon presented a report on the economic activity in the region. The report shows a rise in the number of employment opportunities in the home furnishing and residential building industries in the region.
Customer Relationship Management (CRM) Kenny Weldon reported that the CRM system is functioning and should be operational by the end of the year. Training is still in progress. CRM captures integrated data to provide metrics of activities and services. Business Development Liaisons (BDLs) will begin adding data this week.
Kenny Weldon commended the staff in regards to the communication and efforts to build relationships with local economic development councils.
c. Oversight and Accountability Committee – Carlton Tidwell
Discussion, Consideration, and Possible Action Regarding:
Firewall Project Carlton Tidwell clarified the WIOA requirement to establish internal controls to prevent conflict of interest and illustrate the flow of information. The work done regarding documenting these controls is called the “Firewall Project.” A grid was created to illustrate the internal control measures the Council of Governments (COG) practice and the checks and balances in place in the system. David Setzer reviewed the grid to explain how the Board is fulfilling established requirements of WIOA and providing full disclosure to the Board. Carvan Adkins stated that the grid might establish the

North Central Texas Workforce Board of Directors
4
standard for other workforce organizations and clarified how the project is fulfilling the requirements of WIOA.
Performance Report Michael Nicholas provided an update on performance measures. The workforce programs are over target, except the child care service measure. Contract workers are currently in case management training which may improve data integrity and performance before the end of the performance year.
d. Workforce Development Committee – Jason Gomez
Discussion, Consideration, and Possible Action Regarding:
Adult Education and Literacy (AEL) Update Mary Ford announced the AEL Workforce Partnership session was on May 4, 2017. The work session is part of the regional coalition efforts for AEL and Vocational Rehabilitation Services (VRS) and held at the Denton ISD Professional Development Center. Six guest speakers presented on various topics regarding services to the customers. Presentations were informative and followed by table topics. Table topics were conducted in small groups to discuss local strategic plans for further integration efforts. Participants were from various schools, colleges, Denton County Economic Development Center, AEL representatives, VRS counselors and regional managers, TWC staff, and other workforce service program staff. All participants received a final report afterwards. Chip Evans acknowledged that plans for smaller service area meetings will be initiated. David Setzer informed the Board that the AEL efforts were submitted to TWC for an annual award.
Vocational Rehabilitation (VR) Integration Update Dana Buckholt announced that the VR Services integration into the workforce centers is completed. The Waxahachie Center reopened June 1st. The Corsicana Center completed on June 7th. There are no additional locations identified at this time to be integrated.
Summer Earn and Learn (SEAL) Update Dana Buckholt reported an update on the status of the VR Summer Earn and Learn initiative. The program provides VR eligible students, 14-22 years of age an opportunity to gain work experience and engage in career discovery during the summer. Out of 270 referrals, there are 138 participants enrolled with 20 students awaiting to start. Some participating employers include CVS, Wendy’s, TJ Maxx, public libraries, and Chambers of Commerce. The initiative will end in August. Lois Rogers informed

North Central Texas Workforce Board of Directors
5
the Board that non-participant referrals were due to other summer activities and interests.
Integration with VR Services David Setzer announced the plans to integrate VR Services to the COG location and will provide future updates regarding progress.
Careers in Texas Donna Weston announced the Careers in Texas Exploration Week for young adults scheduled for September 25th thru the 29th. The Careers in Texas Industry week will focus on career activities in the region and the exploration for high-demand occupations. The emphasis is to introduce youth to career learning opportunities like internships, career pathways, etc., engage the youth with employers, and showcase various tools available to them. A TWC website will provide information about site locations. Promotional materials are currently in design. WSNCT will host an event on September 29th from 9 a.m. to 3 p.m. at Navarro College in Waxahachie, Texas. We will forward additional information to Board members as it becomes available. Dana Buckholt informed the Board that the staff allocated $40,000 to cover expenditures and food.
6. Officer Elections
Presentation of Proposed Slate of Officers (2018 -2020) – Elaine Zweig Elaine Zweig announced the nomination slate of Board officers: Roger Harris as Chair, David Bristol as Vice Chair, and Roselyn Lane as Secretary. No nominations were received from the floor.
Election of Officers Ron Smitherman moved to elect the proposed slate of officers. Meera Ananthaswamy seconded the motion. The slate of officers was elected unanimously.
7. Executive Director's Report
International Economic Development Council (IEDC) Report Kay O’Dell reported on the IEDC conference in Little Rock, Arkansas. Kay O’Dell presented information regarding the increase in career opportunities for the home health care industry. Workshops included sector strategies, the economic impact of agri-business, and how to address the issue of trailing spouses during corporate headquarter relocations.
Texas Economic Development Council (TEDC) Conference Report David Setzer informed the Board of potential partnerships with businesses and potential Board members. Kent Andersen organized a workforce

North Central Texas Workforce Board of Directors
6
panel for the conference on the High Demand Job Training grant process. The TEDC Annual conference is scheduled for San Antonio in the fall.
Amazon David Setzer and Brandi Harrison attended a career event at Amazon near the Alliance Corridor. Amazon has a program called Career Choice to encourage employees to continue their education and offer training and skills development. Gae Goodwin clarified that Amazon’s Career Choice program is designed to maximize employee engagement by offering training and enforcing a positive community relationship. Brandi Harrison gave positive feedback on the event.
Laserfiche Michael Nicholas presented an update on the Laserfiche project. The project is in the document development phase until September 15th. Laserfiche staff are working with child care employees to develop training materials. User training is scheduled October 9-27. The “go live” date is November 9.
Work in Texas (WIT) David Setzer is part of a state advisory committee to review the five-year-old WIT program (labor exchange tool for the state). The committee reviewed various products to replace the WIT system. Recommendations were made to TWC and a request for proposal (RFP) issued. Responses are due August 2nd. The WIT system is scheduled for replacement on June 19, 2018.
Child Care Performance Report The June preliminary performance measures report shows child care enrollment is low. Jill Brown reported a large number of children dropped from enrollment due to parent relocations and other reasons, including vacations. Child care centers are working overtime to increase enrollments. Also, three child care centers left the certification system due to change of ownership. In August 2016, the state ceased enrollment, and when this change occurred, it lowered the performance measure. She anticipates enrollment targets to be met by September. David Setzer mentioned that Laserfiche would assist in tracking enrollments efficiently.
Introduction of Michael Britt Kay O’Dell introduced Michael Britt as the speaker for the Lunch and Learn session. Michael Britt is the TWC Director of Governmental Relations and will present a report on the Texas Legislative Session.

North Central Texas Workforce Board of Directors
7
8. Announcement of Executive Session No action taken.
9. Action as a Result of Executive Session No action taken. 10. Other Business
Roger Harris polled the Board regarding a new start time for Board meetings from 9:30 a.m. to 10:00 a.m. Elaine Zweig proposed keeping the same time due to increased traffic and length of meetings. Mickey Hillock expressed concern for the loss of members for lunch and Board development session. The Board meeting time will remain at 9:30 a.m. David Setzer announced the TEDC Award of Excellence to Workforce Solutions for North Central Texas.
BREAK – Reconvene meeting in the Metroplex Conference Room for Board Development The board recessed at 11:53 a.m. and reconvened in the Metroplex conference room at 12:07 p.m. 11. Board Development – Report from Legislative Session – Michael Britt, Director,
Governmental Relations with the Texas Workforce Commission. Adjourn
The meeting adjourned at 12:47 p.m. CDT.

On-the-Job Training (OJT) for Non-Custodial Parents
Background
On-the-Job-Training (OJT) is training provided by an employer to a paid participant, while engaged in productive work in a job made available through a program that provides reimbursement to the employer, of up to 50 percent of the wage rate of the participant, for the extraordinary costs of providing the training and additional supervision related to the training.
OJT is an allowable service for customers of the following programs: Non-Custodial Parents Choices, Trade Adjustment Assistance, Temporary Assistance to Needy Families/Choices and the Workforce Investment and Opportunity Act (WIOA).
The WIOA and the Texas Workforce Commission (TWC) have given the Board the local flexibility to increase the OJT reimbursement to employers to an amount up to 75% of the wage rate when certain factors apply.
Information:
Workforce Solutions for North Central Texas will provide an OJT reimbursement rate of 75% of the participant’s wage rate when any of the following factors apply:
• Training provided is for an in-demand occupation; or
• Training leads to an industry recognized credential; or
• OJT participants with any of the following characteristics, as defined in WIOA § 3;o Individuals with disabilities, including youth with disabilities;o Older individuals;o Ex-offenders;o Homeless individuals (as defined in section 41403(6) of the Violence
Against Women Act of 1994 (42 U.S.C. 14043e–2(6))), or homelesschildren and youths (as defined in section 725(2) of the McKinney-VentoHomeless Assistance Act (42 U.S.C. 11434a(2)));
o Youth who are in, or have aged out of, the foster care system;o Individuals who are English language learners;o Veterans; oro Long-term unemployed individuals.
Recommendation:
It is recommended the Workforce Board of Directors approve the On-the-Job Training Policy.
Effective: October 1, 2017
Attachment: Proposed Board Policy on On-the-Job Training for Non-Custodial Parents Choices, Trade Adjustment Assistance, Temporary Assistance for Needy Families/Choices, Workforce Investment Opportunity Act Adult, Dislocated Worker and Young Adult Customers.

Vision: The recognized leader in building tomorrow’s workforce.
Mission: To advance business-driven talent development strategies that promote economic growth, opportunity, and a quality workplace.
Values: Respect | Integrity | Collaboration | Excellence
1
600 Six Flags Drive, Centerpoint Three
P.O. Box 5888 | Arlington, Texas 76005-5888
Phone: 817-695-9184 | Fax: 817-640-6480
E-mail: [email protected] In Partnership with North Central Texas Council of Governments
Board Policy Issuance
Policy Name: Description: On-the-Job Training for Non-Custodial Parents Choices, Trade Adjustment Assistance, Temporary Assistance for Needy Families/Choices, Workforce Investment Opportunity Act Adult, Dislocated Worker and Young Adult Customers
Guidance on administering On-the-Job Training services to program-eligible participants and employers
Date of Approval: Revision History: Previous Policy Numbers: CE-A01-06-03, CE-
Y01-06-03, CE-TAA15-06-01, and CE-WR 13-02-01
Effective Date: Scheduled for Review:
Policy Topic: Administering Department: Multiple Program Operations
DEFINITIONS: Long-term unemployed individuals: unemployed individuals who have been looking for work for 27 weeks or more. Non-Custodial Parent (NCP): an individual without primary care or custody of his or her child and is required to pay child support; also known as the obligor. On-the-Job-Training (OJT): training by an employer provided to a paid participant while engaged in productive work in a job that:
• provides knowledge or skills essential to the full and adequate performance of the job;
• is made available through a program that provides reimbursement to the employer of up to 50% of the wage rate of the participant, except as provided in the policy below, for the extraordinary costs of providing the training and additional supervision related to the training; and
• is limited in duration as appropriate to the occupation for which the participant is being trained, taking into account the content of the training, the prior work experience of the participant, and the service strategy of the participant, as appropriate.
POLICY NUMBER:

Vision: The recognized leader in building tomorrow’s workforce.
Mission: To advance business-driven talent development strategies that promote economic growth, opportunity, and a quality
workplace.
Values: Respect | Integrity | Collaboration | Excellence
2
POLICY STATEMENT: Workforce Solutions for North Central Texas (WSNCT) provides OJT services to assist NCP
Choices, Trade Adjustment Assistance (TAA), Temporary Assistance for Needy Families
(TANF)/Choices and Workforce Investment and Opportunity Act (WIOA) program participants
with job retention, wage gains and career progression. WSNCT provides employers with a 50%
reimbursement of the participant’s wage rate for the extraordinary costs of the training and
additional supervision related to the training. In instances where any of the following factors
apply and can be fully documented, WSNCT provides a 75% reimbursement of the participant’s
wage rate:
• Training provided is for an in-demand occupation; or
• Training leads to an industry recognized credential; or
• OJT participants with any of the following characteristics, as defined in WIOA § 3; o Individuals with disabilities, including youth with disabilities;
o Older individuals;
o Ex-offenders;
o Homeless individuals (as defined in section 41403(6) of the Violence Against
Women Act of 1994 (42 U.S.C. 14043e–2(6))), or homeless children and youths
(as defined in section 725(2) of the McKinney-Vento Homeless Assistance Act
(42 U.S.C. 11434a(2)));
o Youth who are in, or have aged out of, the foster care system;
o Individuals who are English language learners;
o Veterans; or
o Long-term unemployed individuals.
ACTIONS REQUIRED: Program guidelines stipulate specific information is captured on the program eligible participant
and the participating employer in order to document the customer’s progress during the
administration of these services; and for the reliable reporting of performance outcomes. The
Board’s Standard Operating Procedure articulates said requirements.
Workforce Center Contractor Management must establish internal processes for adherence to
and compliance with this policy and accompanying SOP.
RELATED POLICIES/RESOURCES: Board Standard Operating Procedure, On-the-Job Training (OJT) Procedure for Non-Custodial
Parents/Choices (NCP Choices), Trade Adjustment Assistance (TAA), Temporary Assistance for Needy Families/Choices (TANF/Choices), Workforce Innovation and Opportunity Act (WIOA) Adult, Dislocated Worker and Young Adult Customers.
Texas Workforce Commission, Choices Guide. Texas Workforce Commission, Noncustodial Parent Choices: A Comprehensive Guide. Texas Workforce Commission, Trade Adjustment Assistance Guide. Texas Workforce Commission, WD Letter 08-13: “Implementation of Amended Chapter 811,
Choices Rules.”

Vision: The recognized leader in building tomorrow’s workforce.
Mission: To advance business-driven talent development strategies that promote economic growth, opportunity, and a quality
workplace.
Values: Respect | Integrity | Collaboration | Excellence
3
Texas Workforce Commission, Workforce Innovation and Opportunity Act: Guidelines for Adults, Dislocated Workers and Youth. INQUIRIES: Please contact [email protected] _________________________________ ___________________________________ Approved by Reviewed by Roger Harris Board Chair Workforce Solutions for North Central Texas
Debra Kosarek Sr. Program Manager, Compliance and Continuous Improvement

North Central Texas WDA
Skills Development Fund Grant Activity
College Name County Workforce Center Business Partner(s) Contract Start Date Contract End Date Grant Award New Hire TraineesExisting
TraineesProject Status
Collin CC Collin PlanoJack Henry & Associates;
Emerson9/1/2016 9/30/2017 $444,470 32 161 Active Contract
Collin PlanoAdv. Fixtures; Carlisle
Coatings; Kone7/1/2016 9/30/2017 $557,417 58 260 Active Contract
Collin PlanoQuest Medical; Blount Fine
Foods1/17/2017 1/31/2018 $238,226 130 131 Active Contract
Collin Plano/McKinney
Air Liquide America LLC;
Lennox Industries; TYG
Products, LP; UNICOM
Engineering
7/19/2017 7/31/2018 $510,246 17 210 Active Contract
Collin PlanoAssaAbloy Hospitality; HNTB
Corporation- - $294,190 82 142 Pending Submission
Navarro College Ellis Waxahachie Owens Corning 12/10/2016 12/31/2018 $494,581 0 278 Active Contract
North Central Texas College Denton DentonLone Star CNC, Flowers
Bakery2/22/2016 9/30/2017 $515,124
76 175 Active Contract
Denton Denton
Team Fishel; Bowie
Industries; MFG; Empire
Countertops; Tri-Tex
Cabinets
7/5/2016 2/28/2018 $718,674
92 422 Active Contract
Denton, Cooke Denton Novolex 5/25/2017 5/31/2018 $298,225 15 116 Active Contract
Denton Denton Jostens - - $574,586 103 301 Submitted- In Evaluation
Denton Denton Peterbilt - - - - - In Development
Ranger College Erath Stephenville Fibergrate; Schreiber Foods - - $766,984 52 330 Awarded-Pending Contract
$5,224,139
$868,776
College Name County Workforce Center Business Partner(s) Contract Start Date Contract End Date Project Status College Contact
DCCCD Johnson CleburneTexas Health Harris
Methodist Hospital HCI8/29/2014 8/31/2015 Contract Complete El Centro College
DCCCD Erath StephenvilleTexas Health Harris
Methodist Hospital HCI8/29/2014 8/31/2015 Contract Complete El Centro College
DCCCD Kaufman TerrellTexas Health Presbyterian
Hospital HCI8/29/2014 8/31/2015 Contract Complete El Centro College
DCCCD Denton DentonDenton Regional Medical
Center HCI8/29/2014 8/31/2015 Contract Complete El Centro College
DCCCD Denton DentonMedical Center of Lewisville
HCI8/29/2014 8/31/2015 Contract Complete El Centro College
DCCCD Denton DentonTexas health Presbyterian
Hospital HCI8/29/2014 8/31/2015 Contract Complete El Centro College
DCCCD Collin McKinneyMedical Center of McKinney
HCI8/29/2014 8/31/2015 Contract Complete El Centro College
DCCCD Collin PlanoMedical Center of Plano HCI
8/29/2014 8/31/2015 Contract Complete El Centro College
DCCCD Collin PlanoTexas Health Presbyterian
Hospital HCI8/29/2014 8/31/2015 Contract Complete El Centro College
DCCCD Collin PlanoTexas Health Presbyterian
Hospital HCI8/29/2014 8/31/2015 Contract Complete El Centro College
Active SDF Contracts and Projects in Development
Total Dollars in Active Contracts
North Central Texas Businesses in Other SDF Grants
Total Dollars Pending Award

North Central Texas WDA
Skills Development Fund Grant Activity
Prospective SDF Business Partners
College Name County Workforce Center Business Partner(s) Est. Grant RequestEst. Number of
TraineesProject Status College Contact
Collin College Rockwall RockwallSpecial Products
Manufacturing- TBD Prospecting
Navarro College Ellis WaxahachieAsh Grove Cement Company -
TBD ProspectingPrady Mahale
Ellis Ennis Sterilite - TBD Prospecting Prady Mahale
North Central Texas College Denton Denton United Copper - TBD Prospecting Prady Mahale
Denton Alliance Farmer Brothers TBD Prospecting Prady Mahale
Paris Junior College Hunt Greenville FSTI - TBD Prospecting Diane Mosley
Hunt Greenville Total Equipment - TBD Prospecting Diane Mosley
-
Completed SDF Contracts
College Name County Workforce Center Business Partner(s) Contract Start Date Contract End Date Grant Award New Hire TraineesExisting
TraineesCollin College Collin Plano Cheap Carribean 8/30/2013 8/31/2014 $63,492 3 31
Collin Plano
Natural Polymer, Advantage
Machine, & Network
Engines, Inc.
4/15/2012 5/31/2013 $192,859 22 94
Collin Plano
Rapid Tooling, All Axis
Machining, RF Precision,
Applied Concepts
8/1/2013 1/31/2015 $176,758 10 129
Collin Plano
AVT Graphics Microsystems
(Amended into Cheap
Carribean contract)
7/28/2014 4/30/2015 $96,184 3 71
Collin PlanoMoneygram Payment
Systems, Inc., Capital One11/15/2014 11/30/2015 $350,136 131 181
Hill College Johnson Cleburne KWS Manufacturing 8/29/2014 11/30/2015 $176,517 0 124
Johnson Cleburne Sabre 8/26/2015 4/30/2017 $348,420 110 273
Navarro College Ellis EnnisAdvanced Drainage Systems,
Inc.7/13/2012 8/31/2013 $31,430 0 26
Ellis Waxahachie Certainteed 2/15/2013 4/30/2015 $39,750 0 39
Ellis Waxahachie Polyguard - 4/30/2015 $13,559 0 50
Ellis WaxahachieOwens Corning, ASMO
Manufacturing7/31/2014 7/30/2015 $283,273
0 202
Ellis Waxahachie James Hardie - - $88,733 0 58
Navarro Corsicana PACTIV 7/31/2013 1/31/2015 $680,192 245 0

North Central Texas WDA
Skills Development Fund Grant Activity
North Central Texas College Denton Denton GE Manufacturing Solutions 3/1/2012 3/31/2013 $744,845 250 0
Denton Denton GE Manufacturing Solutions 9/16/2013 9/30/2014 $444,321 145 0
Denton DentonGE Manufacturing Solutions
(amendment)5/15/2014 12/31/2015 $117,156
210 15
Denton Denton United Copper 6/15/2013 12/31/2014 $85,199 19 43
Cooke Cooke Zodiac Seats 8/12/2013 12/1/2014 $209,090 0 114
Denton Denton Victor Technologies 6/18/2014 4/30/2015 $118,675 40 257
Cooke Cooke Keystone Automotive 6/18/2014 4/30/2015 $29,260 32 0
Denton Denton Llano Logistics 6/18/2014 4/30/2015 $26,641 2 18
Paris Junior College Hunt Greenville
Atrium Co., C & H, Cytec,
Masonite, QMF, and
Rubbermaid
5/1/2012 5/31/2013 $542,642 0 429
Hunt Greenville QMF Steel 4/1/2016 3/31/2017 $41,399 5 18
Ranger College (Stephenville) Erath Stephenville Fibergrate Industries 5/1/2012 5/31/2013 $115,919 24 67
Erath Stephenville FMC Technologies 7/15/2012 1/15/2014 $1,087,613 177 263
Erath Stephenville Pal-Con, Schreiber Foods 8/15/2013 8/30/2014 $253,081 35 316
Erath Stephenville FMC, St. Gobain 4/24/2016 7/31/2017 $991,705 77 711
Weatherford College
Palo Pinto Weatherford PECO Facet 8/31/2013 4/30/2014 $476,076 51 241
Palo Pinto Weatherford Peco Facet - - $613,936 61 292
TSTC-Red Oak Ellis Waxahachie
BetaFence; Ennis Extruded;
Sherwin-Williams; Cardinal
CG; Cardinal IG; Kinro
8/1/2016 8/31/2017
$556,869 53 190
Ellis Waxahachie Chapparal Steel 5/20/2016 5/31/2017 $431,012 21 168
$8,989,589
Skills Development Fund Grant Incentive Payments Awarded
SDF Incentive Funds for North Central Texas WDA
College Name Incentive Dollars Awarded
Collin College Capital One, Moneygram $5,000
Hill College $5,000
Navarro College Owens Corning, ASMO Manufacturing $5,000
Weatherford College $5,000
Navarro College James Hardie Building Products $5,000
Collin College Jack Henry & Associates $5,000
Ranger College FMC Technologies/St. Gobain Abrasives $5,000
North Central Texas College Flowers Bakery/Lone Star CNC $5,000
Paris Jr. College $5,000
North Central Texas College Mayday-HiTech Consortium $5,000
TSTC-Red Oak Campus Manufacturing Consortium (5) $5,000
Collin College Manufacturing Consortium (3) $5,000
Collin College Blount Fine Foods; Quest Medical $5,000
North Central Texas College $5,000
Collin College $5,000
Ranger College Fibergrate/Schreiber Foods $5,000
Total Incentive Dollars Earned $80,000
Supply Chain Consortium
KWS Manufacturing
PECO Facet
Novolex
Business Partners
QMF Steel
Total Dollars Awarded in Completed SDF Contracts since FY12

Total
Change
over the
Last 5
Years
SOC Title Empl
Median
Hourly
Wage
Location
Quotient Unempl
Unempl
Rate Empl WSNCT Texas USA
Current
Online
Job Ads2
Total Repl
Demand
Total
Growth
Demand
Avg.
Annual
Growth
Percent
SAMPLE TARGETED OCCUPATION x x x x x x x x x x x x x
Carreer Pathway to Targeted Occupation x x x x x x x x x x x x x
Carreer Pathway to Targeted Occupation x x x x x x x x x x x x x
11-1021 General and Operations Managers 13,682 $53.78 0.91 414 2.1% 2,657 4.4% 2.7% 2.0% 340 4,051 3,666 2.4%
13-1111 Management Analysts 5,001 $41.64 0.93 256 3.6% 902 4.1% 3.5% 2.0% 1,032 1,053 1,996 3.4%
11-3031 Financial Managers 2,861 $60.99 0.74 106 2.5% 513 4.0% 2.6% 1.5% 506 816 771 2.4%
13-2052 Personal Financial Advisors 1,594 $44.93 0.93 34 1.2% 139 1.8% 2.9% 1.3% 95 638 887 4.5%
13-2051 Financial Analysts 1,925 $38.00 0.95 72 2.3% 411 4.9% 3.4% 1.8% 342 478 580 2.7%
13-2041 Credit Analysts 762 $36.85 1.51 20 1.8% 199 6.2% 2.6% 1.3% 30 407 219 2.6%
13-2011 Accountants and Auditors 8,725 $33.96 0.96 364 2.6% 1,518 3.9% 2.9% 1.8% 514 2,864 2,730 2.8%
13-1041 Compliance Officers 1,358 $33.73 0.75 23 1.1% 237 3.9% 1.6% 1.2% 43 232 370 2.4%
13-2072 Loan Officers 2,981 $31.33 1.45 110 2.6% 492 3.7% 1.0% 1.2% 152 579 897 2.7%
13-1023
Purchasing Agents, Except Wholesale, Retail, and
Farm Products 1,924 $30.10 0.95 102 3.6% 300 3.5% 1.3% 1.2% 94 595 350 1.7%
13-1051 Cost Estimators 1,545 $29.94 1.05 71 3.3% 428 6.7% 3.5% 3.1% 44 481 427 2.5%
43-4131 Loan Interviewers and Clerks 2,983 $21.06 1.98 166 4.0% 444 3.3% 1.1% 1.5% 104 562 905 2.7%
43-3031 Bookkeeping, Accounting, and Auditing Clerks 11,546 $18.43 1.01 434 2.7% 2,169 4.3% 2.6% 1.8% 536 1,141 826 0.7%
43-3021 Billing and Posting Clerks 3,284 $16.89 0.97 145 3.0% 736 5.2% 3.0% 2.1% 112 765 1,124 3.0%
11-3021 Computer and Information Systems Managers 2,486 $69.27 1.00 92 2.6% 560 5.2% 3.7% 2.5% 185 358 981 3.4%
15-1143 Computer Network Architects 1,393 $52.38 1.24 18 0.9% 297 4.9% 3.3% 2.2% 71 201 434 2.8%
15-1133 Software Developers, Systems Software 3,910 $50.87 1.31 100 1.8% 874 5.2% 3.4% 2.5% 41 593 1,290 2.9%
15-1132 Software Developers, Applications 7,331 $50.68 1.29 187 1.8% 1,844 6.0% 4.5% 3.5% 1,555 1,386 3,143 3.6%
15-1199* Computer Occupations, All Other 1,627 $44.31 0.89 73 3.0% 339 4.8% 2.5% 1.7% 2,019 284 513 2.8%
15-1122 Information Security Analysts 938 $43.33 1.36 29 2.1% 230 5.8% 3.5% 2.4% 657 140 407 3.7%
15-1141 Database Administrators 1,029 $42.92 1.27 34 2.3% 192 4.2% 3.0% 2.1% 298 252 354 3.0%
15-1121 Computer Systems Analysts 6,039 $41.97 1.49 257 3.0% 1,447 5.6% 3.9% 2.6% 217 985 2,775 3.9%
15-1142 Network and Computer Systems Administrators 3,046 $40.47 1.16 92 2.1% 636 4.8% 3.1% 2.1% 937 453 924 2.7%
15-1152 Computer Network Support Specialists 1,779 $36.39 1.37 95 3.7% 323 4.1% 2.8% 1.7% 0 266 495 2.5%
13-1199* Business Operations Specialists, All Other 5,197 $35.46 0.79 242 3.0% 876 3.8% 2.0% 1.6% 319 691 1,392 2.4%
15-1134 Web Developers 1,136 $33.77 1.05 57 3.6% 202 4.0% 3.6% 2.7% 655 235 603 4.4%
15-1151 Computer User Support Specialists 5,316 $24.15 1.28 286 3.8% 1,063 4.6% 3.2% 2.4% 2,039 796 1,859 3.0%
27-1024 Graphic Designers 1,616 $23.15 0.87 67 2.8% 206 2.8% 1.9% 1.2% 78 555 360 2.0%
11-3121 Human Resources Managers 668 $55.75 0.74 21 2.1% 113 3.8% 2.7% 1.9% 19 255 195 2.6%
13-1041 Compliance Officers 1,358 $33.73 0.75 23 1.1% 237 3.9% 1.6% 1.2% 43 232 370 2.4%
13-1151 Training and Development Specialists 1,808 $30.14 0.98 70 2.6% 337 4.2% 2.7% 1.9% 176 521 491 2.4%
13-1071 Human Resources Specialists 3,454 $28.28 0.95 213 3.9% 622 4.1% 2.7% 2.0% 690 1,074 861 2.3%
11-3051 Industrial Production Managers 1,069 $47.39 0.93 38 2.7% 144 2.9% 0.5% 1.0% 75 382 130 1.2%
13-1111 Management Analysts 5,001 $41.69 0.93 256 3.6% 902 4.1% 3.5% 2.0% 1,032 1,053 1,996 3.4%
13-1081 Logisticians 927 $34.67 0.92 45 3.1% 143 3.4% 1.7% 1.5% 69 136 198 2.0%
17-3026 (LW) Industrial Engineering Technicians 433 $31.03 1.06 14 2.4% 67 3.4% -0.2% 1.0% 7 127 48 1.1%
17-3029 (LW)
Engineering Technicians, Except Drafters, All
Other 376 $26.89 0.77 16 2.8% 50 2.9% 0.6% 0.8% 36 105 75 1.8%
Dig
ital
Tec
hn
olo
gy
Ad
van
ced
Man
ufa
ctu
rin
g
Co
rpo
rate
Hea
dq
uar
ters
Fin
ance
an
d In
sura
nce
War
eho
use
an
d D
istr
ibu
tio
n
Hea
lth
care
Agr
ibu
sin
ess
Ener
gy
Targeted Industries in which the occupations
can be found
Forecast
Over the Next 10 Years
Four Quarters Ending with
2017q1
Current
2017q1
Historical
Avg Ann % Chg in Empl 2012q1-
2017q1

Total
Change
over the
Last 5
Years
SOC Title Empl
Median
Hourly
Wage
Location
Quotient Unempl
Unempl
Rate Empl WSNCT Texas USA
Current
Online
Job Ads2
Total Repl
Demand
Total
Growth
Demand
Avg.
Annual
Growth
Percent Dig
ital
Tec
hn
olo
gy
Ad
van
ced
Man
ufa
ctu
rin
g
Co
rpo
rate
Hea
dq
uar
ters
Fin
ance
an
d In
sura
nce
War
eho
use
an
d D
istr
ibu
tio
n
Hea
lth
care
Agr
ibu
sin
ess
Ener
gy
Forecast
Over the Next 10 Years
Four Quarters Ending with
2017q1
Current
2017q1
Historical
Avg Ann % Chg in Empl 2012q1-
2017q1
17-3024 (LW) Electro-Mechanical Technicians 111 $26.33 1.13 4 2.4% 9 1.7% -1.0% 0.3% 3 24 15 1.3%
49-2094 (LW)
Electrical and Electronics Repairers, Commercial
and Industrial Equipment 452 $25.46 0.97 25 4.0% 64 3.1% 0.6% 0.5% 14 83 83 1.7%
51-4012 (LW)
Computer Numerically Controlled Machine Tool
Programmers, Metal and Plastic 145 $24.39 0.84 8 4.1% 14 2.1% -1.5% 0.7% 10 47 50 3.0%
17-3027 (LW) Mechanical Engineering Technicians 314 $24.03 1.00 11 2.6% 40 2.8% 0.0% 1.2% 3 84 57 1.7%
49-9041 Industrial Machinery Mechanics 1,723 $20.68 0.75 58 2.6% 142 1.7% 0.1% 0.7% 92 522 609 3.1%
49-9043 Maintenance Workers, Machinery 601 $19.44 0.99 16 2.0% 65 2.3% 0.6% 0.8% 1 107 158 2.4%
47-2211 (LW) Sheet Metal Workers 1,043 $19.20 1.07 107 7.4% 276 6.3% 3.1% 3.2% 21 246 256 2.2%
51-4011 (LW)
Computer-Controlled Machine Tool Operators,
Metal and Plastic 791 $18.74 0.83 45 4.3% 76 2.0% -1.7% 0.6% 31 282 269 3.0%
51-9061 (LW)
Inspectors, Testers, Sorters, Samplers, and
Weighers 3,493 $17.39 1.00 271 5.5% 453 2.8% 0.6% 1.2% 124 1,004 540 1.4%
51-4121 (LW) Welders, Cutters, Solderers, and Brazers 3,480 $17.07 1.32 265 6.1% 419 2.6% 0.0% 1.2% 73 1,266 706 1.9%
51-2041 (LW) Structural Metal Fabricators and Fitters 574 $15.91 1.12 31 4.5% 126 5.1% 0.2% 1.7% 13 100 106 1.7%
51-2022 (LW) Electrical and Electronic Equipment Assemblers 2,085 $13.60 1.47 162 6.3% 321 3.4% -0.9% 0.2% 47 444 183 0.8%
51-2023 (LW) Electromechanical Equipment Assemblers 334 $13.20 1.11 27 6.3% 56 3.8% -0.6% 0.3% 12 68 34 1.0%
11-9041 Architectural and Engineering Managers 1,048 $66.56 0.89 37 2.4% 152 3.2% 0.6% 1.1% 45 326 195 1.7%
15-1143 Computer Network Architects 1,393 $52.38 1.24 18 0.9% 297 4.9% 3.3% 2.2% 71 201 434 2.8%
17-2061 Computer Hardware Engineers 645 $51.35 1.28 25 2.7% 157 5.7% 2.3% 1.5% 10 138 143 2.0%
17-2072 Electronics Engineers, Except Computer 1,401 $48.67 1.54 38 1.8% 149 2.3% -0.4% 0.0% 15 330 226 1.5%
17-2199 Engineers, All Other* 739 $48.66 0.84 19 1.7% 87 2.5% 0.5% 0.9% 123 176 159 2.0%
17-2112 Industrial Engineers 1,737 $44.32 1.01 50 2.1% 249 3.1% 0.3% 1.2% 73 589 291 1.6%
17-2071 Electrical Engineers 1,344 $44.09 1.05 27 1.4% 200 3.3% 0.3% 0.8% 131 344 215 1.5%
17-2141 Mechanical Engineers 1,508 $40.88 0.78 20 0.9% 169 2.4% 0.0% 1.3% 169 564 329 2.0%
17-3023 Electrical and Electronic Engineering Technicians 1,145 $28.64 1.26 41 2.6% 179 3.5% -0.1% 0.3% 23 287 164 1.4%
49-2011
Computer, Automated Teller, and Office Machine
Repairers 1,324 $16.58 1.59 73 3.8% 166 2.7% 1.0% 0.3% 7 319 284 2.0%
11-9111 Medical and Health Services Managers 1,574 $43.61 0.67 44 1.8% 345 5.1% 2.5% 2.0% 408 491 682 3.7%
29-2021 Dental Hygienists 1,582 $35.37 1.14 12 0.6% 360 5.3% 3.0% 1.9% 12 278 606 3.3%
31-2021 Physical Therapist Assistants 839 $34.94 1.44 28 2.9% 258 7.6% 2.9% 2.6% 61 317 602 5.6%
13-1041 Compliance Officers 1,358 $33.73 0.75 23 1.1% 237 3.9% 1.6% 1.2% 43 232 370 2.4%
29-1141 Registered Nurses 12,824 $33.20 0.66 141 0.7% 2,362 4.2% 2.3% 1.7% 1,367 3,423 5,051 3.4%
29-2011 Medical and Clinical Laboratory Technologists 773 $28.47 0.68 25 2.0% 255 8.3% 2.6% 1.6% 35 211 300 3.3%
29-1126 Respiratory Therapists 578 $27.67 0.67 5 0.5% 75 2.8% 1.9% 1.2% 61 150 204 3.1%
29-2034 Radiologic Technologists 986 $27.37 0.72 10 0.6% 264 6.4% 2.7% 1.6% 228 197 309 2.8%
29-2055 Surgical Technologists 510 $21.77 0.70 9 1.1% 102 4.5% 3.0% 1.9% 98 53 181 3.1%
29-2061 Licensed Practical and Licensed Vocational Nurses 4,415 $21.46 0.95 136 2.2% 687 3.4% 1.7% 1.5% 170 1,336 1,778 3.4%
29-2012 Medical and Clinical Laboratory Technicians 799 $17.68 0.73 29 2.2% 273 8.7% 2.9% 1.9% 50 206 332 3.5%
29-2041 Emergency Medical Technicians and Paramedics 1,235 $17.63 0.76 22 1.3% 593 14.0% 2.3% 1.3% 91 232 568 3.9%
31-9091 Dental Assistants 2,768 $17.12 1.26 121 3.6% 630 5.3% 3.1% 2.0% 295 772 1,063 3.3%
31-9011 Massage Therapists 1,290 $16.74 1.07 26 1.7% 260 4.6% 3.1% 2.0% 36 258 830 5.1%
43-6013 Medical Secretaries 6,906 $15.19 1.82 233 2.4% 1,684 5.8% 3.0% 2.2% 804 770 3,009 3.7%
29-2052 Pharmacy Technicians 2,694 $14.97 1.02 52 1.5% 566 4.8% 2.0% 1.2% 364 297 836 2.7%

Total
Change
over the
Last 5
Years
SOC Title Empl
Median
Hourly
Wage
Location
Quotient Unempl
Unempl
Rate Empl WSNCT Texas USA
Current
Online
Job Ads2
Total Repl
Demand
Total
Growth
Demand
Avg.
Annual
Growth
Percent Dig
ital
Tec
hn
olo
gy
Ad
van
ced
Man
ufa
ctu
rin
g
Co
rpo
rate
Hea
dq
uar
ters
Fin
ance
an
d In
sura
nce
War
eho
use
an
d D
istr
ibu
tio
n
Hea
lth
care
Agr
ibu
sin
ess
Ener
gy
Forecast
Over the Next 10 Years
Four Quarters Ending with
2017q1
Current
2017q1
Historical
Avg Ann % Chg in Empl 2012q1-
2017q1
31-9092 Medical Assistants 4,342 $14.84 1.03 207 3.3% 1,089 5.9% 3.2% 2.2% 429 1,031 1,901 3.7%
31-9097 Phlebotomists 663 $14.19 0.80 24 2.4% 300 12.8% 3.4% 2.1% 91 173 319 4.0%
11-3071
Transportation, Storage, and Distribution
Managers 651 $41.50 0.84 27 2.7% 101 3.4% 2.8% 2.0% 82 173 134 1.9%
13-1081 Logisticians 927 $34.67 0.92 45 3.1% 143 3.4% 1.7% 1.5% 69 136 198 2.0%
49-3011 Aircraft Mechanics and Service Technicians 684 $27.49 0.76 29 1.6% 105 3.4% 0.1% 1.3% 36 172 101 1.4%
43-5061 Production, Planning, and Expediting Clerks 2,402 $21.53 1.10 62 1.8% 384 3.5% 1.7% 1.6% 102 763 471 1.8%
43-5011 Cargo and Freight Agents 501 $21.53 0.82 42 3.6% 163 8.2% 3.0% 2.9% 87 173 132 2.4%
49-3031
Bus and Truck Mechanics and Diesel Engine
Specialists 1,741 $21.32 0.96 48 2.0% 257 3.2% 2.5% 1.6% 149 363 482 2.5%
53-3032 Heavy and Tractor-Trailer Truck Drivers 13,460 $18.86 1.09 701 3.7% 1,859 3.0% 2.6% 1.9% 1,766 2,734 2,855 1.9%
49-3023 Automotive Service Technicians and Mechanics 5,400 $17.63 1.08 225 3.5% 1,250 5.4% 3.4% 2.4% 500 1,865 1,204 2.0%
43-5032 Dispatchers, Except Police, Fire, and Ambulance 1,224 $17.61 0.89 72 3.7% 188 3.4% 2.8% 2.2% 53 341 268 2.0%
53-3033 Light Truck or Delivery Services Drivers 5,318 $14.43 0.85 287 3.7% 1,242 5.5% 3.4% 2.2% 178 1,121 1,154 2.0%
53-7051 Industrial Truck and Tractor Operators 3,964 $13.32 1.08 272 4.7% 632 3.5% 3.6% 3.1% 272 1,275 763 1.8%
43-5071 (LW) Shipping, Receiving, and Traffic Clerks 4,866 $12.99 1.06 410 5.9% 822 3.8% 2.3% 1.8% 204 1,092 730 1.4%
11-2021 Marketing Managers 1,092 $53.78 0.72 42 2.5% 206 4.3% 3.2% 2.2% 684 311 330 2.7%
13-1161
Market Research Analysts and Marketing
Specialists 3,102 $34.12 0.79 147 3.0% 621 4.6% 3.7% 2.5% 123 478 1,310 3.6%
27-1024 Graphic Designers 1,616 $23.15 0.87 67 2.8% 206 2.8% 1.9% 1.2% 78 555 360 2.0%
13-1031 Claims Adjusters, Examiners, and Investigators 1,326 $31.33 0.71 61 2.4% 279 4.8% 3.3% 1.6% 149 378 344 2.3%
43-9041 Insurance Claims and Policy Processing Clerks 2,684 $17.96 1.42 134 3.1% 807 7.4% 4.0% 2.3% 99 820 651 2.2%
11-3011 Administrative Services Managers 1,564 $45.07 0.86 59 2.6% 271 3.9% 2.6% 1.8% 3 323 424 2.4%
11-9013
Farmers, Ranchers, and Other Agricultural
Managers 12,553 $26.94 2.12 41 0.3% 416 0.7% 0.5% 0.4% 4 8,122 590 0.5%
11-9021 Construction Managers 3,351 $40.60 1.26 86 2.0% 583 3.9% 2.8% 2.3% 81 818 762 2.1%
11-9051 Food Service Managers 2,124 $28.99 1.05 44 1.7% 365 3.8% 2.8% 2.3% 513 751 511 2.2%
11-9141
Property, Real Estate, and Community
Association Managers 1,963 $33.22 0.91 35 1.3% 382 4.4% 2.4% 1.6% 183 735 692 3.1%
17-2051 Civil Engineers 1,385 $40.60 0.70 32 1.4% 233 3.7% 0.8% 1.3% 62 459 426 2.7%
23-2011 Paralegals and Legal Assistants 1,013 $27.15 0.54 52 2.5% 190 4.2% 1.5% 0.4% 73 245 306 2.7%
29-2056 Veterinary Technologists and Technicians 1,137 $14.59 1.65 19 1.6% 242 4.9% 3.9% 3.6% 58 134 447 3.4%
49-2022
Telecommunications Equipment Installers and
Repairers, Except Line Installers 1,864 $20.96 1.20 120 3.8% 271 3.2% 0.8% 0.0% 113 189 357 1.8%
49-9021
Heating, Air Conditioning, and Refrigeration
Mechanics and Installers 2,049 $19.87 0.95 74 2.7% 473 5.4% 3.7% 3.4% 118 396 683 2.9%
11-9032
Education Administrators, Elementary and
Secondary School 2,370 $38.90 1.51 25 0.9% 186 1.7% 1.6% 0.7% 76 763 366 1.4%
25-9031 Instructional Coordinators 1,140 $31.23 1.12 33 2.2% 110 2.0% 1.7% 1.1% 94 121 218 1.8%
Targeted Occupations which fall within a targeted industry but do not have a clear career path
Targeted Occupations which do not fall within targeted industries

Total
Change
over the
Last 5
Years
SOC Title Empl
Median
Hourly
Wage
Location
Quotient Unempl
Unempl
Rate Empl WSNCT Texas USA
Current
Online
Job Ads2
Total Repl
Demand
Total
Growth
Demand
Avg.
Annual
Growth
Percent Dig
ital
Tec
hn
olo
gy
Ad
van
ced
Man
ufa
ctu
rin
g
Co
rpo
rate
Hea
dq
uar
ters
Fin
ance
an
d In
sura
nce
War
eho
use
an
d D
istr
ibu
tio
n
Hea
lth
care
Agr
ibu
sin
ess
Ener
gy
Forecast
Over the Next 10 Years
Four Quarters Ending with
2017q1
Current
2017q1
Historical
Avg Ann % Chg in Empl 2012q1-
2017q1
25-2054 Special Education Teachers, Secondary School 1,112 $27.53 1.30 15 1.1% 80 1.5% 1.4% 0.6% 34 227 174 1.5%
25-2031
Secondary School Teachers, Except Special and
Career/Technical Education 9,779 $26.76 1.52 89 0.7% 713 1.5% 1.4% 0.6% 351 2,450 1,496 1.4%
25-2022
Middle School Teachers, Except Special and
Career/Technical Education 6,614 $26.38 1.65 112 1.4% 483 1.5% 1.4% 0.6% 487 1,517 1,014 1.4%
25-2021
Elementary School Teachers, Except Special
Education 13,379 $26.23 1.50 217 1.3% 971 1.5% 1.4% 0.6% 144 2,998 2,058 1.4%
25-2011 Preschool Teachers, Except Special Education 4,538 $17.19 1.52 87 1.7% 864 4.3% 1.8% 1.3% 637 1,415 1,126 2.2%
33-3051 Police and Sheriff's Patrol Officers 4,752 $30.37 1.16 34 0.6% 413 1.8% 1.0% 0.4% 49 1,774 1,083 2.1%
33-3012 Correctional Officers and Jailers 1,424 $17.98 0.53 40 1.8% 7 0.1% 0.4% -0.1% 48 436 343 2.2%
33-2011 Firefighters 2,021 $24.80 1.04 218 7.8% 237 2.5% 1.2% 0.5% 16 682 472 2.1%
KEY:
Primary Targeted Industries (Approximately 80-90% of the workers fall within these industries)
Secondary Targeted Industries (Approximately <20% of the workers fall within these industries)
Tertiary Targeted Industries (10 or less workers within these industries)

BOARD SUMMARY REPORT - CONTRACTED MEASURES
NORTH CENTRALBOARD NAME: JUNE 2017 REPORT
Rolling Performance Periods* As Originally Published 8/4/2017
FINAL RELEASE
10 4 4 77.78%
% +P & MPWith Positive Performance (+P):
Meeting Performance (MP):
With Negative Performance (-P):
Contracted Measures
Status Summary
% CurrentTarget
EOYTargetMeasure Status From
Two Years Earlier
One Year Earlier To
CurrentPerf. YTD Den
YTD NumCurrentTarget QTR 1 QTR 2 QTR 3 QTR 4
Notes
Source
Reemployment and Employer Engagement MeasuresClaimant Reemployment within 10 Weeks 4/16 3/1752.47%MP 100.59% 52.50% 52.78% 51.70% 52.20% 52.37% 53.86% 51.12% 53.58%
36,858
19,453TWC
# of Employers Receiving Workforce Assistance 7/16 6/178,494+P 108.81% 8,193 9,242 9,155 8,159 4,363 3,656 4,252 3,994-----
-----TWC
Program Participation MeasuresChoices Full Work Rate - All Family Total 7/16 6/1753.57%+P 111.72% 50.00% 59.85% 54.29% 50.59% 64.29% 56.48% 54.87% 63.75%
169
101TWC
Avg # Children Served Per Day - Discretionary 7/16 6/171
-------- ----- ----- 5,019 5,334 n/a 5,634 5,022 4,817 4,593261
1,309,962
(Discrete Month)
Avg # Children Served Per Day - Discretionary 6/17 6/172
4,860-P 92.59% 4,860 4,500 n/a n/a n/a n/a n/a n/a22
98,992TWC
For BCY17, TWC is not using “YTD” performance for accountability purposes.1.
For BCY17, TWC is focusing on individual monthly performance for accountability purposes. 98-100% of Target = +P, 95-102% of Target = MP, otherwise –P.2.
WIOA Outcome MeasuresEmployed/Enrolled Q2 Post Exit – All
Participants7/15 6/1661.00%+P 110.26% 61.00% 67.26% 66.98% 65.62% 68.58% 65.82% 67.41% 67.17%
40,238
27,066TWC
Employed/Enrolled Q2-Q4 Post Exit – All Participants
1/15 12/1581.40%+P 105.43% 81.40% 85.82% 85.93% 85.65% 86.07% 85.34% 86.34% 85.50%27,668
23,744TWC
Median Earnings Q2 Post Exit – All Participants 7/15 6/16$5,010.00+P 119.05% $5,010.00 $5,964.65 $5,735.53 $5,536.55 $5,260.23 $5,854.90 $6,491.08 $6,358.2226,650
n/aTWC
Credential Rate – All Participants 1/15 12/15n/an/a n/a n/a 52.90% 48.87% 48.34% 53.23% 45.28% 54.32% 56.25%276
146TWC
Employed Q2 Post Exit – Adult 7/15 6/163
77.70%MP 97.19% 77.70% 75.52% 75.50% 73.14% 77.92% 80.90% 68.24% 74.03%482
364DOL-C
Employed Q4 Post Exit – Adult 1/15 12/153
75.40%MP 100.05% 75.40% 75.44% 74.22% 72.65% 69.63% 71.85% 79.22% 83.15%513
387DOL-C
Median Earnings Q2 Post Exit – Adult 7/15 6/163
$4,490.00+P 135.66% $4,490.00 $6,091.33 $5,455.05 $5,242.53 $4,944.36 $5,774.24 $6,100.15 $7,155.91358
n/aDOL-C
Credential Rate – Adult 1/15 12/153
67.80%+P 107.67% 67.80% 73.00% 69.78% 69.80% 82.86% 64.29% 74.55% 74.07%200
146DOL-C
Employed Q2 Post Exit – DW 7/15 6/163
80.00%MP 97.85% 80.00% 78.28% 80.24% 77.61% 78.22% 85.37% 75.00% 75.47%373
292DOL-C
Employed Q4 Post Exit – DW 1/15 12/153
76.90%+P 109.38% 76.90% 84.11% 78.74% 78.79% 80.17% 85.48% 84.16% 87.80%428
360DOL-C
Median Earnings Q2 Post Exit – DW 7/15 6/163
$7,130.00+P 115.13% $7,130.00 $8,208.66 $7,384.99 $7,376.95 $8,368.60 $7,555.07 $8,618.40 $8,348.31292
n/aDOL-C
Credential Rate – DW 1/15 12/153
64.40%-P 91.96% 64.40% 59.22% 61.54% 69.47% 53.85% 50.00% 70.00% 61.90%206
122DOL-C
Page 1 of 2Operational Insight - MPR 4.0
Note: In some cases historic data not available at time of original publication (such as when a new measure is created) has been added to the MPR retroactively to allow trend analysis.
BOARD SUMMARY REPORT - CONTRACTED MEASURES
NORTH CENTRALBOARD NAME: JUNE 2017 REPORT
Rolling Performance Periods* As Originally Published 8/4/2017
FINAL RELEASE
% CurrentTarget
EOYTargetMeasure Status From
Two Years Earlier
One Year Earlier To
CurrentPerf. YTD Den
YTD NumCurrentTarget QTR 1 QTR 2 QTR 3 QTR 4
Notes
Source
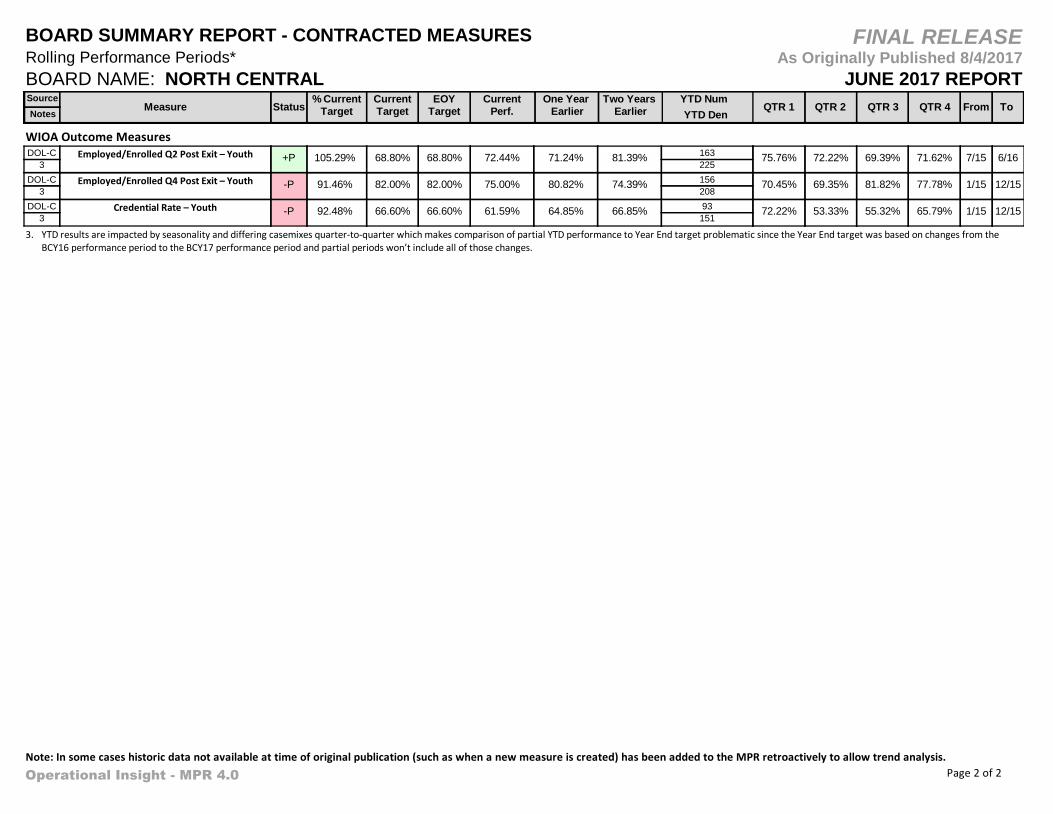
WIOA Outcome MeasuresEmployed/Enrolled Q2 Post Exit – Youth 7/15 6/16
368.80%+P 105.29% 68.80% 72.44% 71.24% 81.39% 75.76% 72.22% 69.39% 71.62%
225
163DOL-C
Employed/Enrolled Q4 Post Exit – Youth 1/15 12/153
82.00%-P 91.46% 82.00% 75.00% 80.82% 74.39% 70.45% 69.35% 81.82% 77.78%208
156DOL-C
Credential Rate – Youth 1/15 12/153
66.60%-P 92.48% 66.60% 61.59% 64.85% 66.85% 72.22% 53.33% 55.32% 65.79%151
93DOL-C
YTD results are impacted by seasonality and differing casemixes quarter-to-quarter which makes comparison of partial YTD performance to Year End target problematic since the Year End target was based on changes from the BCY16 performance period to the BCY17 performance period and partial periods won’t include all of those changes.
3.
Page 2 of 2Operational Insight - MPR 4.0
Note: In some cases historic data not available at time of original publication (such as when a new measure is created) has been added to the MPR retroactively to allow trend analysis.

BOARD SUMMARY REPORT - CONTRACTED MEASURES
NORTH CENTRALBOARD NAME: JUNE 2017 REPORT
Year-to-Date Performance Periods* As Originally Published 8/4/2017
FINAL RELEASE
10 4 4 77.78%
% +P & MPWith Positive Performance (+P):
Meeting Performance (MP):
With Negative Performance (-P):
Contracted Measures
Status Summary
% CurrentTarget
EOYTargetMeasure Status From
2 Years Ago YE
Prior Year End To
CurrentPerf. YTD Den
YTD NumCurrentTarget QTR 1 QTR 2 QTR 3 QTR 4
Notes
Source
Reemployment and Employer Engagement MeasuresClaimant Reemployment within 10 Weeks 7/16 3/1752.50%MP 100.80% 52.50% 52.92% 51.84% 52.31% 53.86% 51.12% 53.58%
27,256
14,424TWC
# of Employers Receiving Workforce Assistance 10/16 6/176,604+P 115.07% 8,193 7,599 9,395 8,781 3,656 4,252 3,994-----
-----TWC
Program Participation MeasuresChoices Full Work Rate - All Family Total 10/16 6/1750.00%+P 116.74% 50.00% 58.37% 56.73% 51.16% 56.48% 54.87% 63.75%
166
97TWC
Avg # Children Served Per Day - Discretionary 10/16 6/171
-------- ----- ----- 4,811 5,482 4,932 5,022 4,817 4,593195
938,087
(Discrete Month)
Avg # Children Served Per Day - Discretionary 6/17 6/172
4,860-P 92.59% 4,860 4,500 n/a n/a n/a n/a n/a n/a22
98,992TWC
For BCY17, TWC is not using “YTD” performance for accountability purposes.1.
For BCY17, TWC is focusing on individual monthly performance for accountability purposes. 98-100% of Target = +P, 95-102% of Target = MP, otherwise –P.2.
WIOA Outcome MeasuresEmployed/Enrolled Q2 Post Exit – All
Participants7/15 6/1661.00%+P 110.26% 61.00% 67.26% 66.98% 65.62% 68.58% 65.82% 67.41% 67.17%
40,238
27,066TWC
Employed/Enrolled Q2-Q4 Post Exit – All Participants
1/15 12/1581.40%+P 105.43% 81.40% 85.82% 85.93% 85.65% 86.07% 85.34% 86.34% 85.50%27,668
23,744TWC
Median Earnings Q2 Post Exit – All Participants 7/15 6/16$5,010.00+P 119.05% $5,010.00 $5,964.65 $5,735.53 $5,536.55 $5,260.23 $5,854.90 $6,491.08 $6,358.2226,650
n/aTWC
Credential Rate – All Participants 1/15 12/15n/an/a n/a n/a 52.90% 48.87% 48.34% 53.23% 45.28% 54.32% 56.25%276
146TWC
Employed Q2 Post Exit – Adult 7/15 6/163
77.70%MP 97.19% 77.70% 75.52% 75.50% 73.14% 77.92% 80.90% 68.24% 74.03%482
364DOL-C
Employed Q4 Post Exit – Adult 1/15 12/153
75.40%MP 100.05% 75.40% 75.44% 74.22% 72.65% 69.63% 71.85% 79.22% 83.15%513
387DOL-C
Median Earnings Q2 Post Exit – Adult 7/15 6/163
$4,490.00+P 135.66% $4,490.00 $6,091.33 $5,455.05 $5,242.53 $4,944.36 $5,774.24 $6,100.15 $7,155.91358
n/aDOL-C
Credential Rate – Adult 1/15 12/153
67.80%+P 107.67% 67.80% 73.00% 69.78% 69.80% 82.86% 64.29% 74.55% 74.07%200
146DOL-C
Employed Q2 Post Exit – DW 7/15 6/163
80.00%MP 97.85% 80.00% 78.28% 80.24% 77.61% 78.22% 85.37% 75.00% 75.47%373
292DOL-C
Employed Q4 Post Exit – DW 1/15 12/153
76.90%+P 109.38% 76.90% 84.11% 78.74% 78.79% 80.17% 85.48% 84.16% 87.80%428
360DOL-C
Median Earnings Q2 Post Exit – DW 7/15 6/163
$7,130.00+P 115.13% $7,130.00 $8,208.66 $7,384.99 $7,376.95 $8,368.60 $7,555.07 $8,618.40 $8,348.31292
n/aDOL-C
Credential Rate – DW 1/15 12/153
64.40%-P 91.96% 64.40% 59.22% 61.54% 69.47% 53.85% 50.00% 70.00% 61.90%206
122DOL-C
Page 1 of 2Operational Insight - MPR 4.0
Note: In some cases historic data not available at time of original publication (such as when a new measure is created) has been added to the MPR retroactively to allow trend analysis.

BOARD SUMMARY REPORT - CONTRACTED MEASURES
NORTH CENTRALBOARD NAME: JUNE 2017 REPORT
Year-to-Date Performance Periods* As Originally Published 8/4/2017
FINAL RELEASE
% CurrentTarget
EOYTargetMeasure Status From
2 Years Ago YE
Prior Year End To
CurrentPerf. YTD Den
YTD NumCurrentTarget QTR 1 QTR 2 QTR 3 QTR 4
Notes
Source
WIOA Outcome MeasuresEmployed/Enrolled Q2 Post Exit – Youth 7/15 6/16
368.80%+P 105.29% 68.80% 72.44% 71.24% 81.39% 75.76% 72.22% 69.39% 71.62%
225
163DOL-C
Employed/Enrolled Q4 Post Exit – Youth 1/15 12/153
82.00%-P 91.46% 82.00% 75.00% 80.82% 74.39% 70.45% 69.35% 81.82% 77.78%208
156DOL-C
Credential Rate – Youth 1/15 12/153
66.60%-P 92.48% 66.60% 61.59% 64.85% 66.85% 72.22% 53.33% 55.32% 65.79%151
93DOL-C
YTD results are impacted by seasonality and differing casemixes quarter-to-quarter which makes comparison of partial YTD performance to Year End target problematic since the Year End target was based on changes from the BCY16 performance period to the BCY17 performance period and partial periods won’t include all of those changes.
3.
Page 2 of 2Operational Insight - MPR 4.0
Note: In some cases historic data not available at time of original publication (such as when a new measure is created) has been added to the MPR retroactively to allow trend analysis.

LARGE BOARDS PERFORMANCE COMPARISON REPORT (YEAR-TO-DATE)MONTH: June 2017 RELEASE: Final Release
BOARD NUM DEN %
% of TARGET
CURRENT TARGET
2 YRS PRIOR
MP NUM TARGET GAP RANK
PRIOR YEAR END STATUS
Claimant Reemployment within 10 Weeks 1
Gulf Coast 43.50%48,159 96,142 50.09% 45.99% 53.42% +P 39,731 5115.15% 8,428
Lower Rio Grande 58.10%10,570 17,699 59.72% 56.46% 56.20% MP 9,769 13102.79% 801
Tarrant County 55.10%11,048 19,718 56.03% 53.82% 53.16% MP 10,321 15101.69% 727
Alamo Area 59.60%12,912 21,379 60.40% 58.94% 60.85% MP 12,105 17101.34% 807
North Central 52.50%14,424 27,256 52.92% 51.84% 52.31% MP 13,594 19100.80% 830
Dallas 57.70%17,184 30,881 55.65% 57.09% 55.16% MP 16,927 2596.45% 257
Borderplex 59.50%5,790 10,104 57.30% 54.68% 55.29% MP 5,711 2696.30% 79
BOARD NUM DEN %
% of TARGET
CURRENT TARGET
2 YRS PRIOR
MP NUM TARGET GAP RANK
PRIOR YEAR END STATUS
Choices Full Work Rate - All Family Total 3
Lower Rio Grande 50.00%96 154 62.09% 67.86% 66.62% +P 73 3124.18% 23
Alamo Area 50.00%146 236 61.98% 62.58% 54.34% +P 112 4123.96% 34
North Central 50.00%97 166 58.37% 56.73% 51.16% +P 79 8116.74% 18
Tarrant County 50.00%130 236 54.85% 56.29% 53.58% +P 112 13109.70% 18
Borderplex 50.00%92 178 52.33% 47.06% 42.95% MP 85 16104.66% 7
Dallas 48.10%220 465 47.51% 45.76% 40.95% MP 212 2598.77% 8
Gulf Coast 50.00%455 919 49.36% 49.31% 42.81% MP 437 2698.72% 18
BOARD NUM DEN %
% of TARGET
CURRENT TARGET
2 YRS PRIOR
MP NUM TARGET GAP RANK
PRIOR YEAR END STATUS
Employed/Enrolled Q2 Post Exit – All Participants 6
Dallas 62.30%59,878 86,089 69.55% 68.56% 66.36% +P 50,952 1111.64% 8,926
North Central 61.00%27,066 40,238 67.26% 66.98% 65.62% +P 23,318 3110.26% 3,748
Alamo Area 63.20%30,778 44,457 69.23% 69.68% 68.03% +P 26,692 6109.54% 4,086
Tarrant County 63.10%30,660 44,456 68.97% 69.75% 68.47% +P 26,649 7109.30% 4,011
Lower Rio Grande 67.20%35,540 48,960 72.59% 73.13% 71.70% +P 31,256 9108.02% 4,284
Borderplex 61.80%24,125 36,649 65.83% 66.93% 65.99% +P 21,517 13106.52% 2,608
Gulf Coast 61.40%104,128 160,558 64.85% 67.54% 66.17% +P 93,653 17105.62% 10,475
BOARD NUM DEN %
% of TARGET
CURRENT TARGET
2 YRS PRIOR
MP NUM TARGET GAP RANK
PRIOR YEAR END STATUS
Employed/Enrolled Q2-Q4 Post Exit – All Participants 7
Dallas 80.40%49,113 57,401 85.56% 84.76% 84.25% +P 43,843 1106.42% 5,270
Tarrant County 80.90%28,178 33,005 85.37% 85.63% 84.94% +P 25,366 4105.53% 2,812
North Central 81.40%23,744 27,668 85.82% 85.93% 85.65% +P 21,396 6105.43% 2,348
Borderplex 79.40%21,610 25,836 83.64% 84.14% 84.67% +P 19,488 7105.34% 2,122
Alamo Area 81.00%25,698 30,357 84.65% 84.73% 86.02% MP 23,360 15104.51% 2,338
Lower Rio Grande 78.00%29,085 35,733 81.40% 82.46% 82.45% MP 26,478 16104.36% 2,607
Gulf Coast 78.30%86,087 106,196 81.06% 81.85% 82.86% MP 78,994 20103.53% 7,093
North Central Texas Workforce Development Board

LARGE BOARDS PERFORMANCE COMPARISON REPORT (YEAR-TO-DATE)MONTH: June 2017 RELEASE: Final Release
BOARD NUM DEN %
% of TARGET
CURRENT TARGET
2 YRS PRIOR
MP NUM TARGET GAP RANK
PRIOR YEAR END STATUS
Credential Rate – All Participants 9
Lower Rio Grande 88 158 55.70% 61.64% 68.05%
Tarrant County 119 223 53.36% 57.22% 50.69%
North Central 146 276 52.90% 48.87% 48.34%
Borderplex 233 388 60.05% 54.46% 41.00%
Dallas 329 606 54.29% 46.85% 51.19%
Alamo Area 129 329 39.21% 42.03% 44.01%
Gulf Coast 500 1,970 25.38% 23.53% 33.73%
BOARD NUM DEN %
% of TARGET
CURRENT TARGET
2 YRS PRIOR
MP NUM TARGET GAP RANK
PRIOR YEAR END STATUS
Employed Q2 Post Exit – Adult 10
Lower Rio Grande 79.00%440 536 82.09% 73.99% 76.58% MP 402 7103.91% 38
Dallas 75.20%757 991 76.39% 77.09% 69.04% MP 708 11101.58% 49
Alamo Area 80.90%634 787 80.56% 80.81% 80.06% MP 605 1799.58% 29
Borderplex 85.00%323 382 84.55% 81.39% 73.33% MP 308 1999.47% 15
Gulf Coast 75.00%10,858 14,816 73.29% 73.59% 72.66% MP 10,556 2197.72% 302
North Central 77.70%364 482 75.52% 75.50% 73.14% MP 356 2297.19% 8
Tarrant County 80.90%449 593 75.72% 79.65% 77.29% -P 456 2693.60% -7
BOARD NUM DEN %
% of TARGET
CURRENT TARGET
2 YRS PRIOR
MP NUM TARGET GAP RANK
PRIOR YEAR END STATUS
Employed Q4 Post Exit – Adult 11
Borderplex 79.20%304 357 85.15% 75.61% 79.04% +P 269 4107.51% 35
Dallas 73.00%807 1,065 75.77% 78.34% 69.25% MP 739 11103.79% 68
Lower Rio Grande 82.20%435 510 85.29% 75.38% 76.80% MP 398 12103.76% 37
Alamo Area 77.40%593 757 78.34% 74.57% 76.79% MP 557 17101.21% 36
North Central 75.40%387 513 75.44% 74.22% 72.65% MP 367 18100.05% 20
Gulf Coast 71.50%16,981 24,295 69.90% 71.01% 68.48% MP 16,502 1997.76% 479
Tarrant County 77.50%396 555 71.35% 77.70% 78.19% -P 409 2692.06% -13
BOARD NUM DEN %
% of TARGET
CURRENT TARGET
2 YRS PRIOR
MP NUM TARGET GAP RANK
PRIOR YEAR END STATUS
Credential Rate – Adult 13
North Central 67.80%146 200 73.00% 69.78% 69.80% +P 129 9107.67% 17
Lower Rio Grande 74.40%287 360 79.72% 79.75% 83.83% +P 254 12107.15% 33
Tarrant County 77.30%104 132 78.79% 75.52% 74.77% MP 97 18101.93% 7
Dallas 74.00%509 676 75.30% 80.40% 76.04% MP 475 19101.76% 34
Borderplex 72.30%159 217 73.27% 68.38% 63.90% MP 149 20101.34% 10
Gulf Coast 47.70%1,441 3,155 45.67% 41.34% 53.86% MP 1,430 2495.74% 11
Alamo Area 73.00%118 176 67.05% 67.91% 64.80% -P 122 2791.85% -4
North Central Texas Workforce Development Board

LARGE BOARDS PERFORMANCE COMPARISON REPORT (YEAR-TO-DATE)MONTH: June 2017 RELEASE: Final Release
BOARD NUM DEN %
% of TARGET
CURRENT TARGET
2 YRS PRIOR
MP NUM TARGET GAP RANK
PRIOR YEAR END STATUS
Employed Q2 Post Exit – DW 14
Lower Rio Grande 84.20%60 68 88.24% 83.15% 78.95% MP 54 7104.80% 6
Dallas 86.00%195 225 86.67% 85.58% 77.68% MP 184 14100.78% 11
North Central 80.00%292 373 78.28% 80.24% 77.61% MP 283 1897.85% 9
Gulf Coast 81.30%1,633 2,081 78.47% 78.50% 77.88% MP 1,607 2196.52% 26
Alamo Area 84.30%345 435 79.31% 84.91% 87.04% -P 348 2594.08% -3
Borderplex 76.70%264 366 72.13% 78.11% 69.84% -P 267 2694.04% -3
Tarrant County 87.30%502 646 77.71% 83.49% 84.28% -P 536 2889.01% -34
BOARD NUM DEN %
% of TARGET
CURRENT TARGET
2 YRS PRIOR
MP NUM TARGET GAP RANK
PRIOR YEAR END STATUS
Employed Q4 Post Exit – DW 15
Lower Rio Grande 79.20%69 77 89.61% 78.41% 75.56% +P 58 6113.14% 11
North Central 76.90%360 428 84.11% 78.74% 78.79% +P 313 9109.38% 47
Borderplex 68.70%193 260 74.23% 72.82% 75.62% +P 170 10108.05% 23
Gulf Coast 76.10%1,665 2,100 79.29% 78.66% 73.73% MP 1,518 16104.19% 147
Dallas 83.50%268 312 85.90% 82.83% 77.97% MP 247 17102.87% 21
Alamo Area 83.20%411 499 82.36% 83.33% 83.16% MP 394 2198.99% 17
Tarrant County 81.80%487 606 80.36% 82.62% 79.47% MP 471 2398.24% 16
BOARD NUM DEN %
% of TARGET
CURRENT TARGET
2 YRS PRIOR
MP NUM TARGET GAP RANK
PRIOR YEAR END STATUS
Credential Rate – DW 17
Lower Rio Grande 88.80%57 58 98.28% 91.14% 89.47% +P 49 7110.68% 8
Borderplex 77.60%144 176 81.82% 78.47% 86.93% +P 130 11105.44% 14
Dallas 73.50%203 267 76.03% 75.21% 77.22% MP 186 14103.44% 17
Tarrant County 85.60%170 205 82.93% 80.00% 77.92% MP 167 1896.88% 3
Alamo Area 86.40%77 95 81.05% 76.60% 73.05% -P 78 2093.81% -1
Gulf Coast 66.60%312 504 61.90% 58.33% 71.24% -P 319 2292.94% -7
North Central 64.40%122 206 59.22% 61.54% 69.47% -P 126 2391.96% -4
BOARD NUM DEN %
% of TARGET
CURRENT TARGET
2 YRS PRIOR
MP NUM TARGET GAP RANK
PRIOR YEAR END STATUS
Employed/Enrolled Q2 Post Exit – Youth 18
Dallas 59.80%420 568 73.94% 56.92% 68.15% +P 323 4123.65% 97
Gulf Coast 63.80%767 1,099 69.79% 64.46% 68.22% +P 666 11109.39% 101
Tarrant County 71.90%302 388 77.84% 75.59% 81.57% +P 265 13108.26% 37
Alamo Area 66.50%355 503 70.58% 68.93% 71.60% +P 318 17106.14% 37
North Central 68.80%163 225 72.44% 71.24% 81.39% +P 147 19105.29% 16
Lower Rio Grande 68.40%213 308 69.16% 69.06% 77.65% MP 200 22101.11% 13
Borderplex 70.40%196 305 64.26% 68.25% 67.28% -P 204 2791.28% -8
North Central Texas Workforce Development Board

LARGE BOARDS PERFORMANCE COMPARISON REPORT (YEAR-TO-DATE)MONTH: June 2017 RELEASE: Final Release
BOARD NUM DEN %
% of TARGET
CURRENT TARGET
2 YRS PRIOR
MP NUM TARGET GAP RANK
PRIOR YEAR END STATUS
Employed/Enrolled Q4 Post Exit – Youth 19
Gulf Coast 67.70%647 919 70.40% 69.31% 71.55% MP 591 8103.99% 56
Alamo Area 67.60%269 390 68.97% 70.23% 76.43% MP 250 11102.03% 19
Lower Rio Grande 74.30%213 286 74.48% 74.05% 77.30% MP 202 15100.24% 11
Borderplex 72.50%188 259 72.59% 66.67% 77.13% MP 178 16100.12% 10
Dallas 71.50%362 509 71.12% 67.92% 68.10% MP 346 1799.47% 16
Tarrant County 79.40%331 434 76.27% 80.78% 76.40% MP 327 2296.06% 4
North Central 82.00%156 208 75.00% 80.82% 74.39% -P 162 2591.46% -6
BOARD NUM DEN %
% of TARGET
CURRENT TARGET
2 YRS PRIOR
MP NUM TARGET GAP RANK
PRIOR YEAR END STATUS
Credential Rate – Youth 20
Dallas 47.60%336 539 62.34% 51.88% 66.07% +P 244 3130.97% 92
Gulf Coast 41.70%260 486 53.50% 42.71% 58.76% +P 193 4128.30% 67
Borderplex 60.70%119 170 70.00% 61.42% 70.52% +P 98 5115.32% 21
Lower Rio Grande 76.80%59 68 86.76% 84.21% 81.87% +P 50 7112.97% 9
Alamo Area 56.00%121 201 60.20% 61.23% 68.01% +P 107 12107.50% 14
North Central 66.60%93 151 61.59% 64.85% 66.85% -P 96 2392.48% -3
Tarrant County 72.30%101 163 61.96% 74.82% 67.88% -P 112 2585.70% -11
North Central Texas Workforce Development Board

LARGE BOARDS PERFORMANCE COMPARISON REPORT (YEAR-TO-DATE)MONTH: June 2017 RELEASE: Final Release
BOARD NUM DEN
% of TARGET
CURRENT TARGET
2 YRS PRIOR
MP SERVED TARGET GAP RANK
PRIOR YEAR END STATUS
# of Employers Receiving Workforce Assistance 2
AVG SERVED PER DAY
Borderplex 34094,135 1 4135 5261 4646 +P 3,239 1121.30% 896
Lower Rio Grande 35454,135 1 4135 4450 3760 +P 3,368 3116.64% 767
North Central 66047,599 1 7599 9395 8781 +P 6,274 4115.07% 1,325
Alamo Area 75558,483 1 8483 8989 8279 +P 7,177 7112.28% 1,306
Dallas 90259,440 1 9440 12190 11413 MP 8,574 11104.60% 866
Tarrant County 53015,312 1 5312 6514 6538 MP 5,036 18100.21% 276
Gulf Coast 2080414,505 1 14505 23595 27311 -P 19,764 2869.72% -5,259
BOARD NUM DEN
% of TARGET
CURRENT TARGET
2 YRS PRIOR
MP SERVED TARGET GAP RANK
PRIOR YEAR END STATUS
Avg # Children Served Per Day - Discretionary 4
AVG SERVED PER DAY
Gulf Coast 3,736,700 195 19163 21153 21395
Alamo Area 1,247,717 195 6399 6770 7047
Borderplex 837,585 195 4295 4750 4983
Tarrant County 981,286 195 5032 4899 5001
North Central 938,087 195 4811 5482 4932
Lower Rio Grande 1,226,669 195 6291 7146 7483
Dallas 1,632,532 195 8372 9886 9257
BOARD NUM DEN
% of TARGET
CURRENT TARGET
2 YRS PRIOR
MP SERVED TARGET GAP RANK
PRIOR YEAR END STATUS
Avg # Children Served Per Day - Discretionary (Discrete Month) 5
AVG SERVED PER DAY
Tarrant County 5119113,221 22 5146 MP 4,863 6100.53% 283
Gulf Coast 21465452,979 22 20590 MP 20,392 1195.92% 198
Lower Rio Grande 7463169,124 22 7687 -P 7,090 16103.00% 597
Borderplex 462894,972 22 4317 -P 4,397 1893.28% -80
North Central 486098,992 22 4500 -P 4,617 1992.59% -117
Alamo Area 6419150,188 22 6827 -P 6,098 21106.36% 729
Dallas 9710190,040 22 8638 -P 9,225 2488.96% -587
North Central Texas Workforce Development Board

ALL BOARDS RANKING SUMMARY (YEAR-TO-DATE)MONTH: June 2017 RELEASE: Final Release
Alamo
Area
Brazos
Valley
Cameron
County
Capital
Area
Central
Texas
Coastal
Bend
Concho
Valley
Dallas
County
Deep
East
Texas
East
Texas
Golden
Crescent
Gulf
Coast
Heart
of
Texas
Lower
Rio
Grande
Middle
Rio
Grande
North
Central
North
East
Texas
North
Texas
Panhandle Permian
Basin
Rural
Capital
South
Plains
South
Texas
Southeast
Texas
Tarrant
County
Texoma Border
Plex
West
Central
1 - Reemployment and Employer Engagement MeasuresClaimant Reemployment within 10 Weeks 17 12 10 22 283 4 25 20 9 2 5 27 13 14 19 23 7 8 1 24 16 6 18 15 11 26 211
# of Employers Receiving Workforce Assistance 7 23 24 6 1914 8 11 10 25 27 28 12 3 15 4 20 22 5 16 17 2 21 9 18 13 1 262
Average Group Rank: 12.00 17.50 17.00 14.00 23.50 8.50 6.00 18.00 15.00 17.00 14.50 16.50 19.50 8.00 14.50 11.50 21.50 14.50 6.50 8.50 20.50 9.00 13.50 13.50 16.50 12.00 13.50 23.50
2 - Program Participation MeasuresChoices Full Work Rate - All Family Total 4 10 20 21 924 6 25 17 18 1 26 28 3 19 8 15 11 7 22 5 14 12 23 13 2 16 273
Avg # Children Served Per Day - Discretionary4
Avg # Children Served Per Day - Discretionary (Discrete Month)
21 7 1 27 257 4 24 2 23 17 11 9 16 28 19 12 5 22 13 15 14 26 20 6 3 18 105
Average Group Rank: 12.50 8.50 10.50 24.00 17.00 15.50 5.00 24.50 9.50 20.50 9.00 18.50 18.50 9.50 23.50 13.50 13.50 8.00 14.50 17.50 10.00 14.00 19.00 21.50 9.50 2.50 17.00 18.50
3 - WIOA Outcome MeasuresEmployed/Enrolled Q2 Post Exit – All Participants 6 20 5 2 1424 25 1 12 21 27 17 10 9 26 3 11 16 18 28 4 15 22 23 7 8 13 196
Employed/Enrolled Q2-Q4 Post Exit – All Participants 15 13 17 5 1224 23 1 14 18 26 20 21 16 28 6 10 8 11 27 2 22 25 19 4 2 7 97
Median Earnings Q2 Post Exit – All Participants 21 45 11 3 4339 37 9 23 41 49 47 53 17 31 13 51 27 1 35 15 29 19 55 5 7 33 258
Credential Rate – All Participants9
Employed Q2 Post Exit – Adult 17 20 14 5 425 13 11 15 24 9 21 28 7 16 22 2 10 6 23 1 18 8 27 26 3 19 1210
Employed Q4 Post Exit – Adult 17 15 16 28 921 13 11 22 6 2 19 20 12 25 18 3 5 24 27 8 14 1 23 26 10 4 711
Median Earnings Q2 Post Exit – Adult 29 41 17 47 1911 45 43 9 33 27 35 49 5 23 7 55 13 53 31 15 51 3 37 39 1 25 2112
Credential Rate – Adult 27 26 4 7 1121 3 19 5 10 13 24 28 12 8 9 2 1 15 16 6 17 23 25 18 22 20 1413
Employed Q2 Post Exit – DW 25 19 4 13 1527 11 14 12 16 17 21 22 7 8 18 9 5 23 19 24 6 1 10 28 2 26 314
Employed Q4 Post Exit – DW 21 3 7 18 827 14 17 12 19 28 16 25 6 5 9 11 4 15 13 22 26 1 24 23 20 10 215
Median Earnings Q2 Post Exit – DW 33 23 45 21 515 35 37 39 19 13 51 3 7 17 25 41 11 29 9 53 55 1 43 31 27 49 4716
North Central Texas Workforce Development Board

Alamo
Area
Brazos
Valley
Cameron
County
Capital
Area
Central
Texas
Coastal
Bend
Concho
Valley
Dallas
County
Deep
East
Texas
East
Texas
Golden
Crescent
Gulf
Coast
Heart
of
Texas
Lower
Rio
Grande
Middle
Rio
Grande
North
Central
North
East
Texas
North
Texas
Panhandle Permian
Basin
Rural
Capital
South
Plains
South
Texas
Southeast
Texas
Tarrant
County
Texoma Border
Plex
West
Central
Credential Rate – DW 20 8 10 12 195 13 14 26 9 25 22 28 7 17 23 2 15 3 24 16 21 6 27 18 4 11 117
Employed/Enrolled Q2 Post Exit – Youth 17 28 23 26 925 7 4 24 21 2 11 10 22 5 19 6 1 18 12 8 15 16 20 13 3 27 1418
Employed/Enrolled Q4 Post Exit – Youth 11 5 26 23 619 12 17 7 20 27 8 9 15 21 25 10 3 13 28 2 24 4 13 22 1 16 1819
Credential Rate – Youth 12 19 8 18 1122 27 3 1 9 10 4 6 7 28 23 17 26 24 20 16 21 13 15 25 2 5 1420
Average Group Rank: 19.36 20.36 14.79 16.29 13.21 21.79 19.86 14.36 15.79 19.00 19.64 22.57 22.29 10.64 18.43 15.71 16.43 10.36 18.07 22.29 13.71 23.86 10.21 25.79 20.36 8.00 18.93 14.71
Average Rank Per Performance Measure: 17.78 18.72 14.56 16.89 14.78 19.61 16.67 15.89 15.00 18.94 17.89 21.44 21.56 10.22 18.56 15.00 16.67 10.56 16.39 20.22 14.06 21.11 11.56 23.94 18.72 7.83 18.11 16.11
16 20 6 15 7 23 13 10 8 22 17 26 27 2 19 8 13 3 12 24 5 25 4 28 20 1 18 11Overall Board Ranking:June 2017
Final Release
4 3 7 1 2 6 5Large Board Ranking:June 2017
Final Release
North Central Texas Workforce Development Board

PERFORMANCE MEASURES STATUS SUMMARY
(YEAR-TO-DATE)MONTH: June 2017 RELEASE: Final Release
North Central Texas Workforce Development Board's current status is reflected by the highlight.
Performance Measure
Positive Performance
(+P)
Negative Performance
(-P)
Meeting Performance
(+P)
1 - Reemployment and Employer Engagement Measures
9 18 1Claimant Reemployment within 10 Weeks1
9 17 2# of Employers Receiving Workforce Assistance2
2 - Program Participation Measures
15 12 1Choices Full Work Rate - All Family Total3
2 12 14Avg # Children Served Per Day - Discretionary (Discrete Mo5
3 - WIOA Outcome Measures
20 8Employed/Enrolled Q2 Post Exit – All Participants6
10 18Employed/Enrolled Q2-Q4 Post Exit – All Participants7
27 1Median Earnings Q2 Post Exit – All Participants8
4 19 5Employed Q2 Post Exit – Adult10
8 15 5Employed Q4 Post Exit – Adult11
15 3 10Median Earnings Q2 Post Exit – Adult12
mnichola
Highlight
mnichola
Highlight
mnichola
Highlight
mnichola
Highlight
mnichola
Highlight
mnichola
Highlight
mnichola
Highlight
mnichola
Highlight
mnichola
Highlight
mnichola
Highlight

PERFORMANCE MEASURES STATUS SUMMARY
(YEAR-TO-DATE)MONTH: June 2017 RELEASE: Final Release
North Central Texas Workforce Development Board's current status is reflected by the highlight.
Performance Measure
Positive Performance
(+P)
Negative Performance
(-P)
Meeting Performance
(+P)
12 12 4Credential Rate – Adult13
6 17 5Employed Q2 Post Exit – DW14
15 9 4Employed Q4 Post Exit – DW15
20 4 4Median Earnings Q2 Post Exit – DW16
12 7 9Credential Rate – DW17
19 7 2Employed/Enrolled Q2 Post Exit – Youth18
7 16 5Employed/Enrolled Q4 Post Exit – Youth19
14 5 9Credential Rate – Youth20
mnichola
Highlight
mnichola
Highlight
mnichola
Highlight
mnichola
Highlight
mnichola
Highlight
mnichola
Highlight
mnichola
Highlight
mnichola
Highlight

Reemployment and Employer Engagement Measures
Cu
rren
t
Per
form
ance
Per
cen
t o
f
Tar
get
Per
form
ance
Sta
tus
Ran
k
Cu
rren
t
Per
form
ance
Per
cen
t o
f
Tar
get
Per
form
ance
Sta
tus
Ran
k
Cu
rren
t
Per
form
ance
Per
cen
t o
f
Tar
get
Per
form
ance
Sta
tus
Ran
k
Cu
rren
t
Per
form
ance
Per
cen
t o
f
Tar
get
Per
form
ance
Sta
tus
Ran
k
Cu
rren
t
Per
form
ance
Per
cen
t o
f
Tar
get
Per
form
ance
Sta
tus
Ran
k
Cu
rren
t
Per
form
ance
Per
cen
t o
f
Tar
get
Per
form
ance
Sta
tus
Ran
k
Cu
rren
t
Per
form
ance
Per
cen
t o
f
Tar
get
Per
form
ance
Sta
tus
Ran
k
Cu
rren
t
Per
form
ance
Per
cen
t o
f
Tar
get
Per
form
ance
Sta
tus
Ran
k
Cu
rren
t
Per
form
ance
Per
cen
t o
f
Tar
get
Per
form
ance
Sta
tus
Ran
k
Claimant Reemployment within 10 Weeks 52.50% 52.94% 100.84% MP 18 53.07% 101.28% MP 21 53.27% 101.66% MP 20 52.62% 100.23% MP 21 52.64% 100.27% MP 18 52.36% 99.73% MP 20 52.31% 99.64% MP 20 52.84% 100.65% MP 19 52.92% 100.08% MP 19 0.08% 1
# of Employers Receiving Workforce Assistance 8,193 2,368 N/A N/A N/A 3,040 104.90% MP 15 3,653 106.59% +P 11 4,552 115.04% +P 5 5,292 117.97% +P 4 5,971 119.04% +P 3 6,534 117.84% +P 3 7,118 117.17% +P 4 7,599 115.07% +P 4 -2.10% -1
Program Participation Measures
TA
RG
ET
Cu
rren
t
Per
form
ance
Per
cen
t o
f
Tar
get
Per
form
ance
Sta
tus
Ran
k
Cu
rren
t
Per
form
ance
Per
cen
t o
f
Tar
get
Per
form
ance
Sta
tus
Ran
k
Cu
rren
t
Per
form
ance
Per
cen
t o
f
Tar
get
Per
form
ance
Sta
tus
Ran
k
Cu
rren
t
Per
form
ance
Per
cen
t o
f
Tar
get
Per
form
ance
Sta
tus
Ran
k
Cu
rren
t
Per
form
ance
Per
cen
t o
f
Tar
get
Per
form
ance
Sta
tus
Ran
k
Cu
rren
t
Per
form
ance
Per
cen
t o
f
Tar
get
Per
form
ance
Sta
tus
Ran
k
Cu
rren
t
Per
form
ance
Per
cen
t o
f
Tar
get
Per
form
ance
Sta
tus
Ran
k
Cu
rren
t
Per
form
ance
Per
cen
t o
f
Tar
get
Per
form
ance
Sta
tus
Ran
k
Cu
rren
t
Per
form
ance
Per
cen
t o
f
Tar
get
Per
form
ance
Sta
tus
Ran
k
Choices Full Work Rate - All Families 50.00% 60.00% 120.00% +P 9 57.29% 114.58% +P 10 56.58% 113.16% +P 10 56.27% 112.54% +P 10 55.55% 111.10% +P 9 55.42% 110.84% +P 10 57.12% 114.24% +P 7 57.79% 115.58% +P 7 58.37% 116.74% +P 8 0.58% 0
Avg # Children Served Per Day - Discretionary 4,860 5,160 106.17% +P N/A 5,092 104.77% MP N/A 5,020 103.29% N/A N/A 4,976 102.39% N/A N/A 4,950 101.85% N/A N/A 4,918 N/A N/A N/A 4,889 N/A N/A N/A 4,851 N/A N/A N/A 4,811 N/A N/A N/A -40 N/A
Avg # Children Served Per Day - Discretionary (Discrete Month) 4,860 5,160 N/A N/A N/A 5,028 N/A N/A N/A 4,879 N/A N/A N/A 4,845 N/A N/A N/A 4,830 N/A N/A N/A 4,769 98.13% +P 4 4,691 96.52% +P 11 4,598 94.61% -P 15 4,500 92.59% -P 19 -98 -4
Common Measures ‐ Outcomes
TA
RG
ET
Cu
rren
t
Per
form
ance
Per
cen
t o
f
Tar
get
Per
form
ance
Sta
tus
Ran
k
Cu
rren
t
Per
form
ance
Per
cen
t o
f
Tar
get
Per
form
ance
Sta
tus
Ran
k
Cu
rren
t
Per
form
ance
Per
cen
t o
f
Tar
get
Per
form
ance
Sta
tus
Ran
k
Cu
rren
t
Per
form
ance
Per
cen
t o
f
Tar
get
Per
form
ance
Sta
tus
Ran
k
Cu
rren
t
Per
form
ance
Per
cen
t o
f
Tar
get
Per
form
ance
Sta
tus
Ran
k
Cu
rren
t
Per
form
ance
Per
cen
t o
f
Tar
get
Per
form
ance
Sta
tus
Ran
k
Cu
rren
t
Per
form
ance
Per
cen
t o
f
Tar
get
Per
form
ance
Sta
tus
Ran
k
Cu
rren
t
Per
form
ance
Per
cen
t o
f
Tar
get
Per
form
ance
Sta
tus
Ran
k
Cu
rren
t
Per
form
ance
Per
cen
t o
f
Tar
get
Per
form
ance
Sta
tus
Ran
k
Employed/Enrolled Q2 Post Exit – All Participants 61.00% 67.08% 109.97% +P N/A 67.08% 109.97% +P N/A 67.99% 111.46% +P 2 69.38% 113.74% +P 1 69.38% 113.74% +P 1 67.14% 110.07% +P 3 67.23% 110.21% +P 3 67.26% 110.26% +P 3 67.26% 110.26% +P 3 0.00% 0
Employed/Enrolled Q2-Q4 Post Exit – All Participants 81.40% 85.38% 104.89% MP N/A 85.38% 104.89% MP N/A 85.63% 105.20% +P 7 85.54% 105.09% +P 8 85.57% 105.12% +P 9 85.80% 105.41% +P 8 85.82% 105.43% +P 9 85.85% 105.47% +P 9 85.82% 105.43% +P 6 -0.03% 3
Median Earnings Q2 Post Exit – All Participants $5,010.00 $5,230.64 104.40% MP N/A $5,230.64 104.40% MP N/A $5,523.37 110.25% +P 10 N/A N/A N/A N/A $5,972.17 119.21% +P 14 $5,797.41 115.71% +P 9 $5,798.49 115.74% +P 9 $5,799.47 115.76% +P 9 $5,964.65 119.05% +P 13 $165.18 -4
Credential Rate – All Participants N/A 39.58% N/A N/A N/A 39.58% N/A N/A N/A 59.45% N/A N/A N/A 58.44% N/A N/A N/A 58.44% N/A N/A N/A 51.61% N/A N/A N/A 52.09% N/A N/A N/A 52.56% N/A N/A N/A 52.90% N/A N/A N/A 0.34% N/A
Employed Q2 Post Exit – Adult 77.70% 76.62% 98.61% MP N/A 76.62% 98.61% MP N/A 78.60% 101.16% MP 15 78.60% 101.16% MP 15 78.60% 101.16% MP 15 75.91% 97.70% MP 18 76.22% 98.10% MP 17 76.22% 98.10% MP 18 75.52% 97.19% MP 22 -0.70% -4
Employed Q4 Post Exit – Adult 75.40% 68.89% 91.37% -P N/A 68.89% 91.37% -P N/A 70.00% 92.84% -P 22 70.37% 93.33% -P 22 70.37% 93.33% -P 22 73.82% 97.90% MP 20 73.82% 97.90% MP 21 73.82% 97.90% MP 21 75.44% 100.05% MP 18 1.62% 3
Median Earnings Q2 Post Exit – Adult $4,490.00 $4,858.43 108.21% +P N/A $4,858.43 108.21% +P N/A $5,125.32 114.15% +P 10 N/A N/A N/A N/A $5,518.02 122.90% +P 9 $5,281.67 117.63% +P 8 $5,281.67 117.63% +P 8 $5,281.67 117.63% +P 8 $6,091.33 135.66% +P 7 $809.66 1
Credential Rate – Adult 67.80% 62.50% 92.18% -P N/A 62.50% 92.18% -P N/A 68.47% 100.99% MP 17 68.47% 100.99% MP 17 68.47% 100.99% MP 17 70.30% 103.69% MP 17 70.30% 103.69% MP 17 70.91% 104.59% MP 17 73.00% 107.67% +P 9 2.09% 8
Employed Q2 Post Exit – DW 80.00% 76.24% 95.30% MP N/A 76.24% 95.30% MP N/A 80.87% 101.09% MP 10 81.42% 101.78% MP 10 81.42% 101.78% MP 10 79.40% 99.25% MP 14 79.40% 99.25% MP 16 79.40% 99.25% MP 17 78.28% 97.85% MP 18 -1.12% -1
Employed Q4 Post Exit – DW 76.90% 78.69% 102.33% MP N/A 78.69% 102.33% MP N/A 82.52% 107.31% +P 10 82.52% 107.31% +P 10 82.52% 107.31% +P 10 83.24% 108.24% +P 8 83.24% 108.24% +P 9 83.24% 108.24% +P 9 84.11% 109.38% +P 9 0.87% 0
Median Earnings Q2 Post Exit – DW $7,130.00 $8,368.60 117.37% +P N/A $8,368.60 117.37% +P N/A $8,138.75 114.15% +P 9 N/A N/A N/A N/A $7,405.24 103.86% MP 15 $8,174.84 114.65% +P 12 $8,174.84 114.65% +P 12 $8,174.84 114.65% +P 12 $8,208.66 115.13% +P 25 $33.82 -13
Credential Rate – DW 64.40% 47.17% 73.25% -P N/A 47.17% 73.25% -P N/A 59.29% 92.07% -P 22 59.29% 92.07% -P 22 59.29% 92.07% -P 21 60.39% 93.77% -P 24 61.04% 94.78% -P 21 61.04% 94.78% -P 21 59.22% 91.96% -P 23 -1.82% -2
Employed/Enrolled Q2 Post Exit – Youth 68.80% 73.13% 106.29% +P N/A 73.13% 106.29% +P N/A 68.80% 104.42% MP 16 71.84% 104.42% MP 16 71.84% 104.42% MP 16 71.52% 103.95% MP 15 71.52% 103.95% MP 16 72.19% 104.93% MP 16 71.24% 105.29% +P 19 -0.95% -3
Employed/Enrolled Q4 Post Exit – Youth 82.00% N/A N/A N/A N/A N/A N/A N/A N/A 68.22% 83.20% -P 25 68.22% 83.20% -P 25 68.22% 83.20% -P 26 73.41% 89.52% -P 26 74.42% 90.76% -P 26 74.42% 90.76% -P 26 80.82% 91.46% -P 25 6.40% 1
Credential Rate – Youth 66.60% 53.33% 80.08% -P N/A 53.33% 80.08% -P N/A 54.55% 81.91% -P 20 54.55% 81.91% -P 20 54.55% 81.91% -P 20 58.26% 87.48% -P 23 58.26% 87.48% -P 24 58.26% 87.48% -P 25 64.85% 92.48% -P 23 6.59% 2
NOV 2016
FINAL RELEASE
MAY 2017
FINAL RELEASEFINAL RELEASE
MAR 2017
FINAL RELEASE
JUN 2017
FINAL RELEASE
BOARD BCY17 - YTD CONTRACTED PERFORMANCE MEASURES REPORT
Final Release - June 2017 Monthly Performance Report
PE
RF
OR
MA
NC
E
CH
AN
GE
RA
NK
ING
CH
AN
GE
EO
Y T
AR
GE
T OCT 2016
FINAL RELEASE
DEC 2016
FINAL RELEASE
JAN 2017
FINAL RELEASE
FEB 2017
FINAL RELEASE
APR 2017

BCY17 - Final Release June 2017
Performance Report (MPR) Overview

BCY17 – June 2017 Final Release MPR
“Meeting Performance (MP)” or “Positive Performance (+P)” within 14 of 18
formally contracted performance measures for which we have all available data:
Performance Status # of Measures
Positive Performance (+P) 10
Meeting Performance (MP) 4
Negative Performance (-P) 4

REEMPLOYMENT & EMPLOYER ENGAGEMENT MEASURES
PERFORMANCE MEASURES TARGETCURRENT
PERFORMANCE
PERCENTAGE OF
CURRENT TARGETNUMERATOR
(Successful Outcomes)
DENOMINATOR (Population)
PERFORMANCE
STATUS
PERFORMANCE
CHANGE FROM
PREVIOUS MONTH
Claimants Reemployed within 10 Weeks
52.50% 52.92% 100.80% 14,424 27,256 MP +0.08%
# of Employers Receiving Workforce Assistance
8,193 (EOY)6,604
(Month)7,599 115.17% - - +P -2.10%
BCY17 – June 2017 Final Release MPR

PROGRAM PARTICIPATION MEASURES
PERFORMANCE MEASURES TARGETCURRENT
PERFORMANCE
PERCENTAGE OF
CURRENT TARGETNUMERATOR
(Successful Outcomes)
DENOMINATOR (Population)
PERFORMANCE
STATUS
PERFORMANCE
CHANGE FROM
PREVIOUS MONTH
Choices Full Work Rate - All Family Total
50.00% 58.37% 116.74% 97 166 +P +0.58%
Avg # Children Served Per Day ‐ Discretionary
- 4,811 - 937,087 195 - -40
Avg # Children Served Per Day -Discretionary (Discrete Month)
4,860 4,500 92.59% 98,992 22 -P -98
BCY17 – June 2017 Final Release MPR

WIOA OUTCOME MEASURES
PERFORMANCE MEASURES TARGETCURRENT
PERFORMANCE
PERCENTAGE OF
CURRENT TARGETNUMERATOR
(Successful Outcomes)
DENOMINATOR (Population)
PERFORMANCE
STATUS
PERFORMANCE
CHANGE FROM
PREVIOUS MONTH
Employed/Enrolled Q2 Post Exit – All Participants
61.00% 67.26% 110.26% 27,066 40,238 +P 0.00%
Employed/Enrolled Q2-Q4 Post Exit – All Participants
81.40% 85.82% 105.43% 23,744 27,668 +P -0.03%
Median Earnings Q2 Post Exit – All Participants
$5,010.00 $5,964.65 119.05% - 26,650 +P +$165.19
Credential Rate – All Participants - 52.90% - 146 276 - +0.34%
Employed Q2 Post Exit – Adult 77.70% 75.52% 97.19% 364 482 MP -0.70%
Employed Q4 Post Exit – Adult 75.40% 75.44% 100.05% 387 513 MP +1.62%
Median Earnings Q2 Post Exit – Adult $4,490.00 $6,091.33 135.66% - 358 +P +$809.66
BCY17 – June 2017 Final Release MPR

WIOA OUTCOME MEASURES
PERFORMANCE MEASURES TARGETCURRENT
PERFORMANCE
PERCENTAGE OF
CURRENT TARGETNUMERATOR
(Successful Outcomes)
DENOMINATOR (Population)
PERFORMANCE
STATUS
PERFORMANCE
CHANGE FROM
PREVIOUS MONTH
Credential Rate – Adult 67.80% 73.00% 107.67% 146 200 +P +2.09%
Employed Q2 Post Exit – DW 80.00% 78.28% 97.85% 292 373 MP -1.12%
Employed Q4 Post Exit – DW 76.90% 84.11% 109.38% 360 428 +P +0.87%
Median Earnings Q2 Post Exit – DW $7,130.00 $8,208.66 115.13% - 292 +P +$33.82
Credential Rate – DW 64.40% 59.22% 91.96% 122 206 -P -1.82%
Employed/Enrolled Q2 Post Exit – Youth 68.80% 72.44% 105.29% 163 225 +P -0.95%
Employed/Enrolled Q4 Post Exit – Youth 82.00% 75.00% 91.46% 156 208 -P +6.40%
Credential Rate – Youth 66.60% 61.59% 92.48% 93 151 -P +6.59%
BCY17 – June 2017 Final Release MPR

North Central is currently ranked 8th of 28 Boards and 2nd of 7 Large Boards.
BOARD
AVERAGE RANK PER
FORMALLY CONTRACTED
PERFORMANCE MEASURE
ALL BOARDS RANKLARGE BOARDS
RANK
Alamo 17.78 16 4
Dallas County 15.89 10 3
Gulf Coast 21.44 26 7
Lower Rio Grande 10.22 2 1
North Central Texas 15.00 8 2
Tarrant County 18.72 20 6
Borderplex 18.11 18 5
BCY17 – June 2017 Final Release MPR

QUESTIONS?

EXECUTIVE SUMMARY
July 2017
Workforce Board, Staff, and Centralized Functions As of July (tenth month of FY 2017) the Board’s expenditures are approximately 9.3%, or $992,000 below established benchmarks for this point of the fiscal year. Staffing Update A portion of the lower than anticipated expenditure levels are attributable to the personnel costs. These costs (salaries, fringe, and indirect costs) are approximately 4.6% or $259,000 behind July targets. This is primarily due to the following:
Date Date Total Months
Position Vacant Filled Vacant in FY
2017
Sr. Database Specialist 10\01\16 Open 10.1 Operations Specialist 10\01\16 Open 10.1 Workforce Facilities Coordinator 10\01\16 Open 5.8 Workforce Facilities Coordinator 10\01\16 1\03\17 3.1 Intern 10\01\16 10\10\16 .3 Total 29.4
In addition to the above, the RIS (technology) group is approximately 11.1% behind established targets due to technology staff charging their labor to the Board at a lower rate than anticipated. It’s currently projected the attrition will offset the costs of the recently approved Continuous Improvement Process Specialist position and other projects as identified. Equipment An equipment budget of $641,400 is include within the FY 2017 workforce budget. The budget was primarily for workforce center computer replacements and the workforce share of the NCTCOG infrastructure costs for items including servers, switches, routers, and security appliances. As of July, the equipment category was approximately 26.7% or $171,000 behind target. It’s currently estimated that a large portion of these projects will be completed by the fiscal year end or transferred to assist with other Workforce projects.

Marketing There was $314,000 included within the FY 2017 budget for marketing projects. Through the month of July, these projects were approximately 56.5% or $177,000 behind targets. The majority of the remaining unspent balance, approximately $230,000, has been obligated for marketing projects that are in progress but are running behind schedule. The funds will be carried over to pay for the projects once they are completed in early FY 2018. Child Care Quality Improvement The Board approved $772,213 within the FY 2017 budget to provide professional development training, equipment, and materials for selected child care staff and child care centers located within the Board’s fourteen (14) county region. As of July 2017, these expenditures were approximately 10.0% or $77,000 behind established targets. Board staff anticipate these funds being fully expended prior to the end of the fiscal year. Special Projects Update $318,775 of special projects were approved within the FY 2017 budget for the document management system. The expenditures are approximately 46.6%, or $117,263 behind target but are anticipated to approach closer to target levels by the end of the fiscal year as more consulting time is required to help complete the final steps to the process. The current status of the child care process conversion to a paperless document management system (laserfiche) is as follows:
Development-completed User acceptance testing-completed Creation of training material-September 15, 2017 User Training-November 3, 2017 Implementation-November 6, 2017
Workforce Center Contractor As of July (tenth month of ResCare’s contract) expenditures are behind established targets for the 4th quarter of FY 2017 by approximately 13.3% or $7.3 million. Below is a summary of grant noteworthy information:
• Child Care (Direct Care and Local Match) - Expenditures are behind established targets by approximately 18.6% or $6.2 million. TWC instructed the Board’s to cease any new enrollments for at-risk child care cases as of August 1, 2016 and that mandate is still in effect. New enrollments are not permissible by TWC until current enrollments numbers drop below 100.0% of state targets for average number of children served per day.
As of July, ResCare is approximately 300 children per day behind the target number of average children served per day. ResCare is enrolling additional children and will continue until they reach the 100% target level and will make

every effort to maintain enrollments at that level. It’s currently projected that the target number of children per day will be reached by the end of FY 2017.
• WIOA –Expenditures are behind target by approximately 3.8% or $260,000. Board staff allocated ResCare and additional $325,000 of FY 2016 carry over funds in June 2017 that had previously been unallocated. The additional funds are expected to be primarily utilized for additional participant funds. ResCare's expenditures are expected to approach closer to target levels by the end of FY 2017 as they have the opportunity to expend the additional allocation.
• National Dislocated Worker Grant (NDW) Oil\Gas- The main objective of the grant is to serve dislocated workers impacted by the downturn in the oil and gas and related industries. This grant was issued by TWC to the Board on November 30, 2016. The grant period is for approximately twenty seven (27) months, October 11, 2016-December 31, 2018. Expenditures are behind established targets by approximately 12.3% or $115,000. The current job market within the oil and gas industry has improved substantially since this grant application was initiated which has caused the number of participants to be lower than anticipated.
The Board staff will closely monitor expenditure rates of both the Board and its workforce service delivery contractor for FY 2017. Board staff will work diligently with our workforce contractor, ResCare, to ensure that the workforce programs are operating as effectively and efficiently as possible.

1
STATEMENT OF GRANT EXPENDITURE SUMMARY
Contract to Date
# Funding Source Budget% of FY
BUDGET Total Expend. % Expended TWC Target % Difference
FY 2018 Grants
1 WIOA 9,172,574 100.00% 4,079 0.04% 6.29% (6.24)%
Total FY 2018 Grants 9,172,574 100.00% 4,079 0.04% 6.29% (6.24)%
FY 2017 Grants
2 CHILD CARE 42,519,838 70.12% 28,301,231 66.56% 87.39% (20.83)%
3 WIOA 11,420,849 18.83% 8,484,911 74.29% 88.11% (13.82)%
4 SNAP 797,937 1.32% 631,932 79.20% 83.33% (4.14)%
5 TANF 3,658,989 6.03% 2,631,342 71.91% 83.43% (11.52)%
6 RESOURCE ADMINISTRATION GRANTS 945,641 1.56% 593,667 62.78% 83.99% (21.21)%
7 TAA 799,496 1.32% 275,493 34.46% 83.33% (48.88)%
8 Other 498,800 0.82% 176,974 35.48% 73.98% (38.50)%
Total FY 2017 Grants 60,641,550 100.00% 41,095,550 67.77% 87.02% (19.25)%
FY 2016 Grants
9 CHILD CARE 36,941,289 69.69% 36,143,694 97.84% 100.00% (2.16)%
10 WIOA 11,226,647 21.18% 11,226,647 100.00% 100.00% 0.00%
11 TANF 3,269,759 6.17% 3,250,982 99.43% 100.00% (0.57)%
12 RESOURCE ADMINISTRATION GRANTS 742,384 1.40% 742,384 100.00% 100.00% 0.00%
13 TAA 519,357 0.98% 406,604 78.29% 100.00% (21.71)%
14 OTHER 308,594 0.58% 170,426 55.23% 90.91% (35.69)%
Total FY 2016 Grants 53,008,030 100.00% 51,940,736 97.99% 99.95% (1.96)%
FY 2015 Grants
15 Other 912,251 100.00% 883,662 96.87% 100.00% (3.13)%
Total FY 2015 Grants 912,251 100.00% 883,662 96.87% 100.00% (3.13)%
TOTALS 123,734,405 100.00% 93,924,027 75.91% 86.67% (10.76)%
Child Care Local Match
25,214 819822.00%
7,879 1692197.00%
9,004 3415926.00%
117,776 6306.00% ##
0 y
behind WIA ##
#VALUE! WNi's child care ##
majority of its The Board
The Board
#VALUE! 5934251.00% ##
July 31, 2017
7,943,982 39,755,901
2,774,254 15,163,981
0%
10%
20%
30%
40%
50%
60%
70%
80%
90%
100%
BOARD BUD. $10,718,235TARGET 83.4%
CONT. BUD. $54,919,883TARGET 85.64%
JULYEXPENDITURE SUMMARY
RemainingBalance
ActualExpenditures
0%
10%
20%
30%
40%
50%
60%
70%
80%
90%
100%
Oct Nov Dec Jan Feb Mar Apr May June July Aug Sept
Board Exp. Summary
Board
Board Target
0%
10%
20%
30%
40%
50%
60%
70%
80%
90%
100%
Oct Nov Dec Jan Feb Mar Apr May June July Aug Sept
Contractor Exp. Summary
Contractor
Cont. Target

2
State Targets
Item No. 1st 2nd 3rd 4th End of Grant Funding SourceBeginning
Date Ending Date Budget% of Total FY
Budget Total Expend. Balance % Expended TWC Target % Difference
Fiscal Year 2018
1 25.00% 100.00% WIOA YOUTH 07/01/17 06/30/19 3,144,040 34.28% 0 3,144,040 0.00% 8.33% (8.33)%
2 14.98% 100.00% WIOA ADULT 07/01/17 06/30/19 2,879,578 31.39% 0 2,879,578 0.00% 4.99% (4.99)%
3 16.12% 100.00% WIOA DISLOCATED 07/01/17 06/30/19 3,087,369 33.66% 0 3,087,369 0.00% 5.37% (5.37)%
4 25.00% 100.00% RAPID RESPONSE 08/01/17 07/31/18 61,587 0.67% 4,079 57,508 6.62% 8.33% (1.71)%
Totals 9,172,574 100.00% 4,079 9,168,495 0.04% 6.29% (6.24)%
Fiscal Year 2017
5 22.50% 45.00% 67.50% 100.00% 100.00% CHILD CARE DIRECT CARE 10/01/16 12/31/17 23,482,862 38.72% 16,852,768 6,630,094 71.77% 83.33% (11.57)%
6 100.00% 100.00% 100.00% 100.00% 100.00% CHILD CARE CCC 10/01/16 10/31/17 4,897,334 8.08% 4,897,334 0 100.00% 100.00% 0.00%
7 20.00% 40.00% 60.00% 80.00% 100.00% CHILD CARE LOCAL MATCH 10/01/16 12/31/17 7,405,985 12.21% 24 7,405,961 0.00% 83.33% (83.33)%
8 100.00% 100.00% 100.00% 100.00% 100.00% CHILDCARE PRS 09/01/16 08/31/17 5,456,136 9.00% 5,456,136 0 100.00% 100.00% 0.00%
9 25.00% 50.00% 75.00% 100.00% 100.00% CHILDCARE QUALITY 10/01/16 10/31/17 1,058,768 1.75% 955,440 103,328 90.24% 83.33% 6.91%
10 25.00% 50.00% 75.00% 100.00% 100.00% CHILD CARE ATTENDANCE AUTOMATION SERVICE 10/01/16 09/30/17 218,753 0.36% 139,528 79,225 63.78% 83.24% (19.46)%
11 40.00% 60.00% 80.00% 100.00% 100.00% WIOA YOUTH 07/01/16 06/30/18 2,946,778 4.86% 2,707,887 238,891 91.89% 100.00% (8.11)%
12 40.00% 60.00% 80.00% 100.00% 100.00% WIOA ADULT 07/01/16 06/30/18 2,701,506 4.45% 2,232,602 468,904 82.64% 100.00% (17.36)%
13 40.00% 60.00% 80.00% 100.00% 100.00% WIOA DISLOCATED 07/01/16 06/30/18 3,446,271 5.68% 2,840,555 605,716 82.42% 100.00% (17.58)%
14 25.00% 50.00% 75.00% 100.00% 100.00% WIOA STATEWIDE 10/01/16 09/30/17 428,797 0.71% 414,911 13,886 96.76% 83.24% 13.52%
15 50.00% 75.00% 100.00% 100.00% 100.00% WIOA RAPID RESPONSE 07/01/16 06/30/17 67,273 0.11% 52,013 15,260 77.32% 100.00% (22.68)%
16 22.50% 45.00% 67.50% 100.00% 100.00% SNAP 10/01/16 09/30/17 797,937 1.32% 631,932 166,005 79.20% 83.33% (4.14)%
17 22.50% 45.00% 67.50% 100.00% 100.00% TANF/CHOICE 10/01/16 10/31/17 3,359,961 5.54% 2,482,980 876,981 73.90% 83.33% (9.43)%
18 25.00% 50.00% 75.00% 100.00% 100.00% TWC RAG ISAMS 10/01/16 09/30/17 19,477 0.03% 23,363 -3,886 119.95% 83.24% 36.71%
19 22.50% 45.00% 67.50% 100.00% 100.00% EMPLOYMENT SERVICES 10/01/16 12/31/17 705,486 1.16% 415,416 290,070 58.88% 83.33% (24.45)%
20 22.50% 45.00% 67.50% 100.00% 100.00% TRADE ACT SERVICES 10/01/16 12/31/17 799,496 1.32% 275,493 524,003 34.46% 83.33% (48.88)%
21 25.00% 50.00% 75.00% 100.00% 100.00% VETERAN RESOURCE 10/01/16 09/30/17 143,000 0.24% 94,276 48,724 65.93% 83.24% (17.31)%
22 30.77% 53.85% 76.92% 100.00% 100.00% NONCUSTODIAL PARENT 09/01/16 09/30/17 299,028 0.49% 148,363 150,665 49.61% 84.52% (34.90)%
23 33.33% 25.00% 25.00% 16.67% 100.00% INFRASTRUCTURE SUPPORT SERVICES CONTRACT 09/01/16 08/31/17 77,678 0.13% 60,612 17,066 78.03% 91.48% (13.45)%
24 10.71% 21.43% 32.14% 35.71% 100.00% NATIONAL DISLOCATED WORKER GRANT-OIL AND GAS 10/11/16 12/31/18 1,830,224 3.02% 236,943 1,593,281 12.95% 29.76% (16.82)%
25 25.00% 50.00% 75.00% 100.00% BOARD SERVICE AWARD 01/01/17 12/31/17 30,000 0.05% 0 30,000 0.00% 57.97% (57.97)%
26 50.00% 100.00% 100.00% SUMMER EARN AND LEARN 05/01/17 08/31/17 468,800 0.77% 176,974 291,826 37.75% 75.0% (37.25)%
Totals 60,641,550 100.00% 41,095,550 19,546,001 67.77% 87.02% (19.25)%
Fiscal Year 2016
27 100.00% 100.00% CHILD CARE DIRECT CARE 10/01/15 12/31/16 28,843,722 54.41% 28,843,722 0 100.00% 100.00% 0.00%
28 100.00% 100.00% CHILD CARE LOCAL MATCH 10/01/15 12/31/16 6,857,099 12.94% 6,165,194 691,905 89.91% 100.00% (10.09)%
29 100.00% 100.00% CHILD CARE QUALITY 10/01/15 10/31/16 1,015,428 1.92% 910,980 104,448 89.71% 100.00% (10.29)%
30 100.00% 100.00% CHILD CARE ATTENDANCE AUTOMATION SERVICE 10/01/15 11/30/16 225,040 0.42% 223,799 1,241 99.45% 100.00% (0.55)%
31 100.00% 100.00% WIOA Youth 07/01/15 06/30/17 3,667,367 6.92% 3,667,367 0 100.00% 100.00% 0.00%
32 100.00% 100.00% WIOA Adult 07/01/15 06/30/17 3,359,516 6.34% 3,359,516 0 100.00% 100.00% 0.00%
33 100.00% 100.00% WIOA Dislocated 07/01/15 06/30/17 4,199,764 7.92% 4,199,764 0 100.00% 100.00% 0.00%
34 100.00% 100.00% TANF/CHOICE 10/01/15 10/31/16 3,269,759 6.17% 3,250,982 18,777 99.43% 100.00% (0.57)%
35 100.00% 100.00% EMPLOYMENT SERVICES 10/01/15 12/31/16 742,384 1.40% 742,384 0 100.00% 100.00% 0.00%
36 100.00% 100.00% TRADE ACT SERVICES 10/01/15 12/31/16 519,357 0.98% 406,604 112,753 78.29% 100.00% (21.71)%
37 45.45% 63.64% 81.82% 100.00% 100.00% WORKFORCE COMMISSION INITIATIVES 05/17/16 09/30/17 231,331 0.44% 112,892 118,439 48.80% 87.88% (39.08)%
38 100.00% 100.00% WORKFORCE COMMISSION INITIATIVES 10/01/15 12/31/16 77,263 0.15% 57,533 19,730 74.46% 100.00% (25.54)%
Totals 53,008,030 100.00% 51,940,736 1,067,294 97.99% 99.95% (1.96)%
Fiscal Year 2015
39 100.00% 100.00% INFANT AND TODDLER CAPACITY AND INCLUSION ASSISTANCE 01/01/15 12/31/16 561,462 61.55% 542,162 19,300 96.56% 100.00% (3.44)%
40 100.00% 100.00% INDUSTRY-RECOGNIZED SKILLS CERTIFICATION INITIATIVE 01/06/15 12/31/16 165,277 18.12% 165,276 1 100.00% 100.00% (0.00)%
41 100.00% 100.00% LOCAL INNOVATION PARTNERSHIP GRANTS 07/01/15 12/31/16 110,512 12.11% 101,223 9,289 91.59% 100.00% (8.41)%
42 100.00% 100.00% HIGH DEMAND JOB TRAINING PROGRAM 07/15/15 10/31/16 75,000 8.22% 75,000 0 100.00% 100.00% 0.00%
Totals 912,251 100.00% 883,662 28,589 96.87% 100.00% (3.13)%
Grant Totals 123,734,405 93,924,027 29,810,379 75.91% 86.67% (10.76)%
STATEMENT OF GRANT EXPENDITURES DETAIL
Contract to DateJuly 31, 2017

3
STATEMENT OF GRANT EXPENDITURES DETAIL
Contract to DateJuly 31, 2017
Notes
5,7,27,28 CHILD CARE DIRECT CARE\LOCAL MATCH
10 CHILD CARE ATTENDANCE AUTOMATED SERVICE
1,2,3,11,12,13,14 WIA ADULT\DISLOCATED\YOUTH
17 TANF
19 EMPLOYMENT SERVICES
20,36 TAA
21 VETERAN
22 NONCUSTODIAL PARENT
23 INFRASTRUCTURE SUPPORT SERVICES CONTRACT
24 NATIONAL DISLOCATED WORKER GRANT-OIL AND GAS
25 BOARD SERVICE AWARD
26 SUMMER EARN AND LEARN
38 WORKFORCE COMMISSION INITIATES
ResCare is currently behind target by approximately 7.1% or 34,000. Also, the Boards expenditures are behind
target by approximately 7.3% or 16,000 due to operational expenditures for budget categories such as personnel,
travel, marketing, equipment, and special projects incurring lower than anticipated expenditure amounts. The
Board's expenditures, like ResCare's, are expected to approach closer to target levels by the end of FY 2017.
Grant balances as of 9\30\17 are projected to be expended prior to grant year end, 12\31\17, in the form of carry
over for FY 2018.
This funding source is utilized to serve individuals who have lost their employment due to their jobs being
transferred outside of the U.S. Our Board area has not encountered a significant number of these customers
during FY 2016 and FY 2017 which is the primary reason the FY 2016 grant was not fully expended prior to the end
of the grant term and that the FY 2017 grant is significantly behind target. Board staff allocated an additional
$250,000 in June 2017. These funds were FY 2016 carry over funds previously unallocated. At this point within
the fiscal year, it is not anticipated that all of the grant funds will be expended prior to grant year end.
The number of participants available to serve within this funding source has been lower that anticipated. It is
currently projected that this trend will continue throughout the life of this grant resulting in unspent funding at grant
year end.
ResCare is currently behind current expenditure targets by 3.8% or 260,000 . Board staff allocated ResCare and
additional $325,000 of FY 2016 carry over funds in June 2017 that had previously been unallocated that are
expected to be primarily utilized for additional participant funds. ResCare's expenditures are expected to approach
closer to target levels by the end of FY 2017 as they have the opportunity to expend the additional allocation.
In addition, the Boards expenditures are behind target by approximately 5.7% or 234,000 due to operational
expenditures for budget categories such as personnel, travel, marketing, equipment, and special projects incurring
lower than anticipated expenditure amounts. The Board's expenditures, like ResCare's, are expected to approach
closer to target levels by the end of FY 2017. Grant balances as of 9\30\17 are projected to be expended prior to
grant year end, 6\30\18, in the form of carry over for FY 2018.
This grant is designated to help reemploy individuals who lost their jobs due to the decline in activity within the oil
and gas industry. Expenditures are expected to approach closer to targets by the end of the fourth quarter FY
2017 as additional participants are enrolled. Due to the situation in which the oil and gas industry has began to
experience an upturn in production, it has become more difficult to locate participants that meet this grants eligibility
criteria.
This award was received by TWC for our excellent business outreach activities. Projects are planned for the
funding and it should be fully expended by the end of the grant year.
This grant is a summer youth program specifically to provide employability skills training and paid work experience
for students with disabilities. Not as many individuals are projected to complete the program as was earlier
anticipated which should result in unexpended funds at grant year end. The Board staff only received
approximately three months of notice from TWC prior to the initiation of the FY 2017 program. Board staff
anticipate receiving more notice for the FY 2018 version of this program which should result in more youth served.
ResCare is behind expenditure targets by approximately 18.6% or $6.2 million. TWC has recently issued guidance
that allows the Board to increase child enrollments to the program if the Board has dropped below 100% of the FY
2017 target enrollment for average kids served per day as established by TWC. As of July, our Board areas is
approximately 300 children per day behind the target number of children to be served. ResCare has began
enrolling additional children and will continue until we reach the 100% target level and will make every effort to
maintain enrollments at that level. Due to the situation in which we cannot exceed the 100% target level, the Board
will continue to drop below expenditure targets throughout FY 2017 because of large amounts of carry over funds
available within FY 2017 totaling approximately $6.8 million. Unspent balances as of 9\30\17 will be carried into FY
2018 in the form of carry over. As much of the carry over as possible will be expended during FY 2018 prior to the
FY 2017 grant end date of 12\31\17.
TWC bundled several small contract initiatives within one contract, primarily including youth career fair; red, white,
and you; career in Texas; labor market career information; workforce accessibility standards; and AEL integration.
Expenditures are projected to approach closer to target levels by the end of the 4th quarter of FY 2017 as the
individual projects are fully completed.
This grant is utilized to pay for the 10 veteran staff's share of the workforce center infrastructure costs (mainly rent,
utilities, copier, postage, and telephone costs). ResCare is currently reviewing their allocation plan to determine if
costs are being allocated to this grant accurately.
This grant is utilized to pay for the monthly costs of the swipe card system located within the child care centers
which receive funding from the North Central Board. At this time, the billings for this service are behind schedule
and are projected to approach closer to targets once the final fiscal year's invoices are paid by year end.
ResCare is currently behind target by approximately 1.4% or 30,000. Also, the Boards expenditures are behind
target by approximately 8.1% or 99,000 due to operational expenditures for budget categories such as personnel,
travel, marketing, equipment, and special projects incurring lower than anticipated expenditure amounts. The
Board's expenditures, like ResCare's, are expected to approach closer to target levels by the end of FY 2017.
Grant balances as of 9\30\17 are projected to be expended prior to grant year end, 10\31\17, in the form of carry
over for FY 2018.
This funding supports the vocational rehabilitation staff located within the Waxahachie and Corsicana workforce
centers including one time costs for the initial integration within the workforce centers (including construction, data
lines, automatic door openers, and furniture) plus the ongoing support costs (including utilities, maintenance,
copiers, and postage). At this time, the one time expenditures have not totaled what was anticipated.

4
Workforce Center
Contractors
Other FY 2017
Contractors
Other FY 2017
Contractors
Other FY 2017
Contractors
Totals W\Out
Unallocated Funds
Totals With Unallocated
Funds
Operations
Special
Projects
Approved
Board Budget
Unallocated
Funds
Total Available
Board Funding ResCare Collin College Terrell ISD Ranger College Total Allocation Total Allocation
10/1/2016 10/1/2016 10/1/2016 10/1/2016 10/1/2016 10/1/2016 5/1/2017 10/1/2016 10/1/2016 10/1/2016 10/1/2016Grant 9/30/2017 9/30/2017 9/30/2017 9/30/2017 9/30/2017 9/30/2017 8/31/2017 10/31/2016 12/31/2016 9/30/2017 9/30/2017
Child Care Direct Care 3,458,764$ 227,669$ 3,686,433$ $379,177 4,065,610$ 19,712,424$ 23,398,857$ 23,778,034$
Child Care CCC 3,641,516 3,641,516 3,641,516
Child Care Quality 1,083,393 1,083,393$ 8,403 1,091,796 1,083,393 1,091,796
Child Care Local Match 0 13,905,985 13,905,985 13,905,985
Child Care PRS 235,000 235,000 235,000 4,100,000 4,335,000 4,335,000
WIOA Youth 1,064,091 11,227 1,075,319 101,300 1,176,618 2,135,061 3,210,380 3,311,679
WIOA Adult 999,888 13,655 1,013,543 111,349 1,124,892 1,980,610 2,994,153 3,105,502
WIOA Dislocated Workers 1,277,921 17,116 1,295,036 89,320 1,384,356 2,588,245 3,883,282 3,972,602
WIOA Rapid Response 0 0 0 0 67,274 67,274 67,274
WIOA Statewide 0 0 0 0 428,797 428,797 428,797Industry-Recognized Skills Certification Initiative 0 64,154 64,154 64,154
TWC RAG\ISAM 32,352 32,352 -12,875 19,477 32,352 19,477
NCP 74,358 74,358 25,617 99,975 219,536 293,894 319,511SNAP Employment & Training 314,685 4,648 319,333 20,137 339,470 612,802 932,135 952,273
TANF/CHOICES 1,203,274 15,521 1,218,795 38,050 1,256,845 2,330,054 3,548,849 3,586,899
Trade Act Services 3,763 3,763 59,064 62,827 860,793 864,556 923,620Employment Services 197,298 28,939 226,237 120,604 346,841 474,566 700,803 821,407
Veterans Resource Administration 31,488 0 31,488 13,705 45,193 98,498 129,986 143,691
WF Commission Initiatives 205,200 205,200 -22,404 182,796 8,332 213,532 191,128
Local Innovations Partnership Grant 0 0 39,840 39,840 39,840
National Dislocated Workforce Grant-Oil and Gas 196,962 196,962 678,177 875,139 955,085 1,152,047 1,830,224
Summer Earn and Learn 19,800 19,800 19,933 39,733 351,827 77,240 448,866 468,800
High Demand Job Training Program 20,891 20,891 20,891
Infrastructure Support Services Contract 1,223 1,223 1,223 27,600 28,823 28,823Child Care Attendance Automation 0 218,753 218,753 218,753
10,399,460$ 318,775$ 10,718,235$ 1,629,557$ 12,347,793$ 54,757,598$ 77,240$ 20,891$ 64,154$ 65,638,118$ 67,267,675$
Child Care Direct Care 2,514,281$ 38,232.48 2,552,513$ $15,322,088 17,874,601$ 17,874,601$
Child Care CCC 0 0 0 4,897,334 4,897,334 4,897,334
Infant \Toddler Capacity and Inclusion Assistance 0 0 0 0 0
Child Care Quality 961,888 0 961,888 0 961,888 961,888
Child Care Local Match 0 0 0 5,774,507 5,774,507 5,774,507
Child Care PRS 177,521 0 177,521 4,792,063 4,969,584 4,969,584
WIOA Youth 802,192 9,572 811,765 1,466,448 2,278,212 2,278,212
WIOA Adult 787,764 8,505 796,269 1,401,115 2,197,383 2,197,383
WIOA Dislocated Workers 1,004,246 11,025 1,015,272 1,845,734 2,861,005 2,861,005
WIOA Rapid Response 0 0 0 44,411 44,411 44,411
WIOA Statewide 414,911 414,911 414,911
Industry-Recognized Skills Certification Initiative -96 0 -96 64,430 64,334 64,334
NCP 53,889 747 54,636 94,110 148,746 148,746
SNAP Employment and Training 225,280 2,898 228,178 404,634 632,812 632,812
VR-Summer Earn and Learn 14,509 0 14,509 162,465 69,244 246,219 246,219
TANF/CHOICES 920,732 9,671 930,402 1,769,914 2,700,316 2,700,316
Long Term Unemployed 0 0 0 0
Trade Act Services 2,095 0 2,095 397,521 399,616 399,616
Employment Services 156,583 18,028 174,611 354,051 528,662 528,662
Veterans Resource Administration 22,849 4,417 27,266 67,010 94,276 94,276
WF Commission Initiatives 2,540 2,540 5,824 8,364 8,364
Local Innovation Partnership Grant 39,840 39,840 39,840
National Dislocated Workforce Grant-Oil and Gas 40,780 40,780 196,088 236,868 236,868
Resource Administration Grant-ISAMS 23,363 0 23,363 23,363 23,363
High Demand Job Training Program 0 0 0 20,891 20,891 20,891
WF Commission Initiatives II 97,689 0 97,689 97,689 97,689
Infrastructure Support Services Contract 32,782 0 32,782 11,740 44,522 44,522
Child Care Attendance Automation 0 0 0 139,528 139,528 139,528
Totals: 7,840,887$ 103,095$ 7,943,982$ 39,601,336$ 69,244$ 20,891$ 64,430$ 47,699,883$ 47,699,883$
Totals: 75.4% 32.3% 74.1% 72.3% 89.6% 100.0% 100.4% 72.7% 70.9%
Board Established Benchmarks 83.4% 83.4% 83.4% 85.6% 74.6% 100.0% 100.0% 85.2% 83.2%
Over / (Under) Expended (8.0)% (51.0)% (9.3)% (13.3)% 15.1% 0.0% 0.4% (12.6)% (12.3)%
STATEMENT OF EXPENDITURE DETAIL
July 31, 2017
Fiscal Year to Date
Budget Summary
Workforce Development Board

5
Workforce Center
Contractors
Other FY 2017
Contractors
Other FY 2017
Contractors
Other FY 2017
Contractors
Operations
Other Special
Projects
Approved
Board Budget
Unallocated
Funds
Total Available
Board Funding ResCare Collin College Terrell ISD Ranger College
10/1/2016 10/1/2016 10/1/2016 10/1/2016 10/1/2016 10/1/2016 5/1/2017 10/1/2016 10/1/2016
9/30/2017 9/30/2017 9/30/2017 9/30/2017 9/30/2017 9/30/2017 8/31/2017 12/31/2016 12/31/2016
SUBCONTRACTOR OPERATIONS:
Salaries 3,352,742$ 3,352,742$ 3,352,742$ 6,250,486$ 9,603,228$ 9,603,228$
Fringe Benefits 1,465,148 1,465,148 1,465,148 1,591,036 3,056,184 3,056,184
Indirect Cost\PEO 852,767 852,767 852,767 825,538 1,678,304 1,678,304
Profit 691,556 691,556 691,556
Occupancy 513,587 513,587 513,587 1,475,508 1,989,095 1,989,095
Travel 273,655 273,655 273,655 242,268 515,923 515,923
Equipment 641,400 40,000 681,400 681,400 100,810 782,210 782,210
Other 1,350,797 1,350,797 1,350,797 788,305 2,139,102 2,139,102
Prof Services $1,949,364 278,775 2,228,139 2,228,139 61,341 2,289,480 2,289,480
Total Cost of Operations 10,399,460$ 318,775$ 10,718,235$ -$ 10,718,235$ 12,026,848$ 22,745,083$ 22,745,083$
Total Program Services - 42,730,751 77,240 20,891 64,154 42,893,036 42,893,036
Budget Adjustments - 1,629,557 1,629,557 - - 1,629,557
Total Budget 10,399,460$ 318,775$ 10,718,235$ 1,629,557$ 12,347,792$ 54,757,599$ 77,240$ 20,891$ 64,154$ 65,638,118$ 67,267,675$
SUBCONTRACTOR OPERATIONS:
Salaries $2,684,871 $2,684,871 5,074,057$ 7,758,928$ 7,758,928$
Fringe Benefits 1,171,929 1,171,929 980,450 2,152,379 2,152,379
Indirect Cost 682,654 682,654 649,478 1,332,131 1,332,131
Profit -
Occupancy 621,049 621,049 1,178,159 1,799,209 1,799,209
Travel 183,330 183,330 149,182 332,512 332,512
Equipment 363,749 363,749 59,156 422,905 422,905
Other 748,024 748,024 597,283 1,345,308 1,345,308
Prof Services 1,385,284 103,095 1,488,379 39,580 1,527,959 1,527,959
Total Cost of Operations 7,840,890$ 103,095$ $7,943,985 - 8,727,346$ 16,671,331$ 16,671,331$
Total Program Services 0 30,873,990 69,244 20,891 64,430 31,028,555 31,028,555
Total Expenditures 7,840,887$ 103,095$ $7,943,982 39,601,336$ 69,244$ 20,891$ 64,430$ 47,699,883$ $47,699,883
Remaining Budget 2,558,572$ 215,680$ 2,774,253$ 15,156,263$ 7,996$ -$ 276-$ 17,938,235$ 19,567,791$
Cost of Operations 75.4% 32.3% 74.12% 72.6% 0.0% 0.0% 0.0% 73.3% 73.3%
Program Services 0.0% 0.0% 0.00% 72.3% 89.6% 100.0% 100.4% 72.3% 72.3%
Total Expenditures 75.4% 32.3% 74.12% 72.3% 89.6% 100.0% 100.4% 72.7% 70.9%
Board Established Benchmarks 83.4% 83.4% 83.4% 85.6% 74.6% 100.0% 100.0% 85.2% 83.2%
Over / (Under) Expended (8.0)% (51.0)% (9.3)% (13.3)% 15.1% 0.0% 0.4% (12.6)% (12.3)%
STATEMENT OF EXPENDITURES BY CATEGORY
Workforce Development Board
Fiscal Year to Date
Expenditure Percentages Summary
Expenditure Summary
Budget Summary
Totals With
Unallocated
Funds
July 31, 2017
Contract Beginning
Contract Ending
Totals W\Out
Unallocated
Funds
Type of Expenditure
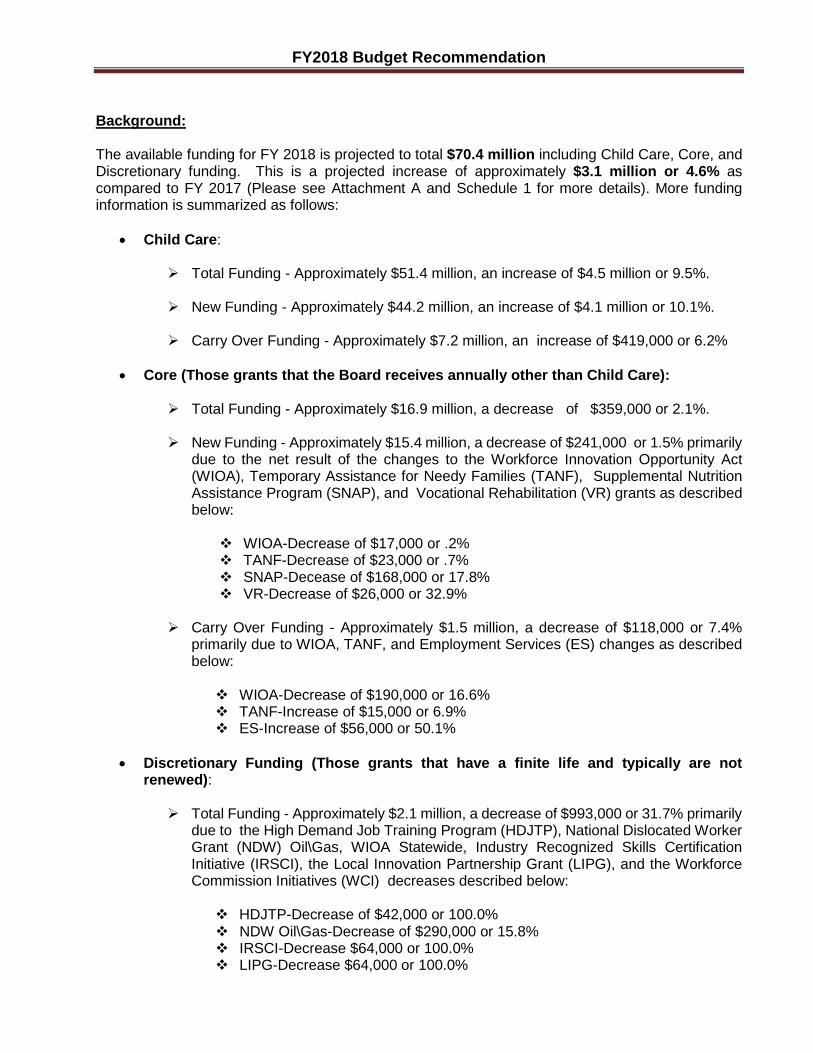
FY2018 Budget Recommendation
Background: The available funding for FY 2018 is projected to total $70.4 million including Child Care, Core, and Discretionary funding. This is a projected increase of approximately $3.1 million or 4.6% as compared to FY 2017 (Please see Attachment A and Schedule 1 for more details). More funding information is summarized as follows:
• Child Care: Total Funding - Approximately $51.4 million, an increase of $4.5 million or 9.5%.
New Funding - Approximately $44.2 million, an increase of $4.1 million or 10.1%.
Carry Over Funding - Approximately $7.2 million, an increase of $419,000 or 6.2%
• Core (Those grants that the Board receives annually other than Child Care): Total Funding - Approximately $16.9 million, a decrease of $359,000 or 2.1%.
New Funding - Approximately $15.4 million, a decrease of $241,000 or 1.5% primarily
due to the net result of the changes to the Workforce Innovation Opportunity Act (WIOA), Temporary Assistance for Needy Families (TANF), Supplemental Nutrition Assistance Program (SNAP), and Vocational Rehabilitation (VR) grants as described below:
WIOA-Decrease of $17,000 or .2% TANF-Decrease of $23,000 or .7% SNAP-Decease of $168,000 or 17.8% VR-Decrease of $26,000 or 32.9%
Carry Over Funding - Approximately $1.5 million, a decrease of $118,000 or 7.4%
primarily due to WIOA, TANF, and Employment Services (ES) changes as described below: WIOA-Decrease of $190,000 or 16.6% TANF-Increase of $15,000 or 6.9% ES-Increase of $56,000 or 50.1%
• Discretionary Funding (Those grants that have a finite life and typically are not renewed): Total Funding - Approximately $2.1 million, a decrease of $993,000 or 31.7% primarily
due to the High Demand Job Training Program (HDJTP), National Dislocated Worker Grant (NDW) Oil\Gas, WIOA Statewide, Industry Recognized Skills Certification Initiative (IRSCI), the Local Innovation Partnership Grant (LIPG), and the Workforce Commission Initiatives (WCI) decreases described below: HDJTP-Decrease of $42,000 or 100.0% NDW Oil\Gas-Decrease of $290,000 or 15.8% IRSCI-Decrease $64,000 or 100.0% LIPG-Decrease $64,000 or 100.0%

FY2018 Budget Recommendation
WIOA Statewide-Decrease of $429,000 or 100% WCI-Decrease of $73,000 or 38.2%
The $70.4 million of projected FY 2018 available funding is proposed to be allocated between the Workforce Board and its staff (including centralized functions), the Board’s contractors (as pass through), and a small percentage held out as unallocated (contingency funds). The descriptions of these allocations are below. Information Workforce Board, Staff, and Centralized Functions The proposed budget for the Board, its staff, and centralized functions (including services such as janitorial, maintenance, and technology support for the Board’s workforce centers) is proposed to be $10,864,879. This represents a $146,644 or 1.4% increase as compared to FY 2017 (Please see Attachment B and Schedules 2 and 3 for more details). Below is a review of the Board’s major cost categories and other notable budget line items: Staffing Board staff positions are proposed to total 54.9 FTEs, an increase of .8 FTEs or 1.5% as compared to the FY 2017 budget. These changes include:
• Sr. Fiscal Manager (reduction of .1 FTEs) – A portion of this position’s responsibilities have been transitioned to other NCTCOG projects resulting in projected reduced staff related costs for the Workforce Board.
• Research and Information Systems (RIS) (addition of .9 FTEs)-Allocation adjustment of technology staff FTEs to support the Board’s workforce centers.
The personnel (salary, fringe benefits, and indirect costs) budget category is proposed to total $6,277,641, an increase of $606,984 or 10.7%. The increase is mainly due to the following:
• Additional positions described above
• Continuous Improvement Process Specialist-This position was approved and added during the fourth quarter of FY 2017, utilizing primarily employee attrition for funding for the remainder of FY 2017. The position was budgeted for a full year within the FY 2018 budget.
• 3.0% budgeted merit increase
• Certain staff promotions and salary adjustments planned for FY 2018.
• Increase to the fringe benefit rate from 43.7% to 45.7% Research and Information Systems (RIS) Support The budget for RIS support is projected to total $3,011,540, an increase of $108,730 or 3.7% (Please see Schedule 2). The increase is due primarily to the following:
• Workforce center direct support-Increase of $239,270 or 11.5% primarily due to the following:
FTE’s that directly support the workforce centers-Increase of .9 FTEs or 12.1%-The
RIS FTE’s that directly support the workforce centers are the only RIS staff included within the Board’s total FTE count. As stated above within the staffing section, the

FY2018 Budget Recommendation
number of FTE’s within this category increased by .9 primarily due to the result of adjustments including adding .4 FTE Laserfiche Solutions Analyst, .3 Customer Relationship Management (CRM) Database Solutions Analyst, and .2 Information Services Coordinator positions. The primary reason for the changes were due to the following: The .4 additional Laserfiche Solutions Analyst position was included within the
"RIS-Workforce Board Staff Support" budget category during FY 2017 and transitioned to the FTE's that directly support the workforce centers for the FY 2018 budget.
The refinement of the RIS allocations methodology.
The additional costs for these FTEs plus merits and salary adjustments for the current allocated positions total $179,561 or a 21.6% increase (this increase is also included within the staffing section above specifically within the personnel costs variance description totaling $606,984).
Equipment-Decrease of $198,859 or 36.7% primarily due to the following:
Workforce Infrastructure Replacement-Decrease of $110,083-This is primarily
based on the equipment inventory and amount of equipment scheduled for replacement.
Workforce Computer Lease-Decrease of $88,776-During FY 2017, this approximate amount was included to contract with Dell to assist the RIS staff with the new computer deployment within the workforce centers. This amount is not included within the FY 2018 budget since no further deployment is planned for this time period.
Professional Services-Increase of $166,784 or 286.9% -The increase is primarily related to technology system operation and maintenance items including (CRM) hosting, security monitoring, and Docunav Laserfiche support.
Software-Increase of $71,627 or 30.7%- The increase is primarily due to additional software costs for the web content management software solution and Laserfiche License Maintenance.
• RIS Administration\Oversight Workforce Centers (Indirect support of the workforce centers)-Increase of $77,372 or 25.8%-The RIS FTEs that indirectly support the workforce centers primarily consists of administration and oversight positions and are not included within the Board’s overall FTE count. The increase was primarily due to the following: The addition of one (1) RIS administrative position. The additional FTE's charged to the workforce centers described within the staffing
section above caused more of the RIS administrative positions to be charged to workforce based on the allocation methodology.
• Workforce Board staff support-Decreased $207,912 or 40.5%-The budget included within this category is utilized to support the Workforce board staff located in Arlington. The increase is primarily due to the following:
Transition of the laserfiche related license and personnel costs from the “Workforce
Board Staff Support” category to direct support of the workforce centers.

FY2018 Budget Recommendation
Reduction of the consulting assistance costs for supporting core systems including sharepoint, storage, and content management system (CMS).
Child Care Quality Program Delivery TWC requires the Board to withhold two percent (2.0%) of its annual Child Care funding to dedicate to Child Care Quality initiatives. The quality initiatives mainly include providing professional development training, scholarships, and equipment and materials for selected Child Care centers located within the Board’s fourteen (14) county region. The funds dedicated for these type activities are proposed to total $627,401, a decrease of $144,811 or 18.8% compared to the amounts withheld at the Board level for FY 2017. The decrease is primarily due to a combination of the following:
• A decrease of $12,092 in new funding-The Board received less funding within the Child Care Quality grant.
• A decrease of $125,000 of carryover –During FY 2017, $250,000 was budgeted as carry over from FY 2016. The initial budget for carry over dedicated to this project is currently only estimated to total $125,000. This amount could potentially be amended within FY 2018 as this project is evaluated.
Other Budget Line Items of Note There are other FY 2018 budget line item amounts that experienced notable variances when compared to FY 2017 including Travel, Supplies, Staff Development, and Marketing. The proposed budget amounts for these categories total $592,254, a decrease of $126,260 or 11.7%. They are discussed in detail within Attachment B. Special Projects Each year the Board’s budget includes special projects to be administered at the Board level. This year, staff are proposing $236,536 for special projects, a decrease of $82,238 or 25.8% as compared to FY 2017. The special projects under consideration are as follows:
• Document Management System - $186,536
During FY 2016, Board staff procured an organization to provide a document management system to enable the Board to transition its workforce center customer case file management system to a paperless format. DocuNav was awarded the contract and laserfiche was the selected document management system. During FY 2016 and FY 2017, the Board began automating selected child care processes. The budget amount designated for FY 2018 is to provide funding to continue the implementation of the case file management system.
• Leasehold Improvements-$50,000
The Board makes efforts to maintain its Workforce Centers in the best possible condition to ensure customers are served effectively and efficiently. The Board staff will be reviewing all of the Workforce Centers during FY 2018 to determine where the greatest needs exist. The Board will be updated throughout the year as any modifications are made to the Workforce Centers.

FY2018 Budget Recommendation
Contractor Allocations Workforce Center Contractor The funding available for the Workforce Center contractor is projected to be $59.0 million, an increase of approximately $4.2 million or 7.7 % (Please see Schedules 4 and 5 for more details). The decrease is a net result of the following:
• Child Care funding - Approximately $46.4 million, a $4.8 million or 11.6% increase. The increase is primarily due to the following: New Funding – Increase of $4.4 million or 12.6%- The increase to the new funding
includes the net result of the changes to the funding sources including Child Care Partially Subsidized Direct Care Allocation (CCF), Local Match ( LM), Fully Subsidized Direct Care Funding Distribution (CCC), and the Department of Family and Protective Services (DFPS):
CCF and LM-Increase of $6.7 million or 21.5%-The increase is primarily due to TWC adding the CCC funds to this funding source. Within FY 2017, TWC issued a separate contract, CCC, to the Board for funding for children in care who were within the CHOICES program or were former DFPS clients. For FY 2018, the former CCC funding will be included within the CCF funding source.
CCC-Decrease of $3.6 million or 100%-As stated above, this funding was issued to the Board in FY 2017 within a separate contract. The contract did not have a specified budget amount. TWC allocated the funds to the Board as children, who were within the CHOICES Program or were formally DFPS clients, were enrolled in care. This funding will be included within the CCF contract for FY 2018.
DFPS-Increase $1.4 million or 33.3%-TWC issues the Board a contract each year for this funding without a specified contract amount. TWC allocates funds to the Board as children are placed in care who have been referred by DFPS. The projected increase is based on estimates as determined by current enrollments.
CCF and LM Carry Over-Increase $427,000 or 6.3%-It’s currently estimated that approximately $7.2 million of the estimated $9.0 million unspent funds (as of September 30, 2017) will be expended within FY 2018 in the form of carry over. The projected balance of approximately $1.8 million will be returned to TWC.
• Workforce\Non Child Care funding - Approximately $12.6 million, a $575,000 or 4.4% decrease. The majority of the decrease is due to the net result of the following: New Core Funding - Decrease of $425,000 or 4.3% -The decrease is primarily due to
decreases within the WIOA, TANF, SNAP, and ES grants as described below:
WIOA-Decrease of $143,000 or 2.6%- The Board received approximately $17,000 less WIOA funding overall compared to FY 2017 but withheld $219,000 more to fund Board operations (primarily due to allocation methodology adjustments) and $92,000 less in the form of unallocated funding.

FY2018 Budget Recommendation
TANF-Decrease of $123,000 or 5.8%- The Board is projected to receive approximately $23,000 less of new funding during FY 2018 compared to FY 2017 but withheld $88,000 more (primarily due to allocation methodology adjustments) to fund Board operations.
SNAP-Decrease of $136,000 or 22.3%- the Board is projecting to receive $168,000 less funding in FY 2018 compared to FY2017 and withhold $32,000 less (primarily due to allocation methodology adjustments) to fund Board operations.
ES-Decrease of $60,000 or 16.5%- The Board is projected to receive approximately $8,000 less of new funding during FY 2018 compared to FY 2017 but withheld $143,000 more (primarily due to allocation methodology adjustments) to fund Board operations. In addition, the Board is projected to withhold $91,000 less in the form of unallocated funds as compared to FY 2017.
Carry Over Core Funding-Approximate $118,000 or 7.4% decrease primarily due to
changes within the WIOA, TANF, and ES grants as described below:
WIOA-Decrease of $190,000 or 16.6%- The Board's contractor, ResCare, is projected to spend close to target levels during FY 2017 resulting in less carry over available for FY 2018 as compared to FY 2017.
TANF-Increase of $14,000 or 6.9%- Based on FY 2017 projected ending balances of unspent Board and ResCare expenditures.
ES-Increase of $56,000 or 50.1%- Carry over funds are projected to increase primarily due to unallocated funds in FY 2017 transitioning to carry over funds for FY 2018.
Discretionary Funding – Approximate $31,000 or 1.8% decrease primarily due to the
following:
National Dislocated Worker Grant (NDW) Oil\Gas-Increase of $417,000 or 43.7%-This two (2) year grant was received within FY 2017 to address individuals who have been dislocated due to the decline within the oil and gas industry. During FY 2017, the Board allocated ResCare operational dollars for only one (1) year and customer related funds for the entire duration of the grant. The projected additional $417,000 is comprised of the second year's operational funds for ResCare plus estimated unspent funds from year one.
WIOA Statewide-Decrease of $429,000 or 100%- The Board requested additional WIOA funding during FY 2017 due to the situation in which the WIOA program funding was reduced by approximately 19.0%. TWC responded with a one (1) time allocation of additional funding that is not anticipated to be received during FY 2018.
Local Innovation Partnership Grant-Decrease of $40,000 or 100%-This grant ended on December 31, 2016.
Other Contractors The Board typically subcontracts with other contractors to operate programs other than the workforce center related ones. The funding available for these type of contracts is approximately $70,000 for FY 2018, a decrease of approximately $138,000 or 66.4%.

FY2018 Budget Recommendation
The decrease is primarily due to changes within IRSCI, HDJTP, and LIPG grants as described below:
• IRSCI-Decrease of $64,000 or 100.0%.-This grant ended on December 31, 2016.
• HDJTP-Decrease of $42,000 or 100.0%- This grant ended on October 31, 2016.
• LIPG-Decrease of $24,000 or 100%-This grant ended on December 31, 2016.
Unallocated Funding (contingency funding)
The Board usually designates a portion of its funding as unallocated or contingency funding. As the year progresses these funds will either be utilized for certain projects, allocated to the Board’s subcontractor, or utilized as carry over for the subsequent year. For FY 2018, approximately $502,000 is proposed to be designated as such.
Recommendation:
It is recommended that the Workforce Board of Directors approve the Workforce Board, Staff, and Centralized functions FY 2018 budget equaling $10,864,879. The balance of available funds is projected to be allocated to the Board’s contractors for program delivery (currently estimated to be $59,065,843) with a small percentage designated as unallocated\contingency funds (currently $502,362).
Effective Date: October 1, 2017
Attachment: Attachment A - Funds Utilization Summary Attachment B - Proposed FY2018 Budget Attachment C - FY2018 Projected Budget-Detailed Comparative Analysis Schedule 1 - Grant Summary Comparison Schedule 2 - RIS Budget Schedule 3 - FY2017 and FY2018 Comparison - Program Delivery Schedule 4 - FY2017 and FY2018 Comparison – Operations/Customer Training and Support Schedule 5 – FY2017 and FY2018 Allocation Summary Comparison

North Central Texas Workforce Development Board
Funds Utilization Summary
Prepared for Fiscal Year 2018 Budget
Budget Period: 10/01/2017-9/30/2018
Attachment A
Board
Function Unallocated
Total Board
Funding
Available
Program
Delivery Total Funding
Board
Function Unallocated
Total Board
Funding
Available
Program
Delivery Total Funding Difference % Change
Available Revenue:
Core Programs
Child Care
Child Care Partially Subsidized Direct Care Allocation (CCF) and Local Match (LM $3,664,716 $379,177 $4,043,893 $26,844,954 $30,888,847 $3,547,261 $175,000 $3,722,261 $33,509,689 $37,231,950 $6,343,103 20.54%
Child Care Quality 1,050,365 8,403 1,058,768 1,058,768 1,046,676 1,046,676 1,046,676 (12,092) (1.14%)
Fully Subsidized Direct Care Funding Distribution (CCC) 0 3,641,516 3,641,516 (3,641,516) (100.00%)
Department of Family and Protective Services (DFPS) 235,000 235,000 4,100,000 4,335,000 235,000 235,000 5,465,000 5,700,000 1,365,000 31.49%
Child Care Attendance Automated Service (CCAA) 218,753 218,753 216,990 216,990 (1,763) (0.81%)
Carry Over (Quality) 33,028 33,028 33,028 25,000 25,000 25,000 (8,028) (24.31%)
Carry Over CCF and LM - - 6,773,455 6,773,455 - - - 7,200,000 7,200,000 426,545 6.30%
Subtotal Child Care $4,983,109 $387,580 $5,370,689 $41,578,678 $46,949,367 $4,853,937 $175,000 $5,028,937 $46,391,679 $51,420,616 $4,471,249 9.52%
Core Programs\New Funding (Excluding Child Care)
Workforce Innovations Opportunities Act (WIOA) Youth $1,064,119 $101,300 $1,165,418 $1,830,675 $2,996,094 $1,238,280 $70,000 $1,308,280 $1,885,075 $3,193,355 $197,262 6.58%
WIOA Adult 1,003,013 111,349 1,114,362 1,706,567 2,820,929 1,113,136 70,000 1,183,136 1,723,120 2,906,256 85,327 3.02%
WIOA Dislocated Worker 1,281,624 89,320 1,370,944 2,017,458 3,388,402 1,215,883 70,000 1,285,883 1,809,047 3,094,930 (293,472) (8.66%)
WIOA Rapid Response 67,273 67,273 61,587 61,587 (5,686) (8.45%)
Trade Adjustment Assistance (TAA) 3,763 59,064 62,827 736,669 799,496 18,562 5,000 23,562 775,934 799,496 0 0.00%
Temporary Assistance for Needy Families (TANF) 1,205,232 38,050 1,243,282 2,116,679 3,359,961 1,293,236 50,000 1,343,236 1,993,535 3,336,771 (23,190) (0.69%)
Supplemental Nutrition Assistance Program Employment & Training (SNAP E&T) 315,765 20,137 335,902 612,802 948,704 283,975 20,000 303,975 476,366 780,341 (168,363) (17.75%)
Vocational Rehabilitation (VR) 50,078 50,078 27,600 77,678 17,563 2,500 20,063 32,046 52,109 (25,569) (32.92%)
Employment Services (ES) 222,906 120,604 343,510 361,976 705,486 365,480 30,000 395,480 302,340 697,820 (7,666) (1.09%)
Non Custodial Parent-NCP 73,516 25,617 99,133 219,536 318,669 84,983 5,000 89,983 229,045 319,028 359 0.11%
Veterans 30,797 13,705 44,502 98,498 143,000 55,372 5,000 60,372 82,628 143,000 0 0.00%
Subtotal Core Programs\New Funding $5,250,813 $579,146 $5,829,958 $9,795,733 $15,625,691 $5,686,470 $327,500 $6,013,970 $9,370,723 $15,384,693 ($240,999) (1.54%)
-
Core Programs\ Carry Over Funding (Excluding Child Care) -
WIOA Dislocated Worker $570,786 $570,786 $345,000 $345,000 ($225,786) (39.56%)
WIOA Adult 274,044 274,044 288,000 288,000 13,956 5.09%
WIOA Youth 304,382 304,382 326,000 326,000 21,618 7.10%
TAA 124,124 124,124 125,000 125,000 876 0.71%
TANF 213,375 213,375 228,000 228,000 14,625 6.85%
ES - - - 112,590 112,590 - - - 169,000 169,000 56,410 50.10%
Subtotal Core Programs\Carry Over Funding $0 $0 $0 $1,599,300 $1,599,300 $0 $0 $0 $1,481,000 $1,481,000 ($118,300) (7.40%)-
Subtotal All Funding\Core Programs (Excluding Child Care) $5,250,813 $579,146 $5,829,958 $11,395,033 $17,224,991 $5,686,470 $327,500 $6,013,970 $10,851,723 $16,865,693 ($359,299) (2.09%)
Discretionary Programs-
Discretionary Programs -
Other: Summer Earn and Learn (SEAL) $19,800 $19,933 $39,733 $429,067 $468,800 $24,663 $2,014 $26,678 $442,122 $468,800 $0 0.00%
Other: High Demand Job Training Program (HDJTP) 42,149 42,149 0 (42,149) (100.00%)
Other: National Dislocated Worker Grant (NDW) Oil\Gas 196,962 678,177 875,139 955,085 1,830,224 168,496 168,496 1,371,865 1,540,361 (289,863) (15.84%)
Other: WIOA Statewide 428,797 428,797 0 0 (428,797) (100.00%)
Other: Industry-Recognized Skills Certification Initiative (IRSCI) 64,432 64,432 0 0 (64,432) (100.00%)
Other: Local Innovation Partnership Grant (LIPG) 64,308 64,308 0 0 (64,308) (100.00%)
Other: Business Service Award 30,000 30,000 30,000 (30,000) (100.00%)
Other: Resource Administrative Grant (RAG) 32,352 (12,875) 19,477 19,477 21,629 (2,152) 19,477 19,477 0 0.00%
Other: Workforce Commission Initiatives (WCI) 205,200 (22,404) 182,796 8,332 191,128 109,684 0 109,684 8,453 118,137 (72,991) (38.19%)
Subtotal Discretionary Programs $484,314 $662,831 $1,147,145 $1,992,170 $3,139,315 $324,472 ($138) $324,334 $1,822,441 $2,146,775 ($992,540) (31.62%)
Total Funding $10,718,235 $1,629,557 $12,347,793 $54,965,881 $67,313,674 $10,864,879 $502,362 $11,367,241 $59,065,843 $70,433,084 $3,119,410 4.63%
Comparison FY 2017
Funding Source
FY 2018

Attachment B
FY 2017
Proposed
FY 2018
Amount
Change
Percenta
ge
Change
Workforce Board, Staff, and Centralized Functions
FTEs (1) 54.1 54.9 0.8 1.49%.
Salaries (2) $3,352,742 $3,660,669 $307,927 9.18%
Fringe Benefits (2) 1,465,148 1,672,926 207,778 14.18%
Indirect (2) 852,767 944,046 91,279 10.70%
Occupancy 257,961 254,121 (3,840) (1.49%)
WF Center Maintenance\Janitorial 255,625 251,625 (4,000) (1.56%)
Travel (3) 273,655 237,955 (35,700) (13.05%)
Equipment (4) 641,400 377,391 (264,009) (41.16%)
Child Care Quality Program Delivery (5) 772,212 627,401 (144,811) (18.75%)
Professional Services (6) 363,217 594,994 231,777 63.81%
RIS-Admin.\Oversight Workforce Centers (7) 299,935 377,307 77,372 25.80%
RIS-Workforce Board Staff Suppport (8) 514,000 306,088 (207,912) (40.45%)
Supplies (9) 52,880 63,441 10,561 19.97%
Staff Development (10) 77,979 118,858 40,879 52.42%
Communications 294,337 295,247 910 0.31%Marketing (11) 314,000 172,000 (142,000) (45.22%)
Other (12) 611,603 674,274 62,671 10.25%
Subtotal $10,399,461 $10,628,343 $228,882 2.20%
Special Projects (13) 318,774 236,536 (82,238) (25.80%)
Total Workforce Board, Staff, and Centralized Functions $10,718,235 $10,864,879 $146,644 1.37%
Unallocated\Contingency (14) 1,629,557 502,362 (1,127,195) (69.17%)
Total Funds Available at Board Level $12,347,793 $11,367,241 ($980,551) (7.94%)
Program Delivery
Workforce Center Contractor\Child Care (15) $41,578,678 $46,391,679 $4,813,001 11.58%Workforce Center Contractor\Non Child Care (16) 13,178,914 12,604,163 (574,751) (4.36%)
Total Workforce Center Contractor $54,757,592 $58,995,843 $4,238,251 7.74%
Other Contractors (17) 208,289 70,000 (138,289) (66.39%)
$54,965,881 $59,065,843 $4,099,962 7.46%
Total $67,313,674 $70,433,084 $3,119,410 4.63%
Change %
16.32% 15.54% (0.78%) (4.79%)
Percentage of Program Delivery to Allocated Funding 83.68% 84.46% 0.78% 0.93%
North Central Texas Workforce Development Board
Budget Category
Comparison to FY 2017
Proposed FY 2018 Budget
Budget Period: 10/01/2017-09/30/2018
Total Program Delivery
Percentage of Total Workforce Board, Staff, and Centralized Functions to
Allocated Funding

(1) The increase is a net result of the following: • Decrease of .1 FTE due to the costs associated with the Sr. Fiscal Manager being allocated to other non-
Workforce programs. • Increase of .90 FTEs due to additional Research Information Services (RIS) staff-The RIS department's FTEs
within this total includes the staff who directly provide technology support for the Board's workforce centers. RIS administration and oversight FTEs that are indirectly involved with the technology support of the Board's workforce centers and FTE's that directly support the Workforce Staff located in Arlington are not included within this total but are included within the "RIS-Admin.\Oversight Workforce Centers" and the "RIS-Workforce Board Support" budget categories respectively. The overall increase was primarily due to a result of adjustments including adding .4 FTE's LaserFiche Solutions Analyst, .3 CRM Database Solutions Analyst, and .2 Information Services Coordinator positions. The .4 additional LaserFiche Solutions Analyst position was included within the "RIS-Workforce Board Support" category during FY 2017 and transitioned to the FTE's that directly support the workforce centers for the FY 2018 budget. The other increases were primarily due to the refinement of the RIS allocations methodology.
(2) The personnel cost increase is primarily due to the following: • The additional FTEs described above • The Continuous Improvement Process Specialist position was approved and added during FY 2017 without
an increase to the budget due to available FY 2017 funding. The personnel costs for this position were budgeted within FY 2018.
• Merit amount of 3% budgeted for all staff • Certain promotions and salary adjustments planned for selected staff • Increase to the fringe benefit rate from 43.7% to 45.7%
(3) The decrease is primarily due to the projected travel decrease for the Business Service Liaison FTEs. For FY 2018, more local travel destinations and less trips overall compared to FY 2017 are currently scheduled.
(4) The primary cause for the decrease within this budget category is due to the following: • Decrease in workforce infrastructure replacement - $110,000 - This is primarily based on the equipment
inventory and amount of equipment scheduled for replacement. • Decrease in workforce center computer lease - $89,000 - For FY 2017, this approximate amount was
included to contract with Dell to assist the RIS staff with the new computer deployment. This amount is not included within the FY 2018 budget.
• Decrease in workforce center accessibility standards funding - $78,000 - During FY 2017 the Workforce Board received funds to acquire goods and services and assistive technology to meet the minimum standards established by TWC for Americans with Disabilities Act compliance. These funds are not anticipated to be received in FY 2018.
(5) The primary reason for the projected decrease within this budget category is due to the following: • Decrease of approximately $12,000 due to a projected reduction within the FY 2018 Child Care Quality
contract. • Decrease of budgeted child care carry over amount totaling $125,000
(6) The increase is primarily due to the following:
• Increase to Customer Relationship Management (CRM) implementations fees and Labor Market Analysis (LMI) application budget amounts - $45,000
• Increase to technology system operation and maintenance items including CRM Hosting, security monitoring, and Docunav Laserfiche support - $167,000
Attachment B-Notes

(7) The increase is primarily due to the following: • The additional FTE's charged to the workforce centers described in No. 1 above caused more of the RIS
administrative positions to be charged to workforce based on the allocation methodology. • The addition of one (1) RIS administrative assistant position.
(8) The decrease is primarily due to the following: • Transition of the LaserFiche related license and personnel costs from the “Workforce Board Staff Support”
budget category to direct support of the workforce centers. • Reduction of the consulting assistance costs for supporting core systems including SharePoint, storage, and
content management system (CMS).
(9) The majority of the increase is due to additional swipe cards for the workforce center customer tracking system - $20,000
(10) The increase is primarily due to the following: • RIS application development security training and software update training - $20,000 • Additional child care conferences and certifications for designated child care staff - $9,200
(11) The decrease is primarily due to the following:
• Reduction of budget dedicated to rebranding due to the Department of Labor (DOL) American Job Center Branding initiative. A clarification by DOL eliminates the requirement to replace current workforce center signage - $50,000
• Reduction of carry over marketing projects - 70,000
(12) The increase is primarily due to additional core system software costs including increases for web content management software solution and LaserFiche License Maintenance - $72,000
(13) The special projects projected for FY 2018 include the following: • Funds necessary to continue the transition of the workforce center customer case file management system
to a paperless format that was initiated during FY 2016 - $187,000 • Leasehold improvements for a selected workforce center to be determined after assessments are
completed - $50,000
(14) The majority of the decrease is due to the following: • National Dislocated Worker (NDW) Grant - Decrease $678,000 - During FY 2017, the Board received a two
(2) year grant dedicated for the oil and gas industry decline. A portion of these funds were unallocated during FY 2017. The balance of the unallocated funds is projected to be allocated during FY 2018 causing a decline to this category.
• Child care - $213,000 decrease-There was approximately $6.8 million of child care funds carried over from FY 2016 to FY 2017 which was higher than anticipated causing a larger amount of unallocated funds than normally occurs. The projected child care unallocated amount has been reduced for FY 2018.
• WIOA - $92,000 decrease - When the Board received the NDW grant, a portion of the current Board staff costs were diverted from other core grants including WIOA and redirected to the NDW grant causing a larger amount of unallocated WIOA funds. The unallocated amount is projected to be reduced for FY 2018.
Attachment B-Notes

(15) The increase is primarily due to the following: • New funding - Increase $4.4 million - The Board received an increase in new funding from TWC primarily due
to a net increase within the following funding sources: CCF and LM - Increase $6.7 million - TWC allocated additional funds within this funding source primarily
for the additional costs for the children who are former DFPS recipients or enrolled within the CHOICES program. Within FY 2017 there was a separate grant for the cost of these children but that amount has been combined for FY18 within the CCF grant.
CCC - Decrease of $3.6 million - As described above, during FY 2017 TWC allocated funds to the Board specifically for the cost of children who were former DFPS recipients or enrolled within the CHOICES program. For FY 2018, the budget for the cost of these children is included within the CCF grant budget amounts.
DFPS - Increase $1.4 million - TWC provides funding for the Board as the cost of these children's care is incurred. The increase is based on the estimated final costs for FY 2017.
• Carry over funding increase - $427,000 - The primary cause for the increase in carry over funds was due to the mandate from TWC that the Boards could not increase enrollments above the average daily target number of children to be served.
(16) The decrease is primarily due to the following: • WIOA new funding - $143,000 decrease - There is approximately $17,000 less WIOA funding available to
the Board overall compared to FY 2017 but the Board withheld $219,000 more to fund Board operations and $92,000 less in the form of unallocated funding.
• WIOA carry over - $190,000 decrease - The Board's contractor, ResCare, also is projected to spend close to target levels during FY 2017 resulting in less carry over available for FY 2018 as compared to FY 2017.
• TANF new funding - $123,000 decrease - The Board is projected to receive approximately $23,000 less of new funding during FY 2018 compared to FY 2017 but withheld $88,000 more to fund Board operations.
• TANF carry over - $14,000 increase - Based on FY 2017 projected ending balances of unspent Board and ResCare expenditures.
• SNAP new funding - $136,000 decrease - the Board is projecting to receive less funding overall within FY 2018 in an amount totaling approximately $168,000. The Board is also projected to retain $32,000 less at the Board level within FY 2018 to fund its operations.
• WIOA Statewide - Decrease $429,000 - The Board requested additional WIOA funding during FY 2017 due to the situation in which the WIOA program funding was reduced by approximately 19.0%. TWC responded with a one (1) time allocation of additional funding that is not anticipated to be received during FY 2018.
• NDW Oil\Gas - $417,000 increase - This two (2) year grant was received within FY 2017 to address individuals who have been dislocated due to the decline within the oil and gas industry. During FY 2017, the Board allocated ResCare operational dollars for only one (1) year and customer related funds for the entire duration of the grant. The projected additional $417,000 is comprised of the second year's operational funds for ReCare plus estimated unspent funds from year one.
• Employment Services new funding - Decrease $60,000 - The Board is projected to receive approximately $8,000 less of new funding during FY 2018 compared to FY 2017 but withheld $143,000 more to fund Board operations. In addition, the Board is projected to withhold $91,000 less in the form of unallocated funds as compared to FY 2017.
• Employment Services carry over - $56,000 increase - Primarily due to unallocated funds in FY 2017 transitioning to carry over funds for FY 2018.

(17) The decrease is primarily due to the following: • HDJTP - $42,000 decrease-This grant ended within FY 2017 on 10\31\16. • IRSCI - $64,000 decrease-This grant ended within FY 2017 on 12\31\16. • LIPG - $24,000 decrease-This grant ended within FY 2017 on 12\31\16.

Attachment C
Category Amount
Ops\Customer
% Amount
Ops\Customer
% Value %
Workforce Contractors
Workforce\Non Child Care
FTEs (1) 118.30 108.30 (10.00) (8.45%)
Normal Operations (2) $8,744,516 66.35% $8,202,170 65.08% ($542,346) (6.20%)
Customer Training\Support (2) 4,434,398 33.65% 4,401,993 34.92% (32,405) (0.73%)
.
Subtotal Workforce\Non Child Care $13,178,914 100.00% $12,604,163 100.00% ($574,751) (4.36%)
Child Care
FTEs 50.70 50.70 0.00 0.00%
Operations (3) $3,282,332 7.89% $3,495,824 7.54% $213,492 6.50%
Direct Care (4) 38,296,346 92.11% 42,895,855 92.46% 4,599,509 12.01%
Subtotal Child Care $41,578,678 100.00% $46,391,679 100.00% $4,813,001 11.58%
FTEs\ Total Workforce Center Contractors 169.00 159.00 (10.00) (5.92%)
Total Operations Workforce Center Contractors $12,026,848 22.11% $11,697,994 19.83% ($328,854) (2.73%)
Total Customer Training\Support Workforce Center Contractors 42,730,744 77.89% 47,297,849 80.17% 4,567,105 10.69%
Total Workforce Contractors $54,757,592 100.00% $58,995,843 100.00% $4,238,251 7.74%
Other Contractors (5)
Operations
Customer Training\Support 208,289 100.00% 70,000 100.00% (138,289) (66.39%)
Total Other Contractors $208,289 100% $70,000 100.00% ($138,289) (66.39%)
Workforce Board, Staff, and Centralized Functions
Operations $9,946,023 92.80% $10,237,478 94.23% $291,454 2.93%
Customer Training\Support (6) 772,212 7.20% 627,401 5.77% (144,811) (18.75%)
Total Workforce Board, Staff, and Centralized Functions $10,718,235 100.00% $10,864,879 100.00% $146,644 1.37%
Unallocated\Contingency $1,629,557 $502,362 ($1,127,195) (69.17%)
Total Operations $21,972,871 32.64% $21,935,472 31.14% ($37,400) (0.17%)
Total Customer Training\Support 43,711,245 64.94% 47,995,250 68.14% 4,284,005 9.80%
Total Unallocated\Contingency 1,629,557 2.42% 502,362 0.71% (1,127,195) (69.17%)
Grand Total $67,313,674 100.00% $70,433,084 100.00% $3,119,410 4.63%
(6 ) The majority of the Board's local budget for itself, staff, and the centralized functions are typically for operational type costs (primarily staff related costs). The FY 2017 and
FY 2018 budget does include child care quality funds (categorized within customer training and support) which are utilized primarily for professional development training,
scholarships, and equipment and materials for selected child care centers located within the Board’s fourteen (14) county region. The primary purpose for the reduction is due to
the following:
• A decrease of $12,092 in new funding-The Board received less funding within the Child Care Quality grant.
• A decrease of $125,000 of carryover –During FY 2017, $250,000 was budgeted as carry over from FY 2016. The initial budget for carry over dedicated to this project for FY
2018 is currently only estimated to total $125,000. This amount could potentially be amended within FY 2018 as this project is evaluated
TWC does require the Boards to dedicate a minimum of 2% of the annual child care funding for child care quality purposes.
(3) The increase is primarily due to the addition of three (3) staff within the 4th quarter of FY 2017. The FY 2017 budget was not adjusted for the additional staff due to staff
attrition amounts totaling an amount sufficient enough to cover the additional costs. The full budget for the additional staff is included within the FY 2018 budget amounts.
(5) The decrease is primarily due to the following grant decreases projected for FY 2018:
• IRSCI-Decrease of $64,000 or 100.0%.-This grant ended on December 31, 2016.
• HDJTP-Decrease of $42,000 or 100.0%- This grant ended on October 31, 2016.
• LIPG-Decrease of $24,000 or 100%-This grant ended on December 31, 2016.
(4) The increase is primarily due to the following:
• CCF and LM-Increase of $6.7 million or 21.5%-The increase is primarily due to TWC adding the CCC funds to this funding source. For FY 2017, TWC issued a separate
contract, CCC, to the Board for funding for children in care who were within the CHOICES program or were former DFPS clients. For FY 2018, the former CCC funding will be
included within the CCF funding source
• CCC-Decrease of $3.6 million or 100%-As stated above, this funding was issued to the Board in FY 2017 within a separate contract. The contract did not have a specified
budget amount. TWC allocated the funds to the Board as children, who were within the CHOICES Program or were formally DFPS clients, were enrolled in care. This funding will
be included within the CCF contract for FY 2018.
• DFPS-Increase $1.4 million or 33.3%-TWC issues the Board a contract each year for this funding without a specified contract amount. TWC allocates funds to the Board as
children are placed in care who have been referred by DFPS. The projected increase is based on estimates as determined by current enrollments.
•CCF and LM carry over-Increase 427,000 or 6.3%-Based on projected amount of unspent September 30, 2017 funds that will be expended prior to the grant end dates of
December 31, 2017.
(2) The overall program delivery decrease for the Workforce\Non Child Care funding of $575,000 is primarily due to the WIOA, TANF, and SNAP funding decreases as
described in No. 1 above. The majority of the decreases are projected to be absorbed within the operational category primarily by FTE adjustments, allowing the customer
training and support funds to remain as static as possible.
(1) The staff decrease is primarily due to the decrease in funding available for WIOA, TANF, and SNAP program delivery in the amount of approximately $578,000 (including
both new funds and estimated carry over) which is due to less funding available from TWC, less anticipated carry over, and Workforce Board allocation methodology adjustments.
The majority of each of these grants are typically dedicated to fund operational expenditures including staffing costs.
North Central Texas Workforce Development Board
Budget Period: 10/01/2017-09/30/2018
FY 2018 Projected Budget
Comparison
Detailed Comparative Analysis
FY 2017 FY 2018

Schedule 1
$67,313,674 $70,433,084 $3,119,410 4.63%
2017 2018
Grant Summary ComparisonFY 2017 to FY 2018
Child Care New Core New Discretionary Child Care Carry Over Core Carry Over

RIS BUDGET
RIS$3,011,540
$108,730 Increase (3.7%)
Workforce Center $316,642 (13.2%)
Direct Support $239,270 (11.5 %)
Indirect Support $77,372 (25.8%)
Workforce Board Staff ($207,912) (40.5%)
Schedule 2

Schedule 3
16.32%
83.68%
FY 2017 Board Budget Compared to Program Delivery
Board
Program Delivery
15.54%
84.46%
FY 2018 Board Budget Compared to Program Delivery
Board
Program Delivery

Schedule 4
32.6%
64.9%
2.4%
FY 2017 Operations\Customer Training & Support Summary
Operations
Customer Training\Support
Unallocated\Contingency
31.1%
68.1%
0.7%
FY 2018 Operations\Customer Training & Support Summary
Operations
CustomerTraining\Support
Unallocated\Contingency

Schedule 5
17.9%
65.9%
0.1%
15.4%
0.7%
FY 2018 Allocation Summary
Workforce\Non Child Care
Child Care
Other Contractors
Workforce Board and Staff
Unallocated
19.6%
61.8%
0.3%
15.9%
2.4%
FY 2017 Allocation Summary
Workforce\Non Child Care
Child Care
Other Contractors
Workforce Board and Staff
Unallocated

FY2018 Proposed Budget RecommendationPresented By: Randy Richardson
Workforce Fiscal Manager
September 26, 2017

Core Funding
Child Care: Child Care Partially Subsidized Direct Care Allocation (CCF) Child Care Local Match (LM) Child Care Fully Subsidized Direct Care Funding Distribution (CCC) Department of Family and Protective Services (DFPS) Child Care Quality Child Care Attendance Automated Service (CCAA)
Workforce Innovation Opportunity Act (WIOA): WIOA Youth WIOA Adult WIOA Dislocated WIOA Rapid Response
Trade Adjustment Assistance (TAA) Temporary Assistance for Needy Families (TANF)
Funding DefinitionsFY2018 Proposed Budget

Core Funding continued
Non Custodial Parent-TANF (NCP) Supplemental Nutrition Assistance Program (SNAP)
Employment and Training (E&T) Employment Services (ES) Veterans Vocational Rehabilitation (VR)
Funding DefinitionsFY2018 Proposed Budget

Discretionary Funding
Resource Administration Grant (RAG) Industry-Recognized Skills Certification Initiative (IRSCI) High Demand Job Training Program (HDJTP) Local Innovation Partnership Grant (LIPG) Workforce Commission Initiatives (WCI) Summer Earn and Learn (SEAL) National Dislocated Worker Grant (NDW) Oil\Gas Business Service Award WIOA Statewide
Funding DefinitionsFY2018 Proposed Budget

Child Care Funding
$51.4 million: $4.5 million or 9.5% increase
New Core Funding: $44.2 million: $4.1 million or 10.1% increase CCF\LM: Increase $6.3 million or 20.5% CCC: Decrease $3.6 million or 100% DFPS: Increase $1.4 million or 31.5%
Carry Over Funding: $7.2 million: $419,000 or 6.2% increase
Core Funding (excluding child care)
$16.9 million: $359,000 or 2.1% decrease
New Core Funding: $15.4 million: $241,000 or 1.5% decrease
WIOA: Decrease of $17,000 or .2% TANF: Decrease of $23,000 or .7% SNAP: Decrease of $168,000 or 17.8% VR: Decrease of $26,000 or 32.9%
$70.4 million $3.1 million or 4.6% increaseFY2018 Proposed Budget

FY2018 Proposed Budget (continued)
Core Funding (excluding child care continued)
Carry Over Core Funding: $1.5 million: $118,000 or 7.4% decrease
WIOA: Decrease of $190,000 or 16.6% TANF: Increase of $15,000 or 6.9% ES: Increase of $56,000 or 50.1%
Discretionary Programs
$2.1 million: $993,000 or 31.7% decrease
HDJTP: Decrease of $42,000 or 100.0% NDW Oil\Gas: Decrease of $290,000 or 15.8% IRSCI: Decrease of $64,000 or 100.0% LIPG: Decrease $64,000 or 100.0%

FY2018 Proposed Budget (continued)
Discretionary Programs con’t
WIOA Statewide: Decrease of $429,000 or 100% WCI: Decrease of $73,000 or 38.2%


Workforce Board, Staff, & Centralized Functions
Staffing
Personnel Costs (Salaries, Fringe, Indirect): $6,277,641 $606,984 or 10.7% increase
Total FTEs: 54.9, .8 or 1.5% increase
.1 FTE Decrease: Sr. Fiscal Manager A portion of this position’s responsibilities have been transitioned to other NCTCOG projects.
.9 FTE Increase: Research and Information Systems (RIS)Allocation adjustment of technology staff FTEs to support the Board’s workforce centers.
$10,864,879 $146,644 or 1.4% increase

Workforce Board, Staff, & Centralized Functions (continued)
Staffing (Continued)
Continuous Improvement Process Specialist position was approved during FY 2017 utilizing staff attrition to fund the position. This position was budgeted a full year within FY 2018.
3.0% budget merit increase. Staff promotions and salary adjustments. Increase to the fringe benefit rate from 43.7% to 45.7%

Workforce Board, Staff, & Centralized Functions (continued)
Research and Information Systems (RIS) Support
$3,011,540: $108,730 or $3.7% increase
Workforce Center Direct Support: $2,328,145$239,270 or 11.5% increase
Personnel: .9 FTE increase plus merit and salary adjustments of current staff, $179,561 or 21.6% increase
Equipment: $198,859 or 36.7% decrease Computer lease for workforce centers Workforce share of the NCTCOG infrastructure costs for items
such as servers, switches, routers, and security appliances Professional Services: $166,784 or 286.9% increase
Customer Relationship Management (CRM) hosting Security monitoring Docunav Laerfiche support
Software: $71,627 or 30.7% increase Web content management software solution Laserfiche license maintenance

Workforce Board, Staff, & Centralized Functions (continued)
Research and Information Systems (RIS) Support (continued)
Workforce Center Indirect Support: $377,307, $77,372 or 25.8% increase FTEs: The addition of one (1) RIS administrative position Allocation methodology refinement
Workforce Board Staff Support: $306,088, 207,912 or 40.5% decrease Document management system (laserfiche) related costs
transitioned to the direct support of the workforce centers. Reduction of the consulting assistance costs for supporting core
systems including: Sharepoint Storage Content management system (CMS)

RIS BUDGET
RIS$3,011,540
$108,730 Increase (3.7%)
Workforce Center $316,642 (13.2%)
Direct Support $239,270 (11.5 %)
Indirect Support $77,372 (25.8%)
Workforce Board Staff ($207,912) (40.5%)

Workforce Board, Staff, & Centralized Functions (continued)
Child Care Quality Program
$627,401: $144,811 or 18.8% decrease
New quality funding: $12,000 decrease Child Care Carry Over: $125,000 decrease
Other Notable Budget Line Items
Travel: $237,955 $35,700 or 13.1% decrease Supplies: $63,441 $10,561 or 20.0% increase Staff Development: $118,858 $40,879 or 52.4% increase Marketing: $172,000 $142,000 or 45.2% decrease

Workforce Board, Staff, & Centralized Functions (continued)
Special Projects
$236,536: $82,238 or 25.8% decrease
Document Management System: $186,536 Leasehold improvements: $50,000


FY2018 Program Delivery - ResCare$59.0 million $4.2 million or 7.7% increase
Child Care
$46.4 million: $4.8 million or 11.6 % increase
New Funding: $39.2 million, $4.4 million or 12.6% increase Carry Over Funding: $7.2 million, $427,000 or 6.3% increase Operations: $3.5 million, $213,000 or 6.5% increase
3.0 staff were added during FY 2017 without a corresponding increase to the FY 2017 budget due to available funds from staff attrition. The full personnel costs for the additional staff are budgeted within FY 2018.

FY2018 Program Delivery - ResCare
Child Care (continued)
Direct Care: $42.9 million, $4.6 million or 12.0% increase CCF and LM: $6.7 million or 21.5% increase CCC: $3.6 million or 100% decrease DFPS: $1.4 million or 33.3% increase CCF and LM carry over: $427,000 or 6.3 increase Operational increase creating less funds for direct care: $213,000
or 6.5% decrease

FY2018 Program Delivery - ResCare
Workforce/Non-Child Care
$12.6 million: $575,000 or 4.4% decrease
New Core Funding: $9.4 million $425,000 or 4.3% decrease
WIOA: Decrease of $143,000 or 2.6% TANF: Decrease of $123,000 or 5.8% SNAP: Decrease of $136,000 or 22.3% ES: Decrease of $60,000 or 16.5%
Core Grant Carry Over: $1.5 million $118,000 or 7.4% decrease
WIOA: Decrease of $190,000 or 16.6% TANF: Increase of $14,000 or 6.9% ES: Increase of $56,000 or 50.1%

FY2018 Program Delivery - ResCare
Workforce/Non-Child Care (continued)
Discretionary Grants: $1.8 million, $31,000 or 1.8% decrease
NDW Oil\Gas: Increase of $417,000 or 43.7% WIOA Statewide: Decrease of $429,000 or 100% LIPG: Decrease of $40,000 or 100%
Operations: $8.2 million, $542,000 or 6.2% decrease FTE decrease of 10.0 WIOA, TANF, and SNAP decreases of approximately $578,000 (both
new and carry over funding). The majority of these grants are typically utilized to fund operational costs.

FY2018 Program Delivery - ResCare
Workforce/Non-Child Care (continued)
Customer Training\Support: $4.4 million, $32,000 or .7% decrease
A projected $578,000 decrease within the WIOA, TANF, and SNAP grants.
The majority of the decreases described above were absorbed within the operations category in an attempt to keep the customer training and support funds as static as possible.

FY2018 Program Delivery – Other Contractors
Other Contractors
$70,000: $138,000 or 66.4% decrease
IRSCI: Decrease of $64,000 or 100.0% HDJTP: Decrease of $42,000 or 100.0% LIPG: Decrease of $24,000 or 100.0%
Unallocated Funding (contingency funding)
$502,000
Utilized for certain projects Allocated to the Board sub-contractors Carry over for the subsequent year

Questions??

September 9, 2017 Workforce Solutions for North Central Texas 1
Control 1
Fiscal Agent/ Procurement
2 Administrative
Agent Programs, Planning,
Technology
3 Staffing Entity Opportunities to
Strengthen our Relationship with the
Board
A. How the COG ensures the Board gets full disclosure regarding financial and non-financial matters related to Board business.
Bi-Monthly Financial\Budgetary Status Reports
NCTCOG Annual Single Audit Report
TWC Annual Monitoring Reports
NCTCOG Comprehensive Annual Financial Report
Joint O&A and Executive Committee Budget Approval
Board Chair signs all contracts with funding entities
Review and follow-up on corrective action plans required by TWC
Annual Independent Audit Opinion Contains Internal Control Review Statements
Board Chair and Lead CEO review of TWC annual monitoring reports.
Report of findings and recommendations identified by TWC annual monitoring reports
Report of internal monitoring to O&A
O&A follow-up on findings and recommendations
Policies are reviewed by committees, approved by Board and signed by the Board Chair
O&A review of performance related issues pertaining to TWC annual formally contracted performance measures.
Vacancies and attrition factors reported periodically
New positions, and their purpose, are described to the Board
The work of staff is periodically shared with the Board
Staff development and achievement is routinely shared with the Board
Make available executive summaries of non-financial internal processes and controls. (2)
Update the Workforce Board periodically regarding the existing financial controls and financial internal control review conducted by an independent CPA firm.(1)
Periodic review of financial policies, processes and internal controls (1)
Provide annual HR Report (3)
Provide risk and compliance reports of Board funds include fiscal monitoring reports of certain administrative processes such as Workforce budgeting and cost allocation processes.(1)

September 9, 2017 Workforce Solutions for North Central Texas 2
Control
1
Fiscal Agent/ Procurement
2
Administrative Agent
Programs, Planning,
Technology
3
Staffing Entity
Opportunities to Strengthen our
Relationship with the Board
Provide fiscal monitoring reports of WF Sub recipients Risk and compliance monitoring reports of certain administrative processes such as Workforce budgeting and cost allocation processes
B. How the COG protects the Board’s assets.
Annual physical asset tracking and inventory Independent single audit CPAs on financial team Certified fraud examiner on staff Insurance that covers inventory and equipment within Workforce centers and at NCTCOG headquarters.
Insurance Bonding Credentialed HR staff Employee benefits management Internal and external counsel Annual risk assessment with external review
Insurance Board named as beneficiaries on an Errors & Omission policy carried by the NCTCOG with a $10k deductible Bonding and Employee background check Drug Screening for all new hires and reasonable suspicion of current employees
Provide summary report of annual asset inventory to the Board. (1,2)
Provide insurance coverage information to the Board periodically. (All) Annual HR Report (3) Create policy regarding ownership of documents and information. (1,2)

September 9, 2017 Workforce Solutions for North Central Texas 3
Control
1
Fiscal Agent/ Procurement
2
Administrative Agent
Programs, Planning,
Technology
3
Staffing Entity
Opportunities to Strengthen our
Relationship with the Board
Fidelity bond and error and omissions insurance
Annual review of IT system access The provision of annual IT Information Systems Security Training Annual Internal Control Questionnaire
Annual background check and screening of key staff Personnel appraisal system Mandatory training in high risk areas Workers compensation insurance HR Card provides periodic review of competitive hiring process, assessment techniques, performance evaluation processes, and compliance with federal law. NCTCOG HR has an employee development plan as part of corrective action process for performance improvement.

September 9, 2017 Workforce Solutions for North Central Texas 4
Control
1
Fiscal Agent/ Procurement
2
Administrative Agent
Programs, Planning,
Technology
3
Staffing Entity
Opportunities to Strengthen our
Relationship with the Board
C. How the COG ensures all financial and non-financial transactions done on behalf of the Board are reliable, verifiable, and objective.
NCTCOG Annual Single Audit NCTCOG Executive Committee Audit Committee annual review of single audit TWC Review, NCTCOG CAFR NCTCOG monthly Cash Draw and Expenditure Reports (CDER) to TWC
Grant closeout report to TWC within 60 days of closing a grant On special grants monthly invoice to TWC, such as for Summer Earn and
Strategic Plan progress reports IT security systems software and reports Annual Internal Control Questionnaire development and provided to TWC for validation.
HR Card provides periodic review of competitive hiring process, assessment techniques, performance evaluation processes, and compliance with federal law.
Make available “up-time” reports for IT systems (2) Update the Workforce Board periodically regarding the existing fiscal controls and fiscal internal control review conducted by an independent CPA firm.(1) Oversight & Accountability Committee review of NCTCOG CAFR. (1) Annual HR Report (3) Review and make recommendations regarding technology plans, policies, and strategies relating to Board business. (All) Review of risk and compliance reports of Board funds to include fiscal monitoring reports of certain administrative processes such as

September 9, 2017 Workforce Solutions for North Central Texas 5
Control
1
Fiscal Agent/ Procurement
2
Administrative Agent
Programs, Planning,
Technology
3
Staffing Entity
Opportunities to Strengthen our
Relationship with the Board
Learn (We’re treated as a vendor for these funds
workforce budgeting and cost allocation processes (1)
D. How the COG demonstrates separation of duties in order to prevent fraud and abuse.
Processes require multiple sign offs Procurement procedures require different levels of approval Access to finance automation systems limited. Authorization to expend funds policy TWC Annual Internal Control Questionnaire Annual Independent Audit Opinion Contains Internal Control Review Statements
Processes require multiple sign offs Separate QA department QA reviews all policies for compliance with federal rule prior to Board approval
Scope of job duties defined in job descriptions HR policies and procedures to include Conflicts of Interest, Whistleblower and Code of Ethical Conduct
Board authorization to expend funds over defined threshold.(1) Clarify separation of duties regarding staffing function. (3) Update the Workforce Board periodically regarding the existing fiscal controls and fiscal internal control review conducted by an independent CPA firm. (1) Make available procedures regarding resolving potential conflict of interest and competing interests (3)
Update the Workforce Board periodically

September 9, 2017 Workforce Solutions for North Central Texas 6
Control
1
Fiscal Agent/ Procurement
2
Administrative Agent
Programs, Planning,
Technology
3
Staffing Entity
Opportunities to Strengthen our
Relationship with the Board
E. How the COG controls access to Board assets both financial and non-financial.
Financial IT systems limit access Annual Internal Control Questionnaire Annual Independent Audit Opinion Contains Internal Control Review Statements
IT systems limit access to data systems Utilize Systems Access Manager (SAM) Database to manage access to various Board managed applications from a single point of control.
Defined roles and responsibilities limit access Automated Systems have Limited Access
regarding the existing fiscal controls and fiscal internal control review conducted by an independent CPA firm.(1) Create policy regarding ownership of documents and information. (1,2) Board authorization to expend funds over defined threshold (1,2) Report on TWC or DOL review regarding Board cost allocation plan. (1)
F. How the COG ensures the Board has approval authority of all financial and non-financial assets and business matters.
Budgeting process, Review of major procurements Purchases over $100,000 are approved by the Workforce Board Annual TWC Internal Control Questionnaire
Board approval of strategic plan Review and approval of Board policies.
The Board approves all budgeted Full Time Equivalents (FTE).
The Board to approve the Workforce Development department’s Executive Director’s job description. (3)

September 9, 2017 Workforce Solutions for North Central Texas 7
Control
1
Fiscal Agent/ Procurement
2
Administrative Agent
Programs, Planning,
Technology
3
Staffing Entity
Opportunities to Strengthen our
Relationship with the Board
G. How the COG demonstrates a commitment to integrity and ethical values
Single audit Policy and procedure Annual Independent Audit Opinion Contains Internal Control Review Statements TWC monitoring Signatory authority Access to systems Separation of duties Internal Auditors Certified Fraud Examiner on staff provides reports to the Board.
Conflict of interest policies Required training Contract with funding agencies Staff orientation Standard of Conduct policies Monitoring of policies Separation of duties Submission of incident reports to TWC to report any negative incidents involving workforce system customers.
HR background checks Policies available to all staff for guidance Supervisors trained to assist with personnel and compliance issues Mandatory training Separation of duties in HR
Update the Workforce Board periodically regarding the existing fiscal controls and fiscal internal control review conducted by an independent CPA firm.(1)
Make available Internal Compliance Program to report fraud and ethics concerns, maintained by a third-party vendor (2)
Review of risk and compliance reports of Board funds. This would include fiscal monitoring reports of certain administrative processes such as Workforce budgeting and cost allocation processes (1)

September 9, 2017 Workforce Solutions for North Central Texas 8
Control
1
Fiscal Agent/ Procurement
2
Administrative Agent
Programs, Planning,
Technology
3
Staffing Entity
Opportunities to Strengthen our
Relationship with the Board
H. How the Board’s business needs are met.
Board’s Strategic Plan CQI is moving budgeting process to align with strategic plan
Network Infrastructure of the Future Workgroup Board strategic plan requires implementation of interdepartmental agreements to include deliverables
Succession planning Recruiting and hiring process Employment development Wage studies.
Alignment of budget and strategic plan not complete (1,2) Interdepartmental agreement policies and processes not complete (2) Clarify Board’s line of authority regarding business matters. (All)
I. How the Board demonstrates independence from management
Budget approval Approval of budget amendments Receive single audit report Approve purchases over $100,000 prior to being considered by the NCTCOG Executive Board
Provide oversight through O&A Board approval of strategic plan Board approval of program policies Board control over agenda Bylaws Retain own counsel
Provide guidance to Executive Director
Consistently provide feedback to NCTCOG regarding Executive Director of Workforce’s job performance. Actively participate in hiring and performance appraisal of ED (1)

September 9, 2017 Workforce Solutions for North Central Texas 9
Control
1
Fiscal Agent/ Procurement
2
Administrative Agent
Programs, Planning,
Technology
3
Staffing Entity
Opportunities to Strengthen our
Relationship with the Board
Internal monitoring reports provided to O&A chair and available to all Board members TWC monitoring provided directly to Board Chair and Lead CEO
J. How the Board ascertains whether components of internal controls are present and functioning
Single audit Annual Independent Audit Opinion Contains Internal Control Review Statements Annual TWC Internal Control Questionnaire TWC report DOL reports Bimonthly finance/budget reports Report of any Personally Identifiable
Bimonthly performance reports Monitoring reports available to all Board members Committee structure A PII Breach Report is required for all incidents resulting in the possible compromise of any sensitive personally identifiable information.
HR Card Report on HR card annually (3) Update the Workforce Board periodically regarding the existing financial controls and Financial internal control review conducted by an independent CPA firm. (1)
Program specific external audit not conducted (not required under single audit). (1)

September 9, 2017 Workforce Solutions for North Central Texas 10
Control
1
Fiscal Agent/ Procurement
2
Administrative Agent
Programs, Planning,
Technology
3
Staffing Entity
Opportunities to Strengthen our
Relationship with the Board
Information (PII) breaches.