September 24-25, 2003 HAPL meeting, UW, Madison 1 Armor Configuration & Thermal Analysis...
13
September 24-25, 2003 HAPL meeting, UW, Madison 1 Armor Configuration & Thermal Analysis 1. Parametric analysis in support of system studies 2. Preliminary scoping analysis of the use of a porous armor layer A. René Raffray UCSD HAPL Program Meeting University of Wisconsin, Madison September 24-25, 2003
-
Upload
agatha-lawrence -
Category
Documents
-
view
216 -
download
1
Transcript of September 24-25, 2003 HAPL meeting, UW, Madison 1 Armor Configuration & Thermal Analysis...

September 24-25, 2003 HAPL meeting, UW, Madison
1
Armor Configuration & Thermal Analysis
1. Parametric analysis in support of system studies
2. Preliminary scoping analysis of the use of a porous armor layer
A. René Raffray
UCSD
HAPL Program Meeting
University of Wisconsin, Madison
September 24-25, 2003

September 24-25, 2003 HAPL meeting, UW, Madison
2
Integrated Chamber Armor/FW/Blanket Analysis Required for Chamber System Studies
• Chamber engineering constraints are set by limits on maximum temp. and cyclic temperature behavior of armor (W) and of structural material (ferritic steel), which depend on:• IFE system parameters
– e.g. yield, rep rate, chamber size, protective gas density
• Chamber first wall and blanket design parameters for example configuration- e.g. coolant inlet and outlet temperatures, first wall structural material thickness,
armor thickness and properties (including engineered materials) and heat transfer coefficient at coolant
• Use RACLETTE-IFE code in conjunction with photon and ion energy deposition models to provide series of runs to be used as input data for system studies- Update code to include a second layer in the geometry
for modeling W + FS wall with a convective boundary condition at the coolant interface
- Add capability to model over many cycles- Compare with other modeling results for consistency
Coolant
FSW
q

September 24-25, 2003 HAPL meeting, UW, Madison
3
Example Results Comparing W Temperature Histories for Armor Thicknesses of 0.05 mm and 0.5 mm, respectively
154 MJ yieldNo gas Rep Rate =10Rchamber = 6.5 mFS = 2.5mmTcoolant= 500°C
0
500
1000
1500
2000
2500
3000
3500
0 1 2 3 4 5 6 7 8 9
Time (s)
0.05mm Tungsten armor
Density = 19350 kg/m3
2.5 mm FS layerCoolant Temp. = 500°C
h =10 kW/m2-K154 MJ DD Target SpectraRep rate = 10
0
500
1000
1500
2000
2500
3000
3500
0 1 2 3 4 5 6 7 8 9
Time (s)
0.5-mm Tungsten armor
Density = 19350 kg/m3
2.5 mm FS layerCoolant Temp. = 500°C
h =10 kW/m2-K154 MJ DD Target SpectraRep rate = 10
W=0.05mm W=0.5mm
• Not much difference in maximum W temperature and in number of cycles to ramp up to the maximum temperature level Coolant (h)
FSW
q
September 24-25, 2003 HAPL meeting, UW, Madison
4
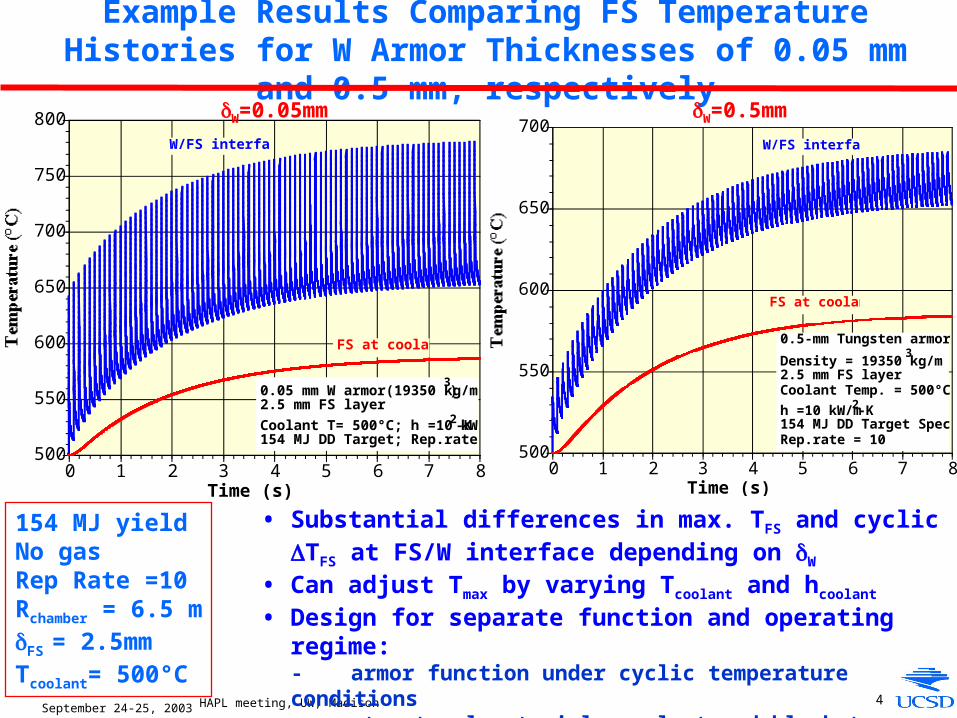
Example Results Comparing FS Temperature Histories for W Armor Thicknesses of 0.05 mm and 0.5 mm, respectively
500
550
600
650
700
750
800
0 1 2 3 4 5 6 7 8Time (s)
0.05 mm W armor(19350 kg/m3)
2.5 mm FS layer
Coolant T= 500°C; h =10 kW/m2-K154 MJ DD Target; Rep.rate = 10
W/FS interface
FS at coolant
154 MJ yieldNo gas Rep Rate =10Rchamber = 6.5 mFS = 2.5mmTcoolant= 500°C
500
550
600
650
700
0 1 2 3 4 5 6 7 8Time (s)
0.5-mm Tungsten armor
Density = 19350 kg/m3
2.5 mm FS layerCoolant Temp. = 500°C
h =10 kW/m2-K154 MJ DD Target SpectraRep.rate = 10
W/FS interface
FS at coolant
• Substantial differences in max. TFS and cyclic TFS at FS/W interface depending on W
• Can adjust Tmax by varying Tcoolant and hcoolant
• Design for separate function and operating regime:- armor function under cyclic temperature conditions- structural material, coolant and blanket operation designed for
quasi steady-state
W=0.05mm W=0.5mm

September 24-25, 2003 HAPL meeting, UW, Madison
5
H
H
H
H
HH
600
650
700
750
800
850
0
20
40
60
80
100
120
140
0 0.2 0.4 0.6 0.8 1 1.2 1.4 1.6
Rchamber
=6.5 m
Tcoolant
=500°C
Yield = 154 MJRep. Rate = 10δW = 1 mmδFS = 2.5 mm
Armor Region Thickness (mm)
Max. TFS
Max. ΔTFS
Maximum TW, TFS, TFS as a Function of Armor Thickness for Example Parameters
• Must be integrated with chamber system modeling for consistent overall blanket and armor design parameters
• For given IFE conditions and chamber parameters, set maximum possible W (to minimize cyclic TFS and FS Tmax and provide lifetime margin) that would accommodate:- maximum allowable TW
- fabrication
• Maximum W temperature is virtually constant over range of armor thicknesses, ~ 3050°C
September 24-25, 2003 HAPL meeting, UW, Madison
6
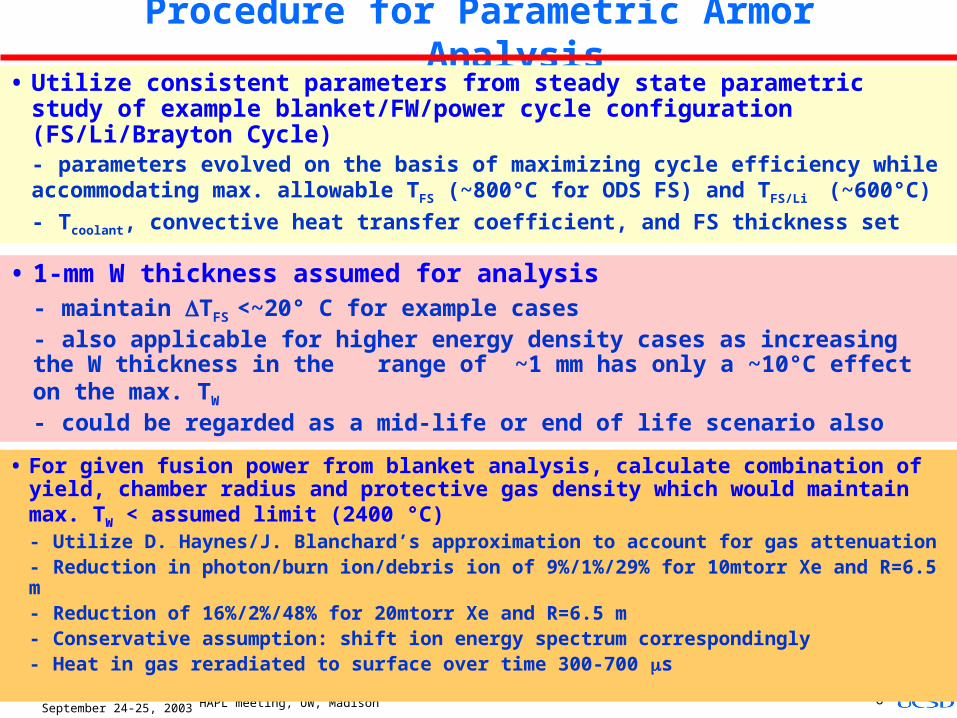
Procedure for Parametric Armor Analysis• Utilize consistent parameters from steady state parametric study of example
blanket/FW/power cycle configuration (FS/Li/Brayton Cycle)- parameters evolved on the basis of maximizing cycle efficiency while
accommodating max. allowable TFS (~800°C for ODS FS) and TFS/Li (~600°C)
- Tcoolant, convective heat transfer coefficient, and FS thickness set
• 1-mm W thickness assumed for analysis - maintain TFS <~20° C for example cases - also applicable for higher energy density cases as increasing the W thickness in the
range of ~1 mm has only a ~10°C effect on the max. TW
- could be regarded as a mid-life or end of life scenario also
• For given fusion power from blanket analysis, calculate combination of yield, chamber radius and protective gas density which would maintain max. TW < assumed limit (2400 °C)- Utilize D. Haynes/J. Blanchard’s approximation to account for gas attenuation- Reduction in photon/burn ion/debris ion of 9%/1%/29% for 10mtorr Xe and R=6.5 m- Reduction of 16%/2%/48% for 20mtorr Xe and R=6.5 m- Conservative assumption: shift ion energy spectrum correspondingly- Heat in gas reradiated to surface over time 300-700 s

September 24-25, 2003 HAPL meeting, UW, Madison
7
B
B
B
J
J
J
H
H
H
F
F
F
11
1
é
é
é
é
éé
é éé é
0
10
20
30
40
50
60
0
5
10
15
20
25
30
35
40
0 50 100 150 200 250 300 350 400 450
Yield (MJ)
1 mm W3.5 mm FST
coolant=572°C
h=67 kW/m2-K
Required PXe as a Function of Yield to Maintain TW,max<2400°Cfor 1800 MW Fusion Power and Different R
chamber
Rchamber (m)5.7
6.5
7
8
10
Summary of Armor Parametric Results for a Fusion Power of 1800 MW
• These results are used as input in the system code in combination with results from the blanket/FW/cycle parametric analysis for the given fusion power
Example target survival constraints based on allowable q’’ for case with 100m 10% dense foam and 4000 K Xe (& 16 K target)
September 24-25, 2003 HAPL meeting, UW, Madison
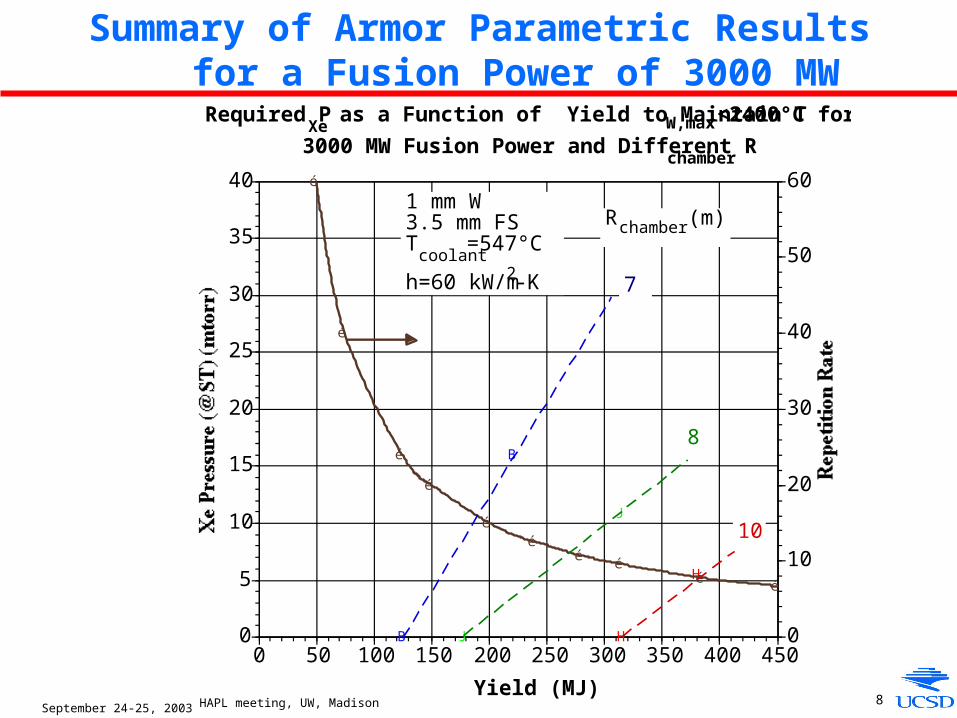
8
B
B
J
J
H
H
é
é
é
é
éé
éé
éé
0
5
10
15
20
25
30
35
40
0
10
20
30
40
50
60
0 50 100 150 200 250 300 350 400 450
Yield (MJ)
1 mm W3.5 mm FST
coolant=547°C
h=60 kW/m2-K
Rchamber (m)
Required PXe
as a Function of Yield to Maintain TW,max<2400°C for
3000 MW Fusion Power and Different Rchamber
7
10
8
Summary of Armor Parametric Results for a Fusion Power of 3000 MW

September 24-25, 2003 HAPL meeting, UW, Madison
9
Scoping Study of Thermal Performance of Armor with a Porous Layer
- PPI plans to develop nano-scaled engineered W for armor applications as part of current SBIR Phase I grant• Work with PPI to help optimize material microstructure
characteristics (e.g. microstructure characteristic dimension, porosity, pore sizes, heterogeneity)– Minimize resistance to migration and release of implanted He
– Provide adequate heat transfer performance
– Use RACLETTE-IFE with adjusted material property data and energy deposition input to help understand impact on integrated chamber armor/FW/blanket system

September 24-25, 2003 HAPL meeting, UW, Madison
10
0x100
1x10¹⁰
2x10¹⁰
3x10¹⁰
4x10¹⁰
5x10¹⁰
6x10¹⁰
7x10¹⁰
1x10⁻⁸ 1x10⁻⁷ 1x10⁻⁶ 1x10⁻⁵ 1x10⁻⁴
0.2
0.8
0.5
Penetration depth (m)
0
W density = 19,350 kg/m3
Porous armor regionthickness = 10 μm
Porous armor regionporosity:
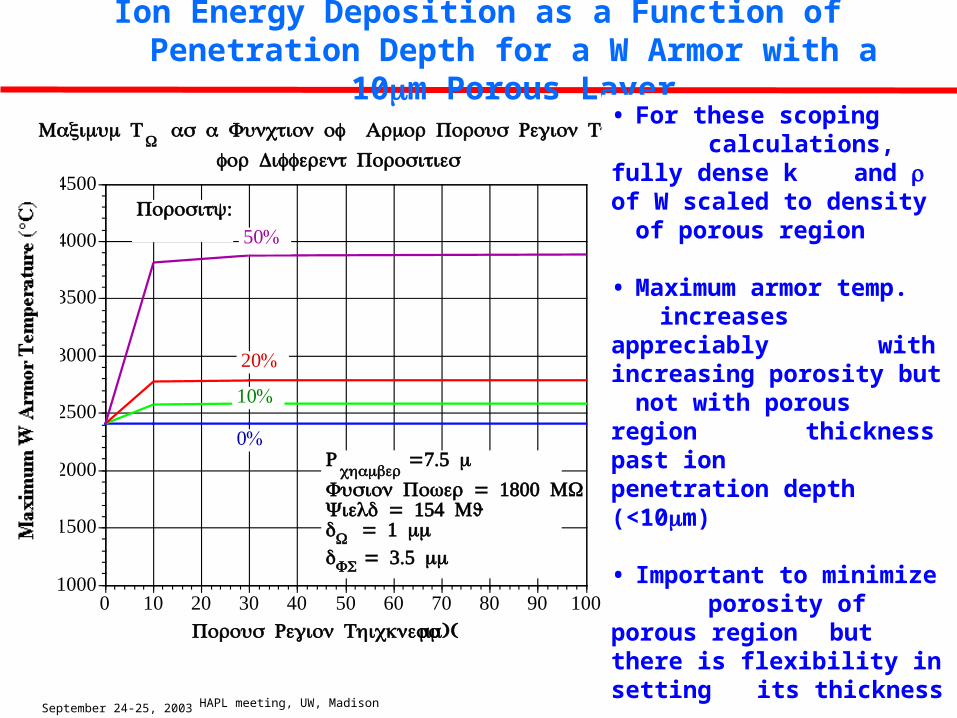
Ion Energy Deposition as a Function of Penetration Depth for a W Armor with a 10m Porous Layer
• Maximum energy deposition decreases and energy penetration depth increases with increasing porosity of the porous layer
September 24-25, 2003 HAPL meeting, UW, Madison
11
1000
1500
2000
2500
3000
3500
4000
4500
0 10 20 30 40 50 60 70 80 90 100
50%
Maximum TW as a Function of Armor Porous Region Thickness
for Different Porosities
Rchamber
=7.5 m = 1800 Fusion Power MW
= 154 Yield MJW = 1 mmFS = 3.5 mm
:Porosity
(Porous Region Thickness )m
20%
10%
0%
Ion Energy Deposition as a Function of Penetration Depth for a W Armor with a 10m Porous Layer
• For these scoping calculations, fully dense k and of W scaled to density of porous region
• Maximum armor temp. increases appreciably with increasing porosity but not with porous region thickness past ion penetration depth (<10m)
• Important to minimize porosity of porous region but there is flexibility in setting its thickness
• Porous region might reduce peak thermal stresses on armor and allow for higher max. temp. limits

September 24-25, 2003 HAPL meeting, UW, Madison
12
0
500
1000
1500
2000
2500
3000
3500
4000
4500
0
500
1000
1500
2000
2500
3000
3500
4000
4500
xporous = 10 m
50% q''' for porosity k and rho for fully dense
xporous = 100 m
q''' for fully dense k and rho for50% porosity
, q''' k and rho for50% porosity
= 154 Yield MJ = 1800 Fusion power MW
Rchamber = 7.5 m
W= 1 mm
FS = 3.5 mm
Assessing Relative Effects of Decrease in Thermal Conductivity and Density and Change in Ion and Photon Energy
Deposition Profile in Porous Region
• Effect on max. TW of decrease in k in porous region dominates opposite effect due to broadening of energy deposition
• Similar results for different thicknesses of porous region (10 and 100 m)

September 24-25, 2003 HAPL meeting, UW, Madison
13
Conclusions
• Scoping study of thermal performance of porous armor region has been performed - Max. TW dependent on porosity of porous region but virtually not on its
thickness (past energy deposition depth)
- Effect of lower thermal conductivity of porous region outweighs counterbalancing effect of energy deposition spread in porous region
- Optimization of porous material based on providing least resistance to migration of implanted He ions while accommodating maximum W temperature constraint (i.e. providing acceptable heat transfer performance)
• Parametric study of armor performed to provide input for initial system studies - W thickness affects TFS at FS/W interface but virtually not max. TW
- Design armor based on transient conditions and FW and blanket based on quasi steady-state conditions
- Study has yielded combination of yield, chamber radius and protective gas density which would maintain max. TW < assumed limit (2400 °C) for
different fusion powers and consistent blanket/FW/cycle parameters