
SEPTEMBER 2016 MONTHLY ECONOMIC REPORTeconomy.scag.ca.gov/Economy site document library...Monthly...
24
Land Use and Environmental Planning Division Research and Analysis Department Los Angeles Imperial Ventura San Bernardino Orange Riverside $ SEPTEMBER 2016 MONTHLY ECONOMIC REPORT
Transcript of SEPTEMBER 2016 MONTHLY ECONOMIC REPORTeconomy.scag.ca.gov/Economy site document library...Monthly...

L a n d U s e a n d E n v i r o n m e n t a l P l a n n i n g D i v i s i o n
R e s e a r c h a n d A n a ly s i s D e p a r t m e n t
Los Angeles
Imperial
Ventura
San Bernardino
Orange Riverside
$
SEPTEMBER 2016
MONTHLY ECONOMIC REPORT

ABOUT THIS REPORT
This report serves to provide timely economic data on the SCAG region and each of the counties within the region –
Imperial, Los Angeles, Orange, Riverside, San Bernardino and Ventura. It charts Southern California’s economic pulse,
giving scholars, agencies and cities insight into the economic health of the region. The information contained herein was
compiled using recent data published by the California Employment Development Department, the U.S. Bureau of Labor
Statistics and the Construction Industry Research Board.
ABOUT SCAG
SCAG is the nation’s largest metropolitan planning organization, representing six counties, 191 cities and more than 18
million residents. SCAG undertakes a variety of planning and policy initiatives to encourage a more sustainable Southern
California now and in the future. For more information about SCAG, please visit www.scag.ca.gov.
For more information, please contact:
John Cho
Associate Regional Planner
Research and Analysis
Land Use and Environmental Planning Division
Email: [email protected]

Monthly Economic Report September 2016
FIGURES 1-5 ARE BASED ON COMBINED TOTAL FOR THE REGION'S COUNTIES.
* Not seasonally-adjusted
FIGURE 1
Wage and Salary
Employment
FIGURE 2
Change in Employment
From Previous Year
FIGURE 3
Comparative
Unemployment Rates
SCAG Region vs. U.S.
2015-2016
5.0
5.5
6.0
6.5
7.0
7.5
8.0
8.5
Sep Oct Nov Dec Jan Feb Mar Apr May Jun Jul Aug
Mill
ion
s o
f Jo
bs
Rest of CA 2014-2015 2015-2016
0
50
100
150
200
250
Sep Oct Nov Dec Jan Feb Mar Apr May Jun Jul Aug
Th
ou
sa
nd
s o
f Jo
bs
2014-2015 2015-2016
0
1
2
3
4
5
6
7
Sep Oct Nov Dec Jan Feb Mar Apr May Jun Jul Aug
Pe
rce
nt
SCAG Region U.S.
Southern California Association of Governments 1

Monthly Economic Report September 2016
FIGURE 4
Percentage Change
in Employment by
Major Sector
(Aug. 2015 - Aug. 2016)
SCAG Region
Trade, Transportation and Utilities
Wholesale Trade
Retail Trade
Transportation, Warehousing and Utilities
Transportation and Warehousing
Air Transportation
Truck Transportation
Warehousing and Storage
Information
Motion Picture and Sound Recording
Telecommunications
Financial Activities
Finance and Insurance
Real Estate and Rental and Leasing
Professional and Business Services
Professional, Scientific and Technical Services
Management of Companies and Enterprises
Administrative and Support and Waste Services
Employment Services
Educational and Health Services
Educational Services
Health Care and Social Assistance
Leisure and Hospitality
Other Services
Government
Federal Government
State and Local Government
State Government
Local Government
* Excludes self employed, unpaid family members, household domestic workers, and workers on strike.
** For Imperial County, includes construction.
-5 0 5 10
Total, All Industries*
Total Farm
Total Nonfarm
Total Private
Goods Producing
Natural Resources and Mining**
Construction
Manufacturing
Durable Goods
Nondurable Goods
Service Providing
Trade, Transportation and Utilities
Wholesale Trade
Retail Trade
Transportation, Warehousing and Utilities
Transportation and Warehousing
Air Transportation
Truck Transportation
Warehousing and Storage
Information
Motion Picture and Sound Recording
Telecommunications
Financial Activities
Finance and Insurance
Real Estate and Rental and Leasing
Professional and Business Services
Professional, Scientific and Technical Services
Management of Companies and Enterprises
Administrative and Support and Waste Services
Employment Services
Educational and Health Services
Educational Services
Health Care and Social Assistance
Leisure and Hospitality
Other Services
Government
Federal Government
State and Local Government
State Government
Local Government
Percent
Southern California Association of Governments 2
Monthly Economic Report September 2016
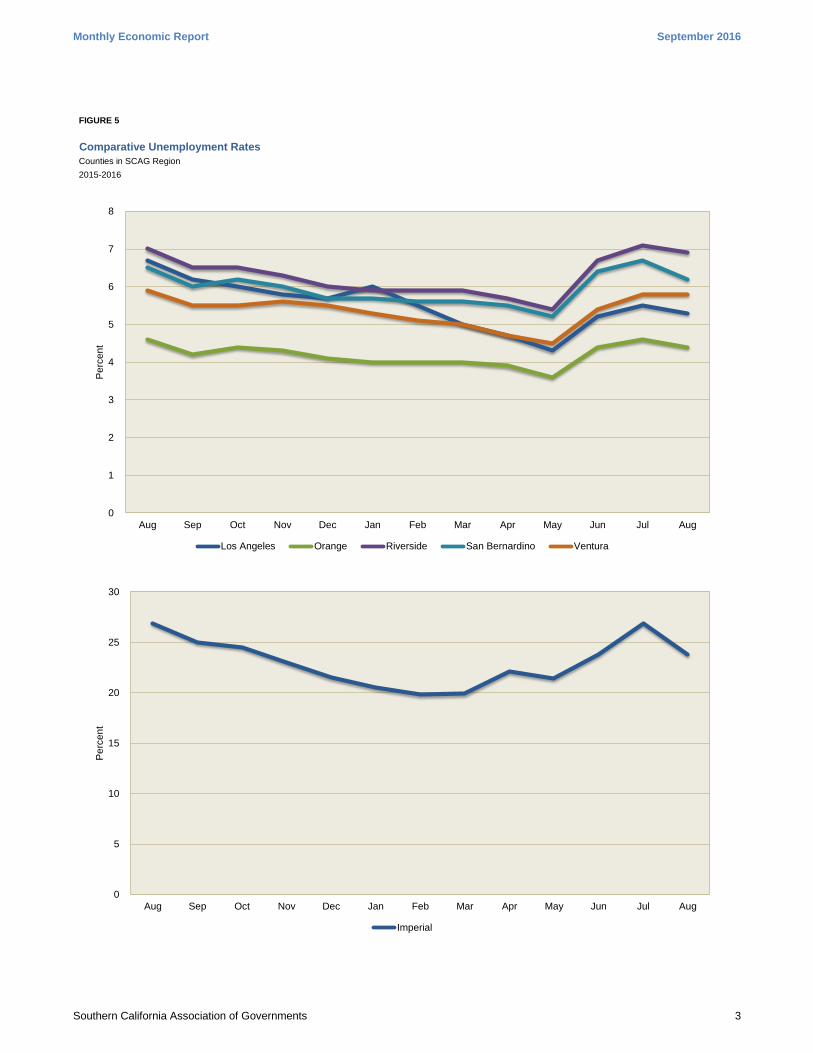
FIGURE 5
Comparative Unemployment Rates
Counties in SCAG Region
2015-2016
0
1
2
3
4
5
6
7
8
Aug Sep Oct Nov Dec Jan Feb Mar Apr May Jun Jul Aug
Perc
en
t
Los Angeles Orange Riverside San Bernardino Ventura
0
5
10
15
20
25
30
Aug Sep Oct Nov Dec Jan Feb Mar Apr May Jun Jul Aug
Pe
rce
nt
Imperial
Southern California Association of Governments 3
Monthly Economic Report Imperial County September 2016
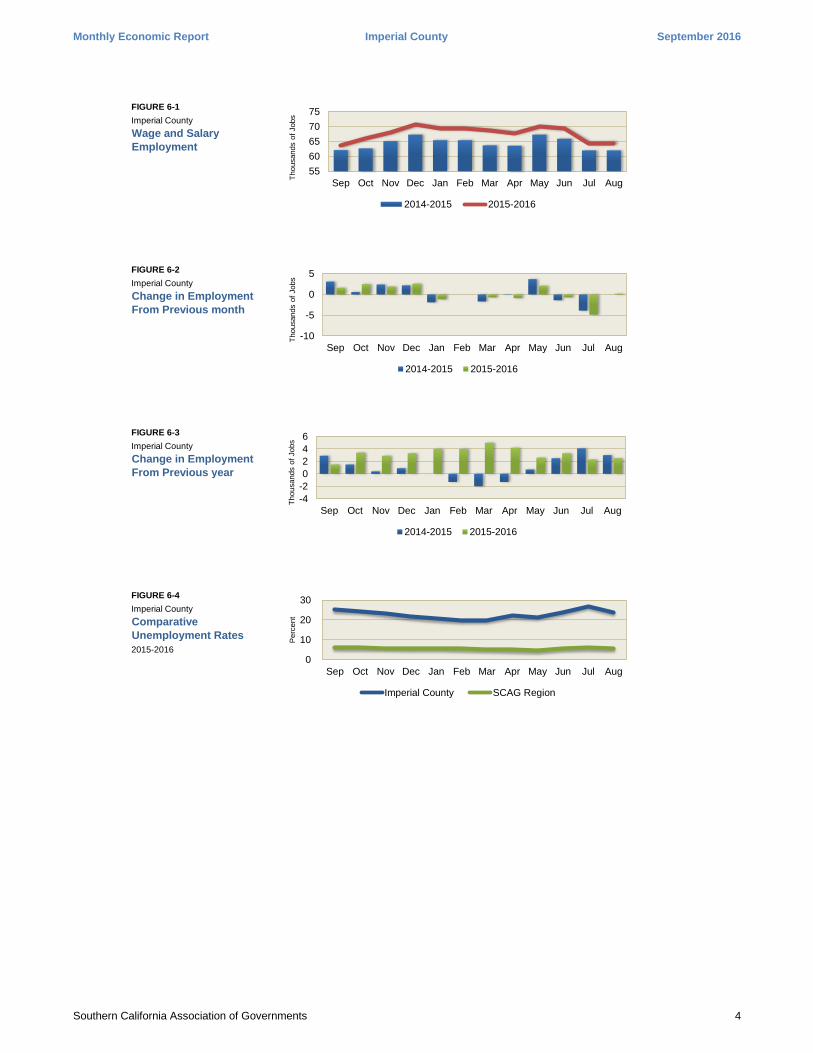
FIGURE 6-1
Imperial County
Wage and Salary
Employment
FIGURE 6-2
Imperial County
Change in Employment
From Previous month
FIGURE 6-3
Imperial County
Change in Employment
From Previous year
FIGURE 6-4
Imperial County
Comparative
Unemployment Rates
2015-2016
55
60
65
70
75
Sep Oct Nov Dec Jan Feb Mar Apr May Jun Jul Aug
Thousands o
f Jobs
2014-2015 2015-2016
-10
-5
0
5
Sep Oct Nov Dec Jan Feb Mar Apr May Jun Jul Aug
Thousands o
f Jobs
2014-2015 2015-2016
0
10
20
30
Sep Oct Nov Dec Jan Feb Mar Apr May Jun Jul Aug
Perc
ent
Imperial County SCAG Region
-4
-2
0
2
4
6
Sep Oct Nov Dec Jan Feb Mar Apr May Jun Jul Aug
Thousands o
f Jobs
2014-2015 2015-2016
Southern California Association of Governments 4
Monthly Economic Report Los Angeles County September 2016
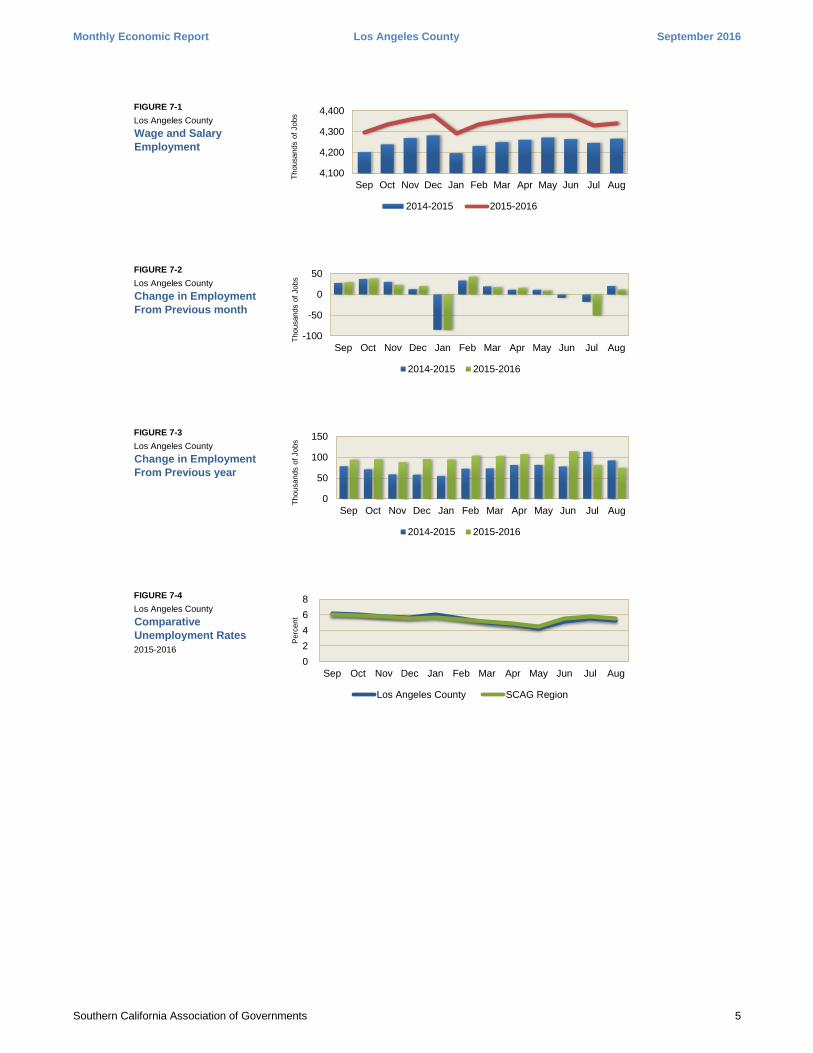
FIGURE 7-1
Los Angeles County
Wage and Salary
Employment
FIGURE 7-2
Los Angeles County
Change in Employment
From Previous month
FIGURE 7-3
Los Angeles County
Change in Employment
From Previous year
FIGURE 7-4
Los Angeles County
Comparative
Unemployment Rates
2015-2016
4,100
4,200
4,300
4,400
Sep Oct Nov Dec Jan Feb Mar Apr May Jun Jul Aug
Thousands o
f Jobs
2014-2015 2015-2016
-100
-50
0
50
Sep Oct Nov Dec Jan Feb Mar Apr May Jun Jul Aug
Thousands o
f Jobs
2014-2015 2015-2016
0
50
100
150
Sep Oct Nov Dec Jan Feb Mar Apr May Jun Jul Aug
Thousands o
f Jobs
2014-2015 2015-2016
0
2
4
6
8
Sep Oct Nov Dec Jan Feb Mar Apr May Jun Jul Aug
Perc
ent
Los Angeles County SCAG Region
Southern California Association of Governments 5

Monthly Economic Report Orange County September 2016
FIGURE 8-1
Orange County
Wage and Salary
Employment
FIGURE 8-2
Orange County
Change in Employment
From Previous month
FIGURE 8-3
Orange County
Change in Employment
From Previous year
FIGURE 8-4
Orange County
Comparative
Unemployment Rates
2015-2016
1,450
1,500
1,550
1,600
1,650
Sep Oct Nov Dec Jan Feb Mar Apr May Jun Jul Aug
Thousands o
f Jobs
2014-2015 2015-2016
-40
-20
0
20
40
Sep Oct Nov Dec Jan Feb Mar Apr May Jun Jul Aug
Thousands o
f Jobs
2014-2015 2015-2016
0
20
40
60
Sep Oct Nov Dec Jan Feb Mar Apr May Jun Jul Aug
Thousands o
f Jobs
2014-2015 2015-2016
0
2
4
6
8
Sep Oct Nov Dec Jan Feb Mar Apr May Jun Jul Aug
Perc
ent
Orange County SCAG Region
Southern California Association of Governments 6
Monthly Economic Report Riverside County September 2016
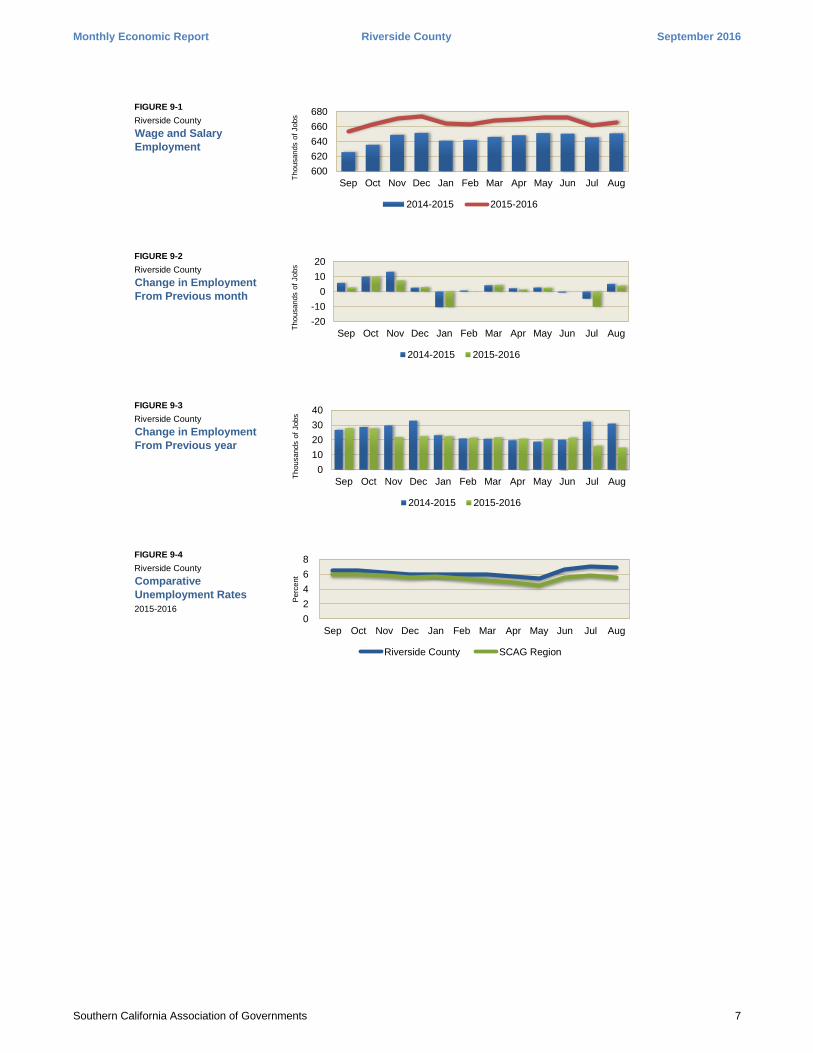
FIGURE 9-1
Riverside County
Wage and Salary
Employment
FIGURE 9-2
Riverside County
Change in Employment
From Previous month
FIGURE 9-3
Riverside County
Change in Employment
From Previous year
FIGURE 9-4
Riverside County
Comparative
Unemployment Rates
2015-2016
600
620
640
660
680
Sep Oct Nov Dec Jan Feb Mar Apr May Jun Jul Aug
Thousands o
f Jobs
2014-2015 2015-2016
-20
-10
0
10
20
Sep Oct Nov Dec Jan Feb Mar Apr May Jun Jul Aug
Thousands o
f Jobs
2014-2015 2015-2016
0
10
20
30
40
Sep Oct Nov Dec Jan Feb Mar Apr May Jun Jul Aug
Thousands o
f Jobs
2014-2015 2015-2016
0
2
4
6
8
Sep Oct Nov Dec Jan Feb Mar Apr May Jun Jul Aug
Perc
ent
Riverside County SCAG Region
Southern California Association of Governments 7
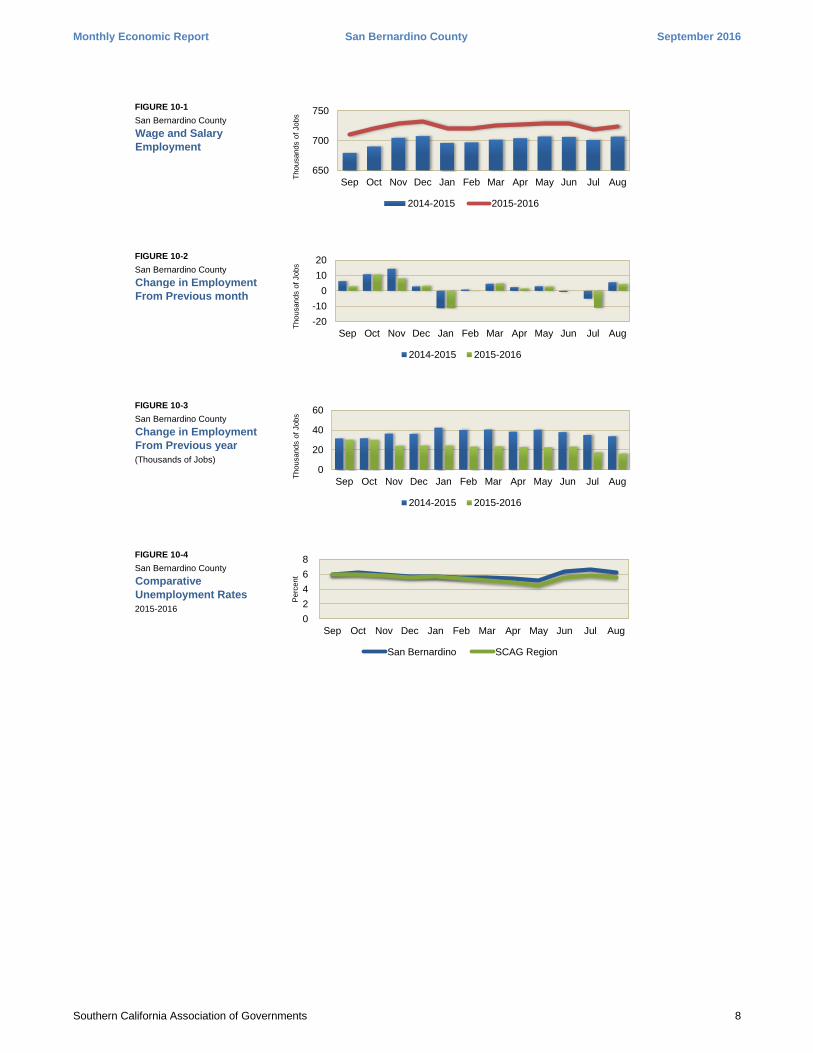
Monthly Economic Report San Bernardino County September 2016
FIGURE 10-1
San Bernardino County
Wage and Salary
Employment
FIGURE 10-2
San Bernardino County
Change in Employment
From Previous month
FIGURE 10-3
San Bernardino County
Change in Employment
From Previous year
(Thousands of Jobs)
FIGURE 10-4
San Bernardino County
Comparative
Unemployment Rates
2015-2016
650
700
750
Sep Oct Nov Dec Jan Feb Mar Apr May Jun Jul Aug
Thousands o
f Jobs
2014-2015 2015-2016
-20
-10
0
10
20
Sep Oct Nov Dec Jan Feb Mar Apr May Jun Jul Aug
Thousands o
f Jobs
2014-2015 2015-2016
0
20
40
60
Sep Oct Nov Dec Jan Feb Mar Apr May Jun Jul Aug
Thousands o
f Jobs
2014-2015 2015-2016
0
2
4
6
8
Sep Oct Nov Dec Jan Feb Mar Apr May Jun Jul Aug
Perc
ent
San Bernardino SCAG Region
Southern California Association of Governments 8
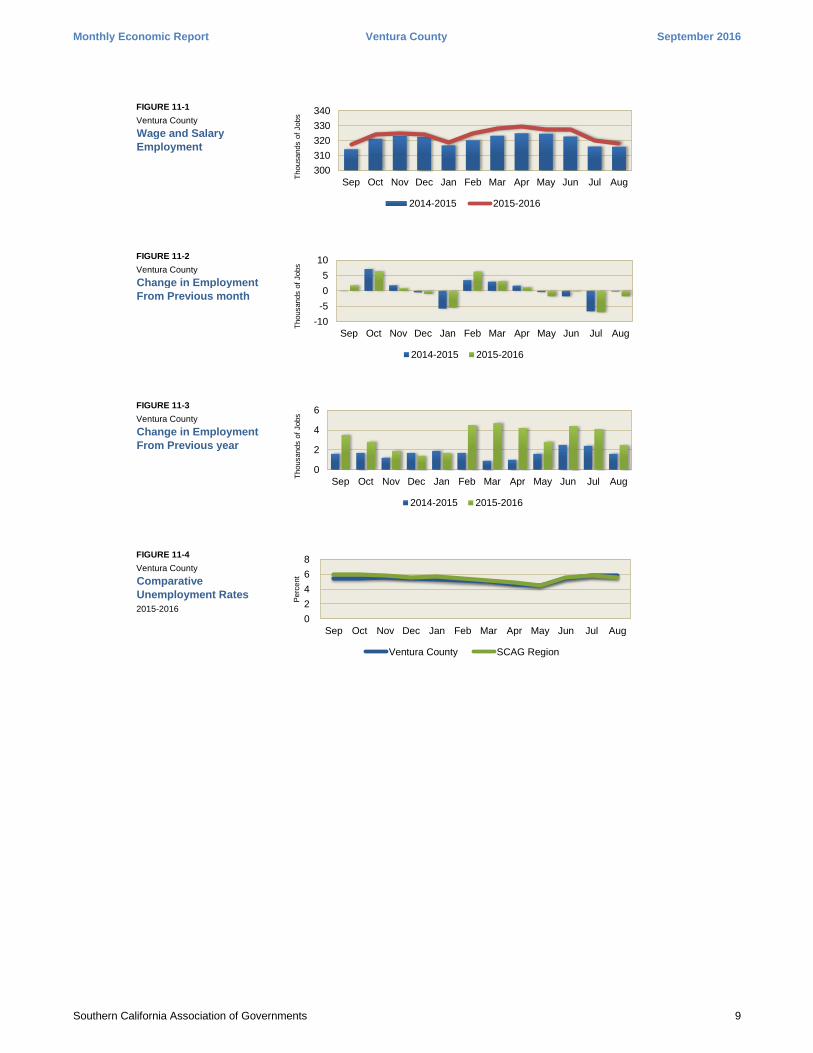
Monthly Economic Report Ventura County September 2016
FIGURE 11-1
Ventura County
Wage and Salary
Employment
FIGURE 11-2
Ventura County
Change in Employment
From Previous month
FIGURE 11-3
Ventura County
Change in Employment
From Previous year
FIGURE 11-4
Ventura County
Comparative
Unemployment Rates
2015-2016
300
310
320
330
340
Sep Oct Nov Dec Jan Feb Mar Apr May Jun Jul Aug
Thousands o
f Jobs
2014-2015 2015-2016
-10
-5
0
5
10
Sep Oct Nov Dec Jan Feb Mar Apr May Jun Jul Aug
Thousands o
f Jobs
2014-2015 2015-2016
0
2
4
6
Sep Oct Nov Dec Jan Feb Mar Apr May Jun Jul Aug
Thousands o
f Jobs
2014-2015 2015-2016
0
2
4
6
8
Sep Oct Nov Dec Jan Feb Mar Apr May Jun Jul Aug
Perc
ent
Ventura County SCAG Region
Southern California Association of Governments 9

Monthly Economic Report SCAG Region September 2016
FIGURE 12
Building Permits
Single Family
FIGURE 13
Building Permits
Multi Family
FIGURE 14
Valuation of Total
Building Permits
FIGURE 15
Valuation of Residential
Building Permits
0
1,000
2,000
3,000
Aug Sep Oct Nov Dec Jan Feb Mar Apr May Jun Jul Aug
Units
2014-2015 2015-2016
0
1,000
2,000
3,000
4,000
Aug Sep Oct Nov Dec Jan Feb Mar Apr May Jun Jul Aug
Units
2014-2015 2015-2016
0
1,000
2,000
3,000
Aug Sep Oct Nov Dec Jan Feb Mar Apr May Jun Jul Aug
Mill
ions o
f D
olla
rs
2014-2015 2015-2016
0
500
1,000
1,500
Aug Sep Oct Nov Dec Jan Feb Mar Apr May Jun Jul Aug
Mill
ions o
f D
olla
rs
2014-2015 2015-2016
Southern California Association of Governments 10
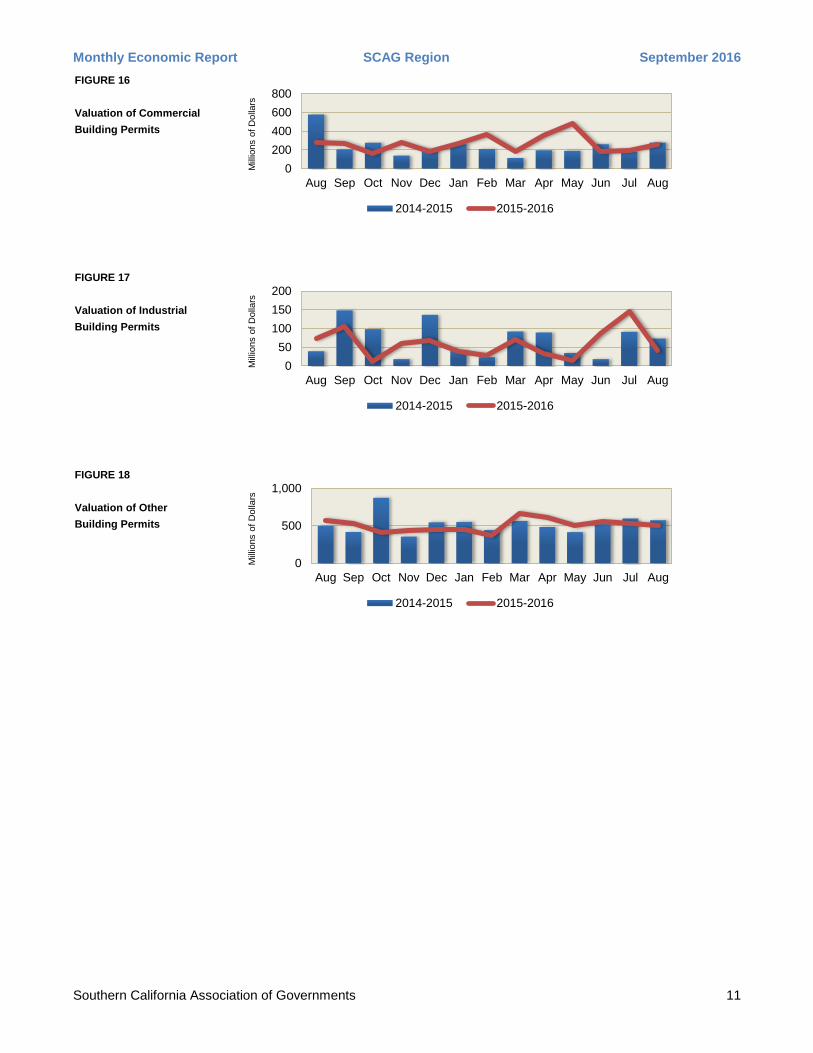
Monthly Economic Report SCAG Region September 2016
FIGURE 16
Valuation of Commercial
Building Permits
FIGURE 17
Valuation of Industrial
Building Permits
FIGURE 18
Valuation of Other
Building Permits
0
200
400
600
800
Aug Sep Oct Nov Dec Jan Feb Mar Apr May Jun Jul Aug
Mill
ions o
f D
olla
rs
2014-2015 2015-2016
0
50
100
150
200
Aug Sep Oct Nov Dec Jan Feb Mar Apr May Jun Jul Aug
Mill
ions o
f D
olla
rs
2014-2015 2015-2016
0
500
1,000
Aug Sep Oct Nov Dec Jan Feb Mar Apr May Jun Jul Aug
Mill
ions o
f D
olla
rs
2014-2015 2015-2016
Southern California Association of Governments 11
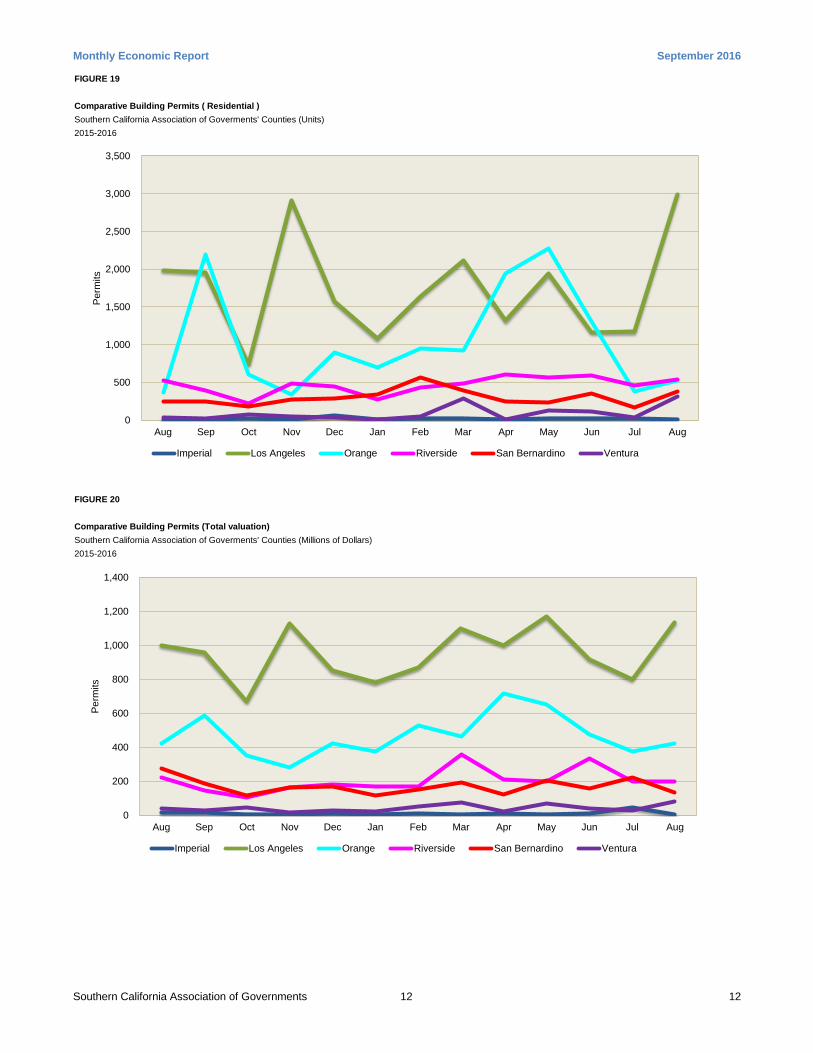
Monthly Economic Report September 2016
FIGURE 19
Comparative Building Permits ( Residential )
Southern California Association of Goverments' Counties (Units)
2015-2016
0
0
FIGURE 20
Comparative Building Permits (Total valuation)
Southern California Association of Goverments' Counties (Millions of Dollars)
2015-2016
0
500
1,000
1,500
2,000
2,500
3,000
3,500
Aug Sep Oct Nov Dec Jan Feb Mar Apr May Jun Jul Aug
Perm
its
Imperial Los Angeles Orange Riverside San Bernardino Ventura
0
200
400
600
800
1,000
1,200
1,400
Aug Sep Oct Nov Dec Jan Feb Mar Apr May Jun Jul Aug
Pe
rmits
Imperial Los Angeles Orange Riverside San Bernardino Ventura
Southern California Association of Governments 12 12

Monthly Economic Report September 2016
FIGURE 21
Comparative Building Permits (Residential valuation)
Southern California Association of Goverments' Counties(Millions of Dollars)
2015-2016
FIGURE 22
Comparative Building Permits (Non-Residental valuation)
Southern California Association of Goverments' Counties (Millions of Dollars)
2015-2016
0
100
200
300
400
500
600
700
800
Aug Sep Oct Nov Dec Jan Feb Mar Apr May Jun Jul Aug
Perm
its
Imperial Los Angeles Orange Riverside San Bernardino Ventura
0
100
200
300
400
500
600
700
Aug Sep Oct Nov Dec Jan Feb Mar Apr May Jun Jul Aug
Mill
ion
s o
f D
olla
rs
Imperial Los Angeles Orange Riverside San Bernardino Ventura
Southern California Association of Governments 13 13

Monthly Economic Report September 2016
TABLE 1 WAGE AND SALARY EMPLOYMENT (THOUSAND JOBS) in SCAG REGION
COUNTY/MSA Aug Sep Oct Nov Dec Jan Feb Mar Apr May Jun Jul Aug
% of
Region
Total
Latest
Month
IMPERIAL
2014-2015 59.0 62.1 62.7 65.1 67.3 65.4 65.4 63.7 63.6 67.3 65.9 62.0 62.0 0.8%
2015-2016 62.0 63.6 66.1 68.0 70.6 69.4 69.4 68.7 67.8 69.9 69.2 64.3 64.5 0.8%
LOS ANGELES2014-2015 4,173.9 4,201.4 4,238.7 4,269.0 4,281.8 4,196.6 4,230.2 4,249.5 4,260.9 4,272.1 4,263.9 4,246.0 4,266.2 56.5%2015-2016 4,266.2 4,295.7 4,334.1 4,357.2 4,377.5 4,291.3 4,334.2 4,352.1 4,368.3 4,377.9 4,378.4 4,327.5 4,340.0 56.4%
ORANGE2014-2015 1,493.3 1,500.8 1,518.8 1,532.0 1,537.3 1,511.6 1,521.2 1,525.8 1,534.8 1,538.1 1,542.9 1,542.2 1,544.8 20.5%2015-2016 1,544.8 1,552.3 1,568.0 1,578.1 1,582.0 1,550.7 1,564.5 1,573.3 1,580.1 1,586.9 1,593.1 1,581.6 1,583.7 20.6%
RIVERSIDE2014-2015 619.9 625.7 635.7 648.9 651.6 641.2 642.0 646.2 648.4 651.2 650.5 645.7 650.9 8.6%2015-2016 650.9 653.7 663.5 671.0 674.0 663.6 663.4 667.9 669.4 672.0 672.0 661.8 665.8 8.7%
SAN BERNARDINO2014-2015 673.1 679.4 690.2 704.6 707.5 696.2 697.1 701.6 704.0 707.0 706.3 701.2 706.7 9.4%2015-2016 706.7 709.8 720.4 728.5 731.9 720.5 720.4 725.3 726.8 729.6 729.6 718.6 722.9 9.4%
VENTURA2014-2015 314.3 314.2 321.3 323.1 322.6 316.8 320.3 323.3 325.0 324.6 322.8 316.1 315.9 4.2%2015-2016 315.9 317.7 324.1 325.0 324.0 318.5 324.8 328.0 329.2 327.4 327.2 320.2 318.4 4.1%
SCAG REGION2014-2015 7,333.4 7,383.6 7,467.4 7,542.7 7,568.1 7,427.8 7,476.1 7,510.1 7,536.7 7,560.3 7,552.3 7,513.2 7,546.5 100.0%2015-2016 7,546.5 7,592.7 7,676.2 7,727.8 7,760.0 7,614.0 7,676.7 7,715.3 7,741.6 7,763.7 7,769.5 7,673.9 7,695.3 100.0%
(12MMA)* 7,507.1 7,524.5 7,541.9 7,557.3 7,573.3 7,588.8 7,605.5 7,622.6 7,639.7 7,656.7 7,674.8 7,688.2 7,700.6
* 12 Month Moving Average (12MMA for August 2016)=Average of August 2015 through August 2016Prepared by Research and Analysis DepartmentSouthern California Association of Governments (SCAG)Source: California Employment Development Department
TABLE 2 CHANGE IN EMPLOYMENT FROM PREVIOUS MONTH (THOUSAND JOBS)
COUNTY/MSA Aug Sep Oct Nov Dec Jan Feb Mar Apr May Jun Jul Aug
IMPERIAL2014-2015 1.1 3.1 0.6 2.4 2.2 -1.9 0.0 -1.7 -0.1 3.7 -1.4 -3.9 0.02015-2016 0.0 1.6 2.5 1.9 2.6 -1.2 0.0 -0.7 -0.9 2.1 -0.7 -4.9 0.2
LOS ANGELES
2014-2015 40.7 27.5 37.3 30.3 12.8 -85.2 33.6 19.3 11.4 11.2 -8.2 -17.9 20.22015-2016 20.2 29.5 38.4 23.1 20.3 -86.2 42.9 17.9 16.2 9.6 0.5 -50.9 12.5
ORANGE
2014-2015 5.6 7.5 18.0 13.2 5.3 -25.7 9.6 4.6 9.0 3.3 4.8 -0.7 2.62015-2016 2.6 7.5 15.7 10.1 3.9 -31.3 13.8 8.8 6.8 6.8 6.2 -11.5 2.1
RIVERSIDE
2014-2015 6.3 5.9 10.0 13.2 2.7 -10.4 0.8 4.2 2.2 2.8 -0.7 -4.8 5.12015-2016 5.1 2.8 9.8 7.5 3.1 -10.5 -0.1 4.5 1.4 2.6 0.0 -10.2 4.0
SAN BERNARDINO
2014-2015 6.9 6.4 10.8 14.4 2.9 -11.3 0.8 4.6 2.4 3.0 -0.7 -5.1 5.62015-2016 5.6 3.0 10.7 8.1 3.3 -11.3 -0.2 4.9 1.6 2.8 0.0 -11.1 4.4
VENTURA
2014-2015 0.6 -0.1 7.1 1.8 -0.5 -5.8 3.5 3.0 1.7 -0.4 -1.8 -6.7 -0.22015-2016 -0.2 1.8 6.4 0.9 -1.0 -5.5 6.3 3.2 1.2 -1.8 -0.2 -7.0 -1.8
SCAG REGION
2014-2015 61.2 50.2 83.8 75.3 25.4 -140.3 48.3 34.0 26.6 23.6 -8.0 -39.1 33.32015-2016 33.3 46.2 83.5 51.6 32.2 -146.0 62.7 38.6 26.3 22.1 5.8 -95.6 21.4
Prepared by Research and Analysis DepartmentSouthern California Association of Governments (SCAG)Source: California Employment Development Department
Southern California Association of Governments 14

Monthly Economic Report September 2016
TABLE 3 CHANGE IN EMPLOYMENT FROM YEAR EARLIER (THOUSAND JOBS)
COUNTY/MSA Aug Sep Oct Nov Dec Jan Feb Mar Apr May Jun Jul Aug
%
Change
in Latest
Month
IMPERIAL2014-2015 0.9 2.9 1.5 0.4 0.9 0.0 -1.3 -2.0 -1.3 0.7 2.5 4.1 3.0 5.1%2015-2016 3.0 1.5 3.4 2.9 3.3 4.0 4.0 5.0 4.2 2.6 3.3 2.3 2.5 4.0%
LOS ANGELES
2014-2015 76.4 78.2 70.8 58.6 57.8 54.6 72.5 73.1 81.3 81.5 77.8 112.8 92.3 2.2%2015-2016 92.3 94.3 95.4 88.2 95.7 94.7 104.0 102.6 107.4 105.8 114.5 81.5 73.8 1.7%
ORANGE
2014-2015 30.9 37.5 43.5 42.8 46.2 47.9 45.0 43.9 46.3 37.3 45.5 54.5 51.5 3.4%2015-2016 51.5 51.5 49.2 46.1 44.7 39.1 43.3 47.5 45.3 48.8 50.2 39.4 38.9 2.5%
RIVERSIDE
2014-2015 28.5 26.8 28.7 29.8 33.0 23.2 21.1 20.8 19.8 18.9 20.2 32.2 31.0 5.0%2015-2016 31.0 28.0 27.8 22.1 22.4 22.4 21.5 21.8 21.0 20.8 21.5 16.0 14.9 2.3%
SAN BERNARDINO
2014-2015 27.5 31.6 31.7 36.3 36.1 42.4 40.0 40.5 38.4 40.2 37.8 35.0 33.7 5.0%2015-2016 33.7 30.3 30.2 23.9 24.4 24.3 23.3 23.6 22.8 22.6 23.3 17.4 16.2 2.3%
VENTURA
2014-2015 2.9 1.6 1.7 1.2 1.7 1.9 1.7 0.9 1.0 1.6 2.5 2.4 1.6 0.5%2015-2016 1.6 3.5 2.8 1.9 1.4 1.7 4.5 4.7 4.2 2.8 4.4 4.1 2.5 0.8%
SCAG REGION
2014-2015 167.1 178.6 177.9 169.1 175.7 170.0 179.0 177.2 185.5 180.2 186.3 241.0 213.1 2.9%2015-2016 213.1 209.1 208.8 185.1 191.9 186.2 200.6 205.2 204.9 203.4 217.2 160.7 148.8 2.0%
Prepared by Research and Analysis DepartmentSouthern California Association of Governments (SCAG)Source: California Employment Development Department
TABLE 4 COMPARATIVE UNEMPLOYMENT RATES (PERCENT, NOT SEASONALLY ADJUSTED) 2015 2016
AREA Aug Sep Oct Nov Dec Jan Feb Mar Apr May Jun Jul Aug
UNITED STATES 5.2 4.9 4.8 4.8 4.8 5.3 5.2 5.1 4.7 4.5 5.1 5.1 5.0
CALIFORNIA 6.1 5.6 5.8 5.8 5.7 5.8 5.7 5.6 5.2 4.7 5.7 5.9 5.6
SCAG REGION 6.5 6.0 5.9 5.8 5.6 5.7 5.4 5.1 4.9 4.5 5.5 5.8 5.6
IMPERIAL 26.9 25.0 24.5 23.0 21.5 20.5 19.8 19.9 22.1 21.4 23.8 26.9 23.8 LOS ANGELES 6.7 6.2 6.0 5.8 5.7 6.0 5.5 5.0 4.7 4.3 5.2 5.5 5.3 ORANGE 4.6 4.2 4.4 4.3 4.1 4.0 4.0 4.0 3.9 3.6 4.4 4.6 4.4 RIVERSIDE 7.0 6.5 6.5 6.3 6.0 5.9 5.9 5.9 5.7 5.4 6.7 7.1 6.9 SAN BERNARDINO 6.5 6.0 6.2 6.0 5.7 5.7 5.6 5.6 5.5 5.2 6.4 6.7 6.2 VENTURA 5.9 5.5 5.5 5.6 5.5 5.3 5.1 5.0 4.7 4.5 5.4 5.8 5.8
SCAG-US 1.3 1.1 1.1 1.0 0.8 0.4 0.2 0.0 0.2 0.0 0.4 0.7 0.6 Difference between SCAG and U.S. Unemployment Rate
Prepared by Research and Analysis DepartmentSouthern California Association of Governments (SCAG)Source: California Employment Development Department
Southern California Association of Governments 15

Monthly Economic Report September 2016
TABLE 5 CURRENT EMPLOYMENT AND CHANGE IN EMPLOYMENT FROM YEAR EARLIER, BY MAJOR SECTOR * August, 2016
Jobs by Sector (Thousands) Change in Employment from Year Earlier (Thousands) REGION TOTAL
Imperial Los Angeles Orange
Riverside/
San
Bernardino Ventura TOTAL Imperial Los Angeles Orange
Riverside/
San
Bernardino Ventura Thousands Percent
Total, All Industries* 64.5 4,340.0 1,583.7 1,388.7 318.4 7,695.3 2.5 73.8 38.9 31.1 2.5 148.8 2.0%Total Farm 11.7 4.8 2.3 12.9 23.5 55.2 0.4 -0.1 -0.1 0.3 0.5 1.0 1.8%Total Nonfarm 52.8 4,335.2 1,581.4 1,375.8 294.9 7,640.1 2.1 73.9 39.0 30.8 2.0 147.8 2.0%Total Private 35.2 3,790.4 1,435.4 1,141.9 251.3 6,654.2 1.7 69.3 38.1 22.1 1.0 132.2 2.0%Goods Producing 4.4 489.2 261.0 192.4 45.6 992.6 0.3 -7.2 9.6 5.6 -0.8 7.5 0.8%Natural Resources and Mining** 3.3 3.5 0.6 1.2 0.8 9.4 0.4 -0.4 -0.1 -0.1 -0.2 -0.4 -4.1%Construction N/A 129.9 103.3 92.7 14.8 340.7 N/A -0.4 10.2 3.2 0.0 13.0 4.0%Manufacturing 1.1 355.8 157.1 98.5 30.0 642.5 -0.1 -6.4 -0.5 2.5 -0.6 -5.1 -0.8% Durable Goods 0.5 200.7 117.0 63.9 17.9 400.0 0.0 -3.1 1.2 0.6 -0.9 -2.2 -0.5% Nondurable Goods 0.6 155.1 40.1 34.6 12.1 242.5 -0.1 -3.3 -1.7 1.9 0.3 -2.9 -1.2%Service Providing 48.4 3,846.0 1,320.4 1,183.4 249.3 6,647.5 1.8 81.1 29.4 25.2 2.8 140.3 2.2%Trade, Transportation and Utilities 12.5 827.4 263.4 343.3 57.9 1,504.5 0.5 8.1 4.0 9.1 -0.4 21.3 1.4%Wholesale Trade 1.9 226.6 84.7 65.1 12.9 391.2 0.1 -0.9 3.2 2.4 0.2 5.0 1.3%Retail Trade 8.5 426.6 150.8 174.5 38.9 799.3 0.4 6.9 -0.3 2.0 -0.7 8.3 1.0%Transportation, Warehousing and Utilities 2.1 174.2 27.9 103.7 6.1 314.0 0.0 2.1 1.1 4.7 0.1 8.0 2.6%Transportation and Warehousing N/A 161.8 24.7 98.2 5.0 289.7 N/A 2.0 1.3 4.6 0.1 8.0 2.8% Air Transportation N/A 24.6 N/A N/A N/A 24.6 N/A 1.9 N/A N/A N/A 1.9 8.4% Truck Transportation N/A 28.1 N/A 25.7 N/A 53.8 N/A -0.1 N/A 0.3 N/A 0.2 0.4% Warehousing and Storage N/A 16.8 4.9 44.5 N/A 66.2 N/A 0.8 0.2 2.5 N/A 3.5 5.6%Information 0.3 208.4 26.2 11.4 4.9 251.2 0.0 5.6 0.4 0.0 -0.2 5.8 2.4%Motion Picture and Sound Recording N/A 130.5 N/A N/A N/A 130.5 N/A 6.2 N/A N/A N/A 6.2 5.0%Telecommunications N/A 22.3 7.9 5.3 N/A 35.5 N/A -0.8 -0.2 -0.2 N/A -1.2 -3.3%Financial Activities 1.3 221.1 117.7 43.1 17.3 400.5 0.0 5.1 -1.1 -0.2 -0.3 3.5 0.9%Finance and Insurance N/A 137.3 80.5 25.8 13.2 256.8 N/A 2.3 -0.2 -0.5 -0.2 1.4 0.5%Real Estate and Rental and Leasing N/A 83.8 37.2 17.3 4.1 142.4 N/A 2.8 -0.9 0.3 -0.1 2.1 1.5%Professional and Business Services 2.0 620.3 298.8 145.0 35.2 1,101.3 -0.1 18.6 11.4 0.6 0.6 31.1 2.9%Professional, Scientific and Technical Services N/A 286.7 134.1 40.4 15.9 477.1 N/A 8.1 6.9 0.9 0.3 16.2 3.5%Management of Companies and Enterprises N/A 60.4 29.5 10.0 2.0 101.9 N/A 1.8 0.3 0.3 0.1 2.5 2.5%Administrative and Support and Waste Services N/A 273.2 135.2 94.6 17.3 520.3 N/A 8.7 4.2 -0.6 0.2 12.5 2.5%Employment Services N/A 110.7 60.5 45.8 7.0 224.0 N/A 4.6 1.5 0.6 0.2 6.9 3.2%Educational and Health Services 9.4 757.7 205.5 210.6 42.9 1,226.1 0.6 22.8 7.4 5.2 0.6 36.6 3.1%Educational Services N/A 111.4 24.8 17.1 N/A 153.3 N/A 1.3 1.7 1.2 N/A 4.2 2.8%Health Care and Social Assistance N/A 646.3 180.7 193.5 N/A 1,020.5 N/A 21.5 5.7 4.0 N/A 31.2 3.2%Leisure and Hospitality 4.4 512.3 213.8 150.2 37.9 918.6 0.4 14.6 6.7 0.4 1.5 23.6 2.6%Other Services 0.9 154.0 49.0 45.9 9.6 259.4 0.0 1.7 -0.3 1.4 0.0 2.8 1.1% Government 17.6 544.8 146.0 233.9 43.6 985.9 0.4 4.6 0.9 8.7 1.0 15.6 1.6% Federal Government 2.1 48.1 11.2 20.8 7.4 89.6 -0.1 0.8 0.0 0.3 0.2 1.2 1.4% State and Local Government 15.5 496.7 134.8 213.1 36.2 896.3 0.5 3.8 0.9 8.4 0.8 14.4 1.6% State Government 2.7 84.4 29.7 28.3 2.8 147.9 0.0 1.4 0.6 1.2 0.1 3.3 2.3% Local Government 12.8 412.3 105.1 184.8 33.4 748.4 0.5 2.4 0.3 7.2 0.7 11.1 1.5% Local Government Education N/A 195.1 62.5 107.7 17.5 382.8 N/A -1.3 1.5 5.5 0.6 6.3 1.7%
Note: (N/A) Sector not shown separately in original EDD data for this county. * Excludes self employed, unpaid family members, household domestic workers, and workers on strike. ** For Imperial County, includes construction.
Prepared by Research and Analysis DepartmentSouthern California Association of Governments (SCAG)Source: California Employment Development Department
Southern California Association of Governments 16
Monthly Economic Report September 2016
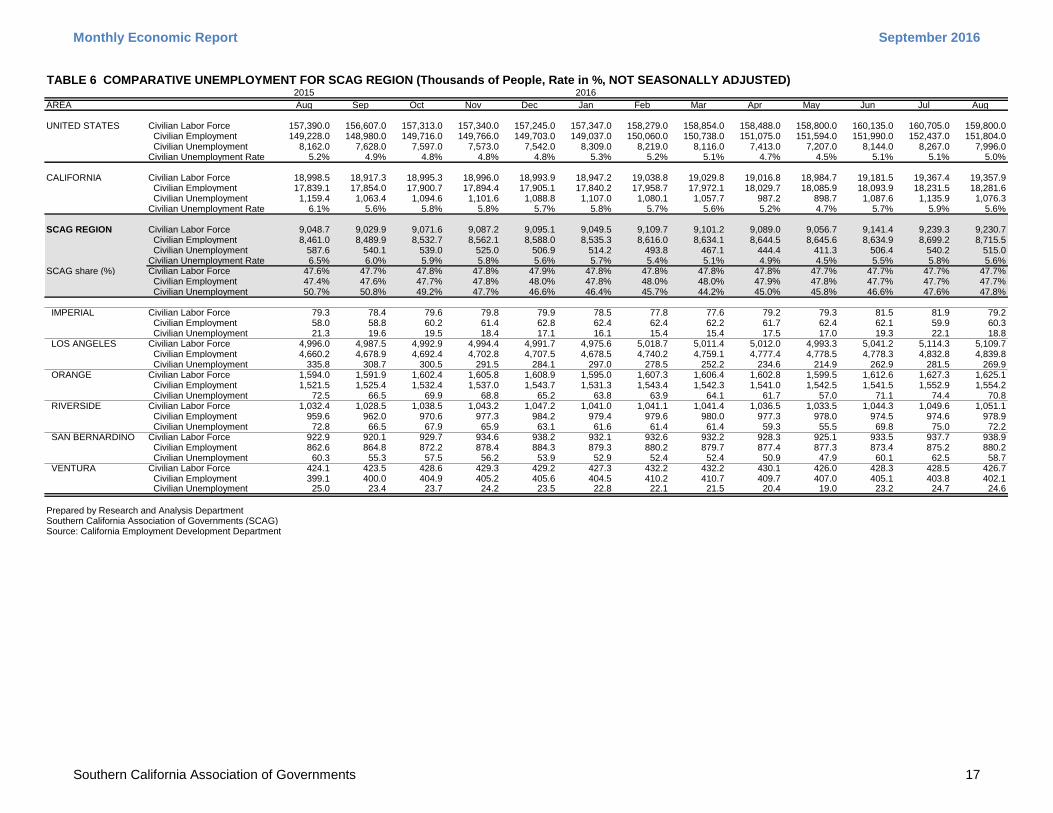
TABLE 6 COMPARATIVE UNEMPLOYMENT FOR SCAG REGION (Thousands of People, Rate in %, NOT SEASONALLY ADJUSTED)2015 2016
AREA Aug Sep Oct Nov Dec Jan Feb Mar Apr May Jun Jul Aug
UNITED STATES Civilian Labor Force 157,390.0 156,607.0 157,313.0 157,340.0 157,245.0 157,347.0 158,279.0 158,854.0 158,488.0 158,800.0 160,135.0 160,705.0 159,800.0 Civilian Employment 149,228.0 148,980.0 149,716.0 149,766.0 149,703.0 149,037.0 150,060.0 150,738.0 151,075.0 151,594.0 151,990.0 152,437.0 151,804.0 Civilian Unemployment 8,162.0 7,628.0 7,597.0 7,573.0 7,542.0 8,309.0 8,219.0 8,116.0 7,413.0 7,207.0 8,144.0 8,267.0 7,996.0Civilian Unemployment Rate 5.2% 4.9% 4.8% 4.8% 4.8% 5.3% 5.2% 5.1% 4.7% 4.5% 5.1% 5.1% 5.0%
CALIFORNIA Civilian Labor Force 18,998.5 18,917.3 18,995.3 18,996.0 18,993.9 18,947.2 19,038.8 19,029.8 19,016.8 18,984.7 19,181.5 19,367.4 19,357.9 Civilian Employment 17,839.1 17,854.0 17,900.7 17,894.4 17,905.1 17,840.2 17,958.7 17,972.1 18,029.7 18,085.9 18,093.9 18,231.5 18,281.6 Civilian Unemployment 1,159.4 1,063.4 1,094.6 1,101.6 1,088.8 1,107.0 1,080.1 1,057.7 987.2 898.7 1,087.6 1,135.9 1,076.3Civilian Unemployment Rate 6.1% 5.6% 5.8% 5.8% 5.7% 5.8% 5.7% 5.6% 5.2% 4.7% 5.7% 5.9% 5.6%
SCAG REGION Civilian Labor Force 9,048.7 9,029.9 9,071.6 9,087.2 9,095.1 9,049.5 9,109.7 9,101.2 9,089.0 9,056.7 9,141.4 9,239.3 9,230.7 Civilian Employment 8,461.0 8,489.9 8,532.7 8,562.1 8,588.0 8,535.3 8,616.0 8,634.1 8,644.5 8,645.6 8,634.9 8,699.2 8,715.5 Civilian Unemployment 587.6 540.1 539.0 525.0 506.9 514.2 493.8 467.1 444.4 411.3 506.4 540.2 515.0Civilian Unemployment Rate 6.5% 6.0% 5.9% 5.8% 5.6% 5.7% 5.4% 5.1% 4.9% 4.5% 5.5% 5.8% 5.6%
SCAG share (%) Civilian Labor Force 47.6% 47.7% 47.8% 47.8% 47.9% 47.8% 47.8% 47.8% 47.8% 47.7% 47.7% 47.7% 47.7% Civilian Employment 47.4% 47.6% 47.7% 47.8% 48.0% 47.8% 48.0% 48.0% 47.9% 47.8% 47.7% 47.7% 47.7% Civilian Unemployment 50.7% 50.8% 49.2% 47.7% 46.6% 46.4% 45.7% 44.2% 45.0% 45.8% 46.6% 47.6% 47.8%
IMPERIAL Civilian Labor Force 79.3 78.4 79.6 79.8 79.9 78.5 77.8 77.6 79.2 79.3 81.5 81.9 79.2 Civilian Employment 58.0 58.8 60.2 61.4 62.8 62.4 62.4 62.2 61.7 62.4 62.1 59.9 60.3 Civilian Unemployment 21.3 19.6 19.5 18.4 17.1 16.1 15.4 15.4 17.5 17.0 19.3 22.1 18.8
LOS ANGELES Civilian Labor Force 4,996.0 4,987.5 4,992.9 4,994.4 4,991.7 4,975.6 5,018.7 5,011.4 5,012.0 4,993.3 5,041.2 5,114.3 5,109.7 Civilian Employment 4,660.2 4,678.9 4,692.4 4,702.8 4,707.5 4,678.5 4,740.2 4,759.1 4,777.4 4,778.5 4,778.3 4,832.8 4,839.8 Civilian Unemployment 335.8 308.7 300.5 291.5 284.1 297.0 278.5 252.2 234.6 214.9 262.9 281.5 269.9
ORANGE Civilian Labor Force 1,594.0 1,591.9 1,602.4 1,605.8 1,608.9 1,595.0 1,607.3 1,606.4 1,602.8 1,599.5 1,612.6 1,627.3 1,625.1 Civilian Employment 1,521.5 1,525.4 1,532.4 1,537.0 1,543.7 1,531.3 1,543.4 1,542.3 1,541.0 1,542.5 1,541.5 1,552.9 1,554.2 Civilian Unemployment 72.5 66.5 69.9 68.8 65.2 63.8 63.9 64.1 61.7 57.0 71.1 74.4 70.8
RIVERSIDE Civilian Labor Force 1,032.4 1,028.5 1,038.5 1,043.2 1,047.2 1,041.0 1,041.1 1,041.4 1,036.5 1,033.5 1,044.3 1,049.6 1,051.1 Civilian Employment 959.6 962.0 970.6 977.3 984.2 979.4 979.6 980.0 977.3 978.0 974.5 974.6 978.9 Civilian Unemployment 72.8 66.5 67.9 65.9 63.1 61.6 61.4 61.4 59.3 55.5 69.8 75.0 72.2
SAN BERNARDINO Civilian Labor Force 922.9 920.1 929.7 934.6 938.2 932.1 932.6 932.2 928.3 925.1 933.5 937.7 938.9 Civilian Employment 862.6 864.8 872.2 878.4 884.3 879.3 880.2 879.7 877.4 877.3 873.4 875.2 880.2 Civilian Unemployment 60.3 55.3 57.5 56.2 53.9 52.9 52.4 52.4 50.9 47.9 60.1 62.5 58.7
VENTURA Civilian Labor Force 424.1 423.5 428.6 429.3 429.2 427.3 432.2 432.2 430.1 426.0 428.3 428.5 426.7 Civilian Employment 399.1 400.0 404.9 405.2 405.6 404.5 410.2 410.7 409.7 407.0 405.1 403.8 402.1 Civilian Unemployment 25.0 23.4 23.7 24.2 23.5 22.8 22.1 21.5 20.4 19.0 23.2 24.7 24.6
Prepared by Research and Analysis DepartmentSouthern California Association of Governments (SCAG)Source: California Employment Development Department
Southern California Association of Governments 17
Monthly Economic Report September 2016
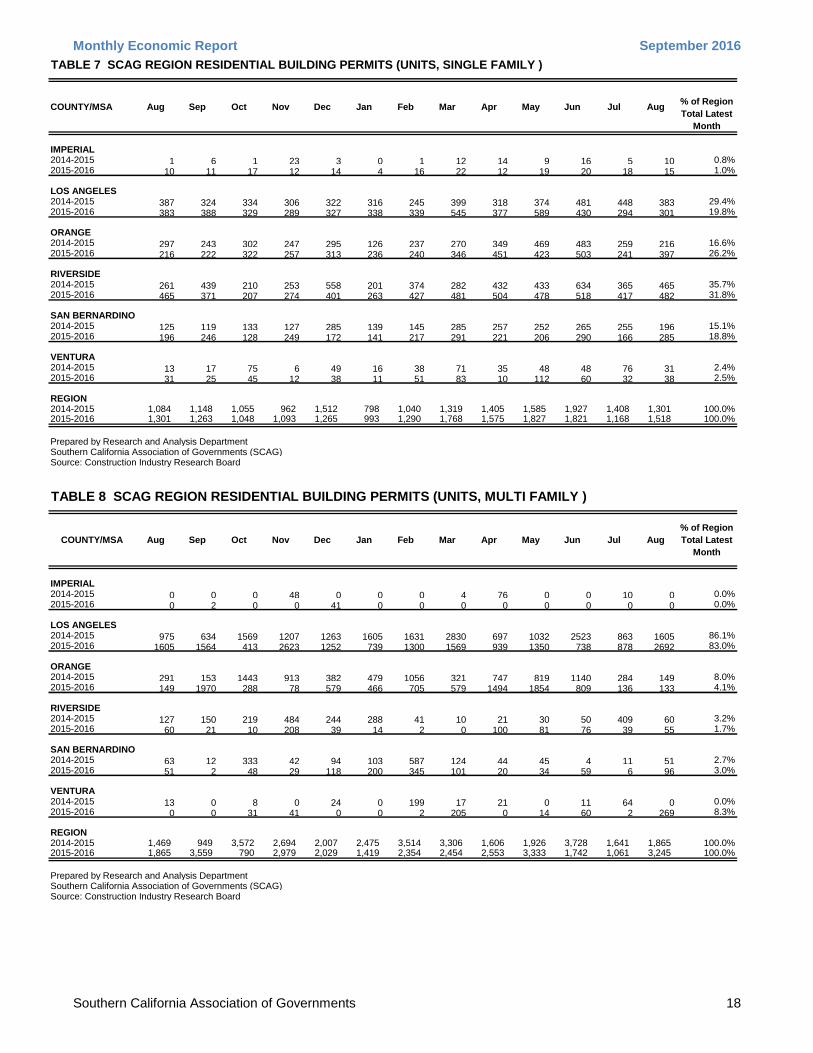
TABLE 7 SCAG REGION RESIDENTIAL BUILDING PERMITS (UNITS, SINGLE FAMILY )
COUNTY/MSA Aug Sep Oct Nov Dec Jan Feb Mar Apr May Jun Jul Aug% of Region
Total Latest
Month
IMPERIAL2014-2015 1 6 1 23 3 0 1 12 14 9 16 5 10 0.8%2015-2016 10 11 17 12 14 4 16 22 12 19 20 18 15 1.0%
LOS ANGELES2014-2015 387 324 334 306 322 316 245 399 318 374 481 448 383 29.4%2015-2016 383 388 329 289 327 338 339 545 377 589 430 294 301 19.8%
ORANGE2014-2015 297 243 302 247 295 126 237 270 349 469 483 259 216 16.6%2015-2016 216 222 322 257 313 236 240 346 451 423 503 241 397 26.2%
RIVERSIDE2014-2015 261 439 210 253 558 201 374 282 432 433 634 365 465 35.7%2015-2016 465 371 207 274 401 263 427 481 504 478 518 417 482 31.8%
SAN BERNARDINO2014-2015 125 119 133 127 285 139 145 285 257 252 265 255 196 15.1%2015-2016 196 246 128 249 172 141 217 291 221 206 290 166 285 18.8%
VENTURA2014-2015 13 17 75 6 49 16 38 71 35 48 48 76 31 2.4%2015-2016 31 25 45 12 38 11 51 83 10 112 60 32 38 2.5%
REGION2014-2015 1,084 1,148 1,055 962 1,512 798 1,040 1,319 1,405 1,585 1,927 1,408 1,301 100.0%2015-2016 1,301 1,263 1,048 1,093 1,265 993 1,290 1,768 1,575 1,827 1,821 1,168 1,518 100.0%
Prepared by Research and Analysis DepartmentSouthern California Association of Governments (SCAG)Source: Construction Industry Research Board
TABLE 8 SCAG REGION RESIDENTIAL BUILDING PERMITS (UNITS, MULTI FAMILY )
COUNTY/MSA Aug Sep Oct Nov Dec Jan Feb Mar Apr May Jun Jul Aug
% of Region
Total Latest
Month
IMPERIAL2014-2015 0 0 0 48 0 0 0 4 76 0 0 10 0 0.0%2015-2016 0 2 0 0 41 0 0 0 0 0 0 0 0 0.0%
LOS ANGELES2014-2015 975 634 1569 1207 1263 1605 1631 2830 697 1032 2523 863 1605 86.1%2015-2016 1605 1564 413 2623 1252 739 1300 1569 939 1350 738 878 2692 83.0%
ORANGE2014-2015 291 153 1443 913 382 479 1056 321 747 819 1140 284 149 8.0%2015-2016 149 1970 288 78 579 466 705 579 1494 1854 809 136 133 4.1%
RIVERSIDE2014-2015 127 150 219 484 244 288 41 10 21 30 50 409 60 3.2%2015-2016 60 21 10 208 39 14 2 0 100 81 76 39 55 1.7%
SAN BERNARDINO2014-2015 63 12 333 42 94 103 587 124 44 45 4 11 51 2.7%2015-2016 51 2 48 29 118 200 345 101 20 34 59 6 96 3.0%
VENTURA2014-2015 13 0 8 0 24 0 199 17 21 0 11 64 0 0.0%2015-2016 0 0 31 41 0 0 2 205 0 14 60 2 269 8.3%
REGION2014-2015 1,469 949 3,572 2,694 2,007 2,475 3,514 3,306 1,606 1,926 3,728 1,641 1,865 100.0%2015-2016 1,865 3,559 790 2,979 2,029 1,419 2,354 2,454 2,553 3,333 1,742 1,061 3,245 100.0%
Prepared by Research and Analysis DepartmentSouthern California Association of Governments (SCAG)Source: Construction Industry Research Board
Southern California Association of Governments 18

Monthly Economic Report September 2016
TABLE 9 SCAG REGION BUILDING PERMITS (VALUATION / MILLION DOLLARS, TOTAL )
COUNTY/MSA Aug Sep Oct Nov Dec Jan Feb Mar Apr May Jun Jul Aug
% of Region
Total Latest
Month
IMPERIAL2014-2015 1.8 2.9 11.8 12.4 3.3 2.4 3.7 3.9 11.2 5.9 5.0 12.2 17.7 0.9%2015-2016 17.7 15.0 6.0 4.2 11.3 2.0 7.5 6.1 7.4 6.5 10.2 48.4 5.9 0.3%
LOS ANGELES2014-2015 1,238.1 687.2 1,324.7 672.3 1,000.9 1,142.6 983.7 1,190.0 881.9 844.6 1,116.9 976.1 1,000.2 50.6%2015-2016 1,000.2 954.8 670.6 1,128.4 849.8 780.4 868.6 1,098.9 1,000.1 1,170.3 917.0 800.1 1,135.1 57.5%
ORANGE2014-2015 313.4 349.1 546.9 459.1 289.2 258.8 415.5 315.9 411.9 443.0 560.9 309.3 423.9 21.4%2015-2016 423.9 584.9 349.3 279.7 419.4 372.7 528.2 462.7 713.8 652.8 472.3 373.8 420.9 21.3%
RIVERSIDE2014-2015 174.2 196.5 154.6 200.6 229.4 155.8 165.4 170.5 164.0 167.1 247.8 223.1 219.2 11.1%2015-2016 219.2 147.0 104.6 164.6 183.0 166.8 171.6 358.1 212.8 197.4 335.7 200.7 197.1 10.0%
SAN BERNARDINO2014-2015 96.6 183.8 154.6 85.1 225.0 147.3 174.4 243.3 207.3 130.1 129.1 146.6 275.9 13.9%2015-2016 275.9 187.9 116.8 164.7 171.6 117.8 149.7 193.6 123.4 205.6 158.8 220.0 132.3 6.7%
VENTURA2014-2015 30.4 21.3 52.5 13.3 34.9 19.3 60.1 51.7 36.9 33.6 38.8 83.1 41.8 2.1%2015-2016 41.8 31.0 44.9 17.3 25.8 21.4 48.8 72.2 24.2 69.0 41.8 27.5 81.6 4.1%
REGION2014-2015 1,854.4 1,440.9 2,245.1 1,442.7 1,782.7 1,726.3 1,802.8 1,975.3 1,713.2 1,624.3 2,098.4 1,750.4 1,978.7 100.0%2015-2016 1,978.7 1,920.7 1,292.3 1,758.8 1,660.9 1,461.1 1,774.4 2,191.7 2,081.7 2,301.7 1,935.9 1,670.4 1,972.8 100.0%
Prepared by Research and Analysis DepartmentSouthern California Association of Governments (SCAG)Source: Construction Industry Research Board
TABLE 10 SCAG REGION BUILDING PERMITS (VALUATION / MILLION DOLLARS, RESIDENTIAL )
COUNTY/MSA Aug Sep Oct Nov Dec Jan Feb Mar Apr May Jun Jul Aug
% of Region
Total Latest
Month
IMPERIAL2014-2015 0.6 1.5 0.7 12.3 0.9 1.1 0.4 3.1 9.3 3.0 3.9 9.7 2.7 0.3%2015-2016 2.7 2.9 4.7 3.1 9.0 1.6 6.0 5.3 3.6 5.3 5.5 4.6 3.2 0.3%
LOS ANGELES2014-2015 398.4 334.3 502.2 413.0 436.5 550.2 587.2 801.6 388.8 441.4 617.3 433.4 558.5 53.1%2015-2016 558.5 465.8 368.2 656.5 511.9 362.1 540.9 704.0 458.0 583.6 512.0 444.3 663.9 56.8%
ORANGE2014-2015 163.5 156.9 306.5 308.8 162.2 144.3 263.9 187.9 317.8 311.3 386.3 174.7 159.5 15.2%2015-2016 159.5 372.2 192.4 147.4 235.2 178.5 197.2 269.3 404.5 470.6 309.1 153.3 190.1 16.2%
RIVERSIDE2014-2015 120.0 130.8 77.0 134.7 180.2 97.7 112.1 82.2 125.7 128.2 189.1 135.5 129.1 12.3%2015-2016 129.1 96.3 67.7 96.7 130.1 85.2 128.5 136.6 153.3 139.7 171.1 128.7 156.2 13.4%
SAN BERNARDINO2014-2015 39.8 34.8 70.2 55.1 89.7 70.7 115.0 92.0 74.8 76.5 75.0 76.0 182.7 17.4%2015-2016 182.7 68.1 47.4 69.3 58.5 64.7 112.5 87.6 59.6 61.4 84.4 49.1 85.3 7.3%
VENTURA2014-2015 15.3 11.0 40.1 6.5 27.9 10.3 48.5 38.9 26.9 23.4 27.8 52.9 19.9 1.9%2015-2016 19.9 16.0 28.9 12.7 20.9 11.8 33.2 62.4 8.1 49.0 30.7 19.8 71.1 6.1%
REGION2014-2015 737.5 669.3 996.6 930.4 897.3 874.2 1,127.1 1,205.6 943.2 983.8 1,299.3 882.1 1,052.5 100.0%2015-2016 1,052.5 1,021.2 709.4 985.8 965.5 703.9 1,018.3 1,265.2 1,087.1 1,309.5 1,112.7 799.8 1,169.8 100.0%
Prepared by Research and Analysis DepartmentSouthern California Association of Governments (SCAG)Source: Construction Industry Research Board
Southern California Association of Governments 19

Monthly Economic Report September 2016
TABLE 11 SCAG REGION BUILDING PERMITS (VALUATION / MILLION DOLLARS, COMMERCIAL )
COUNTY/MSA Aug Sep Oct Nov Dec Jan Feb Mar Apr May Jun Jul Aug
% of Region
Total Latest
Month
IMPERIAL2014-2015 0.0 0.0 0.0 0.0 0.0 0.0 0.5 0.0 0.9 0.0 0.3 0.6 2.0 0.7%2015-2016 2.0 9.8 0.2 0.7 0.3 0.0 0.4 0.0 2.6 0.0 0.4 4.2 1.4 0.5%
LOS ANGELES2014-2015 540.1 102.1 184.9 40.6 161.2 193.7 113.6 48.7 140.8 141.0 187.9 129.5 125.0 44.8%2015-2016 125.0 145.9 60.4 253.8 136.1 203.4 124.7 63.7 146.2 271.3 61.6 65.3 135.6 52.7%
ORANGE2014-2015 23.3 85.2 46.3 78.1 29.6 20.5 88.5 3.1 6.2 13.0 28.2 25.1 85.2 30.6%2015-2016 85.2 102.2 58.8 2.8 32.5 38.4 218.5 58.9 180.1 75.0 49.1 90.1 105.9 41.2%
RIVERSIDE2014-2015 11.4 8.6 2.5 16.9 6.1 21.6 2.8 10.4 17.7 13.6 14.1 7.0 41.6 14.9%2015-2016 41.6 3.7 5.5 5.9 4.1 13.4 8.0 42.3 10.3 15.4 58.9 26.8 8.8 3.4%
SAN BERNARDINO2014-2015 3.7 10.0 43.2 1.9 5.3 23.8 3.7 50.1 30.7 21.6 30.1 2.2 10.0 3.6%2015-2016 10.0 9.5 38.8 14.4 9.9 7.2 9.1 21.5 10.0 108.6 11.1 6.9 4.8 1.9%
VENTURA2014-2015 0.1 0.0 0.5 1.4 1.0 1.3 0.8 2.0 1.2 1.1 0.5 16.2 15.1 5.4%2015-2016 15.1 0.0 1.3 0.4 0.0 1.3 0.6 0.4 4.3 7.6 0.0 0.0 0.5 0.2%
REGION2014-2015 578.6 205.8 277.4 138.9 203.2 260.8 210.0 114.2 197.5 190.3 261.0 180.6 278.9 100.0%2015-2016 278.9 271.1 164.9 277.9 183.0 263.7 361.4 186.7 353.5 477.9 181.2 193.4 257.0 100.0%
Prepared by Research and Analysis DepartmentSouthern California Association of Governments (SCAG)Source: Construction Industry Research Board
TABLE 12 SCAG REGION BUILDING PERMITS (VALUATION / MILLION DOLLARS, INDUSTRIAL )
COUNTY/MSA Aug Sep Oct Nov Dec Jan Feb Mar Apr May Jun Jul Aug
% of Region
Total Latest
Month
IMPERIAL2014-2015 0.0 0.0 10.0 0.0 0.0 0.0 0.0 0.0 0.0 0.0 0.0 0.0 2.0 2.7%2015-2016 2.0 0.0 0.0 0.0 0.0 0.0 0.0 0.0 0.0 0.0 0.0 0.0 0.0 0.0%
LOS ANGELES2014-2015 0.4 8.3 20.5 11.7 28.3 2.1 0.0 34.1 5.2 1.9 13.1 6.8 14.4 19.7%2015-2016 14.4 4.8 0.0 3.0 0.1 0.2 19.6 12.3 11.1 0.0 26.3 28.2 15.9 0.0%
ORANGE2014-2015 16.3 15.0 56.9 0.1 0.0 18.5 0.2 28.8 7.9 26.8 0.0 0.0 0.8 1.0%2015-2016 0.8 0.0 0.0 3.8 0.6 7.5 4.4 15.0 0.0 0.0 0.0 0.0 0.0 0.0%
RIVERSIDE2014-2015 0.0 15.7 0.0 5.4 9.4 0.1 0.0 0.4 0.2 5.9 0.0 42.5 0.0 0.0%2015-2016 0.0 19.6 0.0 12.7 7.6 4.6 0.0 6.4 0.0 9.9 21.2 4.9 5.0 0.0%
SAN BERNARDINO2014-2015 18.8 109.5 11.0 1.1 98.7 20.7 23.1 28.7 76.0 0.0 5.0 41.6 55.8 76.5%2015-2016 55.8 76.9 10.8 40.7 60.5 25.9 4.5 36.8 23.2 0.0 38.1 112.4 20.0 0.0%
VENTURA2014-2015 3.7 0.0 0.0 0.0 0.0 0.0 0.0 0.0 0.0 0.0 0.0 0.0 0.0 0.0%2015-2016 0.0 3.1 0.0 0.0 0.0 0.0 0.0 0.0 0.0 4.6 0.0 0.0 0.0 0.0%
REGION2014-2015 39.1 148.5 98.4 18.3 136.4 41.5 23.3 92.1 89.3 34.6 18.1 90.9 73.0 100.0%2015-2016 73.0 104.3 10.8 60.2 68.8 38.2 28.5 70.5 34.3 14.5 85.7 145.5 41.0 0.0%
Prepared by Research and Analysis DepartmentSouthern California Association of Governments (SCAG)Source: Construction Industry Research Board
Southern California Association of Governments 20

Monthly Economic Report September 2016
TABLE 13 SCAG REGION BUILDING PERMITS (VALUATION / MILLION DOLLARS, OTHERS )
COUNTY/MSA Aug Sep Oct Nov Dec Jan Feb Mar Apr May Jun Jul Aug
% of Region
Total Latest
Month
IMPERIAL2014-2015 1.2 1.4 1.1 0.2 2.4 1.4 2.8 0.8 1.0 2.9 0.8 1.9 11.0 1.9%2015-2016 11.0 2.4 1.1 0.4 2.1 0.4 1.1 0.8 1.2 1.2 4.3 39.6 1.3 0.3%
LOS ANGELES2014-2015 299.3 242.6 617.1 207.0 374.9 396.5 282.8 305.5 347.2 260.4 298.7 406.5 302.3 52.6%2015-2016 302.3 338.3 242.0 215.1 201.7 214.7 183.4 319.0 384.8 315.4 317.0 262.3 319.7 63.3%
ORANGE2014-2015 110.4 91.9 137.2 72.1 97.4 75.6 62.9 96.2 80.0 91.9 146.4 109.4 178.4 31.1%2015-2016 178.4 110.5 98.2 125.6 151.1 148.2 108.0 119.5 129.2 107.2 114.1 130.4 124.8 24.7%
RIVERSIDE2014-2015 42.8 41.4 75.1 43.6 33.7 36.4 50.5 77.5 20.4 19.4 44.5 38.2 48.5 8.4%2015-2016 48.5 27.4 31.4 49.3 41.2 63.6 35.1 172.8 49.2 32.5 84.5 40.3 27.1 5.4%
SAN BERNARDINO2014-2015 34.3 29.5 30.3 26.9 31.3 32.1 32.7 72.5 25.8 32.0 19.1 26.8 27.4 4.8%2015-2016 27.4 33.5 19.9 40.3 42.7 20.1 23.6 47.7 30.6 35.6 25.2 51.5 22.1 4.4%
VENTURA2014-2015 11.3 10.3 11.8 5.4 6.1 7.7 10.8 10.9 8.8 9.0 10.5 14.1 6.8 1.2%2015-2016 6.8 12.0 14.7 4.2 4.9 8.2 15.0 9.4 11.7 7.8 11.2 7.7 10.0 2.0%
REGION2014-2015 499.3 417.2 872.6 355.2 545.8 549.7 442.4 563.3 483.3 415.5 520.0 596.8 574.3 100.0%2015-2016 574.3 524.0 407.2 434.9 443.6 455.2 366.1 669.3 606.8 499.8 556.3 531.8 505.0 100.0%
Prepared by Research and Analysis DepartmentSouthern California Association of Governments (SCAG)Source: Construction Industry Research Board
Southern California Association of Governments 21

REGIONAL OFFICESImperial County1405 North Imperial Avenue, Suite 1 El Centro, CA 92243 Phone: (760) 353-7800 Fax: (760) 353-1877
Orange CountyOCTA Building 600 South Main Street, 9th Floor Orange, CA 92863 Phone: (714) 542-3687 Fax: (714) 560-5089
Riverside County3403 10th Street, Suite 805 Riverside, CA 92501 Phone: (951) 784-1513 Fax: (951) 784-3925
San Bernardino CountySanta Fe Depot 1170 West 3rd Street, Suite 140 San Bernardino, CA 92418 Phone: (909) 806-3556 Fax: (909) 806-3572
Ventura County950 County Square Drive, Suite 101 Ventura, CA 93003 Phone: (805) 642-2800 Fax: (805) 642-2260
818 West 7th Street, 12th Floor Los Angeles, CA 90017 Phone: (213) 236-1800 Fax: (213) 236-1825www.scag.ca.gov
please recycle 2546.2013.08.13


![Monthly Economic Reviewbsl.gov.sl/MER October 2019- Finalised Version.pdf · Monthly Economic Review October 2019 Publisher: The Monthly Economic Review [MER] is published by the](https://static.fdocuments.in/doc/165x107/5eddde83ad6a402d66691757/monthly-economic-october-2019-finalised-versionpdf-monthly-economic-review-october.jpg)


