SEPTEMBER 2014 BUSINESS MODELS - Gather...
60
SEPTEMBER 2014 BUSINESS MODELS 50 EXAMPLES FROM THE FTSE 350
Transcript of SEPTEMBER 2014 BUSINESS MODELS - Gather...

SEPTEMBER 2014
BUSINESS MODELS50 EXAMPLES FROM THE FTSE 350

1. 3i Group2. African Barrick Gold3. Anglo American4. AstraZeneca5. Balfour Beatty6. Bank of Georgia Holdings7. Beazley8. BHP Billiton9. BP10. BTG11. Cable & Wireless Communications12. Carphone Warehouse Group13. Catlin Group14. Coca-Cola HBC AG15. CRH16. Dechra Pharmaceuticals17. Domino Printing Sciences18. easyJet19. Entertainment One Ltd20. Fenner, EPS and AEP Divisions21. Foreign & Colonial Investment Trust22. Genus23. Greencore Group24. Hays25. Home Retail Group
26. IMI27. InterContinental Hotels Group28. ITV29. Ladbrokes30. Lloyds Banking Group31. Meggitt32. Mitchells & Butlers33. National Express Group34. Ocado Group35. Pearson36. Petrofac Ltd37. Premier Farnell38. Rank Group39. Renishaw40. Rolls-Royce Holdings41. RPS Group42. Schroders43. Shire44. Spirax-Sarco Engineering45. St Modwen Properties46. Tate & Lyle47. Tesco48. UBM49. Vedanta Resources50. Our choice: REXAM
CONTENTS

The business model is one of the essential elements of the annual report. It is now fundamental to understanding how any business creates, conserves and captures value.
However, it is the one element that causes the most head-scratching in corporate headquarters up and down the land.
What should go in? What do we leave out? What are we trying to show? Do we really want to tell our competitors how we do it? What can we get away with? Does it make us look simple? Or complicated? Should it be round, square, linear or a quadrilateral? Do we already have one in a presentation that we could use?
All these questions have been asked in the last 12 months. But perhaps the one question we’ve been asked most often is, ‘What is everyone else up to?’
So we decided to pull together 50 business models from the most recent annual reports from the FTSE350. We simply chose every seventh company from an alphabetical list, from 3i to WPP. We have not judged them; the book is more a reference guide to provide inspiration.
But there is another question we get asked a lot. ‘Who does the best business model?’ So, on page 50 we finally come o¥ the fence, name the best one, and give you the reasons why.
GATHER: 50 EXAMPLES OF BUSINESS MODELS FROM THE FTSE 350
50 EXAMPLES FROM THE FTSE 350

10
3i Group plc Annual report and accounts 2014
Strategic report
In order to assess properly the profitability of our fund management activities, we consider the fees that can be generated by our entire Fund Management platform, treating proprietary capital invested on the same basis as managed third-party funds. To do this, we calculate an internal fee payable to the Fund Management business for managing our proprietary capital and call this a “synthetic fee”. The standalone profitability of our Fund Management platform is then based on measuring the total fund management income (third-party fees plus synthetic fees) against the operating costs allocated to the platform, excluding restructuring and amortisation costs. To help you track this profitability, we have introduced a new key performance indicator called “Underlying Fund Management profit and margin” (further details on page 46). In FY2014, our fund management platform generated an underlying profit and margin of £33 million and 26% respectively, compared to £17 million and 13% in FY2013.
Over time, we believe that our Fund Management platform is capable of generating sustainable and growing annual profits, which in turn should create additional value for shareholders beyond the growth in value of our proprietary investments. This is an important building block of the 3i Value Build which I talked about in my last review and which is shown on page 13.
Improve capital allocation, focusing on enhanced shareholder distributions and re-investment in our core investment businessesAs part of the strategic review, we fundamentally changed our capital allocation approach so that, over time, we aim to use less of our capital to pay operating costs, funding costs and debt repayment, and instead focus our capital on additional shareholder distributions and investment in our core businesses.
The chart below shows the average allocation of our capital over the three years between FY2010-12. On average, 68% of the total proceeds from realisations and cash income was used to pay operating and funding costs and debt repayment, leaving just 32% for shareholder distributions and investment in our core businesses. In FY2014, we improved this picture with 50% going to shareholder distributions and re-investment. We expect further improvement in FY2015.
Capital allocation
Average over FY10-FY12 FY14
Realisations Operating costs, net carried interest and tax
Debt repayment and interest costs
Shareholder distributions
Funds to invest
Realisations Operating costs, net carried interest and tax
Debt repayment and interest costs
Shareholder distributions
Funds to invest
Fees and portfolio income
Fees and portfolio income
27%
41%
29%
19%
31%
36%
14%
3%
50%
32%
Chief Executive’s review
11
3i Group plcAnnual report and accounts 2014
Strategic report
Business model3i’s business is a mix of proprietary capital investing and managing third-party capital. This “hybrid” asset manager business model enables us to combine capital returns from our proprietary balance sheet and recurring management fee income from our fund management activities. We believe that this represents a di�erentiated and attractive value proposition for our shareholders.
Investing from our own balance sheet is part of our heritage. Currently, proprietary AUM amounts to £3.4 billion, accounting for 26% of the Group’s total AUM. 3i is the largest single investor in its own Private Equity and Infrastructure funds. Putting our own capital to work alongside third-party investors is a fundamental part of our business model and strategy, and gives 3i a true competitive advantage. We view our role as both an active owner as well as manager of third-party funds. This further reinforces the alignment between the interests of our shareholders, our co-investors and our fund investors.
So, in addition to generating capital returns from proprietary capital investing (our Proprietary Capital activities), we also consider the profitability of our Fund Management platform. Both parts need to generate value for the Group. Our overall objectives are to maximise investment returns from our Proprietary Capital activities and grow our Fund Management activities profitably.
We are already managing the Group with this much clearer delineation between Proprietary Capital and Fund Management. Going forward, you will be able to track our progress through new disclosures and a combination of KPIs measuring our performance as an investor of Proprietary Capital and separately as a Fund Management business, in addition to overall Group performance. These KPIs are shown on pages 16 and 17. The performance of these activities is discussed in the Financial Review, starting on page 40 and further disclosure on the breakdown between Proprietary Capital and Fund Management is shown in Note 1 to the Audited accounts on page 114.
OutlookWe have continued to be successful in implementing our strategic plan against a backdrop of ongoing challenges in the macroeconomic environment. Further regulation across the financial services industry is also presenting additional challenges for our business through further costs and increased complexity.
Despite this, we see the power of the 3i business model coming back well. Our network of local teams across our key geographies and our proprietary capital are two key competitive advantages. For example, in our mid-market Private Equity business, we have had teams on the ground across Europe for over 30 years and our franchise in those markets is very strong. This enables us to access attractive investment opportunities and using our own capital a�ords us flexibility in our approach and timescale that few of our competitors have.
The current environment is a tricky one for new investments. There is an excess of capital looking for investment opportunities and this has driven up sellers’ price expectations. We have benefited from this in our realisation programme, however as we review new investment we will need to continue to be patient and disciplined. Our proposition can deliver healthy alpha-generating returns if we invest, manage and exit well. Careful investment in mid-market Private Equity using 3i’s competitive advantages will generate significant value for the Group, its shareholders and third-party investors as well as take 3i back to sector-leading performance.
Everyone at 3i is committed and working hard to continue to deliver against our strategic plan. I would like to thank the entire 3i team for their e�orts this year. They are key to our success. We are all looking forward to making further good progress in FY2015.
Simon Borrows Chief Executive
GATHER: 50 EXAMPLES OF BUSINESS MODELS FROM THE FTSE 350
1. 3i Group

A single focus: To be a leading African gold producer
CHIEF EXECUTIVE OFFICER’S REPORT
STRATEGY AND BUSINESS MODEL
Single country risk All of our production is located in Tanzania, therefore major in-country developments could have a signi�cant effect on our operations and business.
Costs and capital expenditureIncreased cost pressures, particularly as regards labour, capital equipment and energy costs may affect our ability to manage operating costs and capital expenditures.
Political, legal and regulatory developments Our ability to conduct business is dependent on the consistent interpretation and application of laws and regulations, particularly in Tanzania.
Utilities supplyPower stoppages and disruptions to electrical supply and other utilities impact our ability to operate continuously and can also result in increased costs, particularly power supply costs.
Community relations Failure to engage or manage relations with local communities and stakeholders affects our social licence to operate and can have a direct impact on operations.
Land acquisitionsProgression of mining activities at some of our operations is dependent upon our ability to complete land acquisitions to support life of mine plans timely and successfully.
Loss of critical processesFailures or unavailability of operational infrastructure, such as equipment failure or de�ciencies in supply chain availability, could adversely affect production output or impact exploration and development activities.
Further information on our risk management and mitigation strategies is provided in detail in the Risk management review.
Reserves and resources estimatesOur reserves and resources estimates are based on a range of assumptions and factors; therefore no assurances can be given that anticipated tonnages or grades will be achieved.
Commodity pricesOur �nancial performance is highly dependent on the price of gold and, to a lesser extent, the price of copper and silver. Fluctuations in the pricing of these commodities, particularly rapid price �uctuations, may have a corresponding impact on our �nancial position.
Taxation reviewsOur �nancial position could be adversely affected if Tanzanian tax regimes were revised beyond the �scal stability agreements contained in our Mineral Development Agreements and/or upon unsuccessful discussions with taxation regulators on outstanding tax assessments.
Environmental hazards and rehabilitationOur operations use processes and methods which require the use of chemicals and other hazardous substances and, as such, we may be liable for losses and costs associated with environmental hazards, should they occur.
Employer, contractor and industrial relationsOur business depends on attracting and retaining skilled employees. A loss in skilled employees and/or a breakdown in employee relations could result in a decrease in production levels, increased costs and/or disruptions to operations.
Security, trespass and vandalismWe face risks when dealing with fraud, corruption and wider security matters, e.g. trespass, theft, vandalism or unauthorised small-scale mining near or on our operations, all of which could affect our mine sites and �nancial condition.
Organisational restructuringOur organisational restructuring (including the transfer of certain support functions from South Africa to Tanzania) and related transitional periods may negatively impact the delivery of key operational support services and could also result in deteriorations in certain �nancial and operational controls.
We are focused on maintaining and strengthening our position as a leading African gold producer in order to develop our business for the long term. For this reason we have adopted a consistent strategy of optimise, expand and grow, and have structured our business model on the premise of responsible mining and other foundations that we believe re�ect sound business practices in order to achieve our immediate goal of attaining and maintaining operational excellence.
We believe that satisfying this immediate goal is fundamental to the achievement of our primary objective: generating free cash �ow to provide sustainable returns for all of our stakeholders in the form of shareholder returns and ongoing economic contributions and investment in our host countries.
Managing principal business risks Our principal business risks fall within four broad categories: strategic risks, �nancial risks, external risks and operational risks, as follows:
6 www.africanbarrickgold.com
STRATEG
IC R
EPO
RT
Sustainable stakeholder returns
Operational excellence
Application of strong cost and capital discipline
Commitment to responsible mining
Continued development of our quality asset base
Maintenance of e�ective governance and risk
management practicesin practice this means: in practice this means: in practice this means: in practice this means:
• enhancing supply chain and inventory management
• maintaining appropriate operational cost levels
• adopting stringent capital allocation and expenditure practices
• using robust �nancial management procedures
• developing community and government relationships
• protecting the environment
• safeguarding health and safety in the workplace
• creating development and training opportunities for our employees
• respecting human rights
• enhancing life of mine planning methods
• driving mining and processing ef�ciencies through improved practices
• optimising mining, development and processing rates
• investing in the right exploration opportunities
• fostering strong, effective and experienced leadership
• providing for diversity
• developing sound governance structures and practices
• progressing and maintaining internal controls and risk mitigation strategies
Further information on capital discipline is provided in the following pages of the Strategic report.
Further information on our commitment to responsible mining is provided in the Corporate responsibility section of this report.
Further information on the development of our asset base is provided in the following pages of the Strategic report.
Further information on e�ective governance and risk management is provided in the Governance report and the Risk management review.
Our foundations drive
Which creates
Single country risk All of our production is located in Tanzania, therefore major in-country developments could have a signi�cant effect on our operations and business.
Costs and capital expenditureIncreased cost pressures, particularly as regards labour, capital equipment and energy costs may affect our ability to manage operating costs and capital expenditures.
Political, legal and regulatory developments Our ability to conduct business is dependent on the consistent interpretation and application of laws and regulations, particularly in Tanzania.
Utilities supplyPower stoppages and disruptions to electrical supply and other utilities impact our ability to operate continuously and can also result in increased costs, particularly power supply costs.
Community relations Failure to engage or manage relations with local communities and stakeholders affects our social licence to operate and can have a direct impact on operations.
Land acquisitionsProgression of mining activities at some of our operations is dependent upon our ability to complete land acquisitions to support life of mine plans timely and successfully.
Loss of critical processesFailures or unavailability of operational infrastructure, such as equipment failure or de�ciencies in supply chain availability, could adversely affect production output or impact exploration and development activities.
Further information on our risk management and mitigation strategies is provided in detail in the Risk management review.
Reserves and resources estimatesOur reserves and resources estimates are based on a range of assumptions and factors; therefore no assurances can be given that anticipated tonnages or grades will be achieved.
Commodity pricesOur �nancial performance is highly dependent on the price of gold and, to a lesser extent, the price of copper and silver. Fluctuations in the pricing of these commodities, particularly rapid price �uctuations, may have a corresponding impact on our �nancial position.
Taxation reviewsOur �nancial position could be adversely affected if Tanzanian tax regimes were revised beyond the �scal stability agreements contained in our Mineral Development Agreements and/or upon unsuccessful discussions with taxation regulators on outstanding tax assessments.
Environmental hazards and rehabilitationOur operations use processes and methods which require the use of chemicals and other hazardous substances and, as such, we may be liable for losses and costs associated with environmental hazards, should they occur.
Employer, contractor and industrial relationsOur business depends on attracting and retaining skilled employees. A loss in skilled employees and/or a breakdown in employee relations could result in a decrease in production levels, increased costs and/or disruptions to operations.
Security, trespass and vandalismWe face risks when dealing with fraud, corruption and wider security matters, e.g. trespass, theft, vandalism or unauthorised small-scale mining near or on our operations, all of which could affect our mine sites and �nancial condition.
Organisational restructuringOur organisational restructuring (including the transfer of certain support functions from South Africa to Tanzania) and related transitional periods may negatively impact the delivery of key operational support services and could also result in deteriorations in certain �nancial and operational controls.
Annual Report and Accounts 2013 7
GATHER: 50 EXAMPLES OF BUSINESS MODELS FROM THE FTSE 350
2. African Barrick Gold
DESIGNED TO DELIVER NOW
CAPITAL ALLOCATION
We have set ourselves a realistic financial target of delivering at least a 15% attributable ROCE by 2016. Achieving this target will require a renewed focus on capital discipline, our capital deployment to be directed towards high value, low risk projects, and ensuring we manage the balance between growth and shareholder returns.
For more informationSee page 20
BUSINESS EXECUTION
We have a high quality asset base with the potential to deliver better margins and returns. The asset review process has identified operational improvement opportunities and we are working towards executing against our plans while remaining committed to the highest standards of safe and sustainable mining.
For more informationSee page 34
STAKEHOLDER ENGAGEMENT
We understand that we must work together with our stakeholders to partner with them to reach their potential. Our ability to build effective and mutually beneficial partnerships with host communities and governments is of particular importance to us and is a prerequisite for investment.
For more informationSee page 26
ORGANISATION STRUCTURE
We believe that having the right people in the right roles doing the right work is critical to achieving our ambition, and so, we are redesigning our organisation to enable our people and our business to be successful.
For more informationSee page 26
ADDRESSING OUR IMMEDIATE PRIORITIESAs part of our Driving Value change programme we have completed the review of our asset portfolio and now understand what has to be done to achieve both our short term targets and long term ambitions. We have focused on four strategic priority areas to help us deliver now.
1. EXPECTATION SETTING AND OPERATIONAL PLANNING
The first step in understanding how to optimise each of our assets is to determine the gap between the current capabilities of the assets versus budgeted expectations.
2. PERFORMANCE ANALYSIS
We then analyse data and key performance indicators (KPIs) generated by the asset to confirm average performance levels, assuming no changes to the current process.
3. CONTINUOUS IMPROVEMENT
Incremental changes are made to the operation of the assets to deliver a positive and sustainable shift in performance with minimal capital outlay.
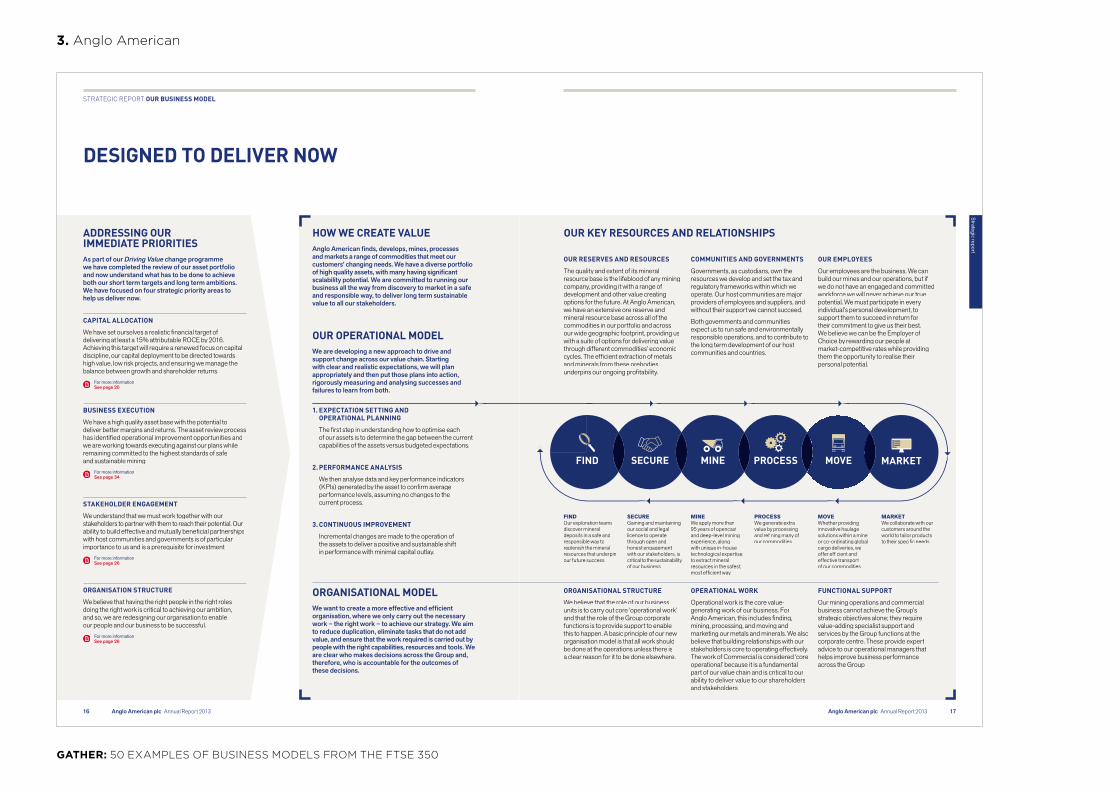
HOW WE CREATE VALUE Anglo American finds, develops, mines, processes and markets a range of commodities that meet our customers’ changing needs. We have a diverse portfolio of high quality assets, with many having significant scalability potential. We are committed to running our business all the way from discovery to market in a safe and responsible way, to deliver long term sustainable value to all our stakeholders.
OUR OPERATIONAL MODEL We are developing a new approach to drive and support change across our value chain. Starting with clear and realistic expectations, we will plan appropriately and then put those plans into action, rigorously measuring and analysing successes and failures to learn from both.
ORGANISATIONAL MODEL We want to create a more effective and efficient organisation, where we only carry out the necessary work – the right work – to achieve our strategy. We aim to reduce duplication, eliminate tasks that do not add value, and ensure that the work required is carried out by people with the right capabilities, resources and tools. We are clear who makes decisions across the Group and, therefore, who is accountable for the outcomes of these decisions.
16 Anglo American plc Annual Report 2013
STRATEGIC REPORT OUR BUSINESS MODEL
OUR RESERVES AND RESOURCES
The quality and extent of its mineral resource base is the lifeblood of any mining company, providing it with a range of development and other value creating options for the future. At Anglo American, we have an extensive ore reserve and mineral resource base across all of the commodities in our portfolio and across our wide geographic footprint, providing us with a suite of options for delivering value through different commodities’ economic cycles. The efficient extraction of metals and minerals from these orebodies underpins our ongoing profitability.
COMMUNITIES AND GOVERNMENTS
Governments, as custodians, own the resources we develop and set the tax and regulatory frameworks within which we operate. Our host communities are major providers of employees and suppliers, and without their support we cannot succeed.
Both governments and communities expect us to run safe and environmentally responsible operations, and to contribute to the long term development of our host communities and countries.
OUR EMPLOYEES
Our employees are the business. We can build our mines and our operations, but if we do not have an engaged and committed workforce we will never achieve our true potential. We must participate in every individual’s personal development, to support them to succeed in return for their commitment to give us their best. We believe we can be the Employer of Choice by rewarding our people at market-competitive rates while providing them the opportunity to realise their personal potential.
OUR KEY RESOURCES AND RELATIONSHIPS
ORGANISATIONAL STRUCTURE
We believe that the role of our business units is to carry out core ‘operational work’ and that the role of the Group corporate functions is to provide support to enable this to happen. A basic principle of our new organisation model is that all work should be done at the operations unless there is a clear reason for it to be done elsewhere.
OPERATIONAL WORK
Operational work is the core value-generating work of our business. For Anglo American, this includes finding, mining, processing, and moving and marketing our metals and minerals. We also believe that building relationships with our stakeholders is core to operating effectively. The work of Commercial is considered ‘core operational’ because it is a fundamental part of our value chain and is critical to our ability to deliver value to our shareholders and stakeholders.
FUNCTIONAL SUPPORT
Our mining operations and commercial business cannot achieve the Group’s strategic objectives alone; they require value-adding specialist support and services by the Group functions at the corporate centre. These provide expert advice to our operational managers that helps improve business performance across the Group.
FINDOur exploration teams discover mineral deposits in a safe and responsible way to replenish the mineral resources that underpin our future success.
SECURE Gaining and maintaining our social and legal licence to operate, through open and honest engagement with our stakeholders, is critical to the sustainability of our business.
MINEWe apply more than 95 years of opencast and deep-level mining experience, along with unique in-house technological expertise, to extract mineral resources in the safest, most efficient way.
PROCESSWe generate extra value by processing and refining many of our commodities.
MOVEWhether providing innovative haulage solutions within a mine, or co-ordinating global cargo deliveries, we offer efficient and effective transport of our commodities.
MARKETWe collaborate with our customers around the world to tailor products to their specific needs.
MARKETMOVEPROCESSMINESECUREFIND
17
Strategic report
Anglo American plc Annual Report 2013
GATHER: 50 EXAMPLES OF BUSINESS MODELS FROM THE FTSE 350
3. Anglo American

How we add valueIn this section, we describe our business model and the purpose, ambition and values that drive what we do and how we do it.We outline how we add value, our strategic priorities, how we measure our success and the risks we face. We also describe how we are governed and paid, and how this supports our strategy.
Our business model
Cash �ow RevenueRe-
investment
Return to shareholders
Therapy areas
Resources
Strategic priorities
Customers
Life-cycle of a medicine
Promoting and rewarding innovation
Research and Development
Creation and acquisition of intellectual property through innovative R&D
Application for patents to protect the intellectual property assets developed in a potential medicine
Clinical development programmes to determine the safety and efficacy of the potential medicine and generate further intellectual property rights and data for regulatory submissions
Unmet medical
need
Improved health
10 AstraZeneca Annual Report and Form 20-F Information 2013
Strategic Report | Strategy | Business model
Sales and Marketing
Period of intellectual property protection for an innovative medicine which allows a return to be made on the investment undertaken
Expiry of intellectual property rights and commoditisation of knowledge which typically sees generic versions of a medicine entering a market
Unmet medical need We are living in a time when underlying demographic trends are favourable to long-term pharmaceutical industry growth, and innovative scientific research continues to deliver new ways of satisfying unmet medical need. However, as the Our marketplace section from page 13 demonstrates, the economic, social and political environment in which we operate presents major challenges, as well as opportunities. Our strategic priorities section from page 16 defines our response to this environment.
Resources In everything we do, we seek to optimise the value of all our resources. These include both our employees and the relationships we have with our partners, collaborators and suppliers. Our assets also include our intellectual property, our infrastructure and other physical assets. See the Resources Review from page 66 for more information.
Life-cycle of a medicine We are one of very few pure-play biopharmaceutical companies (that is, not involved in consumer or animal healthcare, diagnostics or medical devices) to span the entire value chain of a medicine from research, early- and late-stage development to manufacturing and distribution, and the global commercialisation of primary care, specialty care-led and specialty care
medicines that transform lives. Our life-cycle management process (including line extensions) is designed to ensure a medicine’s continued safe use and to explore its potential for treating other diseases, or for extending its use into additional patient groups. See the Business Review from page 34 for more on our activities across a medicine’s life-cycle. The Therapy Area Review from page 48 describes our activities across our chosen therapy areas.
Return to shareholdersThe revenue we earn from the sale of our medicines generates the cash flow that helps us fund business investment, our progressive dividend policy, and meet our debt service obligations. We aim to strike a balance between the interests of the business, our financial creditors and our shareholders. See the Financial Review from page 74 for more information.
Improved healthWe believe that continuous innovation in medical progress is vital to achieving sustainable healthcare. It adds value by:
> leading to better health outcomes and transforming patients’ lives
> enabling healthcare systems to save costs and be more efficient
> delivering value beyond the medicines themselves by, for example, improving access to healthcare and healthcare infrastructure
> contributing to the development of the communities in which we operate, via local employment, and partnering.
Promoting and rewarding innovationThe creation and protection of our underlying intellectual property assets, as outlined below, are essential elements of our business model. Developing a new medicine is risky, costly and time consuming. It requires significant investment over 10 or more years before product launch, with no guarantee of success. For this to be viable, the new medicine must be safeguarded from being copied, with a reasonable amount of certainty and for an acceptable period of time, so we can generate the returns to reinvest in the business and provide an appropriate return to shareholders.
The loss of key product patents has affected sales significantly in recent years and will continue to do so. A key goal for our planning process is to ensure we sustain the cycle of successful innovation and so continue to refresh our portfolio of patented products that transform lives and generate shareholder value.
Additional Inform
ationFinancial S
tatements
Corporate G
overnanceS
trategic Report
11AstraZeneca Annual Report and Form 20-F Information 2013
GATHER: 50 EXAMPLES OF BUSINESS MODELS FROM THE FTSE 350
4. AstraZeneca
BUSINESS MODEL
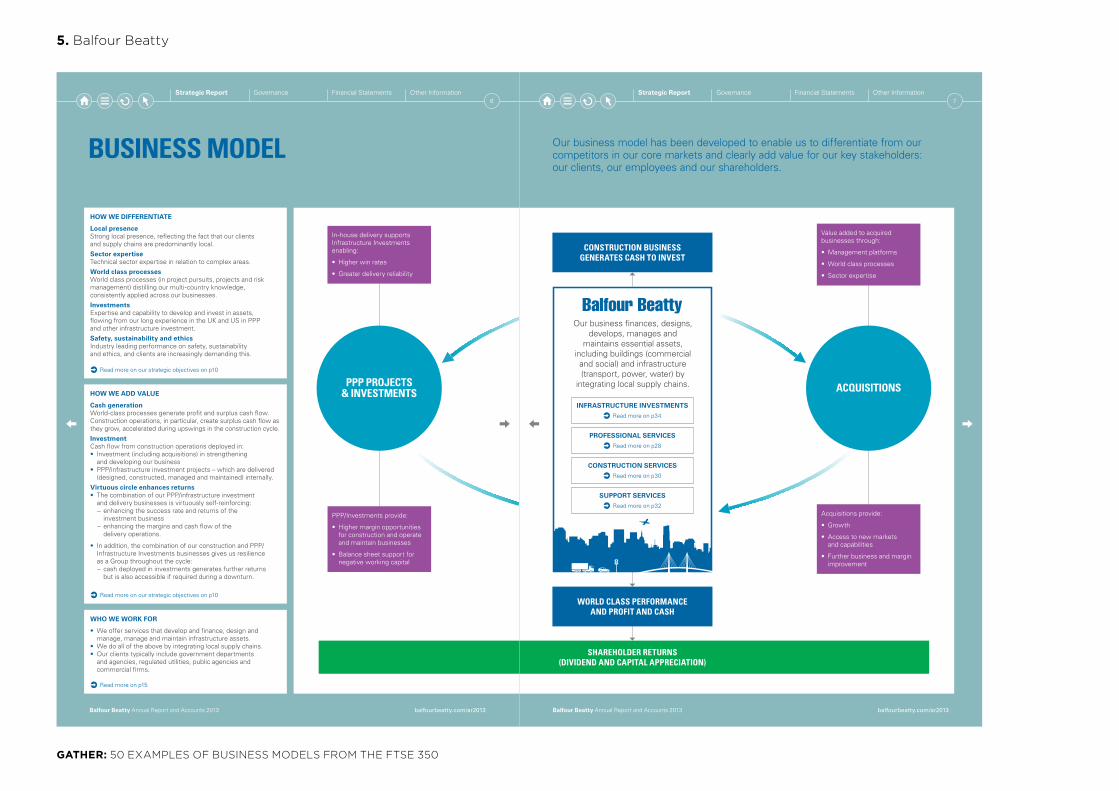
HOW WE DIFFERENTIATE
Local presenceStrong local presence, reflecting the fact that our clients and supply chains are predominantly local.
Sector expertiseTechnical sector expertise in relation to complex areas.
World class processesWorld class processes (in project pursuits, projects and risk management) distilling our multi-country knowledge, consistently applied across our businesses.
InvestmentsExpertise and capability to develop and invest in assets, flowing from our long experience in the UK and US in PPP and other infrastructure investment.
Safety, sustainability and ethicsIndustry leading performance on safety, sustainability and ethics, and clients are increasingly demanding this.
HOW WE ADD VALUE
Cash generationWorld-class processes generate profit and surplus cash flow. Construction operations, in particular, create surplus cash flow as they grow, accelerated during upswings in the construction cycle.
InvestmentCash flow from construction operations deployed in:• Investment (including acquisitions) in strengthening
and developing our business• PPP/infrastructure investment projects – which are delivered
(designed, constructed, managed and maintained) internally.
Virtuous circle enhances returns• The combination of our PPP/infrastructure investment
and delivery businesses is virtuously self-reinforcing: − enhancing the success rate and returns of the investment business
− enhancing the margins and cash flow of the delivery operations.
• In addition, the combination of our construction and PPP/ Infrastructure Investments businesses gives us resilience as a Group throughout the cycle:
− cash deployed in investments generates further returns but is also accessible if required during a downturn.
Read more on our strategic objectives on p10
Read more on our strategic objectives on p10
WHO WE WORK FOR
• We offer services that develop and finance, design and manage, manage and maintain infrastructure assets.
• We do all of the above by integrating local supply chains.• Our clients typically include government departments
and agencies, regulated utilities, public agencies and commercial firms.
Read more on p15
In-house delivery supports Infrastructure Investments enabling:
• Higher win rates
• Greater delivery reliability
PPP/Investments provide:
• Higher margin opportunities for construction and operate and maintain businesses
• Balance sheet support for negative working capital
PPP PROJECTS & INVESTMENTS
balfourbeatty.com/ar2013Balfour Beatty Annual Report and Accounts 2013
6Strategic Report Governance Financial Statements Other Information
WORLD CLASS PERFORMANCE AND PROFIT AND CASH
Our business model has been developed to enable us to differentiate from our competitors in our core markets and clearly add value for our key stakeholders: our clients, our employees and our shareholders.
Our business finances, designs, develops, manages and
maintains essential assets, including buildings (commercial and social) and infrastructure (transport, power, water) by
integrating local supply chains.
Value added to acquired businesses through:
• Management platforms
• World class processes
• Sector expertise
Acquisitions provide:
• Growth
• Access to new markets and capabilities
• Further business and margin improvement
ACQUISITIONS
CONSTRUCTION BUSINESS GENERATES CASH TO INVEST
PROFESSIONAL SERVICES
Read more on p28
CONSTRUCTION SERVICES
Read more on p30
SUPPORT SERVICES
Read more on p32
INFRASTRUCTURE INVESTMENTS
Read more on p34
SHAREHOLDER RETURNS (DIVIDEND AND CAPITAL APPRECIATION)
balfourbeatty.com/ar2013Balfour Beatty Annual Report and Accounts 2013
7Other InformationFinancial StatementsGovernanceStrategic Report
GATHER: 50 EXAMPLES OF BUSINESS MODELS FROM THE FTSE 350
5. Balfour Beatty
ONE NETWORK
RETAILBANKING
CORPORATEBANKING
INSURANCE ANDHEALTHCARE
AFFORDABLEHOUSING
INVESTMENTMANAGEMENT
STRENGTH OF THEFRANCHISE
BRAND, SCALE AND
DISTRIBUTION
ADVAVAV NCED ELECTRONIC CHANNELS
UNMATATA CHED LOCAL KNOWLEDGE
SEGMENTOFFERING
SUPERIORITYIN LIABILITY
MANAGEMENT
UNIQUEEXPOSURE
TO GEORGIA
STRONGGOVERNANCE
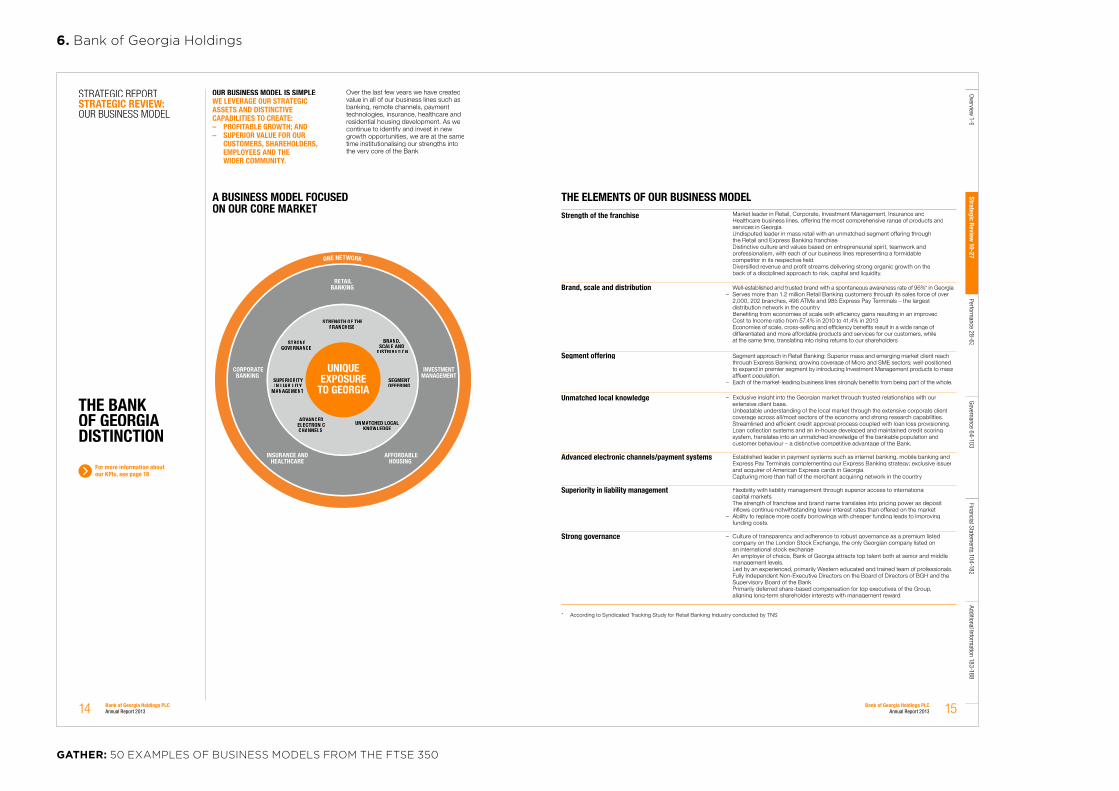
OUR BUSINESS MODEL IS SIMPLE:WE LEVERAGE OUR STRATEGIC ASSETS AND DISTINCTIVE CAPABILITIES TO CREATE:– PROFITABLE GROWTH; AND– SUPERIOR VALUE FOR OUR
CUSTOMERS, SHAREHOLDERS, EMPLOYEES AND THE WIDER COMMUNITY.
Over the last few years we have created value in all of our business lines such as banking, remote channels, payment technologies, insurance, healthcare and residential housing development. As we continue to identify and invest in new growth opportunities, we are at the same time institutionalising our strengths into the very core of the Bank.
THE BANK OF GEORGIA DISTINCTION
For more information about our KPIs, see page 18
STRATEGIC REPORTSTRATEGIC REVIEW: OUR BUSINESS MODEL
THE ELEMENTS OF OUR BUSINESS MODELStrength of the franchise – Market leader in Retail, Corporate, Investment Management, Insurance and
Healthcare business lines, offering the most comprehensive range of products and services in Georgia.
– Undisputed leader in mass retail with an unmatched segment offering through the Retail and Express Banking franchise.
– Distinctive culture and values based on entrepreneurial spirit, teamwork and professionalism, with each of our business lines representing a formidable competitor in its respective �eld.
– Diversi�ed revenue and pro�t streams delivering strong organic growth on the back of a disciplined approach to risk, capital and liquidity.
Brand, scale and distribution – Well-established and trusted brand with a spontaneous awareness rate of 96%* in Georgia.– Serves more than 1.2 million Retail Banking customers through its sales force of over
2,000, 202 branches, 496 ATMs and 985 Express Pay Terminals – the largest distribution network in the country.
– Bene�ting from economies of scale with ef�ciency gains resulting in an improved Cost to Income ratio from 57.4% in 2010 to 41.4% in 2013.
– Economies of scale, cross-selling and ef�ciency bene�ts result in a wide range of differentiated and more affordable products and services for our customers, while at the same time, translating into rising returns to our shareholders.
Segment offering – Segment approach in Retail Banking: Superior mass and emerging market client reach through Express Banking; growing coverage of Micro and SME sectors; well-positioned to expand in premier segment by introducing Investment Management products to mass af�uent population.
– Each of the market-leading business lines strongly bene�ts from being part of the whole.
Unmatched local knowledge – Exclusive insight into the Georgian market through trusted relationships with our extensive client base.
– Unbeatable understanding of the local market through the extensive corporate client coverage across all/most sectors of the economy and strong research capabilities.
– Streamlined and ef�cient credit approval process coupled with loan loss provisioning. Loan collection systems and an in-house developed and maintained credit scoring system, translates into an unmatched knowledge of the bankable population and customer behaviour – a distinctive competitive advantage of the Bank.
Advanced electronic channels/payment systems – Established leader in payment systems such as internet banking, mobile banking and Express Pay Terminals complementing our Express Banking strategy; exclusive issuer and acquirer of American Express cards in Georgia.
– Capturing more than half of the merchant acquiring network in the country.
Superiority in liability management – Flexibility with liability management through superior access to international capital markets.
– The strength of franchise and brand name translates into pricing power as deposit in�ows continue notwithstanding lower interest rates than offered on the market.
– Ability to replace more costly borrowings with cheaper funding leads to improving funding costs.
Strong governance – Culture of transparency and adherence to robust governance as a premium listed company on the London Stock Exchange, the only Georgian company listed on an international stock exchange.
– An employer of choice, Bank of Georgia attracts top talent both at senior and middle management levels.
– Led by an experienced, primarily Western educated and trained team of professionals. – Fully Independent Non-Executive Directors on the Board of Directors of BGH and the
Supervisory Board of the Bank.– Primarily deferred share-based compensation for top executives of the Group,
aligning long-term shareholder interests with management reward.
* According to Syndicated Tracking Study for Retail Banking Industry conducted by TNS.
A BUSINESS MODEL FOCUSED ON OUR CORE MARKET
Overview
1-9Strategic Review
10-27Perform
ance 28-63Governance 64-103
Financial Statements 104-182
Additional Information 183-188
Bank of Georgia Holdings PLC Annual Report 2013 1514 Bank of Georgia Holdings PLC
Annual Report 2013
GATHER: 50 EXAMPLES OF BUSINESS MODELS FROM THE FTSE 350
6. Bank of Georgia Holdings

4 Beazley Annual report 2013
www.beazley.com
Our business model Our strategy
Reconfirmed annually through the business planning process, our business model is as follows:
•Beazley is a specialist insurer. We have a targeted product set, very largely in commercial lines of business, and underwrite each risk on its own merits
•We employ highly skilled, experienced and specialist underwriters and claims managers
•We tend to write capped liabilities•We operate through specific insurance hubs rather
than seeking a local presence in every country in which we do business
•We transact business through brokers and work with selected managing general agencies and managing general underwriters to improve distribution in specialist niches
Our strategy is directed towards the achievement of our vision, which is to become, and be recognised as, the highest performing specialist insurer. To this end, our strategy comprises:
•Prudent capital allocation to achieve a well diversified portfolio that is resistant to shocks in any individual line of business
•The creation of an environment in which talented individuals with entrepreneurial spirit can build successful businesses
•The ability to scale our operations to ensure that client and broker service keeps pace – and wherever possible improves – as the company grows
•Consistent investment in product innovations to provide better products and services to improve our clients’ risk transfer
A business model and strategy that support high performance
4 Beazley Annual report 2013
www.beazley.com 5Beazley Annual report 2013
www.beazley.com
Financial statementsGovernanceStrategic report
Our key performance indicators
KPIs
Financial highlightsEarnings per share (c)
20132012201120102009
52.4
28.9
42.1
13.0
42.4
0102030405060
Basic EPS is at 2.0x total dividend cover for 2013. Average EPS over the last five years is at 4.5x average dividend cover (excluding the special dividends).
Net assets per share (c)
20132012201120102009
18.2
21.7 23.2 25.823.0
248.3
169.8 191.4 185.9217.5
050
100150200250300
Tangible Intangible
0
20
40
60
80
100
Great Place to Work survey (%)
201320112008
81 76 83
11% growth in net assets per share during 2013.
Since 2008, Beazley has run an employmentengagement survey (now every two years)managed by the Great Place to Work® organisation. In 2013, for the third time ina row, a large majority of employees rated Beazley a great place to work.
0
500
1000
1500
2000
Gross premiums written ($m)
20132012201120102009
1,9
70.2
1,75
1.3
1,74
1.6
1,71
2.5
1,89
5.9
Growth of 4% in 2013 and 12% since 2009.
0
5
10
15
20
25
Dividends per share (p)
20132012201120102009
16.12.5 8.48.87.0 7.5 7.9 8.3
Interim and final Special
The second interim dividend in 2013 is in line with our dividend strategy and has grown by 6%. In addition we are paying a special dividend of 16.1p.
0
5
10
15
20
25
Return on equity (%)
20132012201120102009
2124
19
6
19
Cumulative five year return on equity of 89%.
0
20
40
60
80
100
Combined ratio (%)
20132012201120102009
3935 36
3738
8490 8899
91
4555 52
6253
Claims ratio Expense ratio
Our combined ratio has averaged 90% over five years.
For further details go to page 104
Non-financial highlights
GATHER: 50 EXAMPLES OF BUSINESS MODELS FROM THE FTSE 350
7. Beazley

Extraction, processing and transportation Marketing and logistics
Across our global operations, the diversification of our portfolio of assets by commodity, geography and market continues to be one of our differentiating features. Our goal is to safely operate all of our assets at capacity through mining, extracting, processing and transporting commodities.
We continue to set production records at a number of assets. Through the development and use of standard operating practices and technology, we are driving efficiencies through improved capital intensity, labour productivity and increased utilisation of plant and machinery.
Our extraction and processing activities apply our ongoing sustainability obligations, including rehabilitation at the end of the asset life.
In order to develop customer and market-focused solutions, we have divided our marketing organisation between mineral marketing, centralised in Singapore and petroleum product marketing, based in Houston, United States. Marketing manages the Group’s product sales and the purchase of all major raw materials. It achieves market clearing prices for our products and is responsible for managing our credit and price risks.
Marketing also manages the supply chain of our products from assets to markets and the raw materials from suppliers to assets. This includes managing our in-house freight requirements so as to procure high-quality, cost-effective shipping.
• open-pit and underground mining• extracting conventional and
unconventional oil and gas • processing and refining
• selling our products• purchasing major raw materials• managing the supply chain• managing credit and price risk
1.5.3 External factors and trendsGlobal economyEconomic conditions during the second half of FY2013 were affected by lower than expected growth in emerging economies. Weaker trade and soft manufacturing activity pulled growth rates slightly below expectations in China. However, with employment conditions and income growth remaining resilient, the Chinese Government has room to pursue reforms that support its agenda of stable, long-term growth.
Significant cuts in government spending affected growth in the United States, however this was offset by improved private sector demand, leading to modest rates of economic growth overall. Housing and stock market prices have also strengthened household balance sheets over the past year. As a result, we are confident the recovery will continue, although risks remain regarding the unwinding of monetary policy stimulus.
The renewed policy push in Japan is also positive for medium-term growth expectations, if the government can achieve its stated objectives. Europe remained relatively stable during FY2013; however, we do not anticipate a strong or rapid recovery while fundamental structural problems remain.
Overall, we expect more balanced global growth over the long term as China continues to develop its economy and large developed economies, such as the United States, grow despite fiscal challenges. We expect the rebalancing of the Chinese economy to be significant in terms of the nature of domestic demand, as well as the types of goods and services the economy will produce. We expect these changes to take place gradually, particularly in relation to savings behaviour and levels of fixed asset investment. We also see India and South East Asia as significant sources of economic growth in the long term.
Commodity pricesDuring FY2013, commodity markets were impacted by a slower pace of growth in China that was balanced in part by increased stability in European sovereign debt markets and an improved private sector performance in the United States. In the case of most steelmaking raw materials, demand growth rates outside China decreased, and combined with robust supply growth from seaborne sources, resulted in lower raw material prices than the previous year. The metals commodities attracted lower prices than the previous year as a result of supply growing faster than demand. Conversely for energy commodities, geopolitical tensions and United States economic improvements provided price support for crude oil, while the US gas prices increased due to increased seasonal demand in the residential and commercial sector and decreased storage inventories from the previous year.
Exchange ratesWe are exposed to movements in exchange rates in relation to foreign currency sales and purchases as well as in relation to foreign currency denominated monetary assets and liabilities, including debt. We believe that active currency hedging does not provide long-term benefits to our shareholders. Because a majority of our sales are denominated in US dollars, and the US dollar plays an important role in our organisation, we borrow and hold surplus cash predominantly in US dollars to provide a natural hedge. Operating costs and costs of locally sourced equipment are influenced by fluctuations in local currencies, primarily the Australian dollar, Brazilian real, Chilean peso and South African rand. Foreign exchange gains and losses reflected in operating costs owing to fluctuations in the local currencies relative to the US dollar may potentially offset one another. In addition, exchange rate markets often provide a theoretical natural hedge against movements in commodity prices. Volatility increased during the year, with a strengthening of the US dollar in the last quarter of FY2013. Overall, the Australian dollar, Brazilian real and South African rand ended FY2013 weaker against the US dollar, while the Chilean peso strengthened.
1 Key information
2 Information on the Com
pany3 O
perating and financial review
and prospects4 Board of D
irectors and G
roup Managem
ent Comm
ittee5 Corporate G
overnance Statement
6 Remuneration Report
BHP BILLITON ANNUAL REPORT 2013 | 9
1 Key information continued
1.5 Our strategy and business model
1.5.1 Our consistent strategyOur purposeOur purpose is to create long-term shareholder value through the discovery, acquisition, development and marketing of natural resources.
Our strategyOur strategy is to own and operate large, long-life, low-cost, expandable, upstream assets diversified by commodity, geography and market.
We sell into globally integrated markets and aim to produce at full capacity throughout the economic cycle. Our leading position in the resources industry is due to our unique, proven and consistent strategy. In line with our strategy, we pursue growth opportunities consistent with our core skills of:• evaluating, developing and extracting our resources
in our Businesses;• distributing and selling our products, and managing financial
risk associated with the revenue line through Marketing;• through our Group Functions, defining and governing world-class
functional standards, which are implemented Group-wide.
This strategy means more predictable company performance over time which, in turn, underpins the creation of long-term sustainable value for our shareholders, customers, employees and the communities in which we operate. We aim to deliver long-term sustainable value rather than being focused on short-term returns.
Our valuesIn pursuing our strategy through all stages of the economic and commodity cycle, we are guided by Our Charter values of Sustainability; Integrity; Respect; Performance; Simplicity; and Accountability.
Our overriding commitment is ensuring the safety of our people, and respecting our environment and the communities in which we work. This commitment informs everything we do and influences every aspect of our work.
Operational capability is fundamental to our strategy and is reflected in Our Charter. In particular, our values of Performance – achieving superior business results by stretching our capabilities, and Simplicity – focusing our efforts on the things that matter most.
Our success factorsWe are successful when our people start each day with a sense of purpose and end the day with a sense of accomplishment; our communities, customers and suppliers value their relationships with us; our asset portfolio is world-class and sustainably developed; our operational discipline and financial strength enables our future growth; and our shareholders receive a superior return on their investment.
1.5.2 Our business model
Exploration and evaluation Development
Over the past five years, brownfield exploration has increased our resource base around our portfolio of existing assets in large resource basins, which now provides us with significant growth opportunities. This has allowed us to reduce brownfield exploration expenditure and rationalise our greenfield exploration program to focus on copper in Chile and Peru and conventional oil and gas predominantly in the Gulf of Mexico and Western Australia.
We evaluate the results of our brownfield and greenfield exploration to identify future growth projects consistent with our strategy to own and operate large, long-life, low-cost, expandable, upstream assets. We also continually evaluate our portfolio and consider acquisition and divestment opportunities.
The evaluation and development of large-scale resource projects generates significant value for BHP Billiton. We have a number of high-quality growth projects currently under development. We also have a large number of growth opportunities in our project pipeline in varying stages of evaluation. In our development process, these projects progress through feasibility to execution only after external approvals and rigorous internal review.
Potential expansion projects must compete for capital in BHP Billiton and are only approved if they meet our strict criteria for investment.
• discovery through brownfield and greenfield exploring
• acquiring and divesting• evaluating our portfolio
• evaluating and developing projects
8 | BHP BILLITON ANNUAL REPORT 2013
GATHER: 50 EXAMPLES OF BUSINESS MODELS FROM THE FTSE 350
8. BHP Billiton

We aim to create shareholder value across the hydrocarbon value chain.
Our business model
Our businessesFor more information on our upstream, downstream and alternative energy businesses, see pages 25, 31 and 37 respectively.
A rising global population and increasing levels of prosperity are set to create growing demand for energy for years to come. We can help to meet that demand by producing oil and gas safely and reliably.
We believe that the best way to achieve sustainable success as a group is to act in the long-term interests of our shareholders, our partners and society. We aim to create value for our investors and benefits for the communities and societies in which we operate, with the responsible supply of energy playing a vital role in economic development.
Every stage of the hydrocarbon value chain offers opportunities for us to create value – both through the successful execution of activities that are core to our industry, and through the application of our own distinctive strengths and capabilities in performing those activities. In renewable energy our focus is on integrating biofuels into the hydrocarbon value chain, and on wind operations in the US.
Our approach spans everything from exploration to marketing. Integration across the group allows us to share functional excellence more efficiently across areas such as safety and operational risk, environmental and social practices, procurement, technology and treasury management.
A relentless focus on safety remains the top priority for everyone at BP. Rigorous management of risk helps to protect the people at the front line, the places in which we operate and the value we create. We understand that operating in politically complex regions and technically demanding geographies requires particular sensitivity to local environments.
Toledo refinery in Ohio has been in constant operation since 1919. The facility has the capacity to process up to 160,000 barrels of crude per day.
The redevelopment project at Valhall was one of BP’s most complex field expansion developments and gives the field a further 40-year design life.
Our business model
Finding oil and gas
First, we acquire the rights to explore for oil and gas. Through our exploration activities we are able to renew our portfolio, discover new resources and replenish our development options.
Developing and extracting
When we find hydrocarbon resources, we create value by seeking to progress them into proved reserves or by divesting if they do not fit with our strategy. If we believe developing and producing the reserves will be advantageous for BP, we produce the oil and gas, then sell it to the market or distribute it to our downstream facilities.
Transporting and trading
We move oil and gas through pipelines and by ship, truck and train. Using our trading and supply skills and knowledge, we buy and sell at each stage in the value chain. Our presence across major trading hubs gives us a good understanding of regional and international markets and allows us to create value through entrepreneurial trading.
Manufacturing and marketing
Using our technology and expertise, we manufacture fuels and products, creating value by seeking to operate a high-quality portfolio of well-located assets safely, reliably and efficiently. We market our products to consumers and other end-users and add value through the strength of our brands.
Our illustrated business model see page 2.
BP Annual Report and Form 20-F 201312
Strategic report
Financial discipline
$
Time(Not to scale)
Free cash flow
Operating cash flow
Net investment
Our goal is to be a focused oil and gas company that delivers value over volume.
Our strategy
We are pursuing our strategy by setting clear priorities, actively managing a quality portfolio and employing our distinctive capabilities. Our financial objective is to create shareholder value by generating sustainable free cash flow (operating cash flow less net investment). This disciplined approach enables us to invest for the future while aiming to increase distributions to our investors.
Clear prioritiesFirst, we aim to run safe, reliable and compliant operations – leading to better operational efficiency and safety performance. We also aim to achieve competitive project execution, which is about delivering projects efficiently so they are on time and on budget. And we aim to make disciplined financial choices, so we can achieve continued growth in operating cash from our underlying businesses and disciplined allocation of capital.
Quality portfolioWe undertake active portfolio management to concentrate on areas where we can play to our strengths. This means we continue to grow our exploration position, reloading our upstream pipeline. We focus on high-value upstream assets in deepwater, giant fields and selected gas value chains. And, with our downstream businesses, we plan to leverage our newly upgraded assets, customer relationships and technology to grow free cash flow.
Our portfolio of projects and operations is focused where we can generate the most value, and not necessarily the most volume, through our production.
Distinctive capabilitiesOur ability to deliver against our priorities and build the right portfolio depends on our distinctive capabilities. We apply advanced technology across the hydrocarbon value chain, from finding resources to developing energy-efficient and high-performance products for customers. We rely on our strong relationships – with governments, partners, civil society and others – to enable our operations in around 80 countries across the globe. And, the proven expertise of our employees comes to the fore in a wide range of disciplines.
Our strategy in actionSee page 14 for more information on how we are going to measure our progress.
1 A relentless focus on safety and managing risk through the systematic application of global standards.
2 We will play to our strengths in exploration, deep water, giant fields and gas value chains.
3 Stronger and more focused with an asset base that is high graded and higher performing.
4 4 4 Simpler and more standardized with fewer assets and operations in fewer countries; more streamlined internal reward and performance management processes.
5 Improved transparency through reporting TNK-BP as a separate segment and breaking out the numbers for the three downstream businesses.
6 Active portfolio management to continue by completing $38 billion of disposals over the four years to the end of 2013, in order to focus on our strengths.
7 We expect to bring new upstream projects onstream with unit operating cash marginsf
around double the 2011 average by 2014.g
8 We are aiming to generate an increase of around 50% in net cash provided by operating activities by 2014 compared with 2011.h
9 We intend to use half our incremental operating cash for reinvestment, half for other purposes.
10 Strong balance sheet with intention to target our level of gearingi in the lower half of the 10-20% range over time.
a See footnote a on page 56.b Equivalent to net cash used in investing activities.c See footnote c on page 56.d See footnote h on page 24.e Excludes acquisitions and asset exchanges.f Unit cash margin is net cash provided by operating activities bythe relevant projects in our Upstream segment, divided by the total number of barrels of oil equivalent produced for the relevant projects.
g Assuming a constant oil price of $100 per barrel.h See footnote b on page 56.i See footnote d on page 56.
10-point plan 2011-2014In 2011 we laid out a 10-point plan designed to stabilize the company and restore trust and value in response to the tragic Deepwater Horizon accident. Our priority was to make BP a safer, more risk-aware business. The plan included a series of milestones by which our progress could be tracked, from 2012 through to 2014. Information on our progress during 2013 can be found in Group performance on page 22.
• Operating cash flow – we aim to continue growing our operating cash flow, with an expected delivery of $30 billion to $31 billion in 2014.d
• Capital expenditure – we expect our annual capital expendituree to remain between $24 billion and $25 billion in 2014 and to be in the range of $24 billion to $26 billion in the years 2015 to 2018.
• Divestments – we intend to divest $10 billion of assets before the end of 2015.
• Free cash flow – delivering sustainable free cash flow underpins our ability to deliver increasing shareholder returns.
This chart illustrates the expected relationship between operating cash flowa, net investmentb
(includes capital expenditure offset by any divestments) and free cash flowc. It is not a projection of future performance.
BP Annual Report and Form 20-F 2013 13
GATHER: 50 EXAMPLES OF BUSINESS MODELS FROM THE FTSE 350
9. BP
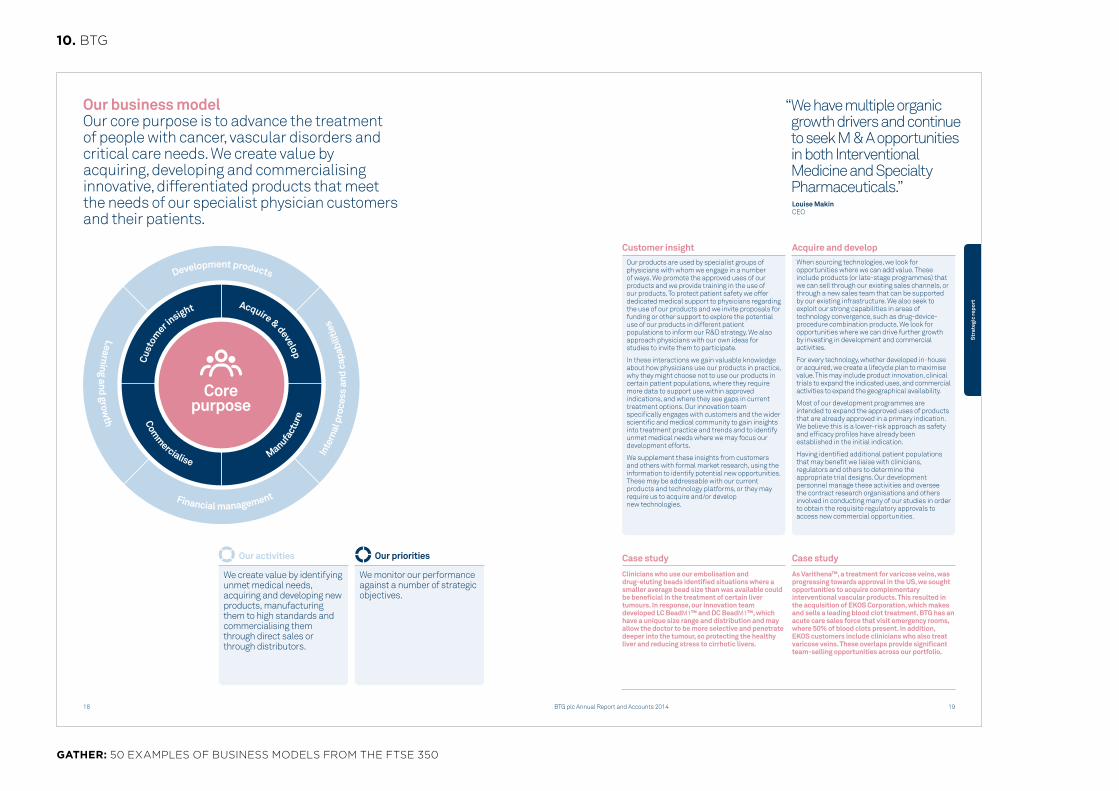
Our business modelOur core purpose is to advance the treatment of people with cancer, vascular disorders and critical care needs. We create value by acquiring, developing and commercialising innovative, differentiated products that meet the needs of our specialist physician customers and their patients.
Development products
Financial management
Learning and growth
In
tern
al p
roce
ss a
nd c
apab
ilitie
s
Core purpose
Cust
omer in
sight Acquire & develop
Comm
ercialise Manufact
ure
18
Our activities
We create value by identifying unmet medical needs, acquiring and developing new products, manufacturing them to high standards and commercialising them through direct sales or through distributors.
Our priorities
We monitor our performance against a number of strategic objectives.
BTG plc Annual Report and Accounts 2014 19
Str
ateg
ic re
port
“ We have multiple organic growth drivers and continue to seek M & A opportunities in both Interventional Medicine and Specialty Pharmaceuticals.”
Louise Makin CEO
Our products are used by specialist groups of physicians with whom we engage in a number of ways. We promote the approved uses of our products and we provide training in the use of our products. To protect patient safety we offer dedicated medical support to physicians regarding the use of our products and we invite proposals for funding or other support to explore the potential use of our products in different patient populations to inform our R&D strategy. We also approach physicians with our own ideas for studies to invite them to participate.
In these interactions we gain valuable knowledge about how physicians use our products in practice, why they might choose not to use our products in certain patient populations, where they require more data to support use within approved indications, and where they see gaps in current treatment options. Our innovation team specifically engages with customers and the wider scientific and medical community to gain insights into treatment practice and trends and to identify unmet medical needs where we may focus our development efforts.
We supplement these insights from customers and others with formal market research, using the information to identify potential new opportunities. These may be addressable with our current products and technology platforms, or they may require us to acquire and/or develop new technologies.
When sourcing technologies, we look for opportunities where we can add value. These include products (or late-stage programmes) that we can sell through our existing sales channels, or through a new sales team that can be supported by our existing infrastructure. We also seek to exploit our strong capabilities in areas of technology convergence, such as drug-device-procedure combination products. We look for opportunities where we can drive further growth by investing in development and commercial activities.
For every technology, whether developed in-house or acquired, we create a lifecycle plan to maximise value. This may include product innovation, clinical trials to expand the indicated uses, and commercial activities to expand the geographical availability.
Most of our development programmes are intended to expand the approved uses of products that are already approved in a primary indication. We believe this is a lower-risk approach as safety and efficacy profiles have already been established in the initial indication.
Having identified additional patient populations that may benefit we liaise with clinicians, regulators and others to determine the appropriate trial designs. Our development personnel manage these activities and oversee the contract research organisations and others involved in conducting many of our studies in order to obtain the requisite regulatory approvals to access new commercial opportunities.
Case study
Clinicians who use our embolisation and drug-eluting beads identified situations where a smaller average bead size than was available could be beneficial in the treatment of certain liver tumours. In response, our Innovation team developed LC BeadM1™ and DC BeadM1™, which have a unique size range and distribution and may allow the doctor to be more selective and penetrate deeper into the tumour, so protecting the healthy liver and reducing stress to cirrhotic livers.
Case study
As Varithena™, a treatment for varicose veins, was progressing towards approval in the US, we sought opportunities to acquire complementary interventional vascular products. This resulted in the acquisition of EKOS Corporation, which makes and sells a leading blood clot treatment. BTG has an acute care sales force that visit emergency rooms, where 50% of blood clots present. In addition, EKOS customers include clinicians who also treat varicose veins. These overlaps provide significant team-selling opportunities across our portfolio.
Acquire and developCustomer insight
GATHER: 50 EXAMPLES OF BUSINESS MODELS FROM THE FTSE 350
10. BTG

Returns toshareholders
Community
Community
Our
colleagues
serviceCustomer
acqu
isit
ion
Cus
tom
er
(products/services)
Propositions
Networks
Ope
ratin
g co
sts
Gross m
argin
Cost of goods sold
Revenue
Investment
Cash �owPro�tability
Customer
Financial model�e way our businessmakes returns.
Operating modelHow we manage ourbusiness, servingcustomers.
Chief Executive’s strategic review
2013/14 performance � e past year has been an important one for the Group. We have sold our Islands, Macau and most recently Monaco business units – and have opened an operating hub in Miami. � ese have all been major steps to focus the business on the Caribbean and Latin America.
Although we were not able to obtain regulatory approval to complete the sale of our asset in the Seychelles, we will continue to review our options. As a strong business – cash generative and performing solidly – we will only dispose of this asset if such a transaction will generate attractive shareholder returns.
Collectively our disposals raised US$1,753 million, monies that
were used to reduce our level of indebtedness and provide the headroom for increased investment in our core markets.
Our � nancial results in the 2013/14 year have shown early signs of our turnaround, as we become more geographically-focused. At the beginning of 2013/14 we announced a cost reduction programme targeted to reduce our run-rate operating costs by US$100 million by the end of 2014/15. During the year we have made good progress with operating costs down US$43 million against the prior year, with an exit run rate in 2013/14 of US$77 million of cost savings achieved.
Group revenue continued its long run trend, declining a further 4% to US$1,873 million as growth in mobile and broadband
Chief Executive’s statement continued
A business model that delivers value
Our business model is based on providing customers with communications, information and entertainment services, at a price which delivers value to them, while enabling our business to make a fair return for our shareholders.
08 Cable & Wireless Communications08 Cable & Wireless Communications08 Cable & Wireless Communications
revenue across each of our businesses was more than o� set by declining � xed voice and enterprise, data and other revenue. It is this revenue decline that our new strategy is targeted to reverse.
� e US$52 million growth in mobile data revenue (up 23% in the year) indicates our customers’ increasing demand for data and their desire to access the internet anywhere, anytime, and on any device. However, at the same time both mobile and � xed voice revenue is declining across our industry; growth in broadband and TV is therefore vital for our future. Our B2B and B2G operations also experienced a slower year.
In Panama, we maintained our mobile market share above 50%, and delivered a 4% rise in mobile revenue, led by mobile data.
In the Caribbean, our Jamaica mobile business continued to gain market share as we competed on price and value. However, � xed line and enterprise businesses and adverse currency movements weighed down overall revenue by US$32 million. � e performance of BTC in � e Bahamas, our largest Caribbean market, continued to improve over the year as we launched new mobile and � xed networks, and prepared the business for mobile competition which is expected to arrive later this year. Our performance was weaker in several of the other Caribbean countries – a function of our existing network. With increased investment, and continued cost focus, we are con� dent that we can turn these businesses around; reversing this decline through increased investment is a priority.
Drive to mobile leadership
Fixed-mobile convergence
Reinforce our TV o� ering
Grow B2B and B2G business
Optimise our operating model
Strengthen unique government/stakeholder relationships
Grow top line revenue Maintain cost e� ciency Deliver unparalleled customer service
Increase returns on capital
1 2 43
And two critical enablers:
Delivery of those objectives is built upon four strategic imperatives:
Our business has four strategic objectives:
Our strategy for growth
Our overarching objectiveGrow customer relationships and lifetime value by delivering unparalleled customer experience, where our customers de� ne ‘excellence’.
Annual report 2013/14 09Annual report 2013/14 09Annual report 2013/14 09
GATHER: 50 EXAMPLES OF BUSINESS MODELS FROM THE FTSE 350
11. Cable & Wireless Communications

Carphone Warehouse Group plcAnnual Report 201414
STRATEGIC REPORT
Business model
SIMPLIFYING
For 25 years we have been offering the best choice, advice, price and support for our customers. Our retailing, systems and process expertise provides a strong platform for growth.CPW is committed to prioritising long-term value creation for shareholders.
COMPLEX TECHNOLOGY FOR CUSTOMERS AND BUSINESSES
+ Experts in our field + Unique systems and core capabilities that are difficult to imitate
+ Committed to investing in our people
+ Driven, entrepreneurial management team
+ Optimal supplier terms + Ability to leverage existing cost base and explore new opportunities at home and abroad, in turn driving scale
HOW WE ADD VALUE
+ Partnering with device manufacturers and major networks
+ Creating ongoing mutual economic benefits
RELA
TIO
NSHIPS SCALE
CAPABILITIE
SPEOPLECONNECTED TECHNOLOGY
MAKING MORE LIVES BETTER THROUGH
LONG-TERM APPROACH TO CREATE SHAREHOLDER VALUEOver the past 25 years, we have built the largest independent telecommunications retailer in Europe, attracting consumers and businesses looking for simple, impartial, expert advice about the complexities of mobile technology. Our long-standing purpose is to help customers understand technology.
Our long-term approach to investing creates a sustainable opportunity to continue to add value for a wide range of stakeholders, from our customers, through employees, communities, suppliers, partners, and fundamentally, for our shareholders.
UNIQUE RETAILER WITH PLATFORM FOR GROWTHCPW has an unusual revenue model compared to traditional retailers. A significant proportion of our revenue is derived from MNOs, for delivering new customers and upgrades. The business generally receives a share of future customer revenues, and/or commissions, which are typically used to subsidise the sales values of a range of connected devices. Other revenue streams include value-enhancing products such as accessories, insurance and assurance products.
Adapting to changing market dynamics, CPW has realised the potential to grow new revenue streams by leveraging its unique relationships, core systems and expertise to provide a range of managed services to businesses, including MNOs, other service providers and manufacturers.
CUSTOMER PROPOSITION
+ Committed to delivering value for our customers
+ Independent, impartial, expert advice + Widest choice of devices, connections
and services + Truly multi-channel offering
+ Subsidised and innovative propositions
+ Trusted brand
Carphone Warehouse Group plcAnnual Report 2014 15
STRATEGIC REPORTADAPTING TO AN
MARKETEVOLVINGDEVICE INNOVATIONMobile devices have been transformed in recent years by the development of smartphone technology, evolving rapidly from simple devices used to make and receive calls, to sophisticated hardware with advanced computing functionality. The market has seen continuous innovation, with ever-improving processing speeds and ever-evolving functionality, and increasing choice of screen sizes. Alongside competition between manufacturers of devices, competition has also developed between operating systems, providing broader choice for customers and making CPW’s expert and impartial proposition particularly relevant.
NETWORK EVOLUTIONIn recent years, Western European MNOs have been subject to significant regulatory intervention, particularly on charges to terminate calls from other network operators and on international roaming charges, causing downward pressure on MNO ARPUs. Mobile termination rate cuts have caused MNOs to reduce subsidies on prepay phones, making them increasingly more expensive for consumers, causing a shift towards postpay in some markets.
MNOs across Western Europe have been investing significantly in in the development of their 4G network infrastructures. 4G technology facilitates much faster downloads, providing comparable levels of performance to many Wi-Fi networks, and providing a much better platform for streaming than 3G infrastructure. As 4G services have been rolled out, MNOs have seen significantly increased levels of data usage, a trend which is expected to increase as network quality continues to improve, and more and more devices become capable of communicating with one another. In most of the markets in which CPW operates, MNOs are still in the process of rolling out their 4G networks, with nationwide coverage expected in the UK by the end of 2015. After several years of downward pressure on ARPUs, caused by weak consumer confidence, regulatory intervention and competition, increased data usage provides opportunities for MNOs to increase customer ARPU.
REPLACEMENT CYCLEFixed minimum term mobile phone contracts (typically 24 months) help to drive the replacement cycle of connected devices, supported by the device innovation noted above.
To benefit from 4G services, customers need 4G-enabled devices and as 4G network coverage improves in Western Europe, there is an incentive for customers to upgrade their services, providing a stimulus to the replacement cycle.
ECONOMIC GROWTHMobile phones have become an integral part of customers’ lives and are considered to be less discretionary than other consumer electronics. However, the economic backdrop and a challenging consumer environment can determine the rate at which consumers are willing to upgrade their handsets and their average monthly spend.
ONLINEAs with most markets, the internet plays an increasingly important part of customers' purchasing journey. The majority of customers research online before making a purchase. However, unlike many multi-channel retailers, for whom online channels now represent a significant portion of sales, online sales continue to represent between 10% and 15% of total retail sales for CPW. Customers continue to value the advice available within stores, given the complexity of the technology available, the nature of entering into mobile contracts, and the opportunity to obtain technical support through the business' Geek Squad service.
INTERNET OF THINGSDevelopments in mobile broadband technology such as 4G will continue to transform lives and current industry developments suggest that everyday objects will increasingly be connected to the internet, described as the ‘Internet of Things’. The 'Internet of Things' means that people can manage home security or heating, or domestic electronics such as TVs, fridges, home entertainment systems and washing machines, through their smartphones. This phenomenon will not only drive mobile data growth, but also machine-to-machine data growth. With smartphones at the heart of this evolution of consumer electronic devices, we believe that CPW is well placed to take advantage of this evolution.
Marketplace
5-10Xfaster data speeds, compared to 3G
3-5Xincrease in data usage by 4G users
98%coverage in the UK during 2015Source: Company estimates
GATHER: 50 EXAMPLES OF BUSINESS MODELS FROM THE FTSE 350
12. Carphone Warehouse Group

4 Strategic Report Annual Report and Accounts 2013 Catlin Group Limited
Strategic Report
A Clearly De�ned StrategyFour principal elements
Disciplined UnderwritingCatlin focuses on underwriting pro�t, not top-line growth. We reject business that does not meet minimum standards. We seek to maximise pro�ts during all phases of an underwriting cycle through superior portfolio management, technical excellence and maximum utilisation of our broad distribution capabilities. See page 14
Diversi�cationCatlin continues to develop a distinctive and ef�cient international structure. We operate underwriting hubs serving the world’s major insurance markets, whilst retaining a single set of core values that are the foundation for our actions and behaviour globally. We continually look for opportunities to diversify our risk portfolio, both by region and by class of business, to produce superior results over the long term.See page 24
Capital Preservation and FlexibilityCatlin believes that the preservation of capital is vital. We seek to enhance returns by balancing non-correlated classes with more volatile classes, which builds value over time. Risk transfer is strategically used to protect capital from the impact of extreme events. Investments are managed to produce good returns without undue risk. Our corporate structure allows capital to be allocated ef�ciently to areas of the business that present the best pro�t opportunities.See page 32
CultureThe Catlin Culture is built on �ve core values: transparency, teamwork, accountability, integrity and dignity. We seek to be a responsible partner to clients and brokers, and we strive to offer the best possible service, both when underwriting a policy and managing a claim. Our culture helps us attract and retain high-calibre employees. Furthermore, we recognise our responsibilities as a company, both to our employees and to the communities in which we operate.See page 44
Catlin’s ultimate goal is to build a business for the future to increase shareholder value. Our strategy is designed to allow us to realise that goal.
5Strategic ReportCatlin Group Limited Annual Report and Accounts 2013S
trategic Rep
ort
Outstanding people, processes and systems
Catlin values
Underwriting
Investm
ent m
anag
eme
nt
Claim
s management
LondonEuro
peCan
ada
Bermuda
US
Asi
a-P
aci�
c
Business Model
What we doUnderwritingCatlin underwrites a balanced portfolio of insurance and reinsurance. Underwriting strategy focuses on technical pricing, access to different types of business on a global basis and superior portfolio management.
Catlin strives to be the best technical underwriter in the marketplace and to combine that expertise with professional judgment acquired through experience. A key Catlin advantage is the use of consistent underwriting models and dedicated actuarial support embedded within our underwriting teams worldwide. See page 15
Claims managementCatlin recognises that the true value of an insurance company is demonstrated to clients only following a claim. We believe that the superior claims service we deliver to clients and brokers represents a distinct and important competitive advantage. See page 50
Investment managementCatlin invests US$9.2 billion in assets. Our investment goal is the creation of economic value, taking into account both the asset and liability sides of the balance sheet. We seek to achieve appropriate returns whilst minimising downside risk to capital.See page 42
How we do it betterOutstanding people, processes and systemsThe Catlin Culture helps attract and retain talented individuals. We align our employees’ interests with those of shareholders, linking reward with performance, particularly the creation of value. Our ongoing Strategic Transformation Programme is designed to deliver the processes, systems and data necessary to support a high-performance business.See pages 45 and 67
ValuesCatlin’s employees embrace the Group’s core values: transparency, accountability, teamwork, integrity and dignity. In addition, our values are the basis for an Enterprise Risk Management programme whose goal is to ensure the preservation of capital. See page 48
Catlin’s business model is designed to ensure that the Group’s strategy is effectively delivered for the bene�t of shareholders and that clients receive the best possible service.
Catlin’s business comprises three primary functions:
• Underwriting insurance and reinsurance
• Managing and paying claims
• Investing assets
Catlin’s goal is to produce outstanding results for both clients and shareholders by employing highly talented people and providing them with excellent systems and tools with which to work. The Catlin Culture (see page 44), which permeates the business, encourages high levels of service and aims to strengthen relationships with clients and the brokers which produce the majority of the Group’s business. A sophisticated risk management framework is embedded throughout the organisation.
GATHER: 50 EXAMPLES OF BUSINESS MODELS FROM THE FTSE 350
13. Catlin Group

12 | Coca Cola HBC 2 13 ntegrated Report
Generating, capturing and sustaining value
Our business model
PET, glass, aluminium, carton
Water, CO2, sweetener, juice,
concentrate
Bottles, cans, cartons
Coca-Cola HBC countries Sales people
Customers
Consumers
Consumer marketing with The Coca-Cola Company
Recycling and recovery Packaging compliance schemes
Community programmesSport and active lifestyles, youth
development, water stewardship, disaster relief
Outlets
Sales cars and vans
Cold drink equipment
Trade marketing and activation tools
Warehouses and distribution
centres
Owned and leased trucks
Product manufacture
Sparkling beverages, juice, water and other still beverages
Water, energy, fuel
Cash distribution to shareholders
Direct and indirect employment
Taxes and fees
Payments to suppliers
Skills and knowledge transfer
Community investment programmes
DISTRIBUTION SALES CUSTOMERS CONSUMERS COMMUNITYCAPITAL
Ingredients
Resources
BOTTLING OPERATIONSPackagingMaterials
PRODUCT PORTFOLIO BOTTLING AND DISTRIBUTIONVALUE CREATED
SALES & CUSTOMER RELATIONSHIPSVALUE ADDED
CONSUMERS & COMMUNITYVALUE SHARED
Financial capital
Human capital
Manufacturing capitalPlants, warehouses, distribution centres
Natural capitalWater, biodiversity, eco-system health
Intellectual capitalBrands, standards,processes, manufacturing, reputation
Shared and relationship capitalSuppliers, customers,government agencies, communities
Our business model is fundamental to our ability to create value and to build a sustainable competitive advantage
Overview | 13
PET, glass, aluminium, carton
Water, CO2, sweetener, juice,
concentrate
Bottles, cans, cartons
Coca-Cola HBC countries Sales people
Customers
Consumers
Consumer marketing with The Coca-Cola Company
Recycling and recovery Packaging compliance schemes
Community programmesSport and active lifestyles, youth
development, water stewardship, disaster relief
Outlets
Sales cars and vans
Cold drink equipment
Trade marketing and activation tools
Warehouses and distribution
centres
Owned and leased trucks
Product manufacture
Sparkling beverages, juice, water and other still beverages
Water, energy, fuel
Cash distribution to shareholders
Direct and indirect employment
Taxes and fees
Payments to suppliers
Skills and knowledge transfer
Community investment programmes
DISTRIBUTION SALES CUSTOMERS CONSUMERS COMMUNITYCAPITAL
Ingredients
Resources
BOTTLING OPERATIONSPackagingMaterials
PRODUCT PORTFOLIO BOTTLING AND DISTRIBUTIONVALUE CREATED
SALES & CUSTOMER RELATIONSHIPSVALUE ADDED
CONSUMERS & COMMUNITYVALUE SHARED
Financial capital
Human capital
Manufacturing capitalPlants, warehouses, distribution centres
Natural capitalWater, biodiversity, eco-system health
Intellectual capitalBrands, standards,processes, manufacturing, reputation
Shared and relationship capitalSuppliers, customers,government agencies, communities
GATHER: 50 EXAMPLES OF BUSINESS MODELS FROM THE FTSE 350
14. Coca-Cola HBC AG

10 CRH
CRH subsidiary companies employ approximately 76,000 people at over 3,400 locations around the world. The Group’s major businesses are in the developed markets of Europe and North America, and it has growing positions in certain developing economies in Asia.
A Balanced Portfolio
The portfolio is well balanced across products, geographies and sector end-uses and this concept lies at the core of CRH strategy.
CRH’s geographic balance means that it is able to take advantage of differing regional demand cycles. In 2013, Western Europe and North America contributed about 85% of earnings from Group operations (subsidiaries plus share of equity accounted investments), while operations in the developing economies in Central and Eastern Europe, South America and Asia contributed about 15%.
Sectoral and end-use balance reduces the effects of varying demand patterns across building and construction activity. Exposure in 2013 was broadly split 35% residential, 30% non-residential and 35% infrastructure, while the balance of new-build to RMI was 50:50.
Our Product Range
CRH’s business comprises Materials, Products and Distribution activities, which enable the Group to supply construction materials from initial site work, through the building phase, to fit-out and renewal of the built environment over time. In 2013, Materials activities generated 56% of Group EBITDA, while the Products segment delivered 25% and Distribution 19%.
CRH’s primary Materials businesses are vertically-integrated aggregates, cement, asphalt and readymixed concrete operations, which are backed by strategically-located, long-term reserves and used extensively in infrastructure applications.
The Group’s Products businesses make a range of materials for use primarily in residential and non-residential construction. They include a broad range of architectural and structural products, and also accessories to assist in the construction process.
CRH distributes building materials to general building contractors, specialist Sanitary, Heating and Plumbing (SHAP) contractors and Do-It-Yourself (DIY) customers in Europe, and to professional roofing/siding and interior products contractors in the United States. These businesses are well-positioned to service growing RMI demand in mature markets.
Further information on the scale, footprint and strategy for these businesses can be found in the Business Performance Review on pages 18 to 35.
How our Business Operates
CRH continuously improves its operations, develops its people and builds regional market leadership positions across an actively managed portfolio. CRH leverages the benefits of local market knowledge and experience with global scale and resources.
CRH expects strong management commitment to both the local operating company and to the CRH Group. Managers are supported from a Group centre which provides guidance, support and functional expertise in the areas of performance measurement, financial reporting, cash
Materials
Vertically-integrated primary materials businesses with strategically-located long-term reserves
Products
Range of architectural and structural products for use primarily in residential and non-residential applications
Distribution
Supply of building materials to general, specialist and Do-It-Yourself (DIY) customers in Europe and the US
Business Model
A portfolio that is balanced by geography, product and end-use across residential, non-residential and infrastructure sectors, with a good equilibrium between new-build and RMI segments
CRH Business Model
CRH 11
management, strategic planning, business development, talent management, governance, risk management and sustainability. This approach has attracted and retained exceptional management in the past and the Group has been strengthened by personnel with a range of skills including operational management, highly qualified business professionals and owner-entrepreneurs.
How we Manage our Finances
One of CRH’s guiding principles is a strong focus on cash generation, which gives it significant financial firepower for value-creating acquisitions and dividend payout. Strict capital discipline is a key characteristic of the Group, alongside good operational control and strong financial liquidity. The Group is committed to maintaining an investment grade credit rating. During 2013 CRH raised €1.5 billion in the eurobond market at record low coupons.
How we Generate Value
CRH’s approach to business has delivered industry-leading returns in the past and it is the Group’s intention to restore those returns and margins through the coming cycle.
At the core of CRH’s success is the pursuit of continuous improvement. The Group constantly challenges its businesses to do better and management recognises that continuous improvement requires a focus on measured performance, firm financial control, product and process innovation, and a rigorous approach to capital allocation.
CRH continues to invest and reinvest in its assets to improve the capacity, quality and efficiency of its operations. In addition, in a fragmented
industry, CRH has the opportunity to grow by acquiring small to mid-sized companies which complement the existing network. From time to time, it completes larger deals where it sees compelling value.
This strategic approach and sustainable business model for value creation has enabled CRH to deliver superior performance and growth through previous cycles. Following the current portfolio review, it is CRH’s intention to accelerate the dynamic allocation and reallocation of resources within the Group, so that the businesses with the most potential in the next cycle will receive the most investment in the future.
Measuring Performance
CRH believes that measurement fosters positive behaviour and performance. In keeping with our focus on measured performance across all our businesses, CRH continues to refine and develop appropriate financial and non-financial measures to communicate leading-practice benchmarks across the organisation.
In the following tables on pages 12 to 15, as part of CRH’s commitment to enhanced narrative reporting, the Board has set out the Key Performance Indicators (KPIs) that are used to measure the Group’s performance against its strategy. The KPIs are closely aligned to the strategic priorities set out on page 9. They are quantifiable measurements, which the Group has been working to for many years, although this is the first time they have been included in this form in the Annual Report. It is CRH’s intention to reproduce this table in subsequent reports, to enable investors to build up a longer-term view of how Group strategy is being successfully implemented.
Lean Centre
Providing guidance, support, functional expertise and control in the areas of performance measurement, financial reporting, cash management, strategic planning, business development, talent management, governance and compliance, risk management, health & safety and environment
Local Know-How
Experienced operational management with extensive local market knowledge responsible for delivering returns from our operations
Global Scale
The shared resources and strengths of an international Group of over €13 billion market capitalisation
Returns
A focus on measured performance and operational excellence
A rigorous approach to capital allocation
Growth
Value-creating acquisitions sourced, evaluated and integrated by experienced operational management
Investments to improve capacity, quality and efficiency of our operations
GATHER: 50 EXAMPLES OF BUSINESS MODELS FROM THE FTSE 350
15. CRH
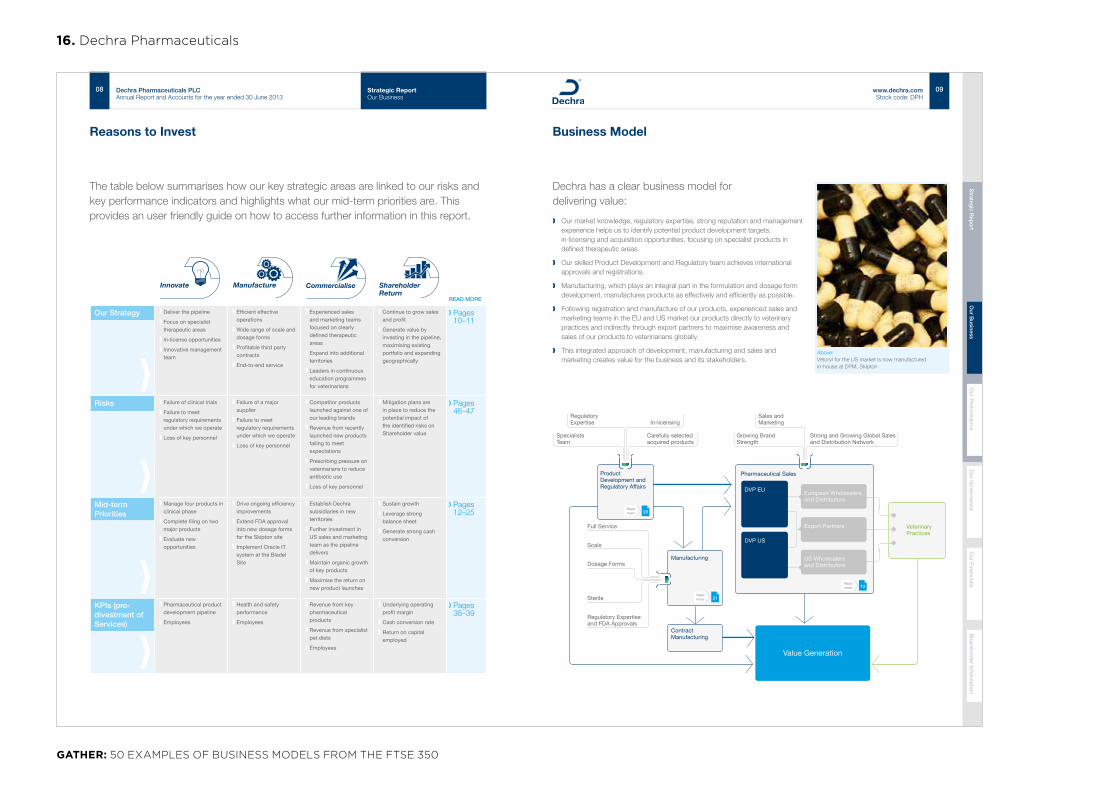
Reasons to Invest
The table below summarises how our key strategic areas are linked to our risks and key performance indicators and highlights what our mid-term priorities are. This provides an user friendly guide on how to access further information in this report.
Innovate Manufacture Commercialise ShareholderReturn
READ MORE
Our Strategy ❱ Deliver the pipeline
❱ Focus on specialist therapeutic areas
❱ In-license opportunities
❱ Innovative management team
❱ Efficient effective operations
❱ Wide range of scale and dosage forms
❱ Profitable third party contracts
❱ End-to-end service
❱ Experienced sales and marketing teams focused on clearly defined therapeutic areas
❱ Expand into additional territories
❱ Leaders in continuous education programmes for veterinarians
❱ Continue to grow sales and profit
❱ Generate value by investing in the pipeline, maximising existing portfolio and expanding geographically
❭ Pages 10–11
Risks ❱ Failure of clinical trials
❱ Failure to meet regulatory requirements under which we operate
❱ Loss of key personnel
❱ Failure of a major supplier
❱ Failure to meet regulatory requirements under which we operate
❱ Loss of key personnel
❱ Competitor products launched against one of our leading brands
❱ Revenue from recently launched new products failing to meet expectations
❱ Prescribing pressure on veterinarians to reduce antibiotic use
❱ Loss of key personnel
❱ Mitigation plans are in place to reduce the potential impact of the identified risks on Shareholder value
❭ Pages 46–47
Mid-term Priorities
❱ Manage four products in clinical phase
❱ Complete filing on two major products
❱ Evaluate new opportunities
❱ Drive ongoing efficiency improvements
❱ Extend FDA approval into new dosage forms for the Skipton site
❱ Implement Oracle IT system at the Bladel Site
❱ Establish Dechra subsidiaries in new territories
❱ Further investment in US sales and marketing team as the pipeline delivers
❱ Maintain organic growth of key products
❱ Maximise the return on new product launches
❱ Sustain growth
❱ Leverage strong balance sheet
❱ Generate strong cash conversion
❭ Pages 12–25
KPIs (pre-divestment of Services)
❱ Pharmaceutical product development pipeline
❱ Employees
❱ Health and safety performance
❱ Employees
❱ Revenue from key pharmaceutical products
❱ Revenue from specialist pet diets
❱ Employees
❱ Underlying operating profit margin
❱ Cash conversion rate
❱ Return on capital employed
❭ Pages 38–39
08 Dechra Pharmaceuticals PLCAnnual Report and Accounts for the year ended 30 June 2013
Strategic ReportOur Business
Specialists Team
Full Service
Scale
Dosage Forms
Sterile
Regulatory Expertise and FDA Approvals
Product Development and Regulatory Affairs
Veterinary Practices
Pharmaceutical Sales
Manufacturing
Value Generation
Regulatory Expertise
Carefully selected acquired products
In-licensing
Growing Brand Strength
Strong and Growing Global Sales and Distribution Network
Sales and Marketing
Contract
DVP EU European Wholesalers and Distributors
Export Partners
DVP US
US Wholesalers and Distributors
Readmore 23
Readmore 12
Readmore 21
Manufacturing
Dechra has a clear business model for delivering value:
❱ Our market knowledge, regulatory expertise, strong reputation and management experience helps us to identify potential product development targets, in-licensing and acquisition opportunities, focusing on specialist products in defined therapeutic areas.
❱ Our skilled Product Development and Regulatory team achieves international approvals and registrations.
❱ Manufacturing, which plays an integral part in the formulation and dosage form development, manufactures products as effectively and efficiently as possible.
❱ Following registration and manufacture of our products, experienced sales and marketing teams in the EU and US market our products directly to veterinary practices and indirectly through export partners to maximise awareness and sales of our products to veterinarians globally.
❱ This integrated approach of development, manufacturing and sales and marketing creates value for the business and its stakeholders.
Above:Vetoryl for the US market is now manufactured in-house at DPM, Skipton
Business Model
09www.dechra.comStock code: DPH
®
Our G
overnance
Our F
inancialsS
harehold
er Inform
ation
Our P
erform
anceO
ur Business
Strateg
ic Rep
ort
GATHER: 50 EXAMPLES OF BUSINESS MODELS FROM THE FTSE 350
16. Dechra Pharmaceuticals
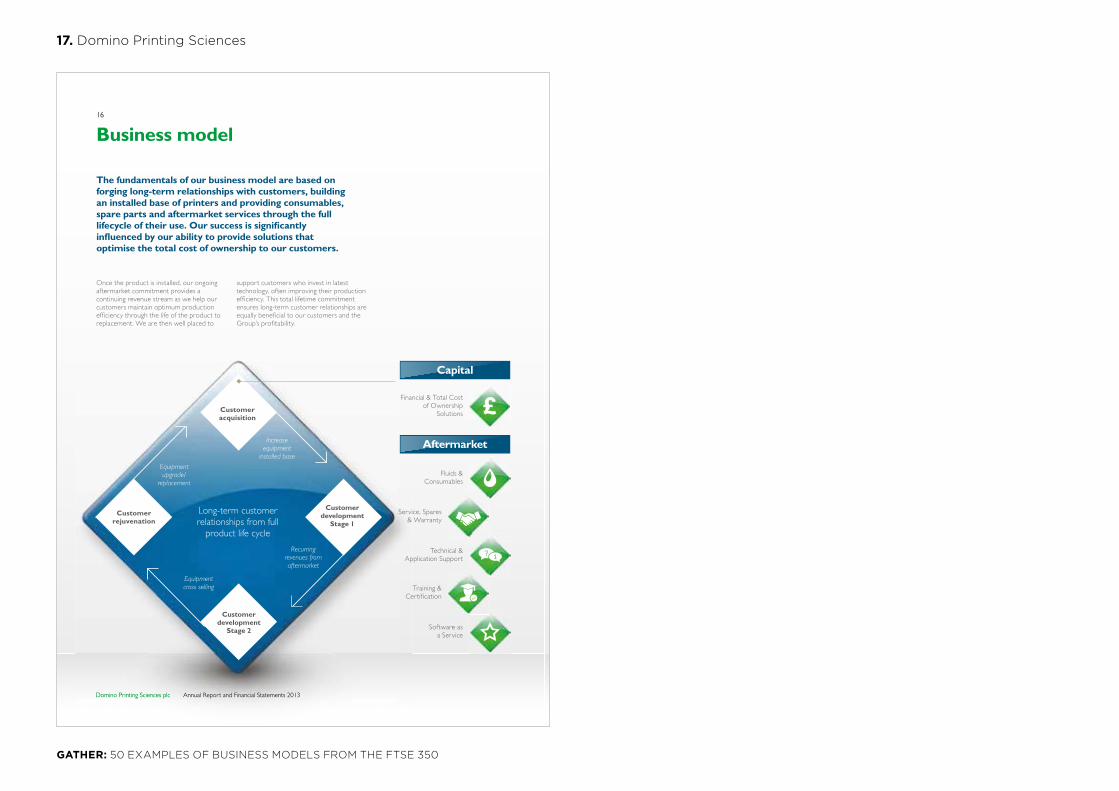
Domino Printing Sciences plc Annual Report and Financial Statements 2013
16
Domino Printing Sciences plc Annual Report and Financial Statements 2013
Long-term customer relationships from full
product life cycle
Customer acquisition
Customer development
Stage 2
Customer development
Stage 1
Customerrejuvenation
Financial & Total Cost of Ownership
Solutions
Service, Spares & Warranty
Training & Certi�cation
Fluids & Consumables
Technical & Application Support
Software as a Service
Business model
The fundamentals of our business model are based on forging long-term relationships with customers, building an installed base of printers and providing consumables, spare parts and aftermarket services through the full lifecycle of their use. Our success is signi�cantly in�uenced by our ability to provide solutions that optimise the total cost of ownership to our customers.
Once the product is installed, our ongoing aftermarket commitment provides a continuing revenue stream as we help our customers maintain optimum production ef�ciency through the life of the product to replacement. We are then well placed to
support customers who invest in latest technology, often improving their production ef�ciency. This total lifetime commitment ensures long-term customer relationships are equally bene�cial to our customers and the Group’s pro�tability.
Equipment upgrade/
replacement
Increase equipment
installed base
Recurring revenues from aftermarket
Equipment cross selling
Capital
Aftermarket
Job: 19734_DominoAR13_frt_AW Proof Read by:Operator: r o b : text amends only Proof: 05 Set-up: Kevin Date: 8 January 2014 1:43 PM First Read/Revisions
GATHER: 50 EXAMPLES OF BUSINESS MODELS FROM THE FTSE 350
17. Domino Printing Sciences

3www.easyJet.com
Strategic report
OUR VALUES
Our sustainable business model makes travel easy and affordable and drives growth and returns for shareholders.
SAFETY ONE TEAM PASSIONSIMPLICITY INTEGRITY PIONEERING
HOW WE DO ITOUR FIVE DRIVERS
COMPELLING NETWORK
We fly from the main airports in attractive catchment areas and have the biggest presence on Europe’s top 100 routes.
CAPITAL DISCIPLINE
We maintain a strong balance sheet so that we can withstand external shocks, such as airspace closure. We maximise the use of our aircraft and have a policy of returning excess cash to shareholders.
COST ADVANTAGE
We are able to provide low fares to our customers by maintaining a low cost base and by delivering operational excellence. We have low overhead costs, use our aircraft efficiently and have industry leading on-time performance.
CULTURE, PEOPLE AND PLATFORM
Our people are passionate and friendly. We strive for simple systems and processes.
CUSTOMER DEMAND, CONVERSION AND YIELDWe make it easy to buy our low fares through our website, which has over one million visits every day, and also through mobile devices. People are attracted to the well-known easyJet brand and service offering.
SAFETY UNDERPINS EVERYTHING WE DO
2 easyJet plc Annual report and accounts 2013
Canary Islands Egypt/Israel
Iceland
WHAT WE DOWE ARE A LOW-COST EUROPEAN POINT-TO-POINT SHORT-HAUL AIRLINE
We use our cost advantage and number 1 and number 2 network positions in strong markets to deliver point-to-point low fares and operational efficiency, with our people making the difference by offering friendly service for our customers.
How we Drive Growth and returns
Strategic report Our business model
WHERE WE DO ITINTRA-EUROPEAN SHORT-HAUL NETWORK
Network focused on primary airports serving significant inherent catchment areas.
217aircraft
633routes
60.8mpassengers
22bases
SAFETY UNDERPINS EVERYTHING WE DO
Airports to which easyJet fly
OUR AMBITION is to be Europe’s preferred short-haul airline, delivering market leading returns.
OUR CAUSE is to make travel easy and affordable.
GATHER: 50 EXAMPLES OF BUSINESS MODELS FROM THE FTSE 350
18. easyJet
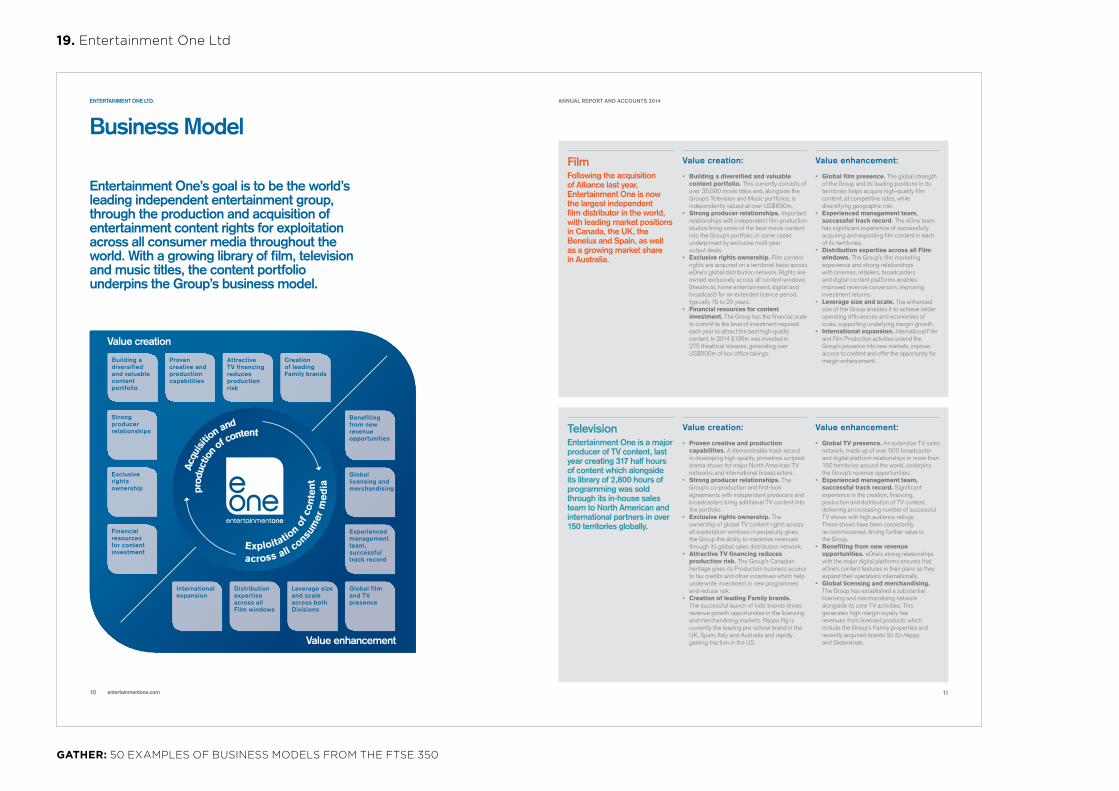
ENTERTAINMENT ONE LTD.
10 entertainmentone.com
Building a diversified and valuable content portfolio
Strong producer relationships
Exclusive rights ownership
Financial resources for content investment
Proven creative and production capabilities
Attractive TV financing reduces production risk
Creation of leading Family brands
International expansion
Distribution expertise across all Film windows
Leverage size and scale across both Divisions
Global film and TV presence
Experienced management team, successful track record
Global licensing and merchandising
Benefiting from new revenue opportunities
Value creation
Value enhancement
across all consu
mer
me
dia
Acq
uisit
ion and
Exploitation
of c
on
ten
t
prod
uctio
n of co
ntent
Business Model
Entertainment One’s goal is to be the world’s leading independent entertainment group, through the production and acquisition of entertainment content rights for exploitation across all consumer media throughout the world. With a growing library of film, television and music titles, the content portfolio underpins the Group’s business model.
ANNUAL REPORT AND ACCOUNTS 2014
11
FilmFollowing the acquisition of Alliance last year, Entertainment One is now the largest independent film distributor in the world, with leading market positions in Canada, the UK, the Benelux and Spain, as well as a growing market share in Australia.
Value creation:
• Building a diversified and valuable content portfolio. This currently consists of over 35,000 movie titles and, alongside the Group’s Television and Music portfolios, is independently valued at over US$650m.
• Strong producer relationships. Important relationships with independent film production studios bring some of the best movie content into the Group’s portfolio, in some cases underpinned by exclusive multi-year output deals.
• Exclusive rights ownership. Film content rights are acquired on a territorial basis across eOne’s global distribution network. Rights are owned exclusively across all content windows (theatrical, home entertainment, digital and broadcast) for an extended licence period, typically 15 to 25 years.
• Financial resources for content investment. The Group has the financial scale to commit to the level of investment required each year to attract the best high-quality content. In 2014 £195m was invested in 275 theatrical releases, generating over US$500m of box office takings.
Value enhancement:
• Global film presence. The global strength of the Group and its leading positions in its territories helps acquire high-quality film content, at competitive rates, while diversifying geographic risk.
• Experienced management team, successful track record. The eOne team has significant experience of successfully acquiring and exploiting film content in each of its territories.
• Distribution expertise across all Film windows. The Group’s film marketing experience and strong relationships with cinemas, retailers, broadcasters and digital content platforms enables improved revenue conversion, improving investment returns.
• Leverage size and scale. The enhanced size of the Group enables it to achieve better operating efficiencies and economies of scale, supporting underlying margin growth.
• International expansion. International Film and Film Production activities extend the Group’s presence into new markets, improve access to content and offer the opportunity for margin enhancement.
TelevisionEntertainment One is a major producer of TV content, last year creating 317 half hours of content which alongside its library of 2,800 hours of programming was sold through its in-house sales team to North American and international partners in over 150 territories globally.
Value creation:
• Proven creative and production capabilities. A demonstrable track record in developing high-quality, primetime scripted drama shows for major North American TV networks and international broadcasters.
• Strong producer relationships. The Group’s co-production and first-look agreements with independent producers and broadcasters bring additional TV content into the portfolio.
• Exclusive rights ownership. The ownership of global TV content rights across all exploitation windows in perpetuity gives the Group the ability to maximise revenues through its global sales distribution network.
• Attractive TV financing reduces production risk. The Group’s Canadian heritage gives its Production business access to tax credits and other incentives which help underwrite investment in new programmes and reduce risk.
• Creation of leading Family brands. The successful launch of kids’ brands drives revenue growth opportunities in the licensing and merchandising markets. Peppa Pig is currently the leading pre-school brand in the UK, Spain, Italy and Australia and rapidly gaining traction in the US.
Value enhancement:
• Global TV presence. An extensive TV sales network, made up of over 500 broadcaster and digital platform relationships in more than 150 territories around the world, underpins the Group’s revenue opportunities.
• Experienced management team, successful track record. Significant experience in the creation, financing, production and distribution of TV content, delivering an increasing number of successful TV shows with high audience ratings. These shows have been consistently re-commissioned, driving further value to the Group.
• Benefiting from new revenue opportunities. eOne’s strong relationships with the major digital platforms ensures that eOne’s content features in their plans as they expand their operations internationally.
• Global licensing and merchandising. The Group has established a substantial licensing and merchandising network alongside its core TV activities. This generates high margin royalty fee revenues from licensed products which include the Group’s Family properties and recently acquired brands So So Happy and Skelanimals.
GATHER: 50 EXAMPLES OF BUSINESS MODELS FROM THE FTSE 350
19. Entertainment One Ltd

13 Fenner PLC Annual Report 2013
Directors’ Report Business Review
Divisional Review
ENGINEERED CONVEYOR SOLUTIONSECS offers a unique, comprehensive suite of productsand services which serve the conveying needs of mining,power generation and bulk handling markets.
SERVICE
REPLACEMENTBELT
NEW CUSTOMER CAPACITY
Mine expansionsNew mines
Maintain / ManageInstall / ReplaceEmergency repairMonitor conveyor conditionDetect conveyor faults
£550m Revenue 67% of Fenner
64%
21%
15%
Worn outDamagedTypical belt life 3-5 years
£550m Revenue 67% of Fenner
42%
12%28%
18%2013
BULK MATERIALSSand, gravel, cementConstruction & infrastructure
METALLURGICAL COALUnderground miningPorts & coking plantsSteel production
OTHER MINERALSIron, copper oresHard rock open pit miningHighly abrasiveSteel & copper production
THERMAL COALUnderground miningPorts & power stations Electricity generation
Revenue analysis By markets served
ECS is one of the world’s leading heavyweight conveyor belting suppliers and has the mostcomprehensive range of belting products, services and packaged solutions
Demand for ECS products and services is primarily determined by the volume of material extracted
ECS products and services are critical to its customers’ businesses, although conveying representsonly a small proportion of total extraction costs
ECS manufacturing plants are well invested and are strategically located in mining regions with along-term future
Over the last five years, ECS has significantly increased revenue, operating profit and operatingmargin; during this period, some £196m has been invested in capital expenditure and acquisitions
Find out more about ECS and itsoperations at www.fenner.com
Summarised financial record
2009 2010 2011 2012 2013 Over period 1
Revenue (£m) 361.8 389.5 510.7 593.4 549.8 +11.0% 2
Underlying operating profit (£m) 30.8 40.5 61.1 84.4 63.0 +19.6% 2
Underlying operating margin 8.5% 10.4% 12.0% 14.2% 11.5% +3.0 pcp
Investment expenditure (£m) 3 65.2 18.7 32.6 42.0 37.6 196.1
1 The period relates to 2009 to 2013. 2 CAGR. 3 Total investment over period (net capital expenditure plus acquisition spend less disposal proceeds).
Revenue analysis Replacement belt and service (85%) against new customer capacity (15%)
14Fenner PLC Annual Report 2013
Overview
Business R
eviewG
overnanceR
emuneration
Corporate R
esponsibilityFinancial R
esults
ECS business model and value creation
ECS is a recognised leader in the globalconveying market, under the “Fenner”,“Fenner Dunlop” and “Dunlop” brand names.
ECS has developed a comprehensive range ofheavyweight belt products, including ply, solidwoven and steel cord, which it manufacturesin its plants around the world.
Alongside its traditional expertise in beltmanufacture, ECS has developed acomprehensive range of conveying services,including monitoring, maintenance, designand installation.
ECS offers commercial arrangements to itscustomers that vary from a purely
transactional relationship to a full strategicpartnership. Each type of product or servicewithin the ECS portfolio provides benefits butthe full value is only realised by the integratedoffer which is optimised to reduce thecustomer’s conveyor downtime and total costof ownership. Flexible solutions can also beadopted to respond to a customer’s marketconstraints.
Geographic coverage has also been key toECS’s development. ECS has particularstrengths in the USA and Australia anddeveloping positions in Chile, China, India andsouthern Africa. More recently, it hasestablished a presence in north Africa,
Mexico, the Middle East and sub-SaharanAfrica. These have offset revenue declinesfrom customers in more traditional areassuch as Europe.
ECS is continuing to broaden its productrange, service capabilities and locations tofurther improve its global offering of beltproducts and services. Service remains arelatively low proportion of revenue in certainregions, although this is expected to increaseover time.
Recent acquisitions have brought newcapabilities into ECS which are being rolledout across the division worldwide.
Examples of ECS products and services
A typical underground “finger splice” on amainline belt which transfers the coal fromthe coal face to the surface.
An overland steel cord belt where ECSpartnered with the customer on the designand selection of products for the wholeproject.
A sorting installation handling sand, graveland granite. These short belts on a morearduous application need our premier rangeof belting to give superior belt life.
IdlersCleaners
IdlersDrives
IdlersCleaners
IdlersCleaners
IdlersCleaners
Install
Maintain
Manage Belt
IdlersCleanersPulleys
DrivesStructure
Monitor
DetectIntegrate
Design
24/7Emergency
Serv
ices
Facilitie
s Components
Engineering
Diagnos
tics
GATHER: 50 EXAMPLES OF BUSINESS MODELS FROM THE FTSE 350
20. Fenner, ECS Division
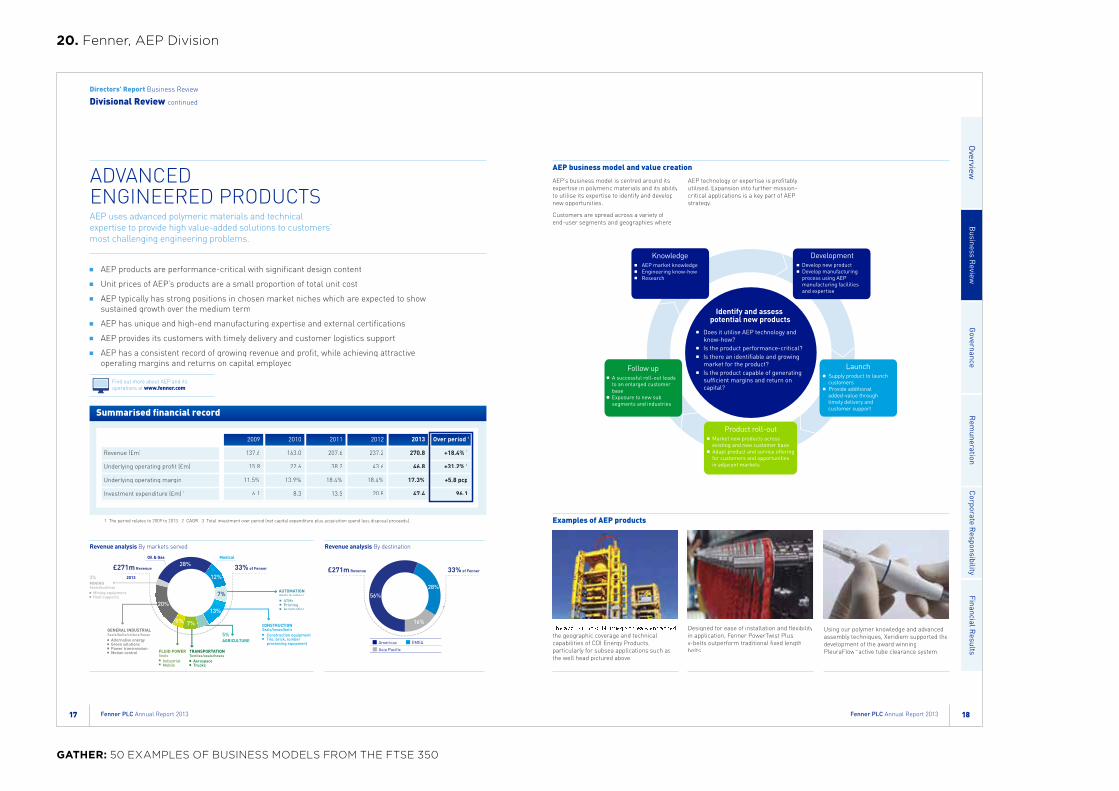
17 Fenner PLC Annual Report 2013
AEP products are performance-critical with significant design content
Unit prices of AEP’s products are a small proportion of total unit cost
AEP typically has strong positions in chosen market niches which are expected to showsustained growth over the medium term
AEP has unique and high-end manufacturing expertise and external certifications
AEP provides its customers with timely delivery and customer logistics support
AEP has a consistent record of growing revenue and profit, while achieving attractiveoperating margins and returns on capital employed
Find out more about AEP and itsoperations at www.fenner.com
ADVANCED ENGINEERED PRODUCTSAEP uses advanced polymeric materials and technicalexpertise to provide high value-added solutions to customers’most challenging engineering problems.
MINING
Mining equipmentRoof supports
Seals/bushings
3%
Oil & Gas
FLUID POWERSeals
IndustrialMobile
Textiles/seals/hosesAerospaceTrucks
TRANSPORTATION
ATMsPrintingAutomation
Belts & rollersAUTOMATION
Construction equipmentTile, brick, lumber processing equipment
Seals/hoses/beltsCONSTRUCTION
Medical
Alternative energyGreen solutionsPower transmissionMotion control
GENERAL INDUSTRIALSeals/belts/rollers/hoses
£271m Revenue 33% of Fenner28%
12%
7%
13%20%
AGRICULTURE5%
5% 7%
2013
56%
16%
28%
EMEAAmericas
Asia Pacific
£271m Revenue 33% of Fenner
Revenue analysis By markets served Revenue analysis By destination
Directors’ Report Business Review
Divisional Review continued
Summarised financial record
2009 2010 2011 2012 2013 Over period 1
Revenue (£m) 137.6 163.0 207.6 237.2 270.8 +18.4% 2
Underlying operating profit (£m) 15.8 22.6 38.2 43.6 46.8 +31.2% 2
Underlying operating margin 11.5% 13.9% 18.4% 18.4% 17.3% +5.8 pcp
Investment expenditure (£m) 3 6.1 8.3 13.5 20.8 47.4 96.1
1 The period relates to 2009 to 2013. 2 CAGR. 3 Total investment over period (net capital expenditure plus acquisition spend less disposal proceeds).
18Fenner PLC Annual Report 2013
Overview
Business R
eviewG
overnanceR
emuneration
Corporate R
esponsibilityFinancial R
esults
AEP business model and value creation
Examples of AEP products
The acquisition of Norwegian Seals enhancedthe geographic coverage and technicalcapabilities of CDI Energy Products,particularly for subsea applications such asthe well head pictured above.
Designed for ease of installation and flexibilityin application, Fenner PowerTwist Plusv-belts outperform traditional fixed lengthbelts.
Using our polymer knowledge and advancedassembly techniques, Xeridiem supported thedevelopment of the award winningPleuraFlowTM active tube clearance system.
AEP’s business model is centred around itsexpertise in polymeric materials and its abilityto utilise its expertise to identify and developnew opportunities.
Customers are spread across a variety ofend-user segments and geographies where
AEP technology or expertise is profitablyutilised. Expansion into further mission-critical applications is a key part of AEPstrategy.
Launch • Supply product to launch
customers • Provide additional
added-value through timely delivery and customer support
Development • Develop new product • Develop manufacturing
process using AEP manufacturing facilities and expertise
Product roll-out • Market new products across
existing and new customer base • Adapt product and service offering
for customers and opportunities in adjacent markets
Follow up • A successful roll-out leads
to an enlarged customer base
• Exposure to new sub segments and industries
Knowledge • AEP market knowledge• Engineering know-how• Research
Identify and assess potential new products
• Does it utilise AEP technology and know-how?
• Is the product performance-critical?• Is there an identifiable and growing
market for the product?• Is the product capable of generating
sufficient margins and return on capital?
GATHER: 50 EXAMPLES OF BUSINESS MODELS FROM THE FTSE 350
20. Fenner, AEP Division

Foreign & Colonial Investment Trust PLC6
Business ModelBusiness Model
Key relationships and responsibilities
The Company’s Board of Directors has appointed
F&C as Manager (the “Manager”) to deliver
investment per formance. F&C has overa l l
responsibility for the management of the Company’s
assets and for asset allocation, gearing, stock
and sector selection and risk, within limits set and
regularly monitored by the Board. The Manager has
the flexibility to use internal and external managers
to create a truly diversified global portfolio. The fee
payable to the Manager is based on the market
capitalisation of the Company, thus aligning the
Manager’s interests with shareholders through share
price performance.
Jeremy Tigue acts as Fund Manager (the “Fund
Manager”) to the Company, on behalf of F&C.
He is responsible and accountable for the entire
portfolio including the North America and private
equity portfolios, which are managed externally. He
will be succeeded by Paul Niven on 1 July 2014.
The ancillary functions of administration, secretarial,
accounting and marketing services are also carried
out by F&C.
The Company has no employees. Its wholly non-
executive Board comprise six male and two female
Directors and retains responsibility for corporate
strategy; corporate governance; risk and control
assessment; the overall investment and dividend
policies; setting l imits on gearing and asset
allocation; monitoring investment performance and
for approving marketing policy budgets.
Further information in relation to the Board
can be found on page 25. Information on the
individual Directors, all of whom are resident in
the UK, can be found on pages 14 and 15.
Remuneration information is set out on pages 29
to 31. Information on the fees payable under the
management agreement can be found on page 20
and in note 4 on the accounts.
Investment strategy
The Company typically remains fully invested in
equities. Its current strategic emphasis is towards
a global equity focus and therefore a much lower
weighting in the UK than in the past. It does not
restrict itself to specific geographic or industry sector
exposure limits for its publicly listed equities and
maintains the flexibility to invest in other types of
securities or assets. The high level of diversification
across the entire portfolio has in recent years resulted
in the tendency for the Company’s share price to
have lower volatility than its index benchmark.
0% 5% 10% 15% 20% 25%
Fixed Income
Utilities
Telecommunications
Basic Materials
Oil & Gas
Technology
Consumer Goods
Health Care
Consumer Services
Industrials
Private Equity
Financial
Source: F&C
23.8%
14.9%
12.4%
10.3%
8.7%
7.1%
7.0%
6.5%
4.3%
2.9%
1.5%
0.6%
Industrial Classification of Investment Portfolio as at 31 December 2013
In the case of the regional equity portfolios, the
Fund Manager has the flexibility to recommend to
the Board their delegation to external third party sub-
managers when this seems likely to result in better
investment performance. Two external sub-managers
have been appointed for the North America large and
mid-cap equity portfolios, namely Barrow Hanley and
T Rowe Price. Recommendations for private equity
and unlisted investments are subject to approval
Source: F&C
North America 29.1%
UK 21.9%
Europe ex UK 10.7%
Private Equity 14.9%
Global Income 6.2%
Global Funds 4.1%
Emerging Markets 8.4%
Japan 4.7%
Distribution of our portfolio as at 31 December 2013
Report and Accounts 2013 7
range of 0–20% of shareholders’ funds based on
valuing the Company’s debentures at market value.
We have created a very flexible structure to manage
borrowings over the next five years as explained by
the Fund Manager on page 8.
Buyback strategy
The Company has for many years bought back its
own shares for cancellation at a discount to net asset
value per share. This forms part of its wider strategy
under which the Board has the objective of achieving
a less volatile discount to net asset value, in normal
market conditions, of around 10% (with debt at
market value), as well as enhancing net asset value
per share for continuing shareholders.
Marketing strategy
The Manager continues to promote investment
in the Company’s shares, which are suitable for
retail distribution in the UK as well as professionally
advised private clients and institutional investors.
Promotion has traditionally been made through the
F&C Savings Plans, which remain a cost effective
and flexible way to invest in the Company.
The Company is well positioned to be a beneficiary
of the Retail Distribution Review and is beginning to
see a notable increase in the number of shares held
through investment platforms. The Board hopes to
see access to the Company’s shares on as many
platforms as possible as more and more investors turn
to the Direct-to-Consumer execution-only market.
The Board will continue to work closely with the
Manager to ensure optimal delivery of the Company’s
investment proposition through all available channels.
by the Board. The private equity funds of funds
portfolio is managed externally by Pantheon Ventures
Limited and HarbourVest Partners LLC. There are no
plans to make further commitments to private equity
investments until the Company’s exposure moves
nearer to its original strategic target of 10%.
An analysis of the entire portfolio on 31 December
2013 is contained in the Fund Manager’s Review.
The Company’s full list of its investments can be
viewed on the website. The twenty largest listed
equity holdings can be found on page 10, and the
ten largest private equity holdings are on page 11.
Responsible ownership
The Board’s primary responsibility is to ensure
that the Company’s portfolio is properly invested
and managed in accordance with the investment
objective. The Board supports the Manager in its
belief that good governance creates value. The
Manager takes a particular interest in corporate
governance and sustainable business practices,
which includes the integration of environmental,
social and governance issues into its investment
decisions. Information on the Company’s voting
policy can be found in the Directors’ Report on
page 18.
Investment policy
The Company’s Investment Policy Statement is set
out in detail on page 18.
Gearing strategy
Over many years the Company has used borrowings
to enhance its returns. The Board has set a gearing
GATHER: 50 EXAMPLES OF BUSINESS MODELS FROM THE FTSE 350
21. Foreign & Colonial Investment Trust

04 | Genus plc Annual Report 2013Genus global sales and operations
A WORLD-LEADING BUSINESS
GENUS AT A GLANCE
Genusplaysanimportantroleintheworld’sagriculturaleconomy.Ourproductsenableourcustomerstomeetthegrowingdemandforpork,beefandmilk,drivenbyurbanisationandrisingpopulationsandincomes,andtocopewithtighteninglimitsonthelandandwaterresourcesavailableforfoodproduction.
Genus’s Competitive Advantage
Ourcompetitiveedgecomesfromowningandcontrollingproprietarylinesofbreedinganimalsandusingbiotechnologytocontinuouslyimprovethem.Wecombinethisproductandscientificexcellencewithaglobalsupplychain,technicalservice,anddistributionandsalesnetwork,ensuringwecanmeetourcustomers’needsandhelpthemtomaximisetheirbenefitsfromourproducts.
Themajorityofourcompetitorsaretraditionalco-operatives,makingGenusuniqueasalistedcompany.Ourbusinessmodelandmulti-speciesapproachallowustocontinuallystrengthenandleverageourtechnologyplatformmorebroadly,therebydeliveringvaluetocustomersandshareholdersalike.
Oursuccesshasgivenusmarket-leadingpositions.Wehave25%oftheporcinemarket,morethandoubleournearestcompetitor,aswellas25%inbeefand %ofglobaldairysales.Wesellunderwell-knowntrademarks,‘ IC’forpigsand‘ABS’fordairyandbeefcattle,inmorethan70countriesworldwide.
What We DoGenusisaworldleaderinapplyingbiotechnologytoadvancethescienceofanimalbreedingandgeneticimprovement.Ourtechnologyisapplicabletoalllivestockspeciesandwecurrentlycommercialiseitinthedairy,beefandporksectors.
Todothis,webreedtheworld’sbestpigsandbulls,scientificallyselectinglivestockwhoseoffspringwillincreasevalueforfarmersandfoodproducersaroundtheworld,withtheultimategoalofmakingpork,beefandmilkmoreaffordable,betterqualityandsaferforconsumers.
Intheporcinemarket,weoffergeneticallysuperiorboarsandsowsthatproducehigh-qualityandefficientoffspring,withhighercarcassvalueanddesirablecharacteristicssuchasfeed-efficientgrowthorleanermeat.
Inthedairyandbeefmarkets,ourprimaryproductisbullsemen,whichweproducein-houseinfivelocationsworldwide.Artificialinseminationfromsemenstrawsproduceshigh-qualitycattle,enablingourcustomerstoimprovetheirherdsandtheirefficiency.
Our Visionioneeringanimalgenetic
improvementtohelpnourishthe world.
How We OperateWithheadquartersinBasingstoke,U ,Genuscompaniesoperatein30countriesonsixcontinents,withresearchlaboratorieslocatedinMadison,Wisconsin,USA.Wealsoselltocustomersinanother40countriesthroughdistributionchannels.
Genusoperatesthroughthreebusinessunits Genus ICservicesporcinecustomersin orthAmerica, atinAmericaandEurope GenusABSservicesdairyandbeefcustomersin orthAmerica, atinAmericaandEurope GenusAsiafocusesonthefast-growingAsianmarket,inboththeporcineandbovinesegments
Asharedresearchanddevelopmentfunctionsupportsouroperatingdivisions.
Genus plc Annual Report 2013 | 05
ST
RA
TE
GIC
RE
VIE
WC
OR
PO
RA
TE
GO
VE
RN
AN
CE
FIN
AN
CIA
LS
TAT
EM
EN
TS
Glo
bal L
eadership in Animal Genetic Improvement
ImprovementRobust Genetic
Improved productivity.Shareholder return.
DifferentiationRealised Product
Global Supply
Chain
Technical Support
Services
Key
Acc
ount
Man
agem
ent
Our Business Model
Robust Genetic ImprovementGeneratingrobustandcontinuousgeneticimprovementisattheheartofourbusinessmodel.Weareleveraginggenomicstoaccelerateourdeliveryofvaluablegeneticimprovements.
Inporcine,webaseourcoregeneticimprovementprogrammeintwonucleusfarms,inCanadaandtheUS.Wecombinequantitativescienceswithleading-edgebiotechnology,whileadoptinga‘discoverywithoutwalls’approachtoexternalgenes,wheretheycanaddtoourportfolioandmeetcustomerneeds.
Ourdairyandbeefproductdevelopmentcreateselitebullsfromarangeofprogeny-testingandyoung-sireprogrammes.Weareadaptingourgeneticselectionprogrammetofocusontraitsofhigheconomicimportancetoourcustomersandtogaingreatercontroloverthegenes.
Thesedevelopmentprogrammesaresupportedbyourresearchdivision,whichaimstodevelopproprietarytechnologiesinareassuchasgenderskewanddiseaseresistance,whichhelptoincrease
theaffordabilityandqualityofpork,beefandmilk.Weemploymorethan100scientistsandskilledtechnicians,andhaveatrackrecordofworkingsuccessfullyinpartnershipwithuniversities,consortiaandothers.
Realised Product DierentiationConsumersaroundtheworldhavedifferentpreferencesandourgeneticimprovementprogrammesdeliverawiderangeofproductsandservicestailoredtothem.Successfulproductdevelopmentthereforestartsfromourcustomers’perspective.Understandingtheirneedshelpsustodevelopoutstandinganddifferentiatedproductsandservices,andweaimtogetourproductstomarketquickly,sowecanrapidlytransferthebestgenestoourcustomers’systems.
Global Supply ChainInourporcinebusiness,weoutsourcemorethan95%ofourpigmultiplicationrequirementstothird-partyproducersorcustomers.Ournetworkofmultiplicationpartnersisasignificantstrength,allowingustomeetdemandforourgeneticswhilereducingourexposuretofarmingandcommodityrisk.
Indairyandbeef,GenusABSleveragesbothitsdistributionandsalesnetworksdirectlywithin-houseemployees,independentrepresentativesordistributors,toefficientlyreachourcustomersandbuildbrandloyalty.
Technical Support ServicesEnsuringourproductsmeetcustomers’expectationsiscritical,soexperiencedtechnicalserviceteamssupportourdistributionandsalesefforts.Theseteamsensuretheproductisrightandhelpourcustomerstoachievethebestresults.Thiscreatesawinningsituationforusandourcustomers,enhancingcustomerloyalty.
Wesupportourcustomerswithtechnicalservicesinimportantareassuchasnutrition,reproduction,healthmanagementandgenetics.Forexample,indairy,ourglobalGeneticManagementSystemhelpscustomersthroughsireselection,tocreatetheprogenythatwilldeveloptheirherdinthewaytheywish.OurReproductiveManagementSystemteamalsohelpscustomerstoimprovereproduction,acriticalcontributortotheirprofitability.Inporcine,weprovideperformancecomparisonsacrossourcustomers,sotheycanbenchmarktheiroperationalperformanceandtheimpactofgeneticsagainstindustrypeers.
Key Account ManagementInporcine,weareincreasinglyworkinginlong-termrelationshipswithourcustomers,undermulti-yearroyaltycontracts.Thisalignsourgoalswithourcustomers’keyperformancemetrics,astheypayGenusbasedontheperformanceandvaluewedeliver.Italsoreducesvolatilityinourresults,bymitigatingtheimpactofcyclicalpricereductionsorcostincreasesinpigproduction.In2013,74%ofporcinevolumeswereunderroyaltycontracts.
Inbovine,wesellthemajorityofoursemenonaperdosebasisanduseourserviceofferingstocreatelonger-lastingrelationships.Ourcustomersegmentationandfocusonaccountmanagementallowsustoincreasinglyfocusonthecustomerswhoplacethehighestvalueontheserelationships.
GATHER: 50 EXAMPLES OF BUSINESS MODELS FROM THE FTSE 350
22. GENUS

Model & Performance Goals
People at the Core
Vision & Strategy
Greencore Group plc Annual Report and Accounts 2013
8Business Review and Strategic Report
Strategy and Business Model
To be a fast growing international convenience food leaderTo drive and deepen food to go leadership supplemented by selected other attractive convenience food categories
To win in the UK and US markets now, and in time develop food to go propositions in other geographic markets
Performance Goals – Above market like for like revenue growth – Operating margins > 6% – Strong cashflows reducing leverage – Drive return on invested capital > 12%
Model – Focus on convenience foods categories that
capitalise on the favourable, long-term consumer and customer trends in the UK and the US
– Focus on private label and on building enduring customer partnerships
– Build market leading positions in the categories in which we operate
Business Excellence‘We strive to be best in class’ – Drive growth and
performance with our customers
– Operate as a Lean enterprise across the supply chain
– Manage resources in a disciplined manner and consistent with our strategy
– Business in control
Cost Effectiveness‘We have a cost culture aligned to our business model’ – A constant pipeline of clear
identifiable cost initiatives – Continually challenging the
status quo – Everyone treats resources as
if they were their own
Great & Safe Food‘Keeping the passion for food central to our culture’ – A culture centred around
great tasting food – Known externally to have
real food credentials as a business
– Continuously driving food technologies
Business Excellence‘Making Greencore a Great Place to Work’ – Live our company values – A place to develop your career – A fun place to work
– A healthy and safe place to work – A place where everyone’s contribution is recognised
9Greencore Group plc Annual Report and Accounts 2013
Revenue (£m)
2012
2013 1,197.1
1,161.9
+3.0%2012
2013 12.9%
11.9%
Return on Invested Capital
+100 bps
Key Performance IndicatorsThe Group uses a set of headline key performance indicators to measure the performance of its operations and of the Group as a whole.
Although the measures are separate, the relationship between all five is also monitored. In addition, other performance indicators are measured at individual business unit level.
Group Operating Margin
6.4%
Net Cash Inflow
£65.7m
Convenience Foods Operating Margin
6.5%
#01.
Sales GrowthGroup revenue increased by 3.0% in FY13.In our Convenience Foods business, the Group measures weekly sales growth. In FY13, revenue growth was 3.5%. A more accurate guide to underlying revenue performance is provided by like for like measures which exclude the impact of acquisitions or disposals in the year. In the UK in FY13, we recorded like for like revenue growth of 0.2% that is excluding both the International Cuisine Limited business for the period October to August and the Uniq Desserts activities, which were exited or sold. A reliable like for like revenue figure cannot be calculated for the US business due to the absence of reliable historic weekly data for acquired businesses.
In the Ingredients & Property division, we track monthly sales, although this is not the primary measure of performance for this division. In FY13, the division recorded a 5.3% decline in revenue on a constant currency basis.
#02.
Operating MarginThe Group’s operating margin in FY13 was 6.4% compared to 6.1% in FY12.In Convenience Foods, the operating margin was 6.5% compared to 6.3% in FY12. The division maintained tight financial and operating discipline throughout the year and delivered improvements in returns in several lower margin businesses. Operating margin is calculated using operating profit before exceptional items and amortisation of acquisition related intangibles divided by reported revenue.
#03.
Cash FlowNet cash inflow from operating activities was £65.7 million compared to £72.1 million in FY12 which benefitted from one-off working capital reductions in acquired businesses.
#04.
Return on Invested CapitalThe Group’s return on invested capital in FY13 was 12.9% (FY12: 11.9%). The return is calculated as net operating profit after tax (“NOPAT”) divided by average invested capital. NOPAT is calculated as operating profit, including share of associates, less tax at the effective rate in the Income Statement of 1% (4% in FY12). Invested capital is the sum of all current and non-current assets (including intangibles), less current and non-current liabilities with the exception of net debt items, derivatives and retirement benefit obligations. The average is calculated by adding together the invested capital from the opening and closing balance sheets and dividing by two.
#05.
Adjusted Earnings per ShareAdjusted earnings per share were 14.5 pence compared to 12.8 pence in FY12, an increase of 13.3%. Adjusted earnings per share is stated before exceptional items, pension finance items, acquisition related amortisation, FX on inter-company and certain external balances and the movement in the fair value of all derivative financial instruments and related debt adjustments. Note 10 to the Financial Statements provides the details of the calculation of adjusted earnings and the weighted average number of ordinary shares in issue.
GATHER: 50 EXAMPLES OF BUSINESS MODELS FROM THE FTSE 350
23. Greencore Group

HAYS PLC | ANNUAL REPORT & FINANCIAL STATEMENTS 201314
HAYS BUSINESS MODEL
�OUR MODELWHAT WE DOWe are focused on the specialist recruitment market
WHERE WE DO ITOur organisational structure is simple and is built around three regions globally
In the vast majority of our businesses, we operate a contingent fee model, with fees paid to us by our clients derived as a proportion of the salary of the candidate placed. In the permanent business, we recognise fees when the candidate starts work. For temporary placements, we earn fees while a candidate is active in an assignment.
Within this structure, our 5,037 consultants operate from 239 o�ces in 33 countries – an unrivalled footprint in specialist recruitment. Critically, we have market-leading positions in many of the most important markets in the world, including Australia, Germany and the UK. All of this means we understand our clients’ challenges locally, and have the ability to solve them globally.
£20K
£130K
OF GROUP NET FEES
OFFICES 48CONSULTANTS 1,024
For more detail see the Asia Pacific operating review on page 34
OF GROUP NET FEES
OFFICES 89CONSULTANTS 2,084
For more detail see the Continental Europe & RoW operating review on page 36
OF GROUP NET FEES
OFFICES 102CONSULTANTS 1,929
For more detail see the UK & Ireland operating review on page 38
SPECIALIST RECRUITMENT
ASIA PACIFIC
29% CON
TIN
ENTA
L EUROPE & REST OF WO
RLD40%
UNIT
ED KINGDOM & IRELAND
31%
HAYS FOCUS
CONTINGENT FEE MODELFOCUSED ON HIGHLY SKILLED ROLES
CLEAR STRUCTURAL GROWTH MARKETS
GENERALIST RECRUITMENT
EXECUTIVE SEARCH
IND
ICA
TIV
E SA
LAR
Y R
AN
GE
OF
HA
YS
PLA
CEM
ENTS
STRATEGYOVERVIEW PERFORMANCE GOVERNANCE FINANCIAL STATEMENTS SHAREHOLDER INFORMATION 15
A BALANCED, DIVERSE OFFERINGWhat makes Hays unique in the world of specialist recruitment is the diversity of our business model
The breadth of our expertise by contract type, geography and specialism positions us well to withstand various stages of the macroeconomic cycle and best serve our clients around the world, regardless of the challenges they face.
HOW OUR BUSINESS CREATES VALUE We have market-leading positions in some of the most attractive structural growth markets in the world of specialist recruitment
Our diverse business mix provides relative sustainability to revenues through the economic cycle, and o�ers clients the broad range of services they need
Our global footprint allows us to connect clients with candidates wherever they are in the world
WHAT DRIVES GROWTH?The global specialist recruitment market is driven primarily by business and candidate confidence
We call this ‘job churn’. In addition, we identify four further factors currently driving fee growth: the emergence of structural growth markets; the macroeconomic cycle; skills shortages; and the globalisation of the flow of labour.
59% 41%
TEMPORARY PLACEMENTS PERMANENT PLACEMENTS
84% 16%
PRIVATE SECTOR PUBLIC SECTOR
25%
ACCOUNTANCY & FINANCE
25%
IT & ENGINEERING
15%
CONSTRUCTION& PROPERTY
35%
OTHER
15% 85%
TOP 40 CLIENTS OTHER CLIENTS(CIRCA 30,000)
STRUCTURAL GROWTH MARKETS
MACRO-ECONOMIC
CYCLE
JOB CHURN
SKILLS SHORTAGES
GLOBALISATION OF THE FLOW OF LABOUR
GATHER: 50 EXAMPLES OF BUSINESS MODELS FROM THE FTSE 350
24. HAYS

HAYS PLC | ANNUAL REPORT & FINANCIAL STATEMENTS 201316
WHY OUR MO
A BUSINESS MODEL FOR A COMPLEX WORLD BALANCED MIX OF TEMPORARY, CONTRACTOR AND PERMANENT BUSINESS
Note: Relative width of bar represents proportion of Group net fees in 2013.
Our Group net fees are split 59% temp, 41% perm. Within this, however, we have three major temp and contractor businesses in the UK & Ireland, Australia & New Zealand and Germany. Elsewhere, our fees are c.85% perm, and in the majority of markets they are 100% perm. Although this adds a degree more cyclicality to the performance of these businesses, it also means that they are highly geared to improvements in economic conditions. A key strategic priority is to continue to build a balanced business in all markets supportive of a meaningful temp or contractor o�ering.
ASIA REST OF CE&RoW UK & IRELAND AUSTRALIA & NEW ZEALAND GERMANY
90%
10%
65%
35%
61%
39%
24%
76%
11%
0% GROUP NET FEES 100%
89%
Temp Perm
BUSINESS MODEL IN ACTION
STRATEGYOVERVIEW PERFORMANCE GOVERNANCE FINANCIAL STATEMENTS SHAREHOLDER INFORMATION 17
DEL WORKS
A BUSINESS MODEL FOR A COMPLEX WORLD BALANCED EXPOSURE TO STRUCTURAL GROWTH AND MATURE MARKETS
ESTABLISHED MARKETS>70% penetration(1)
31% of Group fees(2)
1% net fee decrease in 2013(3)
EMBRYONIC MARKETS0 – 10% penetration(1)
6% of Group fees(2)
+10% net fee growth in 2013(3)
Note: USA is considered an established market, but excluded for business size reasons.(1) Market penetration is defined as the % of skilled and professional recruitment that is outsourced, based on Hays Management estimates.(2) Percentage in the chart shows the percentage of Group net fees in 2013.(3) LFL (like-for-like) growth represents organic growth of continuing activities at constant currency.
DEVELOPING MARKETS30 – 70% penetration(1)
33% of Group fees(2)
-11% net fee decrease in 2013(3)
EMERGING MARKETS10 – 30% penetration(1)
30% of Group fees(2)
+10% net fee growth in 2013(3)
In most countries, the vast majority of professional recruitment is still done in-house with minimal outsourcing to agencies, even in developed economies such as Germany or Japan. We have very deliberately built a business model that provides us with a balanced exposure to these high structural growth markets, as well as in more mature markets such as the UK and the USA.
GERMANY
AUSTRALIA &NEW ZEALAND
UK & IRELAND
FRANCE, NETHERLANDS,CANADA
31%
25%
21%
8%
OTHER CE&RoW8%
HONG KONG,SINGAPORE1%
LATIN AMERICA,RUSSIA, INDIA3%
JAPAN, CHINA,MALAYSIA3%
GATHER: 50 EXAMPLES OF BUSINESS MODELS FROM THE FTSE 350
24. HAYS (continued)

4 Home Retail GroupAnnual Report 2014
Our business model
We aim to provide outstanding value and convenience for our customers through the operation of our two retail brands; Argos and Homebase. Customers are at the heart of our business, with over 180m transactions during the year. We use the insight that our many customers provide to add value to our business model.
advantage of developments in technology that have brought about a fundamental and permanent shift in the way our customers shop. Our successful internet and mobile channels help make us a market leader in multi-channel retailing. This is supported with a national network of over 1,000 stores which provides customers with local pick-up points, giving us both digital leadership and local presence which we believe gives us a signifi cant competitive advantage over our pure-play internet competitors.signifi cant competitive advantage over our pure-play internet competitors.signifi
ColleaguesOur ability to deliver our business model is underpinned by our 47,000 dedicated colleagues who serve our customers every day and we are committed to their ongoing training and development.
Financial ServicesBoth Argos and Homebase are supported by an in-house fi nancial Both Argos and Homebase are supported by an in-house fi nancial Both Argos and Homebase are supported by an in-house fiservices offer, which provides a range of credit products for our customers.
Financial strengthThe Group has strong operational cash-generating characteristics and is in a strong fi nancial position, with £331m of cash. This supports our strategy a strong fi nancial position, with £331m of cash. This supports our strategy a strong fifor growth.
Retail brandsWe are one of the UK’s leading home and general merchandise retailers, bringing together two of the UK’s most recognisable retail brands – Argos and Homebase.
Sourcing and infrastructure We source our products both locally and globally. The scale of the combined sourcing synergy of Argos and Homebase allows us to offer great choice and value to our customers. We have a strong supply chain which, together with our logistics infrastructure, enables us to provide products for our customers for either store pick-up or home delivery.
ProductsWe offer a comprehensive range of over 80,000 products across home and general merchandise. We support our offer of well-known product brands with a portfolio of own and exclusive brands such as Habitat, Bush, Alba, Chad Valley and Odina.
Multi-channel retailerWe are a multi-channel retailer in that we offer our customers a number of convenient ways in which they can purchase their products. We are taking
Outstanding valueand conveniencefor our customers
Retail brands
Financialstrength
Sourcing andinfrastructure
FinancialServices
Products
Colleagues Multi-channelretailer
5Home Retail GroupAnnual Report 2014
FINANCIALSTATEMENTSSTRATEGIC REPORT GOVERNANCE
ADDITIONALINFORMATION
Our strategyIn Homebase this means:Enhanced products and brands
Create clear points of customer differentiation and competitive advantageDevelop and extend the reach of both exclusive and own brandsShowcase product displays to help our customers with ideas and inspirationExpert service and advice both in-store and online
Digital leadership and accelerating multi-channelWe are taking advantage of developments in technology that have brought about a fundamental and permanent shift in the way customers shop. Increasingly customers choose to shop online or on the move through mobile devices, principally for pick-up in a local store but also for home delivery. This multi-channel experience is core to what we do and is the reason we have an ongoing focus on developing our successful internet and mobile commerce channels to meet this customer demand. We will prioritise future investment to these multi-channel capabilities to satisfy customers in whichever way they want to interact and shop with us. We will continue to support this with the convenience of immediate product collection via our national store network.
For Argos and Homebase this means:Create world-class digital customer experiencesInvestment in platforms to drive online sales growthExploit the strategic advantage of having effi cient collection points Exploit the strategic advantage of having effi cient collection points Exploit the strategic advantage of having effiin local marketsInnovation of store experienceShift the paper catalogue in Argos to a supporting role in the digital offer, and develop a market-leading digital catalogueDevelop large-scale customer data collection, insight and personalisation capabilitiesCreate engaging experiences online and in-storeExpand customer reach and build loyalty
Financial ServicesBoth Argos and Homebase are supported by an in-house fi nancial services Both Argos and Homebase are supported by an in-house fi nancial services Both Argos and Homebase are supported by an in-house fioffer. Our Financial Services business offers a range of credit products which make it easy for our customers to buy the products they want, when they want.
Cost managementWe have a strong track record of delivering signifi cant organisational and We have a strong track record of delivering signifi cant organisational and We have a strong track record of delivering signifiinfrastructure changes which improve the fl exibility of our businesses infrastructure changes which improve the fl exibility of our businesses infrastructure changes which improve the fland reduce costs, while maintaining or improving our operational standards. This means we will maintain a lean and fl exible cost base through:This means we will maintain a lean and fl exible cost base through:This means we will maintain a lean and fl
Ongoing cost-reduction programmes Continuing to re-shape the store estate
Financial strengthThe Group has strong operational cash fl ow characteristics and it has The Group has strong operational cash fl ow characteristics and it has The Group has strong operational cash fl£331m of net cash as at 1 March 2014. In addition, we have a £165m committed borrowing facility which is undrawn and which expires in March 2016. This fi nancial strength will enable us to deliver on the March 2016. This fi nancial strength will enable us to deliver on the March 2016. This fiinvestment plans incorporated in both the Argos Transformation plan and the Homebase Renewal plan.
You can read more about our progress in all areas of the Argos and Homebase strategies in the respective business reviews on pages 12 to 19. There are areas of risk and uncertainty associated with our strategy that you can read about in the principal risk and uncertainties section on pages 24 and 25.
Home Retail Group operates with a clear scale advantage, derived from a well-invested infrastructure which has been built up over a period of many years. Our strategy has been developed with the intention of creating long-term value for our stakeholders by delivering sustainable growth in our retail brands.
Our vision is to build successful businesses that bring outstanding value and convenience to our customers, whether shopping at home or on the move. Each of our retail brands has its own clear strategic plans to achieve this vision. In October 2012 we outlined the fi ve-year strategic achieve this vision. In October 2012 we outlined the fi ve-year strategic achieve this vision. In October 2012 we outlined the fi‘Transformation plan’ to reinvent Argos as a digital retail leader. The Homebase ‘Renewal plan’ is a strategy designed to position the business as a clearly differentiated multi-channel home enhancement retailer.
Our Group strategy is focused on the following pillars, which support both our vision and each of the operating businesses’ strategies.
Compelling customer offerWe are committed to utilising our scale advantage to source products for our customers, enabling us to offer them a broad choice of products at competitive prices. Our logistics network is based on a well-developed infrastructure that allows us to continue to focus on improving the speed at which products can be both sourced and delivered to our customers, through whichever channel they choose to shop with us.
In Argos this means:More choice available faster
Leverage the existing store network and replenishment routesIntroduce market-leading fulfi lment options to complement the Introduce market-leading fulfi lment options to complement the Introduce market-leading fulfiimmediacy of in-store collectionProvide high levels of availability to our customers
Reposition channels for a digital futureInnovation of the store experience, including fast-track collection and web-based browsers
In Homebase this means:Store investment programme
Rollout of a radically different store format, providing clear competitive differentiationSpace reconfi gurationSpace reconfi gurationSpace reconfiIntroduction of mini Habitat store-in-storeIntroduction of unique decorating centres
Increase fulfi lment choice and speedIncrease fulfi lment choice and speedIncrease fulfiOffer named or next day delivery proposition on a wide range of products
Product leadership and exclusive brandsWe use the strength of our retail brands to drive leadership in our core markets through expanding our product ranges. With over 80,000 products across Argos and Homebase, we are always looking for opportunities to offer new products and services.
In Argos this means:Universal customer appeal
Extend ranges to build both authority and choiceEnsure competitive pricing and valueReposition brand and customer experiences for universal appealStrengthen exclusive brand offer through fewer, cross-category own brandsEnhance product quality and design to meet the needs of new customer segments
GATHER: 50 EXAMPLES OF BUSINESS MODELS FROM THE FTSE 350
25. Home Retail Group

OUR STRATEGY AND BUSINESS MODEL
• Valves
• Actuators
• Controllers and positioners
• Climate change
• Resource scarcity
• Urbanisation
• Ageing population
• Market leadership in global niches
• Blue chip clients supported by world-class Key Account Management
• Customised solutions delivered through Engineering Advantage
• Extensive aftermarket
STRATEGY
FLUID TECHNOLOGIES
NICHE LEADERSHIP
GROWTH DRIVERS
NICHE LEADERSHIP
GROWTH DRIVERS
FLUID TECHNOLOGIES
For over forty years we have been at the forefront of flow control technology. We combine technical expertise, application know-how and innovative custom designed products to deliver value and competitive advantage for our customers. Our highly engineered products provide precise and reliable control of fluids and gases, often in critical applications.
IMI is focused on developing clear leadership positions in a number of well-defined global market niches which have good exposure to the key global trends that are driving growth. We invest considerable time and energy working closely with industry and sector leading customers, develop deep knowledge of the markets they serve and the challenges they face.
Environmental and demographic trends are shaping our future and driving growth. These trends are increasing demand for sophisticated engineering systems to help respond to the challenges presented by global trends, namely climate change, resource scarcity, urbanisation and an ageing population.
We are focused on delivering long-term profitable growth. We plan to achieve this by deploying our market-leading fluid control expertise in attractive industrial markets where we have or can aspire to leadership positions and where there is long-term demand for our solutions driven by sustainable global trends.
We believe that responsible business impacts positively on profitability, returns to shareholders, reputation and growth. Our internal standards demand sound management of our responsible business agenda and aim to integrate this thinking within all aspects of our business.
22 IMI plc
Organisationalstructure
How we generaterevenue
Growthstrategies
Purpose and values
MAN
UFAC
TURE & SELL (CROSS-SELL) ?? PRODUCTS LOREM
IPSUM
Man
ufac
turin
g and se
lling innovative products and services world-wide
THE IMI WAY
Capturing aftermarket opportunities for spares, support a
nd se
rvic
e
THE IMI WAY
DRIV
ING
OPER
ATIO
NAL EXCELLENCE INVESTING FOR THE FUTURE
WORKING TOGETHER AS ONE IMI GETTING CLOSER
TO C
USTO
MER
S
Flui
d P
ower
D
ivisio
n Indoor Climate D
ivision
Severe Service Division
BUSINESS MODEL
DRIVING OPERATIONALEXCELLENCE
INVESTING FOR THE FUTURE
WORKING TOGETHERAS ‘ONE IMI’
GETTING CLOSERTO CUSTOMERS
1 33 4222Efficient processes help drive down costs, protect profits and deliver competitive best-in-class engineering solutions for customers.
The Group’s focused portfolio of flow control businesses together with the excellent shape of the Group’s balance sheet provide the headroom to support our ambitions for growth, both by reinvesting in the existing businesses and by acquiring strategically complementary businesses elsewhere.
Realising the Group’s existing potential through improved collaboration, the pooling of technical and management expertise and the exploitation of synergies and economies of scale will create substantial opportunity for future growth.
Through our engineering expertise and dynamic customer-focused organisation we add tangible value to our customers’ operations.
Business ReviewPerform
ance ReviewCorporate Governance
Financial Statements
Group Overview
Annual Report and Accounts 2013 23
Business Review
GATHER: 50 EXAMPLES OF BUSINESS MODELS FROM THE FTSE 350
26. IMI

Managed and franchised model
Our business model is focused on franchising and managing hotels, rather than owning them, enabling us to grow at an accelerated pace with limited capital investment. Currently, 88 per cent of our Group operating profit (before regional and central overheads and exceptional items) is derived from franchised and managed operations. This business model allows us to focus on building preferred brands based on guests’ needs, and on strong delivery systems, such as our branded hotel websites and call centres. Our model allows us to create greater returns for owners whilst leaving asset management and real estate to our local third-party owners with the necessary expertise.
We adapt this business model by market as necessary, for example, in some markets we have in place managed leases to allow our business to grow. Managed leases are properties structured for legal reasons as operating leases but with the same characteristics as management contracts. In other markets we choose partnerships and joint ventures where appropriate.
A key characteristic of the franchised and managed business model is that it is highly cash generative, with a high return on capital employed. The asset-light approach means IHG benefits from the reduced volatility of fee-based income streams, as compared with the ownership of assets, resulting in a high-quality income stream. It enables us to focus on growing our fee revenues (Group revenue excluding owned and leased hotels, managed leases and significant liquidated damages) and fee margins (operating profit as a percentage of revenue, excluding revenue and operating profit from owned and leased hotels, managed leases and significant liquidated damages).
Dependent upon the market maturity, owner preference and, in certain cases, on the particular brand, hotels can be franchised or managed. For example, in the US, a mature market, IHG operates a largely franchised business, working together with our owners to deliver preferred brands. In contrast, in Greater China, IHG operates a predominantly managed business where IHG is responsible for operating the hotel on behalf of its owners.
Fee revenues and Fee margins are KPIs – see pages 38 and 39.
Capital expenditure
In some situations, IHG supports its brands by using its capital to build or support the funding of flagship assets in high-demand locations in order to drive growth. We plan to recycle capital by selling these assets when the time is right and to reinvest elsewhere in the business and across our portfolio.
We have committed up to $150 million to assist with the launch of our EVEN Hotels brand to demonstrate the success and economics of the brand. In 2013, IHG acquired three existing hotels which are being converted to EVEN Hotels, the first of which are due to open in 2014. In the future, we would look to recycle this capital, just as we previously did for both the Staybridge Suites and Hotel Indigo brands.
Asset disposals
As part of our asset-light approach, in May 2013, we disposed of our leasehold interest in InterContinental London Park Lane for gross cash proceeds of £301.5 million ($469 million). IHG secured a 30-year management contract on the hotel, with three 10-year extension options at IHG’s discretion, giving an expected contract length of 60 years.
In December 2013, we announced our agreement to dispose of 80 per cent of our interest in the InterContinental New York Barclay for $240 million and retain the remaining 20 per cent in a joint venture with a total circa $175 million refurbishment. Under the agreement, IHG will secure a 30-year management contract on the hotel, with two 10-year extension options at IHG’s discretion, giving an expected contract length of 50 years.
In February 2014, the Group signed an agreement to sell the InterContinental Mark Hopkins San Francisco for $120 million in cash and enter into a long-term management contract on the hotel.
Our breakdown by managed, franchised, owned and leased hotels for each region is set out on pages 40 to 50.
As at 31 December 2013: Brand ownership
Marketing and distribution
Employees
Hotel ownership
IHG capitalintensity
IHG income
FranchisedWe operate 3,977 hotels under franchise agreements (84.67%)
IHG IHG Third-party Third-party LowFee % of rooms
revenue
ManagedWe manage 711 hotels (15.14%) IHG IHG IHG &
Third-party* Third-party LowFee % of total revenue plus
% of profit
Owned and leasedWe own and lease 9 hotels (less than 1%)
IHG IHG IHG IHG HighAll revenues and profits
*IHG often employs the General Manager only.
The System FundIn addition to management or franchise fees, hotels within the IHG System pay assessments and contributions which are collected by IHG for specific use within the System Fund. The System Fund also receives proceeds from the sale of IHG Rewards Club points (see page 50 for further information).
The System Fund is managed by IHG for the benefit of hotels in the IHG System with the objective of driving revenues for the hotels. Total income for the System Fund in 2013 was $1.35 billion (2012: $1.25 billion) and these funds are used to pay for marketing, the IHG Rewards Club loyalty programme and the global reservation system. The System Fund is planned to operate at break even and does not result in a profit or loss for IHG.
Our business model
16 IHG Annual Report and Form 20-F 2013
Our business model
InterContinental® Hotels & Resorts
Our international luxury brand is located in most of the world’s key cities and many resort destinations across more than 60 countries worldwide. The brand’s ethos is to provide insightful, meaningful experiences that enhance our guests’ feeling that they are in a global club.
HUALUXE® Hotels and Resorts
Launched in March 2012 as the first luxury international hotel brand where every element has been designed specifically to suit the tastes and sensibilities of the Chinese guest. It focuses on the unique aspects of Chinese etiquette, the importance of rejuvenation, status recognition, local customs and heritage.
Crowne Plaza® Hotels & Resorts
The brand supports career-focused travellers, putting them in control of their travel experience so they can be on top of their work and at the top of their game.
Our portfolio of complementary and differentiated brands consistently deliver on guests’ needs.
Information on how we deliver our preferred brands is set out on page 20.
Holiday Inn Resort®
Offers leisure guests fun and relaxation in some of the world’s best holiday destinations, with the peace of mind of a trusted brand name.
Holiday Inn Club Vacations®
Formed as IHG’s timeshare brand as part of a strategic alliance with the family of Orange Lake Resorts under an exclusive licensing and marketing agreement. The portfolio is a collection of resorts in the US, offering spacious villa accommodation for families in great vacation destinations.
Holiday Inn Express®
Aimed at smart business or leisure travellers who appreciate value without compromising on efficiency and style.
Hotel Indigo®
IHG’s boutique brand, artfully combines the modern design and intimate service associated with a boutique hotel with the peace of mind and ease of staying with one of the world’s largest branded hotel companies. Each Hotel Indigo hotel reflects the local culture, character and history of the surrounding area.
Staybridge Suites®
IHG’s extended-stay brand for business and leisure travellers who are spending an extended time away from home and prefer a warm, home-like and community environment.
EVEN™ Hotels & Resorts
Launched in February 2012, the brand was created to meet the large and growing demand for a hotel brand to help wellness-minded travellers maintain their balance on the road.
Candlewood Suites®
IHG’s extended-stay brand in North America aimed at providing guests with a relaxed, casual and home-like environment at a great value.
178 hotels open
51 hotels in the pipeline
38 hotels open
14 hotels in the pipeline
21 hotels in the pipeline
391 hotels open
94 hotels in the pipeline
55 hotels open
51 hotels in the pipeline
5 hotels in the pipeline
10 properties open
1 property in the pipeline
2,258 hotels open
473 hotels in the pipeline
196 hotels open
80 hotels in the pipeline
312 hotels open
80 hotels in the pipeline
Holiday Inn® Hotels & Resorts
Offers the perfect mix of business and pleasure for today’s comfort-seeking traveller by providing an inviting, familiar atmosphere where guests can relax and enjoy themselves.
1,168 hotels open
249 hotels in the pipeline
Strategic Report 17
OVER
VIEW
STRATEG
IC REP
OR
TG
OVER
NAN
CE
GR
OU
P FIN
ANC
IAL STATEMEN
TSPAR
ENT C
OM
PANY
FINAN
CIAL STATEM
ENTS
ADD
ITION
AL INFO
RM
ATION
Our preferred brands
GATHER: 50 EXAMPLES OF BUSINESS MODELS FROM THE FTSE 350
27. InterContinental Hotels Group

23043-04 10-12-2013 Proof 1
ITV StrategyOur vision remains to create world-class content which we can make famous on our channels, and exploit across multiple platforms, both free and pay, in the UK and internationally. We have a clear and consistent strategy which is based on four key strategic priorities as follows:
Create a lean, creatively
organisation1 Maximise audience and revenue Drive new revenue streams by
exploiting our content across multiple platforms, free and pay
3
Maximise audience and revenue share from our existing free-to-air broadcast business
2 Build a strong international content business4
Read more on Strategic Priority One on page 19Read more on Strategic Priority Three on page 27
Read more on Strategic Priority Two on page 23 Read more on Strategic Priority Four on page 31
ITV is an integrated producer broadcaster, operating the largest commercial family of channels in the UK. In addition to traditional broadcasting on our channels, we deliver our content on demand through numerous platforms, both directly and via ITV Player. Through ITV Studios we produce content for both our own channels and third parties in the UK and increasingly overseas. Our distribution business sells finished programmes and formats worldwide.
ITV Total Revenues
£1,896m
£857m
Broadcast & Online
ITV EBITA
£487m
£133m
ITV Studios
Broadcast & OnlineITV broadcasts a wide variety of content on its family of free to air (FTA) channels consisting of ITV, the largest commercial television channel in the UK, and the digital channels, ITV2, ITV3, ITV4 and CITV. In 2014 we will launch ITVBe, our new FTA lifestyle and reality channel. The family of channels attracted a total share of viewing of 23.1% in 2013, the largest audience of any UK commercial broadcaster. Programming is primarily funded by television advertising revenues. ITV has the largest share of our estimate of the UK television advertising market at 45.4% in 2013.
In addition to linear broadcast, ITV delivers its content across multiple platforms. This is either through ITV Player, available on ITV’s website, itv.com, and platforms such as Virgin and Sky, or through direct content deals with services such as Lovefilm and Netflix. ITV’s content is now available on 19 platforms and in 2014 we will launch our new pay channel, ITV Encore, on Sky.
ITV StudiosITV Studios is the Group’s international content business. It is the largest production company in the UK and produces programming for ITV’s own channels and for other broadcasters such as the BBC, Channel 4 and Sky. ITV Studios also operates in five international locations, the US, Australia, Germany, France and the Nordics, producing content for local broadcasters in these regions. This content is either locally created IP or created elsewhere by ITV, mainly the UK. We have made a number of acquisitions in the UK, US and the Nordics as we look to build our international business. Global Entertainment, ITV’s distribution business, licenses ITV’s finished programmes and formats and third party content internationally.
ITV at a Glance
ITV plc Annual Report and Accounts for the year ended 31 December 2013
Overview
04
04-05 ITV at a glance.indd 4 28/02/2014 12:01:21 23043-04 10-12-2013 Proof 1
Business ModelHow ITV generates valueAs an integrated producer broadcaster, we have a unique opportunity to deliver value from our investment in quality content. Our investment in our programme budget for our broadcast channels delivers unrivalled audiences that drive our advertising revenues. Our channels also provide a shop window for our own content to make it famous before selling it internationally.
By creating and owning content we can grow new revenue streams by exploiting that content across multiple platforms, both free and pay. Investment in our creative pipeline and in selective acquisitions is building our international content business as we sell our programmes and formats internationally as the demand for proven content continues to grow.
2 4
4
4
3
32
Integrated producer
broadcaster
2
Create and own
world-class content
• ITV Studios is the largest commercial producer in the
UK, producing over 3,500 hours of content each year for ITV channels and
other UK broadcasters
• ITV Studios America, the largest part of our international business, produces over
750 hours of content and is one of the top five independent producers in America
• Our international production businesses produce their own original formats and versions of UK formats for local broadcasters in these regions
Exploit global content opportunities• ITV’s international distribution business is Global Entertainment
• It licenses ITV Studios finished programmes, ITV formats and third party content internationally to broadcasters and platform owners
• ITV is the third largest European distributor of television content
• Growing this business with content ITV owns, creates or
funds is a key part of the strategy
Drive new revenues on different
platforms• ITV makes its broadcast content
available to view on ITV Player
• ITV generates revenues through selling online advertising and sponsorship around this content
• ITV licenses its channels and content to pay operators and online VOD services. In 2014 we will also launch our first pay only channel, ITV Encore, on Sky
• ITV sells pay VOD direct to the consumer and monetises consumer interaction with its
biggest shows through competitions and voting
Provide Britain’s biggest marketing platform• ITV provides advertisers with
unrivalled reach, unique sponsorship opportunities and
commercial partnerships that extend beyond the television set
• ITV’s sales team were awarded ‘Sales Team of the Year’ in 2013 at the Media Week
Awards
Invest in high quality content
• ITV invests roughly £1 billion p.a. commissioning programmes for its family of UK
channels – more than any other UK commercial broadcaster
• ITV acquires this content from ITV Studios and third party independent producers
• ITV Studios invests globally in a creative pipeline of ideas and
makes selective acquisitions in production companies with
attractive IP
Deliver unrivalled
audiences• Investment in a varied
and high quality programme schedule delivers unrivalled
commercial audiences in the UK
• ITV is differentiated by the mass audiences it delivers which are so highly
demanded by advertisers
• 99.9% of all commercial television audiences over 5 million are on ITV
• ITV delivers more targeted audiences on ITV2, 3 and 4 and on ITV Player
• ITV2 and 3 are the largest digital channels in the UK
• In 2014 ITV will launch its new free-to-air lifestyle and reality channel ITVBe
Ove
rvie
wSt
rate
gy a
nd O
pera
tion
sPe
rfor
man
ce a
nd F
inan
cial
sG
over
nanc
eFi
nanc
ial S
tate
men
ts
ar2013.itvplc.comStock code: ITV
05
04-05 ITV at a glance.indd 5 28/02/2014 12:01:22
GATHER: 50 EXAMPLES OF BUSINESS MODELS FROM THE FTSE 350
28. ITV

Our business model
• Brand leadership
• Trading expertise and systems
• Heritage
• Market insight
• Technology
• Best of breed product
• Best in class partners and supplier relationships
We leverage our resources in our chosen marketsthrough all channels
Your excitementCustomers enjoy placing a bet to enhance the enjoyment of a sporting event and also enjoy the controlled risk o�ered by gaming opportunities such as roulette. Wagers can be placed on the high street in our shops or via our Digital and Mobile services. Customers often choose to recycle winnings as they often have a set level of spend they are comfortable with. RETAIL
UK / EUROPE
DIGITAL MOBILE / TABLET / DESKTOP
Ladbrokes aims to generate long-term value to shareholders and an exciting gambling experience to customers. Our business is built on bookmaking expertise and is delivered through Retail and
RETAIL ESTABLISHEDUK / IRELAND / BELGIUM
CUSTOMER PLACES BET
DIGITALMOBILE / TABLET / DESKTOP
NEWAUSTRALIA / US / CHINA / SPAIN
6
CUSTOMER LOSES
CUSTOMER WINS
CLOSED
to deliver our promise and to generate returns and long-term value.
• Dividends to shareholders
• Interest and repayments to bond holders
• Investment in our people, operations and businesses
CUSTOMER RECYCLES WINNINGS
CONTRIBUTES TO GROUP REVENUE
remaining aware of our responsibilities
• Regulation
• Responsible gambling
• Community engagement
CUSTOMER KEEPS THEIR WINNINGS
AN EXCITING AND ENGAGING
GAMING EXPERIENCE
Telephone operations as well as Mobile and Digital services. We are a brand leader in the UK, Ireland and Belgium and we are developing businesses in other key territories.
Overview Strategic report Governance Financial statements 7
GATHER: 50 EXAMPLES OF BUSINESS MODELS FROM THE FTSE 350
29. Ladbrokes

BUSINESS MODEL AND STRATEGY
Unlocking the Group’s potentialCustomers are at the heart of the organisation and by leveraging our strategic assets and capabilities effectively we believe we can help Britain prosper and deliver strong and sustainable returns for our shareholders.
Our business modelLloyds Banking Group is a leading financial services group with a simple, low risk, customer focused, UK retail and commercial banking business model.
We provide a range of services, primarily in the UK, to individuals and commercial customers and by focusing on the needs of customers and operating sustainably and responsibly, we believe we will help Britain prosper and create value for our shareholders.
The foundations for providing effective customer service are: our range of iconic and distinct brands, our broad multi-channel distribution network, our financial strength, our efficient systems and processes, our high quality, committed colleagues and our UK focus.
We want to meet our customers’ financial needs, help them succeed and create value for them. We do this using our distinctive strengths, in particular our superior customer insight, simpler tailored products and relationship focus, whether that be through banking, insurance, investment, debt financing or risk management products.
Our focus on creating a simpler, more efficient and agile organisation is enabling us to provide a better product and service proposition at a fair price while delivering more efficient processes and reducing our cost base.
The UK financial services market remains one of the largest in the world and, although our business model and strategy have been formulated in the context of a cautious outlook for the UK economy, they remain appropriate for all stages of the economic cycle, whilst providing real differentiation and positioning us well for future regulatory reform.
Ultimately as a simple, low risk, customer focused UK retail and commercial bank, we can rebuild the trust of our customers and other stakeholders, help Britain prosper and deliver strong and sustainable returns for our shareholders.
How we create valueA simple, low risk, customer focused UK banking model, delivering the right products with good service at a fair price.
Simple,tailored productsaddressingcustomer needs…
Lending
Deposit taking
Insurance
Investment
Debt financing
Risk management
…delivered through our four divisions.
Unique and effective service proposition…
A range of iconic and distinctive brands
Broad multi-channel distribution network: branch, telephone and digital
High quality, committed colleagues
Efficient systems and processes
Financial strength
UK focus
Creatingdistinctivevalue forcustomersthrough…
Superior consumer insight
Relationship focus
Using our cost advantage for the benefit of customers
Enablingsustainablevaluecreation.
HelpingBritainprosper
Becoming the best bank for customers
Targeting strong, sustainable returns for our shareholders
Group performance 418
Stra
teg
ic r
epo
rtLloyds Banking GroupAnnual Report and Accounts 2013
Group at a glance 2 Market overview 16
Chairman’s statement 8
Group Chief Executive’s review 12
Business model and strategy 18
Delivering our action plan 20
Divisional overview 24
Relationships and responsibility 28
Group key performance indicators (KPIs) 6
Risk overview 40
Fina
ncia
l res
ults
44
Gov
erna
nce
69
Ris
k m
anag
emen
t
123
Fina
ncia
l st
atem
ents
197
Oth
er
info
rmat
ion
377
Group performance 4
Our visionOur aim is to be the best bank for customers and to create value for them by investing where we can make a real difference.
Customers are at the heart of everything we do, whether that be through our distribution network, our brands or our people. This commitment is supported by our Group values of putting customers first, keeping it simpleand making a difference together.making a difference together.making a difference together
Our strategyWe are creating a simpler, more agile, efficient and responsive customer focused organisation concentrating on operating sustainably and responsibly and helping Britain prosper. We are reshaping and simplifying the business and investing a portion of the savings made from our Simplification programme in customer related growth initiatives.
We are reshaping our business portfolio to fit our assets, capabilities and risk appetite. We are strengthening our balance sheet by continuing to reduce our non-core assets and applying a conservative approach to, and prudent appetite for, risk. We have reduced our international presence in order to focus on our core UK customers.
We are unlocking the potential in our franchise and delivering value to customers and shareholders by creating a simpler organisation. Opportunities exist to increase the efficiency of operations and processes and reduce costs whilst addressing changing customer needs and the external environment more effectively.
Our customer focus remains the key driver for strategy and business decision making and we are making substantial customer-related investment. Our strategy reflects our customers’ needs for product simplicity and transparency, access to credit, demands for access through multiple channels, value for money products and services and the importance of our staff in managing customer relationships.
We are delivering our strategy though a clear action plan focused on reshaping our business portfolio to fit our assets, capabilities and risk appetite, strengthening our balance sheet and liquidity position, simplifying the Group to improve agility, efficiency and customer service and investing to be the best bank for customers. Our progress against this plan and the key priorities for 2014 are described on the next few pages.
Following the significant progress we have made against our original strategic plan, we expect to announce an update on our strategy in the second half of 2014 which will also incorporate the key elements of our new Helping Britain Prosper Plan.
More on our Helping Britain Prosper plan28
Our action plan for successWe are making significant progress on all four key elements of our action plan to deliver our strategy. This is outlined in more detail on the next few pages:
R eshapeour assets, capabilities and risk appetite.
More on Reshape20
Strengthenthe Group’s balance sheetand liquidity position.
More on Strengthen21
Simplifythe Group to improve agility ,
More on Simplify22
I nvestto be the best bankfor customers.
More on Invest23
BUSINESS MODEL AND STRATEGY
19
Stra
teg
ic r
epo
rtLloyds Banking GroupAnnual Report and Accounts 2013
Group at a glance 2 Market overview 16
Chairman’s statement 8
Group Chief Executive’s review 12
Business model and strategy 18
Delivering our action plan 20
Divisional overview 24
Relationships and responsibility 28
Group key performance indicators (KPIs) 6
Risk overview 40
Fina
ncia
l res
ults
44
Gov
erna
nce
69
Ris
k m
anag
emen
t
123
Fina
ncia
l st
atem
ents
197
Oth
er
info
rmat
ion
377
Group performance 4
GATHER: 50 EXAMPLES OF BUSINESS MODELS FROM THE FTSE 350
30. Lloyds Banking Group
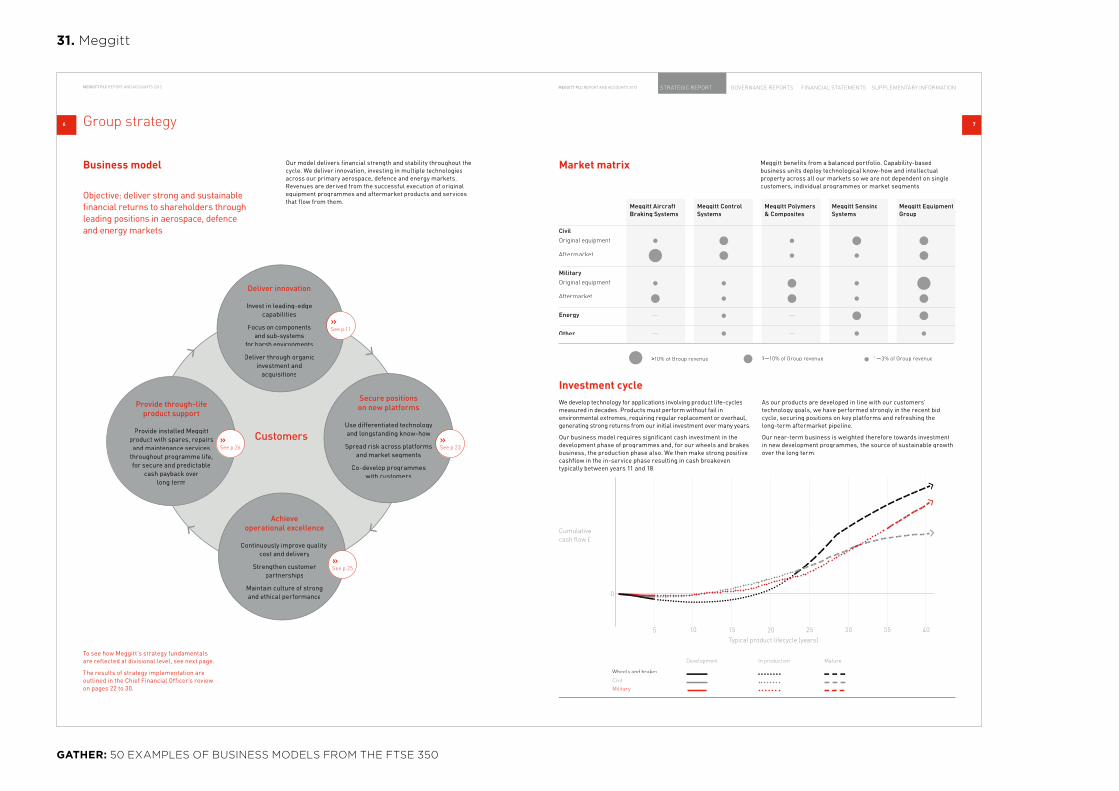
6
MEGGITT PLC REPORT AND ACCOUNTS 2013
Group strategy
Our model delivers financial strength and stability throughout the cycle. We deliver innovation, investing in multiple technologies across our primary aerospace, defence and energy markets. Revenues are derived from the successful execution of original equipment programmes and aftermarket products and services that flow from them.
Business model
Objective: deliver strong and sustainable financial returns to shareholders through leading positions in aerospace, defence and energy markets
To see how Meggitt’s strategy fundamentals are reflected at divisional level, see next page.
The results of strategy implementation are outlined in the Chief Financial Officer’s review on pages 22 to 30.
Deliver innovation
Invest in leading-edge capabilities
Focus on components and sub-systems
for harsh environments
Deliver through organic investment and
acquisitions
Secure positions on new platforms
Use differentiated technology and longstanding know-how
Spread risk across platforms and market segments
Co-develop programmes with customers
Provide through-life product support
Provide installed Meggitt product with spares, repairs
and maintenance services throughout programme life, for secure and predictable
cash payback over long term
Achieve operational excellence
Continuously improve quality,cost and delivery
Strengthen customer partnerships
Maintain culture of strong and ethical performance
››See p.26
››See p.23
››See p.25
››See p.11
Customers
7
MEGGITT PLC REPORT AND ACCOUNTS 2013 STRATEGIC REPORT FINANCIAL STATEMENTS SUPPLEMENTARY INFORMATION GOVERNANCE REPORTS
Market matrix
CivilOriginal equipment
Aftermarket
MilitaryOriginal equipment
Aftermarket
Energy
Other
Meggitt AircraftBraking Systems
Meggitt ControlSystems
Meggitt Polymers & Composites
Meggitt SensingSystems
Meggitt Equipment Group
>10% of Group revenue 3—10% of Group revenue 1—3% of Group revenue
Meggitt benefits from a balanced portfolio. Capability-based business units deploy technological know-how and intellectual property across all our markets so we are not dependent on single customers, individual programmes or market segments.
Investment cycleWe develop technology for applications involving product life-cycles measured in decades. Products must perform without fail in environmental extremes, requiring regular replacement or overhaul, generating strong returns from our initial investment over many years.
Our business model requires significant cash investment in the development phase of programmes and, for our wheels and brakes business, the production phase also. We then make strong positive cashflow in the in-service phase resulting in cash breakeven typically between years 11 and 18.
As our products are developed in line with our customers’ technology goals, we have performed strongly in the recent bid cycle, securing positions on key platforms and refreshing the long-term aftermarket pipeline.
Our near-term business is weighted therefore towards investment in new development programmes, the source of sustainable growth over the long term.
Typical product lifecycle (years)
Cumulative cash flow £
Wheels and brakes
Civil
Military
Development In production Mature
5
0
10 15 20 25 30 35 40
GATHER: 50 EXAMPLES OF BUSINESS MODELS FROM THE FTSE 350
31. Meggitt

To help us maximise these opportunities, we apply a simple business model and clear strategy to deliver sustainable growth for shareholders.
16 Mitchells & Butlers plc Annual Report and Accounts 2013
Our business model and strategy
What we doMitchells & Butlers is the leading operator of restaurants and pubs in the UK with multiple brands spanning around 1,600 locations.
How we do itOur 40,000 employees and leading portfolio of brands are focused on delighting our guests and delivering growth in the eating and drinking-out market.
How we create valueWe run businesses that people love to eat and drink in, and as a result grow shareholder value.
Our strategy
1. Focus the business on the most attractive market spaces within eating and drinking-out
2. Develop superior brand propositions with high levels of consumer relevance
3. Recruit, retain and develop engaged people who deliver excellent service for our guests
4. Generate high returns on investment through scale advantage
5. Maintain a sound financial base
2013 progress (See Chief Executive’s market and business review on pages 22 to 27)
• We completed a significant piece of research to update our understanding of current and future consumer trends, opportunities and brand growth potential.
• This research included interviews with 8,000 consumers, meetings with industry commentators and a thorough review of macro-economic indicators and forecasts.
• We aligned our operating strategies to the market dynamics within each space.
• We delivered further growth in food sales and margin in a challenging environment.
• Our ‘Good to Great’ programme continued to reduce the level of administration within the business, freeing up our operational teams to deliver improved service.
• We redesigned our guest service and food capability training programmes.
• We actively support apprenticeship schemes and, at our year end, we were employing c. 1,600 apprentices.
• We have continued to refine our methods of site selection, making use of our improved consumer insight.
• We opened 16 new restaurants and pubs in the year.
• We have long-term debt financing secured on our large, predominantly freehold asset base.
• At the year end, our freehold property was revalued and we conducted an impairment review on other assets. Taken together, this resulted in an increase in value of £31m.
2013 performance
• We focused the business on five attractive market spaces within the £75bn eating and drinking-out market: special, family, upmarket social, everyday social and heartland.
• Total sales increased 2.2% (compared to 52 week revenue in FY 2012).
• Our net promoter score increased by 4 percentage points to 59%.
• Staff turnover in our restaurants and pubs was down 4 percentage points to 78%.
• We made a 17% EBITDA return on the expansionary investments made in our brand portfolio over the last three years.
• Net debt reduced to 4.2 times EBITDA from 4.5 times at the last year end.
2014 priorities
• We will open new restaurants and pubs, especially in the family, upmarket social and special market spaces.
• We will focus on the execution of our brand strategies, based on strong consumer insight.
• We will roll out new tills, table and kitchen management systems across our estate, which are designed to improve guest service significantly.
• We have launched a People Strategy which aims to improve further our recruitment, induction, guest service and food capability programmes across our restaurants and pubs.
• We will continue our focus on improving the efficiency of our investments.
• We will further increase the clarity of our capital allocation, investing where the returns are most attractive.
• We will continue to prioritise long-term financial stability for the Group.
Key risks (See Risks and uncertainties on pages 18 to 20)
• Failure to anticipate pricing and market changes.
• Failure to anticipate changes in consumer taste.
• Failure to anticipate pricing and market changes.
• Failure to anticipate changes in consumer taste.
• Failure to attract, retain, develop and motivate the best people with the right capabilities.
• Cost of goods price increases (including energy).
• Failure to attract high quality teams to operate newly opened restaurants and pubs.
• The pension fund deficit may increase, leading to increases in funding requirements.
• Failure to manage performance against our borrowing covenants.
17Mitchells & Butlers plc Annual Report and Accounts 2013
Com
pany overview 01 – 05
Governance 35 – 64
Financial statements 65 – 106
Shareholder information 107 – 108
Strategic and
bu
siness review
07 – 34
GATHER: 50 EXAMPLES OF BUSINESS MODELS FROM THE FTSE 350
32. Mitchells & Butlers

Operationalexcellence
Safety,Customer Service,
Operational Efficiency
Economic returnsIncreasing numbersof passengers andcontracts, organicrevenue and profit
growth, cashgeneration, increasing
return on capitalemployed
Our marketsBus, Coach,
School Bus, Rail
Resources andrelationships
Customers, Employees,Government, Communities,
Know-How
Shareholdervalue creation
Our business model
Delivering operational excellence
Delivering new
opportunities
Generatin
g su
perio
r cas
h an
d re
turn
s
Our strategy
Cus
tom
ersP
eople
Safety
Exce
llence
Community
Delivering long term shareholder value
Strategic Report: Our business model and strategy
Our business model The Group uses its operational expertise, experience and accumulated know-how to provide best in class transport services. Our customers value our safe, punctual and frequent services that are available at excellent prices.
Private transport operators can provide a higher standard of service and better value for money than public or state management. National Express is able to leverage this expertise across different modes of transport and different geographies. Our focus on operational excellence will allow us to target long term sustainable growth of the business:
• Through the constant improvement of high standards in customer service we will grow revenue by increasing passenger and contract volumes as well as providing the credentials for growth in new markets.
• We are driving cost efficiencies across the Group to protect and grow margins.
• Most of all, we will ensure that our customers and employees are safe at all times.
The Group has a relatively decentralised management structure, with a strong degree of autonomy of each division’s leadership, working within our framework of operational and financial strategic objectives. There are some economies of scale in procurement, insurance, overhead costs and financing.
The structurally cash-generative nature of the business enables us to combine sustainable investment in existing operations with the opportunity to build value through high-return growth and capital returns to shareholders.
14 National Express Group PLC Annual Report and Accounts 2013
Our strategy 2013 performance Measuring our performance
Delivering operational excellence Driving revenue growth and margin progression in our core divisions by delivering excellent customer service and cost efficiency
Customer service• ALSA the top rated transport company
in Spain; passenger growth of 15% in Morocco
• 92% customer satisfaction and 97% retention rate in School Bus
• Core passenger growth of 9% in UK Coach
• Record-breaking performance at c2c
Cost efficiency• Non-rail profit increased to £185.5 million
• Group margin best in class at 10.2% reflects smaller rail business
• Four out of five divisions have best in class margins
• £30 million of cost savings across the Group
Generating superior cash and returnsA strong cash flow and improving return on the capital we invest will drive better returns for our shareholders
• Operating cash flow increased by £38 million to £248.0 million
• 129% of Group operating profit converted into cash
• Free cash flow of £183 million
• Non-rail return on capital improved by 50bps to 11.1%
Delivering new opportunitiesOur unique portfolio of international bus, coach and rail businesses gives National Express a significant opportunity to grow in selected new markets
• Won our first rail contracts in Germany
• Built over $80 million of annual revenue in US Transit
• Won Tangiers and Guadalajara urban bus contracts in ALSA
• Launched German coach operations
• Bid submitted for Essex Thameside and Crossrail; prequalified for ScotRail in the UK
Local currency Rail revenue growth is adjusted for the handover of NXEA in 2012.
-5
0
5
10
15
20
Metric: Revenue growth %
Spain NorthAmerica
UKBus
UKCoach
Rail12 13 13 13 13 1312 12 12 12
Metric: Margin %
0
5
10
15
20
Spain NorthAmerica
UKBus
UKCoach
Rail12 13 13 13 13 1312 12 12 12
Metric: Operating cash conversion %
0
50
100
150
200
Spain NorthAmerica
UKBus
UKCoach
Rail12 13 13 13 13 1312 12 12 12
Metric: Contract wins by value (£m)
0
300
600
900
1,200
1,500
Spain NorthAmerica
UKCoach
Rail12 13 13 13 1312 12 12
15www.nationalexpressgroup.com
Strategic Report pp01-51
GATHER: 50 EXAMPLES OF BUSINESS MODELS FROM THE FTSE 350
33. National Express Group

Operating model
As customer behaviour shifts towards shopping for groceries online, incumbent retailers are trying to adapt their existing businesses to meet this fundamental change. We are solely focused on the online channel, and committed to providing the best customer shopping experience available, without the distraction of legacy bricks and mortar operations. Our objective has been to be a cost leader and create a virtuous cycle between growth, efficiency and investment.
Ultimately the retail mission is to move a product from a supplier to a customer’s home. However, traditional retail models only deliver half of this mission, moving a product only as far as the shop shelf. The customer performs the other half of the mission by coming to the store, “picking, packing and delivering” the product themselves. Notwithstanding, grocery retail remains a relatively slim margin business today. By offering online services, the retailer commits to complete the
entire retail mission, including that part currently performed by the customer. The extra work entails additional cost for the retailer, and represents the fundamental challenge to the grocery retail industry.
There is no single strategy for online retailing. In grocery, different approaches are being adopted, with traditional supermarket operators largely using existing store based fulfilment. Some have started to build so called “dark stores”, stores without customers or in effect small warehouses with limited automated processes, with a turnover similar to a typical supermarket dedicated only to servicing online orders. Both a store pick and a dark store approach incur the costs associated with traditional store retailing, but the incremental cost of picking, packing and delivery drives margins from the online channel down significantly.
By contrast, Ocado has adopted a very different approach with the objective of removing significant costs from the traditional grocery supply chain. We
“We are solely focused on the online channel, and committed to providing the best customer shopping experience available.”
The Conventional Way
Conventional store (in-store or online)
Suppliers and Wholesalers
Regional Distribution Centres
Online storeStores
Customer’s home
Delivery
Suppliers and Wholesalers
Customer’s home
Delivery
The Ocado Way
Central Fulfilment Centres
22965.04 10 March 2014 3:21 PM Proof 3
16 www.ocadogroup.com Stock Code: OCDO
do this through the centralisation of our picking operation from large warehouses, which are over 20 times the size of a big supermarket, which aggregates activities to give each function scale, and through the use of automation and technology. We distribute orders directly from our picking facilities and through a series of local spoke sites located around the country.
Our operating model removes many of the costs incurred in a traditional store or dark store model. These include redistribution costs of stock from a separate distribution centre, significantly reduced “put away” costs of stock into our pick aisles (the equivalent of a supermarket shelf), and the costs of a physical store network itself, with expensive real estate, multiple stock locations, manual processes, and poor economies of management and scale. As we grow and scale our operation further, we will benefit from the operating leverage inherent in our model. This will drive the virtuous cycle between growth, improving cost economics, and investment into the proposition to customers.
Our model also gives natural benefits to the customer. Our food should be fresher as it take less time to reach the shelves and spends less time on
those shelves. We have higher predictability of stock available than a single store. We are able to make new range extensions available to all our customers very quickly from central locations, enabling us to add products to our range quickly and effectively without a high risk of stock obsolescence. The significant knowledge we have developed has resulted in industry leading delivery metrics which underpin our customer service proposition.
Our commitment to environmentally friendly and sustainable business practices is supported by our operating model. The efficiency of our model ensures we have what we believe to be the lowest product waste levels in the industry. We believe our model to be a more energy efficient way to distribute groceries into customers’ homes. We use closed refrigerated areas in a limited number of buildings. Furthermore, every delivery we make potentially reduces up to 20 customers making the journey to and from a supermarket.
We have developed this pioneering approach to grocery retail over 13 years using our own bespoke systems, know-how and software, making our operation difficult to replicate.
“Ocado has adopted a very different approach with the objective of removing significant costs from the traditional grocery supply chain.”
Business benefits Customer benefits
Removes requirement and cost of separate (regional) distribution centres to receive stock from suppliers, re-palletise and redistribute to store/dark store network, as we receive stock directly from suppliers or wholesalers
Convenience of ordering online, saving time and effort of going to the store, with the leading on-time delivery service
Automate stock “put-away” processes reducing operating costs
Faster and more extensive range extension as stock has only to be held in two locations (today)
No physical check-out process, because we have no stores, reducing labour costs
Higher predictability of stock, improving ability to fulfil customers’ orders accurately and with minimal substitutions
Significantly lower product waste from faster stock turn, representing both a cost saving and more sustainable food supply chain
Fresher products as the supply chain from suppliers is generally shorter – we guarantee the life of our fresh products
Significantly lower property and occupation costs through, for example, cheaper real estate (we use warehouse space not expensive retail space) lower energy usage, and better economies of management and scale.
Cost savings generated as a result of our operating model allows for investment into prices, giving the customer good value at competitive prices
The significant cost savings from the business benefits enable us to invest in picking and delivery services for the benefit of our customers
17Ocado Group plc Annual Report for the 52 weeks ended 1 December 2013
Strategic Report : Our business and strategy
GATHER: 50 EXAMPLES OF BUSINESS MODELS FROM THE FTSE 350
34. Ocado Group

Pearson plc Annual report and accounts 201306
Our business models
Whether it’s through new digital learning products in the US, developing qualifications and assessments in the UK, training school leaders in the Middle East, teaching English in China, or educating professionals through content from the Financial Times, we’re helping people make measurable progress in their lives through learning.
Our products and services may be provided and used in a standalone way, but are increasingly integrated and customised to meet the needs of individual education systems, customers and learners. We have identified four major market opportunities for our products and so we create value for our customers in four di�erent, but related ways, outlined below.
Pearson is the world’s leading learning company, working to support learners and teachers in over 80 countries around the world.
Where we provide a set of integrated services Where we provide a set of integrated services Where we provide a set of integrated services to institutions (public and private) that have to institutions (public and private) that have to institutions (public and private) that have an institution-wide impact on improved learning an institution-wide impact on improved learning an institution-wide impact on improved learning outcomes (often at lower cost). outcomes (often at lower cost). outcomes (often at lower cost).
Where we own and operate the learning institution Where we own and operate the learning institution (physical, virtual and/or blended), providing an (physical, virtual and/or blended), providing an integrated learning environment direct to the integrated learning environment direct to the learner rather than through other parties. learner rather than through other parties.
Inside services Direct delivery
Includes:Includes:Includes:
Sistema COC provides a complete solution, from digital and traditional learning to assessment tools and pedagogical support, for pre-K12 schools in Brazil, reaching 160,000 students.
Emabnet is the leading provider of online learning services for the world’s premier schools, colleges and universities.
We provide technology and management services to support ASU’s online students. ASU is the largest public online students. ASU is the largest public university in the US by enrolment.
Includes:Includes:
CTI is a private higher education institution in South Africa, o�ering full and part-time studies in Information Technology, Psychology and Counselling, Creative Arts and Graphic Design, Commerce and Law, on campuses spread throughout South Africa.
Wall Street English is among the largest providers of English language instruction for adults and corporate clients around the world, operating over 450 centres in 28 countries.
Connections Academy o�ers a variety of accredited virtual school options for students in grades K-12 in the US.students in grades K-12 in the US.students in grades K-12 in the US.students in grades K-12 in the US.students in grades K-12 in the US.
BUSINESS MODEL BUSINESS MODEL
university in the US by enrolment.students in grades K-12 in the US.
Embanet™
FINA
NC
IAL ST
AT
EM
EN
TS
GO
VE
RN
AN
CE
OV
ER
VIE
WO
UR
PE
RFO
RM
AN
CE
RE
SPO
NSIB
LE
BU
SINE
SS
Section 1 Overview 07
Underpinning the e�ectiveness of each of these four models, from design through to delivery, is the E�cacy Framework, a tool we have devised to help understand how our products or services can achieve the best possible outcomes or results. You can read more about our commitment to e�cacy from page 14, and online at e�cacy.pearson.com
Like any business, we understand that there are certain risks associated with each model. Read more about how we are managing and mitigating these on pages 41 to 45.
Associates and joint ventures
We have a 47% stake in Penguin Random House, the world’s first truly global trade book publisher. Penguin Random House was formed on 1 July 2013, upon the completion of an agreement between Bertelsmann and Pearson to merge their respective trade publishing companies, Random House and Penguin. Other associates and joint ventures include Vedomosti in Russia and a 50% stake in The Economist Group.
The individual elements of our products, including The individual elements of our products, including The individual elements of our products, including learning materials, that are increasingly digital in learning materials, that are increasingly digital in learning materials, that are increasingly digital in nature and operating as part of an integrated nature and operating as part of an integrated nature and operating as part of an integrated learning ecosystem. learning ecosystem. learning ecosystem.
Where we provide services that enable an Where we provide services that enable an Where we provide services that enable an institution or system to measure and validate institution or system to measure and validate institution or system to measure and validate learner progress towards relevant standards learner progress towards relevant standards learner progress towards relevant standards or to certify competency. or to certify competency. or to certify competency.
Learning services Assessment
Includes:Includes:Includes:
Pearson VUE is the world’s leading computer-based testing and assessment business, working with organisations of all sizes to create flexible, custom-built assessment solutions and delivering them in a secure and reliable testing environment.
BTEC vocational qualifications are recognised in more than 80 countries worldwide, and in 2011/2012, over 2m learners registered for BTECs, including 650,000 school students.
We create, deliver and process state and national assessments in the US. In 2013 we administered nearly 50m online and we administered nearly 50m online and we administered nearly 50m online and paper tests.
P E A R S O N V U E
BUSINESS MODEL BUSINESS MODEL
paper tests.
MyLab & Mastering
Includes:Includes:Includes:
enVisionMATH is designed for students in grades K–6 and seeks to help students develop an understanding of maths concepts through problem-based instruction, small-group interaction, and visual learning with a focus on reasoning and modelling.
MyLab & Mastering is the world’s leading collection of online homework, tutorial, and assessment products, creates personalised and continuously adaptive learning experiences.
Speakout is an award-winning English course for adults used around the world. In partnership with the BBC, it includes exercises, small-group work, audio clips and video clips from well-known TV programmes.
GATHER: 50 EXAMPLES OF BUSINESS MODELS FROM THE FTSE 350
35. Pearson

Our main commercial models
Engineering, Construction, Operations & Maintenance Reimbursable services Where the cost of our services is reimbursed by the customer plus a margin. The majority of services provided by Engineering & Consulting Services and Offshore Projects & Operations are remunerated on this basis.
Cost plus KPIsOften our reimbursable contracts will include incentive income linked to the successful delivery of key performance indicators (KPIs), for example, Duty Holder projects like the Kittiwake Platform in the UK North Sea for EnQuest.
Lump-sum turnkeyOnshore Engineering & Construction and Offshore Capital Projects undertake engineering, procurement and construction (EPC) projects predominantly on a lump-sum or fixed-price basis, for example the Galkynysh project in Turkmenistan.
Petrofac is an oilfield services company.Working across the international oil and gas industry, we help our customers unlock the full value of their energy assets.
We design and build new oil and gas facilities. We manage and maintain existing facilities. We also enhance the performance of more mature or marginal assets. And we develop and train our customers’ people to work more effectively.
Operating onshore or offshore, our service lines can be delivered on a stand-alone basis or integrated, under a range of commercial models – so that our own interests are aligned with our customers.
It is our people that make Petrofac.
We aim to attract, develop and retain the very best talent in the industry. And, guided by a clear set of Petrofac values, we nurture a distinctive, delivery-focused culture.
Our vision is to be the world’s most admired oilfield services company.
Petrofac Annual report and accounts 2013
08
Strategic report
Our business model
Engineering & Consulting Services Petrofac’s centre of technical engineering and excellence. From offices across the Middle East and North Africa, CIS, Asia-Pacific, Europe and The Americas, we provide engineering services across the life cycle of oil and gas assets. Our teams execute all aspects of engineering,
including conceptual studies, front-end engineering and design (FEED) and detailed design work, for onshore and offshore oil and gas fields and facilities.
Commercial model Reimbursable services.
Onshore Engineering & Construction Onshore Engineering & Construction delivers onshore engineering, procurement and construction (EPC) oil and gas projects. We are focused predominately in the Middle East, Africa and the Caspian region of the CIS.
Commercial model Lump-sum turnkey.
Project examples: Badra oilfield development, Iraq; ASAB onshore oilfield development, Abu Dhabi; Galkynysh gas plant, Turkmenistan.
Offshore Projects & Operations Offshore Projects & Operations specialises in both offshore engineering and construction services, for greenfield and brownfield oil and gas projects, and the provision of operations and maintenance support, onshore and offshore.
Commercial models Reimbursable services and Cost plus KPIs.
Project examples: Bekok-C platform refurbishment, Malaysia; inspection, maintenance and repair contract, Iraq; Apache engineering and construction services, UK.
Training ServicesOur global training business manages and operates on behalf of our customers, 14 training facilities in six countries and delivers around 250,000 training days annually. We work with customers to assess capability needs and build programmes to develop competent, safe and efficient workforces.
Commercial models Reimbursable services.
Project examples: Hi-Con survival training at NASA’s Johnson Space Center, Houston; Petrofac’s Survival and Marine training centres in Aberdeen, Scotland.
Des
ign
Bui
ldO
per
ate
Trai
nIntegrated Energy ServicesRisk Service Contracts (RSC)We develop, operate and maintain a field, while the resource holder retains ownership and control of their reserves. Often, we will co-invest in the development and will be reimbursed based upon our performance. An example is the Berantai project in Malaysia. RSCs typically have low exposure to commodity prices and reservoir performance.
Production Enhancement Contracts (PEC)We are paid a tariff per barrel for the enhancement of oil and gas production above an agreed baseline and therefore have no direct commodity price exposure. PECs are appropriate for mature fields which have a long production history. Our contracts are long-term, for example, 15 years on the Ticleni contract in Romania and 25 years for the Magallanes and Santuario blocks in Mexico.
Equity Upstream InvestmentsUpstream Investments through Production Sharing Contracts (PSC), Concession Agreements and Equity, of which Block PM304, the Chergui field and the Greater Stella Area development are examples. We will typically have some production and commodity price exposure.
Petrofac Annual report and accounts 2013
09
Offshore Capital ProjectsOffshore Capital Project focuses on executing engineering, procurement, construction and installation (EPCI) projects offshore.
Commercial model Lump-sum turnkey.
Project example: SARB3 project, Abu Dhabi.
Developments Integrates our engineering, project management and operating capability to lead the development of customers’ assets working under commercial models which align us with resource holders’ needs.
Commercial models Risk Service Contracts (RSC) and Equity Upstream Investments.
Project examples: Berantai development, Malaysia (RSC); Greater Stella Area, UK (Equity Upstream Investments).
Production SolutionsProvides customers with a wide range of services to help improve production, operational efficiency, asset integrity and the ultimate recovery of reserves from their assets.
Commercial model Production Enhancement Contracts (PEC).
Project examples: Magallanes and Santuario, Mexico; Ticleni, Romania.
Project examples: In Salah Gas and In Amenas consultancy, design and procurement services, Algeria; Lakach project management contract, Mexico.
GATHER: 50 EXAMPLES OF BUSINESS MODELS FROM THE FTSE 350
36. Petrofac Ltd

Why our customers work with usGuided by a clear set of values, Petrofac has a distinctive, delivery-focused culture.
We are a flexible, entrepreneurial, customer-centric business. And we always look for innovative ways to meet customers’ needs – by sharing and managing their risk, aligning our performance with their goals, enhancing asset performance and developing their own people and capabilities.
It’s all about understanding our customers, drawing on our breadth of capabilities, and adapting our approach.
At the heart of everything we do, the six Petrofac values guide our decisions and behaviour:
Safe
Ethical
Innovative
Responsive
Quality and cost conscious
Driven to deliver
Deep and widening capabilitiesThe Petrofac story is characterised by the steady, disciplined expansion of our capabilities – enabling us to access new markets and meet the evolving needs of our customers.
Operating onshore or offshore, across a range of geographies, we have amassed a full range of skills and capabilities – including design, engineering, construction, consulting, procurement, project management, operation, maintenance and training, as well as drilling and subsurface expertise.
Any of our service lines can be offered on its own or we can integrate them – enabling us to design and build oil and gas facilities or operate and manage assets fully on our customers’ behalf.
Petrofac Annual report and accounts 2013
10
Strategic report
Our business model continued
See our case study on Berantai (Malaysia) – one example of an integrated delivery, involving aspects from the initial design through to training the local workforce. page 13
In
novative
Deep and
delivery
com
mer
cial approach widening capabilities
exce
llenc
e
Ope
rati
on
al
risk managem
entE
ffective
A distinctive, delivery-focused culture
Local
Operational excellenceAt Petrofac we have a relentless focus on operational excellence.
From the moment we decide to bid on a project, the discipline begins. A team is assembled, a tailor-made execution plan is developed, risks are identified, suppliers are sourced, and a member of the management team takes full responsibility.
With a clear understanding of cost and complexity, we can then bring best-in-class, on-time delivery. At every step of the way, formal reviews bring incremental improvements to our overall approach. Every time we identify a better way of doing things, we aim to implement it across the Group.
This level of rigour is reflected in everything we do. We have never lost money on a lump-sum engineering, procurement and construction project, which we believe speaks for our track record.
Effective risk managementRisk management is fundamental to the Petrofac proposition – by working to reduce risk in our customers’ projects, and effectively managing risk within our own operations.
For customers, we ‘de-risk’ projects. From the moment we choose to bid on a project, we look for ways to provide greater certainty, share financial risks, and align our respective commercial interests.
Within our own business, we seek to ensure that risks are anticipated and addressed – thanks to pre-investment in the quality of our bids, a commitment to efficient and effective project delivery, and a hands-on management team.
Petrofac’s management and employees hold a significant shareholding in the business – which means we think like shareholders, with a focus on the long-term success of the business.
Innovative commercial approachWe offer a range of commercial models – each of which is designed to recognise our customers’ commercial goals and reward Petrofac for the value we bring.
Depending on customer needs, we can operate on a fixed price lump-sum basis. We can also link our remuneration to certain goals. In the case of a Production Enhancement Contract, we can collect a tariff on the production improvements we make. Or, where we can draw on our full range of capabilities, we can co-invest in upstream or infrastructure projects.
We are also innovative in keeping our own costs down – with disciplined procurement practices, for example, or smart ways of phasing our projects.
Local deliveryWherever possible, we deliver locally – by employing local people, working with local partners and suppliers, and developing local capabilities.
This commitment to local delivery and development is a key consideration for many customers. It also enables us to work more cost-effectively. As we establish footholds in new markets, it supports our growth.
Our training business is core to our strategy and our capability – facilitating our entry into new markets, cementing long-term customer relationships, and earning trust from the communities in which we operate.
Petrofac Annual report and accounts 2013
11
See our case studies on Berantai (Malaysia), El Merk (Algeria), Galkynysh (Turkmenistan) and Magallanes and Santuario (Mexico) – each of which relied on us nurturing local capabilities and training thousands of local employees.pages 13, 23, 32 and 51
See our case study on Berantai (Malaysia) – to get a feel for how we minimised execution risk, and financed the project via an innovative Risk Service Contract.page 13
See our case study on Magallanes and Santuario (Mexico) – to appreciate how our commercial models have contributed to around 45% increase in production since we took over operations of the blocks in February 2012.page 32
See our case study on El Merk (Algeria) – to get a sense of our disciplined procurement practices.page 51
See our case study on Galkynysh (Turkmenistan) – at US$3.4 billion, our largest ever EPC project, delivered against the most aggressive of schedules.page 23
GATHER: 50 EXAMPLES OF BUSINESS MODELS FROM THE FTSE 350
36. Petrofac Ltd (continued)
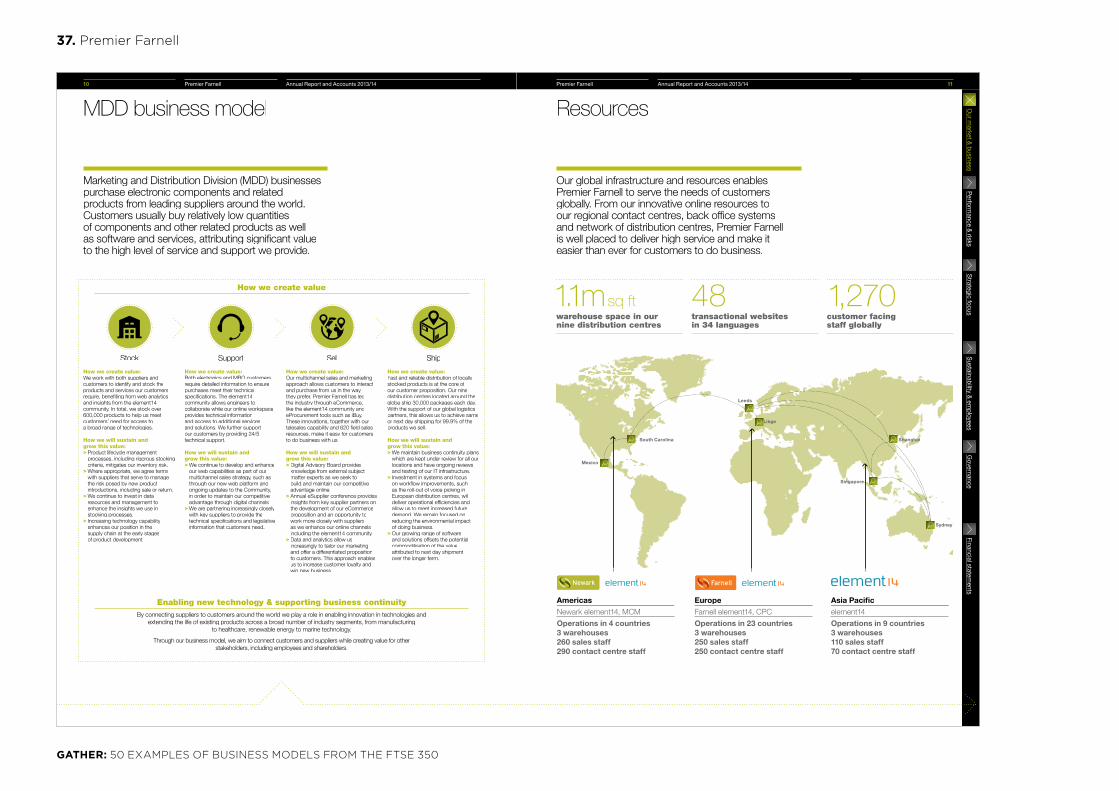
How we create value
MDD business model
Marketing and Distribution Division (MDD) businesses purchase electronic components and related products from leading suppliers around the world. Customers usually buy relatively low quantities of components and other related products as well as software and services, attributing significant value to the high level of service and support we provide.
Stock
How we create value: We work with both suppliers and customers to identify and stock the products and services our customers require, benefiting from web analytics and insights from the element14 community. In total, we stock over 600,000 products to help us meet customers’ need for access to a broad range of technologies.
How we will sustain and grow this value: > Product lifecycle management processes, including rigorous stocking criteria, mitigates our inventory risk. > Where appropriate, we agree terms with suppliers that serve to manage the risk posed by new product introductions, including sale or return. > We continue to invest in data resources and management to enhance the insights we use in stocking processes. > Increasing technology capability enhances our position in the supply chain at the early stages of product development.
Support
How we create value: Both electronics and MRO customers require detailed information to ensure purchases meet their technical specifications. The element14 community allows engineers to collaborate while our online workspace provides technical information and access to additional services and solutions. We further support our customers by providing 24/5 technical support.
How we will sustain and grow this value: > We continue to develop and enhance our web capabilities as part of our multichannel sales strategy, such as through our new web platform and ongoing updates to the Community, in order to maintain our competitive advantage through digital channels. > We are partnering increasingly closely with key suppliers to provide the technical specifications and legislative information that customers need.
Sell
How we create value: Our multichannel sales and marketing approach allows customers to interact and purchase from us in the way they prefer. Premier Farnell has led the industry through eCommerce, like the element14 community and eProcurement tools such as iBuy. These innovations, together with our telesales capability and 620 field sales resources, make it easy for customers to do business with us.
How we will sustain and grow this value: > Digital Advisory Board provides knowledge from external subject matter experts as we seek to build and maintain our competitive advantage online. > Annual eSupplier conference provides insights from key supplier partners on the development of our eCommerce proposition and an opportunity to work more closely with suppliers as we enhance our online channels including the element14 community. > Data and analytics allow us increasingly to tailor our marketing and offer a differentiated proposition to customers. This approach enables us to increase customer loyalty and win new business.
Ship
How we create value: Fast and reliable distribution of locally stocked products is at the core of our customer proposition. Our nine distribution centres located around the globe ship 30,000 packages each day. With the support of our global logistics partners, this allows us to achieve same or next day shipping for 99.9% of the products we sell.
How we will sustain and grow this value: > We maintain business continuity plans which are kept under review for all our locations and have ongoing reviews and testing of our IT infrastructure. > Investment in systems and focus on workflow improvements, such as the roll-out of voice picking in European distribution centres, will deliver operational efficiencies and allow us to meet increased future demand. We remain focused on reducing the environmental impact of doing business. > Our growing range of software and solutions offsets the potential commoditisation of the value attributed to next day shipment over the longer term.
Enabling new technology & supporting business continuityBy connecting suppliers to customers around the world we play a role in enabling innovation in technologies and
extending the life of existing products across a broad number of industry segments, from manufacturing to healthcare, renewable energy to marine technology.
Through our business model, we aim to connect customers and suppliers while creating value for other stakeholders, including employees and shareholders.
10 Premier Farnell Annual Report and Accounts 2013/14
Resources
Our global infrastructure and resources enables Premier Farnell to serve the needs of customers globally. From our innovative online resources to our regional contact centres, back office systems and network of distribution centres, Premier Farnell is well placed to deliver high service and make it easier than ever for customers to do business.
1.1msq ftwarehouse space in our nine distribution centres
48transactional websites in 34 languages
1,270customer facing staff globally
EuropeFarnell element14, CPC
Operations in 23 countries3 warehouses250 sales staff250 contact centre staff
Asia Pacificelement14
Operations in 9 countries3 warehouses110 sales staff70 contact centre staff
AmericasNewark element14, MCM
Operations in 4 countries3 warehouses260 sales staff290 contact centre staff
Liège
Shanghai
Singapore
Sydney
Leeds
South Carolina
Mexico
11Premier Farnell Annual Report and Accounts 2013/14
Our m
arket & b
usinessP
erformance &
risksS
trategic focusS
ustainability &
emp
loyeesG
overnanceFinancial statem
ents
GATHER: 50 EXAMPLES OF BUSINESS MODELS FROM THE FTSE 350
37. Premier Farnell
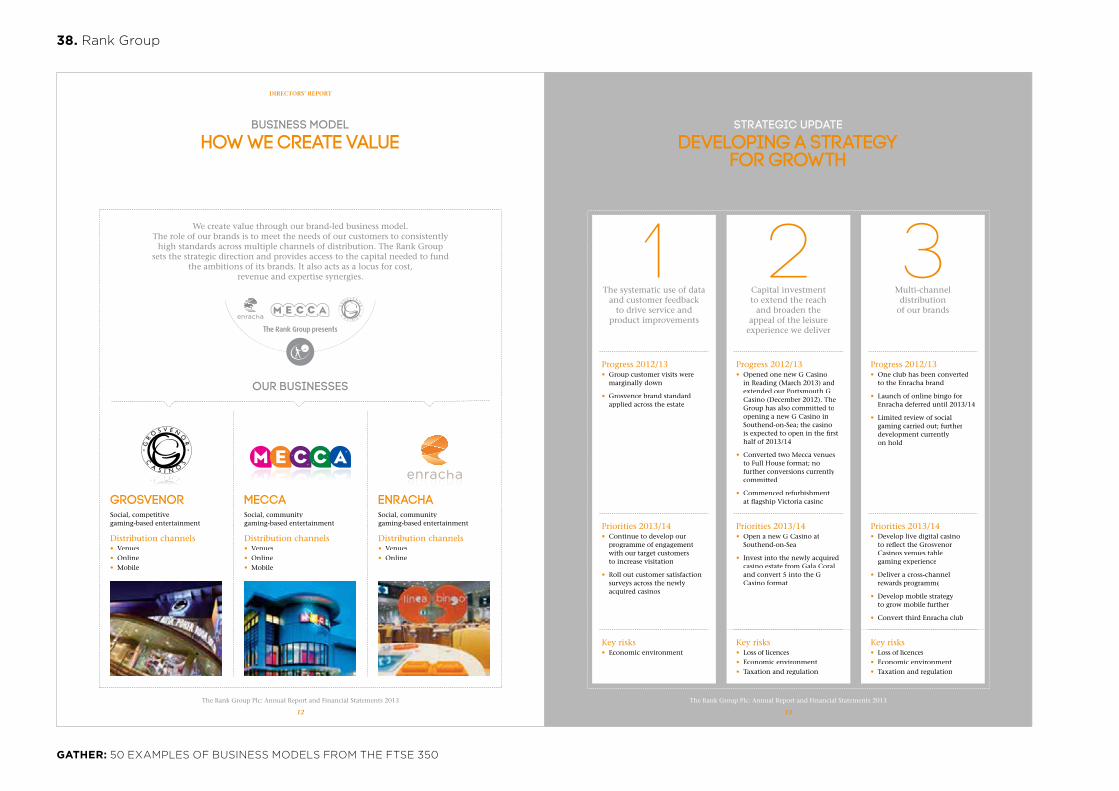
DIRECTORS’ REPORT
grosvenor Social, competitive gaming-based entertainment
meccaSocial, community gaming-based entertainment
enrachaSocial, community gaming-based entertainment
Distribution channels• Venues• Online• Mobile
Distribution channels• Venues• Online• Mobile
Distribution channels• Venues• Online
Business Model
how we create value
We create value through our brand-led business model. The role of our brands is to meet the needs of our customers to consistently
high standards across multiple channels of distribution. The Rank Group sets the strategic direction and provides access to the capital needed to fund
the ambitions of its brands. It also acts as a locus for cost, revenue and expertise synergies.
our businesses
The Rank Group Plc: Annual Report and Financial Statements 2013
12
1The systematic use of data
and customer feedback to drive service and
product improvements
2Capital investment to extend the reach
and broaden the appeal of the leisure
experience we deliver
3Multi-channel
distribution of our brands
Progress 2012/13• Group customer visits were
marginally down
• Grosvenor brand standard applied across the estate
Progress 2012/13• Opened one new G Casino
in Reading (March 2013) and extended our Portsmouth G Casino (December 2012). The Group has also committed to opening a new G Casino in Southend-on-Sea; the casino is expected to open in the first half of 2013/14
• Converted two Mecca venues to Full House format; no further conversions currently committed
• Commenced refurbishment at flagship Victoria casino
Progress 2012/13• One club has been converted
to the Enracha brand
• Launch of online bingo for Enracha deferred until 2013/14
• Limited review of social gaming carried out; further development currently on hold
Priorities 2013/14• Continue to develop our
programme of engagement with our target customers to increase visitation
• Roll out customer satisfaction surveys across the newlyacquired casinos
Priorities 2013/14• Open a new G Casino at
Southend-on-Sea
• Invest into the newly acquired casino estate from Gala Coral and convert 5 into the G Casino format
Priorities 2013/14• Develop live digital casino
to reflect the Grosvenor Casinos venues table gaming experience
• Deliver a cross-channel rewards programme
• Develop mobile strategy to grow mobile further
• Convert third Enracha club
Key risks• Economic environment
Key risks• Loss of licences• Economic environment• Taxation and regulation
Key risks• Loss of licences• Economic environment• Taxation and regulation
Strategic Update
Developing A strategy for growth
The Rank Group Plc: Annual Report and Financial Statements 2013
13
GATHER: 50 EXAMPLES OF BUSINESS MODELS FROM THE FTSE 350
38. Rank Group
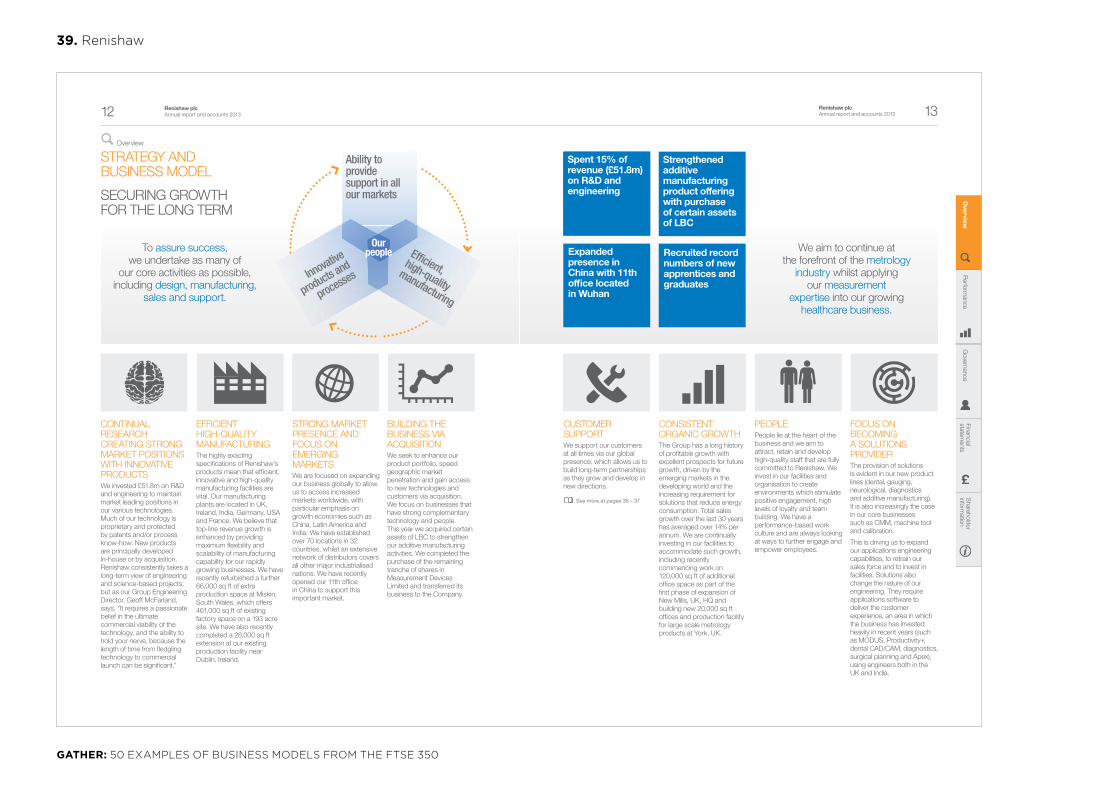
Renishaw plc Annual report and accounts 201312
BUILDING THE BUSINESS VIA ACQUISITIONWe seek to enhance our product portfolio, speed geographic market penetration and gain access to new technologies and customers via acquisition. We focus on businesses that have strong complementary technology and people. This year we acquired certain assets of LBC to strengthen our additive manufacturing activities. We completed the purchase of the remaining tranche of shares in Measurement Devices Limited and transferred its business to the Company.
STRONG MARKET PRESENCE AND FOCUS ON EMERGING MARKETSWe are focused on expanding our business globally to allow us to access increased markets worldwide, with particular emphasis on growth economies such as China, Latin America and India. We have established over 70 locations in 32 countries, whilst an extensive network of distributors covers all other major industrialised nations. We have recently opened our 11th office in China to support this important market.
EFFICIENT HIGH-QUALITY MANUFACTURINGThe highly exacting specifications of Renishaw’s products mean that efficient, innovative and high-quality manufacturing facilities are vital. Our manufacturing plants are located in UK, Ireland, India, Germany, USA and France. We believe that top-line revenue growth is enhanced by providing maximum flexibility and scalability of manufacturing capability for our rapidly growing businesses. We have recently refurbished a further 66,000 sq ft of extra production space at Miskin, South Wales, which offers 461,000 sq ft of existing factory space on a 193 acre site. We have also recently completed a 26,000 sq ft extension at our existing production facility near Dublin, Ireland.
CONTINUAL RESEARCH CREATING STRONG MARKET POSITIONS WITH INNOVATIVE PRODUCTSWe invested £51.8m on R&D and engineering to maintain market leading positions in our various technologies. Much of our technology is proprietary and protected by patents and/or process know-how. New products are principally developed in-house or by acquisition. Renishaw consistently takes a long-term view of engineering and science-based projects, but as our Group Engineering Director, Geoff McFarland, says, “It requires a passionate belief in the ultimate commercial viability of the technology, and the ability to hold your nerve, because the length of time from fledgling technology to commercial launch can be significant.”
Ability to provide support in all our markets
Efficient,high-quality
manufacturing
Ourpeople
Innovative
products and
processes
To assure success, we undertake as many of
our core activities as possible, including design, manufacturing,
sales and support.
Overview
STRATEGY AND BUSINESS MODEL
SECURING GROWTH FOR THE LONG TERM
Shareholder
information
Renishaw plc Annual report and accounts 2013 13
Financial statem
entsG
overnanceP
erformance
Overview
FOCUS ON BECOMING A SOLUTIONS PROVIDERThe provision of solutions is evident in our new product lines (dental, gauging, neurological, diagnostics and additive manufacturing). It is also increasingly the case in our core businesses such as CMM, machine tool and calibration.
This is driving us to expand our applications engineering capabilities, to retrain our sales force and to invest in facilities. Solutions also change the nature of our engineering. They require applications software to deliver the customer experience, an area in which the business has invested heavily in recent years (such as MODUS, Productivity+, dental CAD/CAM, diagnostics, surgical planning and Apex), using engineers both in the UK and India.
PEOPLEPeople lie at the heart of the business and we aim to attract, retain and develop high-quality staff that are fully committed to Renishaw. We invest in our facilities and organisation to create environments which stimulate positive engagement, high levels of loyalty and team building. We have a performance-based work culture and are always looking at ways to further engage and empower employees.
CONSISTENT ORGANIC GROWTHThe Group has a long history of profitable growth with excellent prospects for future growth, driven by the emerging markets in the developing world and the increasing requirement for solutions that reduce energy consumption. Total sales growth over the last 30 years has averaged over 14% per annum. We are continually investing in our facilities to accommodate such growth, including recently commencing work on 120,000 sq ft of additional office space as part of the first phase of expansion of New Mills, UK, HQ and building new 20,000 sq ft offices and production facility for large scale metrology products at York, UK.
CUSTOMER SUPPORTWe support our customers at all times via our global presence, which allows us to build long-term partnerships as they grow and develop in new directions.
We aim to continue at the forefront of the metrology
industry whilst applying our measurement
expertise into our growing healthcare business.
Spent 15% of revenue (£51.8m) on R&D and engineering
Strengthened additive manufacturing product offering with purchase of certain assets of LBC
Expanded presence in China with 11th office located in Wuhan
Recruited record numbers of new apprentices and graduates
See more at pages 36 – 37
GATHER: 50 EXAMPLES OF BUSINESS MODELS FROM THE FTSE 350
39. Renishaw

Customer: placing the customer at the heart of our organisation is key. We need to listen to our customers, share ideas, really understand their needs and then relentlessly focus on delivering our promises.
CUSTOMEROUR STRATEGY
OUR VISION OUR BUSINESS MODEL
Since its earliest days, Rolls-Royce has been striving to achieve ever higher standards. Our vision is delivering ‘better power for a changing world’.
Better: we will succeed only by continually raising standards. We constantly improve quality, performance and cost. We are inquisitive, energetic and ‘better’ every day. Even when we may be the best, we must continue to get better.
Power: we are a power systems company that develops, sells and services mission-critical products. Our customers demand innovation that improves performance and reduces the environmental impact of our power systems.
Changing world: the world around is changing rapidly and the pace of change is accelerating. New markets are emerging, shifting the balance of economic power. Regulation is, rightly, driving the requirement for cleaner power and setting new standards for business conduct. Our continuous investment in technology, our ingenuity and our commitment to excellence allow us to seize the opportunities that change presents and to face the future with confidence.
Better power for a changing world
We operate in competitive markets. Our competitors are well-funded, ambitious and full of smart people.
Our strategy will enable us to win by focusing on three powerful themes: customer; innovation and profitable growth.
The business model is built around our core strategic themes of customer, innovation and profitable growth. We are a power systems company based on two technology platforms, gas turbines and reciprocating engines. Continuous investment in innovation delivers better products and services on behalf of customersof customersof . This allows us to meet their needs and grow profitably to the benefit of our shareholders.
Around the core strategic themes of the model we:
Grow sales for original equipment and the associated aftermarket through developing strong routes to market based on customer relationships, understanding and knowledge. Allocate capitalin a disciplined way, choosing where to grow, and where not to. Reduce costs and generate cash, to enable profitable growth from our order book and the maintenance of a strong balance sheet. Fund research, development, infrastructure and future programmes. Our financial resilience and resources provide a firm foundation from which to invest. Risk and Revenue Sharing Arrangements are a particular feature of the civil aerospace sector as a means of sharing risk due to the scale of investment required for large gas turbines.
Our business model places emphasis on reducing costs so that we can generate the funds we need to deliver our vision of ‘better power for a changing world’.
OUR VISION, BUSINESS MODEL, STRATEGY AND VALUESRolls-Royce is a global Group, providing integrated power solutions for customers in civil and defence aerospace, marine, energy and power markets. Our products work in mission-critical environments where safety is paramount. Read more on pages 14 to 23.
Rolls-Royce Holdings plc annual report 20138 Strategic report
PROFITABLE GROWTHINNOVATIONInnovation: is our lifeblood. We must continually innovate to remain competitive. To drive innovation, we create the right environment – curious, challenging, unafraid of failure, disciplined, open-minded and able to change with pace. But most importantly, we ensure our innovation is relevant to our customers’ needs.
Profitable growth: by focusing on our customers, and offering them a competitive portfolio of products and services, we will create the opportunity to grow our market share. Of course we have got to make sure that we are not just growing, but growing profitably. That means ensuring our costs are competitive. We look after our cash and we win right.
OUR VALUESWe say we are ‘trusted to deliver excellence’, but simply being Rolls-Royce does not give us the right to make that claim. Trust takes a long time to earn and can be lost in an instant.
Trust: is earned by doing what we say we will. It demands care, consistency, courage and competence. Trust commits us to high ethical standards – it is central to who and what we are.
Deliver: part of being trusted. We must deliver on our promises, meeting our customers’ requirements for quality, delivery, responsiveness and reliability, always recognising that the safety of our products and our people is paramount.
Excellence: if we are trusted, and we deliver, then we will be regarded as excellent.
Customer
ProfitablegrowthInnovation
Fund
R&D and infrastructure
Grow sales
Allocate capital to
new g
row
th
Reduce costs, generate cash
Rolls-Royce Holdings plc annual report 2013 9
Strategic reportFinancial statem
entsD
irectors’ reportO
ther information
GATHER: 50 EXAMPLES OF BUSINESS MODELS FROM THE FTSE 350
40. Rolls-Royce Holdings

rpsgroup.com 3
Strategy and Business Model RPS is an international consultancy providing independent advice upon:
� the exploration and production of oil and gas and other natural resources, and
� the development and management of the built and natural environment
� the development of infrastructure to ensure the supply of energy resources to market
We provide a wide range of services for our clients and accordingly operate in a large number of markets both functionally and internationally. The long term drivers of our business are:
� � � the world’s need to secure adequate supplies of energy and other natural resources the world’s need to secure adequate supplies of energy and other natural resources
� � � the commercial advantage resulting from the sustainable development of land and buildings the commercial advantage resulting from the sustainable development of land and buildings
� � � the need to provide adequate infrastructure such as airports, power stations, public transport, water treatment plants and to the need to provide adequate infrastructure such as airports, power stations, public transport, water treatment plants and to deliver energy to market
� � � the need to ensure regulatory compliance and to manage environmental, health and safety risks, including climate change the need to ensure regulatory compliance and to manage environmental, health and safety risks, including climate change
The markets in which we operate develop rapidly and so our strategy needs to be sufficiently flexible to ensure that we can respond quickly to changing conditions. Our strategy is to operate in those markets that have sound long term prospects and where we can potentially achieve leading market positions.
Our key objectives are to:
� focus on delivering value added services which generate high margins;
� � � extend our range of services and geographical cover by bringing high quality specialist companies into the Group and then support them to achieve further growth, and
� convert profit into cash and manage our balance sheet effectively.
Each year the Board sets a series of priorities consistent with these objectives as well as prevailing conditions and reviews progress against those priorities on a regular basis. Within that context we seek to improve continuously the range and quality of the services we offer our clients and where we best can add value to their activities. We are aiming to build a multi-disciplinary business in North America similar to those we have in Europe and Australia as well as building a presence in the developing world through oil and gas exploration as well as production projects.
The development of our business in this way is also important in attracting and retaining high quality employees. This is achieved by providing opportunities for professional growth and advancement as well as by providing competitive remuneration and benefits packages, and striving to maintain an open, creative and positive culture.
Client retention and the maintenance of longstanding relationships with our clients are at the heart of our success. We achieve this by seeking to deliver focussed and cost-effective advice on both well understood problems and emerging challenges. We also maintain an international reputation for meeting the challenges posed by large complex projects and conducting business in an open and responsible manner.
The scale, increasing diversity and geographical spread of our businesses requires us to monitor continuously and seek to improve the operational efficiency of our businesses. This entails consideration of management organisation, controls, processes, systems and support services.
We plan to grow organically and through acquisitions that broaden and deepen the services that we can offer our clients. Acquisitions have played an important part in our growth in the past and will continue to be a key part of our strategy. We acquire businesses that are well managed, deliver sound results and have good reputations in their markets. They may be in sectors where we are already operating or offer services that are closely related to our own. We already have well established and strong businesses in a number of countries, which provide a platform for organic and acquisitive growth there.
During 2013 we successfully completed acquisitions in Australia, Canada, USA, Norway and the United Kingdom. We are seeking to acquire further high quality businesses in North America, Australia and Europe and the Board will consider larger acquisitions as well as acquisitions in countries in which we do not currently operate that are consistent with our overall strategy and provide our international clients with greater local support.
Strategic Review
Report and Accounts 20134
Our strategy for growth consists of the following elements:
� � � as global growth picks up we see Energy, Energy Infrastructure and Urban Infrastructure as being strongly positioned;
� in Energy we want to continue to strengthen our skill base internationally;
� � � in North America we want to add to our existing portfolio of services, particularly broadening into Built and Natural Environment as well as building on our energy market presence to capture more of the global energy infrastructure market;
� in Europe we see signs of recovery and emerging opportunity;
� in AAP after the resources boom the Australian economy is re balancing and will remain our gateway to Asia Pacific.
The Key Performance Indicators the Group employs are those shown on page 2. These are monitored monthly and provide the means by which the Board measures the success of its strategy.
Group Structure As indicated above our business is an international consultancy providing independent advice that relates to oil and gas and natural As indicated above our business is an international consultancy providing independent advice that relates to oil and gas and natural As indicated above our business is an international consultancy providing independent advice that relates to oil and gas and naresources as well as to the built and natural environment. The Group’s services in relation to energy infrastructure draw upon expertise from within both of these areas.
Energy
This is the advice we provide to our clients upon the exploration and production of oil, gas and other natural resources comprises technical, commercial and project management support and training in the fields of geoscience, engineering, health, safety and environment. It is provided on a multi-disciplinary and integrated basis anywhere in the world. We aim to assist clients’ development of their energy resources across the complete life cycle, combining technical and commercial skills with an extensive knowledge of environmental and safety issues.
The business has regional offices in the UK, USA, Canada, Australia, Norway, Singapore and Malaysia and undertakes projects in many other countries.
With the exception of our Australian and Asia Pacific offices they are managed by a single Board supported by a number of operating With the exception of our Australian and Asia Pacific offices they are managed by a single Board supported by a number of operating With the exception of our Australian and Asia Pacific offices they are managed by a single Board supported by a number of operaBoards. We report the results of the business managed by this single Board as the Energy segment.
Our Australian and Asian offices are managed on a regional basis by a Board that has responsibility for both our Energy and our Built Our Australian and Asian offices are managed on a regional basis by a Board that has responsibility for both our Energy and our Built Our Australian and Asian offices are managed on a regional basis by a Board that has responsibility for both our Energy and ourand Natural Environment offices in this region.
Built and Natural Environment
This is the advice we provide to our clients upon the built and natural environment includes planning, urban design and regeneration, This is the advice we provide to our clients upon the built and natural environment includes planning, urban design and regeneration, This is the advice we provide to our clients upon the built and natural environment includes planning, urban design and regenerenvironmental assessment and management, transport and infrastructure, architecture and landscape, engineering and surveying. We also provide services in the areas of environmental science, the management of water resources, health safety and risk management, laboratory testing, asbestos consulting, air quality, noise, property and oceanography. Our advice is provided on a regional basis from offices in Europe, Australia and North America.
Our regional businesses in Europe and North America are each managed by a single board supported by a number of operating boards. We present the results of each of these two businesses as separate reporting segments. As noted above and due to the integrated nature of the environmental and energy infrastructure markets in that area, the Built and Natural Environment business in Australia Asia nature of the environmental and energy infrastructure markets in that area, the Built and Natural Environment business in Australia Asia nature of the environmental and energy infrastructure markets in that area, the Built and Natural Environment business in AustrPacific is managed with the Energy business under a single Board. The results of this combined business are presented as single reporting segment covering all of our operations in Australia Asia Pacific (‘AAP’).
Energy Infrastructure
We provide advice on the development of the infrastructure for generating energy from renewable sources, storing and transporting hydrocarbons and transmitting energy and power. These components are essential for maintaining energy supply and energy security. These services combine skills from within our Energy and Built and Natural Environment businesses in order to deliver the required multi-disciplinary solutions.
Further Information
A sample of the projects and activities that we undertake is described on our website at www.rpsgroup.com.
GATHER: 50 EXAMPLES OF BUSINESS MODELS FROM THE FTSE 350
41. RPS Group

Superior investment performance and excellent client service are key to growing assets under management.
Investment
Institutional clients – Corporate pension plans – Insurance companies – Official Institutions
Client service through our worldwide offices
Equities
Emerging Market Debt, Commodities and Property
Fixed Income
Multi-asset
Employees
2,925 peopleAssets under management
£232.8bn
Manages investment capital of
£677mFor more information on our wider corporate responsibilities see page 42.
Our business model
Schroders’ objective is to add value to our clients’ capital to help them meet their future needs. Clients include corporate and state pension funds, government funds, financial institutions, charities and individuals. Meeting the long-term financial needs of these clients has never been more important. We strive to create innovative products and solutions which help clients meet their goals. Our success is linked inextricably to the success of our clients in that it is only by meeting their objectives that our business will prosper. Stemming from the stable ownership structure Schroders has enjoyed throughout its 210-year history, we have a long-term focus in relation to investing, building client relationships and growing our business.
22 Schroders | Annual Report and Accounts 2013
Our business model
Asset Management
Our operating segments
Infrastructure
Group
Portfolio management and wealth planning capability
Specialised lending
Deposit taking and cash management
Custody and execution
Distribution
Intermediary clients and relationships – Banks – Independent financial advisers – Insurance companies – Individual pension plans – Platforms
Wealth Management clients – High net worth individuals – Family offices – Charities
Client service through our worldwide offices Wealth Management in 15 locations
•Tier 1 capital ratio of 27 per cent.•Highly personalised investment management service•Customised investment solutions geared to client-specific
financial goals
Employees
595 peopleAssets under management
£232.8bn
Allocates capital to seed new investment strategies before bringing them to the Institutional or Intermediary market.
Assets under management
£30.1bn
Supports the business in delivering superior investment performance and excellent client service. It consists of information technology, operations, finance, risk management, human resources, legal, compliance and internal audit.
The non-operating Group segment is focused on capital management, governance and corporate management.
Product development
Sales specialists, client servicing, marketing and communications
Product specialist sales resources
See page 24 See page 26
We have two operating segments: Asset Management and Wealth Management, which are supported by several infrastructure functions. The Group segment includes investment capital and treasury management activities.
Schroders | Annual Report and Accounts 2013 23
Strateg
ic repo
rtS
trategyWealth Management
GATHER: 50 EXAMPLES OF BUSINESS MODELS FROM THE FTSE 350
42. Schroders
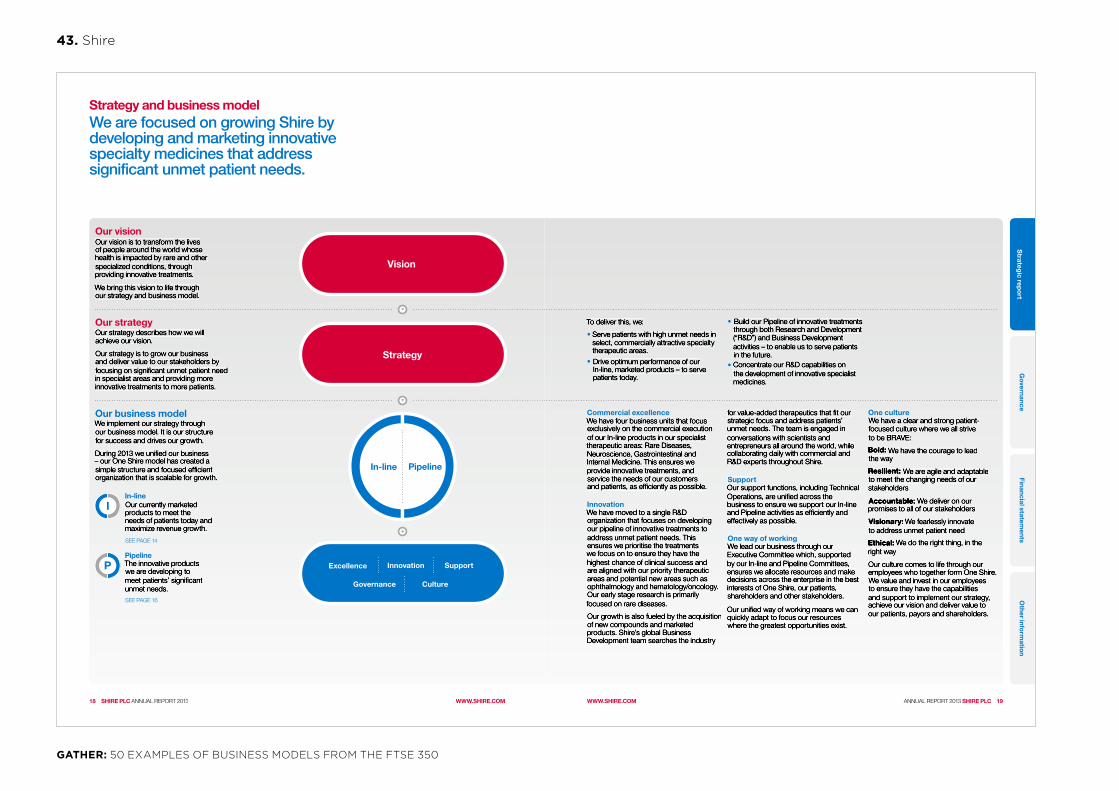
Strategy
Vision
In-line Pipeline
InnovationExcellence Support
CultureGovernance
Our visionOur vision is to transform the lives of people around the world whose health is impacted by rare and other specialized conditions, through providing innovative treatments.
We bring this vision to life through our strategy and business model.
Our strategyOur strategy describes how we will achieve our vision.
Our strategy is to grow our business and deliver value to our stakeholders by focusing on significant unmet patient need in specialist areas and providing more innovative treatments to more patients.
Our business modelWe implement our strategy through our business model. It is our structure for success and drives our growth.
During 2013 we unified our business – our One Shire model has created a simple structure and focused efficient organization that is scalable for growth.
Strategy and business modelWe are focused on growing Shire by developing and marketing innovative specialty medicines that address significant unmet patient needs.
In-lineOur currently marketed products to meet the needs of patients today and maximize revenue growth.
SEE PAGE 14
PipelineThe innovative products we are developing to meet patients’ significant unmet needs.
SEE PAGE 16
18 SHIRE PLC ANNUAL REPORT 2013 WWW.SHIRE.COM
To deliver this, we:
• Serve patients with high unmet needs in select, commercially attractive specialty therapeutic areas.
• Drive optimum performance of our In-line, marketed products – to serve patients today.
• Build our Pipeline of innovative treatments through both Research and Development (“R&D”) and Business Development activities – to enable us to serve patients in the future.
• Concentrate our R&D capabilities on the development of innovative specialist medicines.
Commercial excellenceWe have four business units that focus exclusively on the commercial execution of our In-line products in our specialist therapeutic areas: Rare Diseases, Neuroscience, Gastrointestinal and Internal Medicine. This ensures we provide innovative treatments, and service the needs of our customers and patients, as efficiently as possible.
InnovationWe have moved to a single R&D organization that focuses on developing our pipeline of innovative treatments to address unmet patient needs. This ensures we prioritise the treatments we focus on to ensure they have the highest chance of clinical success and are aligned with our priority therapeutic areas and potential new areas such as ophthalmology and hematology/oncology. Our early stage research is primarily focused on rare diseases.
Our growth is also fueled by the acquisition of new compounds and marketed products. Shire’s global Business Development team searches the industry
for value-added therapeutics that fit our strategic focus and address patients’ unmet needs. The team is engaged in conversations with scientists and entrepreneurs all around the world, while collaborating daily with commercial and R&D experts throughout Shire.
SupportOur support functions, including Technical Operations, are unified across the business to ensure we support our In-line and Pipeline activities as efficiently and effectively as possible.
One way of working We lead our business through our Executive Committee which, supported by our In-line and Pipeline Committees, ensures we allocate resources and make decisions across the enterprise in the best interests of One Shire, our patients, shareholders and other stakeholders.
Our unified way of working means we can quickly adapt to focus our resources where the greatest opportunities exist.
One cultureWe have a clear and strong patient-focused culture where we all strive to be BRAVE:
Bold: We have the courage to lead the way
Resilient: We are agile and adaptable to meet the changing needs of our stakeholders
Accountable: We deliver on our promises to all of our stakeholders
Visionary: We fearlessly innovate to address unmet patient need
Ethical: We do the right thing, in the right way
Our culture comes to life through our employees who together form One Shire. We value and invest in our employees to ensure they have the capabilities and support to implement our strategy, achieve our vision and deliver value to our patients, payors and shareholders.
WWW.SHIRE.COM ANNUAL REPORT 2013 SHIRE PLC 19
Strateg
ic repo
rtG
overnanceFinancial statem
entsO
ther info
rmatio
n
GATHER: 50 EXAMPLES OF BUSINESS MODELS FROM THE FTSE 350
43. Shire
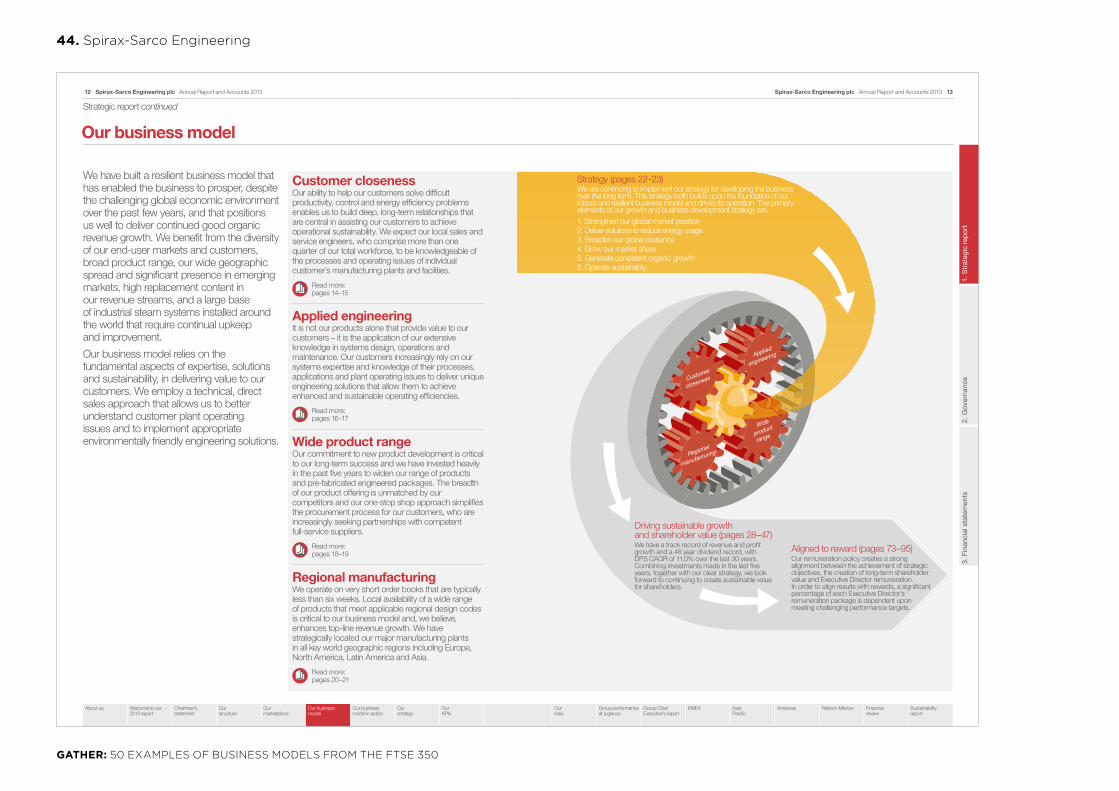
Spirax-Sarco Engineering plc Annual Report and Accounts 201312
Welcome to our 2013 report
Chairman’s statement
Ourstructure
Ourmarketplace
Our businessmodel in action
Ourstrategy
OurKPIs
Our businessmodel
About us
Our business model
Strategic report continued
We have built a resilient business model that has enabled the business to prosper, despite the challenging global economic environment over the past few years, and that positions us well to deliver continued good organic revenue growth. We benefit from the diversity of our end-user markets and customers, broad product range, our wide geographic spread and significant presence in emerging markets, high replacement content in our revenue streams, and a large base of industrial steam systems installed around the world that require continual upkeep and improvement.
Our business model relies on the fundamental aspects of expertise, solutions and sustainability, in delivering value to our customers. We employ a technical, direct sales approach that allows us to better understand customer plant operating issues and to implement appropriate environmentally friendly engineering solutions.
Customer closenessOur ability to help our customers solve difficult productivity, control and energy efficiency problems enables us to build deep, long-term relationships that are central in assisting our customers to achieve operational sustainability. We expect our local sales and service engineers, who comprise more than one quarter of our total workforce, to be knowledgeable of the processes and operating issues of individual customer’s manufacturing plants and facilities.
Read more: pages 14–15
Applied engineeringIt is not our products alone that provide value to our customers – it is the application of our extensive knowledge in systems design, operations and maintenance. Our customers increasingly rely on our systems expertise and knowledge of their processes, applications and plant operating issues to deliver unique engineering solutions that allow them to achieve enhanced and sustainable operating efficiencies.
Read more: pages 16–17
Wide product rangeOur commitment to new product development is critical to our long-term success and we have invested heavily in the past five years to widen our range of products and pre-fabricated engineered packages. The breadth of our product offering is unmatched by our competitors and our one-stop shop approach simplifies the procurement process for our customers, who are increasingly seeking partnerships with competent full-service suppliers.
Read more: pages 18–19
Regional manufacturingWe operate on very short order books that are typically less than six weeks. Local availability of a wide range of products that meet applicable regional design codes is critical to our business model and, we believe, enhances top-line revenue growth. We have strategically located our major manufacturing plants in all key world geographic regions including Europe, North America, Latin America and Asia.
Read more: pages 20–21
drie
Strate
gic
1Spirax-Sarco Engineering plc Annual Report and Accounts 2013
1. S
trat
egic
rep
ort
2. G
over
nanc
e3.
Fin
anci
al s
tate
men
ts
Our risks
Group performance at a glance
Group Chief Executive’s report
EMEA Asia Pacific
Americas Watson-Marlow Financial review
Sustainability report
Strategy (pages 22–23)We are continuing to implement our strategy for developing the business over the long term. This strategy both builds upon the foundation of our robust and resilient business model and drives its operation. The primary elements of our growth and business development strategy are:1. Strengthen our global market position2. Deliver solutions to reduce energy usage3. Broaden our global presence4. Grow our market share5. Generate consistent organic growth6. Operate sustainably.
Driving sustainable growth and shareholder value (pages 28–47)We have a track record of revenue and profit growth and a 46 year dividend record, with DPS CAGR of 11.0% over the last 30 years. Combining investments made in the last five years, together with our clear strategy, we look forward to continuing to create sustainable value for shareholders.
Aligned to reward (pages 73–95)Our remuneration policy creates a strong alignment between the achievement of strategic objectives, the creation of long-term shareholder value and Executive Director remuneration. In order to align results with rewards, a significant percentage of each Executive Director’s remuneration package is dependent upon meeting challenging performance targets.
GATHER: 50 EXAMPLES OF BUSINESS MODELS FROM THE FTSE 350
44. Spirax-Sarco Engineering

06 St. Modwen Properties PLC Annual Report and Financial Statements 2013
Assetmanagementexpertise
emediationexpertise
lanning
expertise
Constructionexpertise
nderpins
runningcosts
ofthebusiness
Regeneration and
sustainability at our heart
elivery
thelandbank ecurringincome
Assetmanagem
ent
alesofassets
providecapital
forinvestm
ent
iverseand
extensiveportfolio
ncreases
portfoliovalue
trategic eportourbusinessmodel
Whatmakes t. odwenthe sleadingregenerationspecialist?
St. Modwen Properties PLC Annual Report and Financial Statements 2013 07
Strategic R
eportC
orporate Governance
Financial Statem
entsA
dditional Information
The land bank
Asset management
Recurring income
Delivery
ourlong-termviewallowsustoacquireassetsatlowcost andthenmaximisetheirpotentialbysteadilyaddingvaluetothemovertimethroughremediationandplanning.thenattheappropriatetimeweeitherdisposeoftheassettorealiseanyincreaseinvalueorreleaseitfor developmentourselvesorinjointventure.
Whatdifferentiatesus?thediverseandextensivenatureofour£1.1bnlandbankprovidesuswiththeflexibilitytomovewithmarketdemandsand,coupledwithourlocalexpertise,meanswecanpursuevalue-creatingopportunities.Aconsiderableproportionofourlandbankisheldatrelativelylowvalue,givingusaccesstoawidevarietyofdevelopmentopportunitieswithouttheneedfor significantfinancing.
See pages 08–09
Weincreasethevalueofourlandbankovertimeusingourexpertiseinandhands-onapproachtoremediationandregeneration,managingsites,publicconsultationandtheplanningprocess.ourskillscanbeappliedeffectivelytosmall developmentsorbeusedtonavigatecomplexandlong-termprojects.
Whatdifferentiatesus?ourabilitytoprogressourlandbanksuccessfullythroughtheplanningprocessandourexpertiseinbrownfieldlandremediationandotheraspectsofregenerationmakeusanattractivepartnertobothlandownersandpublicbodies.theskillandexperienceofourpeopleisfundamentaltothesuccessofourassetmanagementactivitiesandwecontinuetoretain,developandincentivisethem.
See pages 12–13
Whilstallofourassetsareultimatelyheldwithaviewtogeneratingsignificantfuturevalue,somealsoproduceasteadyincomestreampriortodevelopmentwhichunderpinstherunningcostsofthebusiness.thisensuresthatcommitmentscanbemetifdevelopmentprofitsfallandenablesustoextractthemaximumvaluefromourlandbankin theshort-term.
Whatdifferentiatesus?Weemploylocally-basedassetmanagementcapabilitytomanagetheassetsasefficientlyaspossible.Wetypicallyofferlowaffordablerentsonrelativelyshorttenancieswhichensurethatvoidsremainattheirlowestpossiblelevelaswepreparesitesfordevelopment.thediversityofoccupiersinourincomeproducingpropertieshelpsustoavoidoverexposuretoasinglescheme,sectorortenant.
See pages 10–11
Whenweareunabletoaddanyfurthersignificantvaluetoanasset,weseekmarket-drivenopportunitiestodisposeofit,eitherthroughthedeliveryofpre-letandpre-soldbuildingsorthesaleofland.Cashgeneratedonthesaleprovidesrecycledcapitaltoinvestinthebusinessandsupportsthedeliveryoflong-termshareholdervaluecreationthroughaprogressivedividendpolicy.
Whatdifferentiatesus?Wecontinuetofindgooddevelopmentopportunitiesthatarenotreliantonspeculativedevelopment.Whereindustrialandcommercialoccupiershaveimmediaterequirementsfornewpremises,weareabletoreactquicklytomeettheirdemandswithsitesthatalreadybenefitfromplanning.ourregenerationprojectscontinuetoserveascatalystsforchange,impactingpositivelyonthelocaleconomyandattractingavarietyof occupiers.
See pages 14–15
GATHER: 50 EXAMPLES OF BUSINESS MODELS FROM THE FTSE 350
45. St Modwen Properties
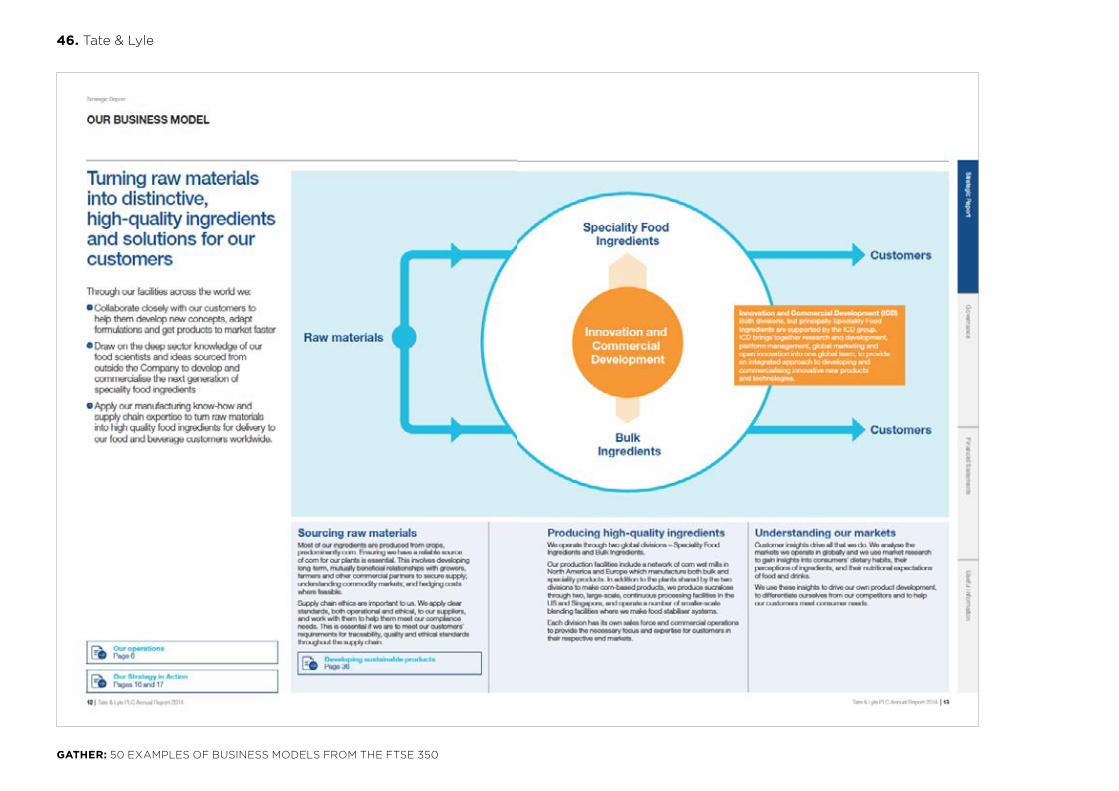
GATHER: 50 EXAMPLES OF BUSINESS MODELS FROM THE FTSE 350
46. Tate & Lyle

Develop economies of scale
Invest in our offer for custom
ers
Drive customer loyalty
Gro
w s
ales
Innovating our offer Establishing a multichannel
Operating responsi bly
Dev
elop
ing
our p
eopl
e
Building the Tesco brand Using our scale for good
sk
ill an
d sc
ale
Levera
ging
Gro
up
for customers offer for customers
Sell
Insight
Move
Buy
We m
ake what matters better, t
ogeth
er
Core Purpose
Our business model explains what we do and how we deliver our core purpose for customers. It is built up around four core retail activities, insight, buy, move and sell. Our key enablers make us unique and help us to continually do these things better.
Visit www.tescoplc.com/businessmodel to watch a short animation explaining how our business model works
10 Tesco PLC Annual Report and Financial Statements 2014
Business model
The key enablers
T
As a retailer, our business model is based on four core activities. Using our unrivalled insight to understand what customers want, we buy products and services from suppliers, move them through our distribution network and sell them to customers. Most importantly, our core purpose is at the heart of these activities. It is by improving these activities for customers each time they shop with us that we make what matters better, together.
Across the Group, our customers visit us in store, online, or through a combination of different formats and channels. They come to buy their groceries, clothing, general merchandise and services such as telecoms, digital entertainment and banking. We are focused on providing customers with the most compelling offer and the best shopping trip. We work with our suppliers to offer an excellent range of products and services. We move the products through our modern and efficient supply chain into our well-located, multi-format store network, ready for customers to shop with us 24 hours a day.
The core activities form a cycle. To keep customers coming back, we are constantly strengthening our operation. This starts with insight. We listen to customers in a number of ways, including through our monthly Customer Viewpoint surveys in UK stores, in-depth focus groups with our Tesco Families and dedicated Customer Question Time sessions. Combining this feedback with our data, including the unique insight we gain from Clubcard, and acting on it is crucial to our success.
Our seven key enablers are our business strengths. They help us to sustain and improve our core activities. These elements are what make us different and it’s because of these that we are uniquely placed to win.
For example, establishing multichannel leadership and building a seamless offer will enable customers to shop however, whenever and wherever they want, which will mean that we stand out for customers.
Another example is leveraging our Group skill and scale, which is all about sharing our experiences across our operations. We trial in one area of the business and transfer the learnings to another, whether it’s sharing the loyalty scheme blueprint internationally or building capital-efficient grocery home shopping businesses in new markets. Being able to leverage our Group skill and scale makes us unique and helps us to perform the core activities even better.
The momentum of our business model comes from the virtuous circle. By developing economies of scale and investing in an ever-improving customer offer, we drive loyalty and grow sales.
Developing and using economies of scale across our business all over the world, enables us to improve the customer offer by investing in areas such as price, range, quality and service. This year, for example, we completed the roll-out of grocery home shopping to all of our markets (except India). It is a service we developed in the UK and have rolled out in a capital-efficient way to our international businesses, with a great customer response.
Doing the right thing for customers is central to the business model. It’s why one of our Values is ‘no-one tries harder for customers’; we know that if we do the right thing for customers, they will reward us with their loyalty. The more pleased customers are with the shopping trip, the more loyal they will be and the more we will grow our sales. This combination of scale and growth is the driving force of the business model.
38 millionClubcard customers shopping in our 7,300 stores across the Group give us unrivalled insight into consumer habits, trends and preferences.
59.7%of our UK customers shop across two or more channels, including stores and online.
12 marketswith retail operations delivering 85 million customer shopping trips each week.
Oth
er info
rmatio
nG
overnan
ceFin
ancial statem
ents
Strateg
ic repo
rt
Tesco PLC Annual Report and Financial Statements 2014 11
Our core activities
The virtuous circle
GATHER: 50 EXAMPLES OF BUSINESS MODELS FROM THE FTSE 350
47. Tesco

04 UBM plc Annual Report and Accounts 2013
Strategic Report
UBM’s business model UBM is structured to ensure that our geographic and sector understanding benefits our customers and helps them succeed.
One of our key strengths is the quality of our relationships with the sectors we serve and understanding the needs of our customers
• physical space, attendance or sponsorship at events;• advertising and sponsorship on websites and in
publications; and• lead generation services.
Events
PR Newswire
Other Marketing Services
59%
25%
16%
Business Model: Events and OtherMarketing Services
Revenues are principally generated by selling:
Events and Other
Marketing Services
Help
Foster
Sell Attract
C
reat
e
Hel
p cl
ient
s ach
ieve their b
usiness goals
from
exp
osure to
which audience
(e.g
. bra
nd pro
fi le, b
usiness leads)Foster relationships w
ith,
and understanding of, a specifi c
sector or community
conf
eren
ce, w
ebsi
te, p
ub
licat
ion
)
and/
or le
arn
(e.g
. tra
des
how
,
com
mun
ity
to t
rans
act,
net
wo
rk
Crea
te a
n en
viro
nmen
t fo
r t h
at
and marketing expertise
environment through quality contentAttract a qualifi ed audience to that
in th
at environment
qu
alifi ed audienceS
ell access to the
UBM plc Annual Report and Accounts 2013 05
Strategic Report
Financial Statements
Governance
PR Newswire’s key strengths include the quality, breadth and depth of its network which includes 10,700 syndicated websites and 543,379 journalists and influencers in its global database. Its leadership in multi-media and superior editorial service is highly valued by its customers
• number of press releases distributed for clients;• value-added multi-media distribution services (e.g.
breadth of distribution, additional digital content); and• IR professionals (e.g. targeting and monitoring
workflow platforms).
Business Model:PR Newswire
Segment Business Unit Geography Key Sectors
Events & Other Marketing Services UBM Asia Principally China and Hong Kong, also includes India and ASEAN
Fashion, Lifestyle, Trade & Transport
Events & Other Marketing Services UBM Live UK, Continental Europe, Brazil and Turkey Ingredients, Built Environment, Lifestyle, Trade & Transport
Events & Other Marketing Services UBM Tech North America Technology
Events & Other Marketing Services UBM Connect North America Health and Advanced Manufacturing
PR Newswire PR Newswire North America, Continental Europe, South America and Asia
Public Relations, Investor Relations and Marketing Communications
Key business drivers:
Monitor
Create
Report and A
nalyse Distribute
Ta
rget
PR Newswire
N
ETW
ORK EFFECTMon
itor a
udience
conversations and
enga
gem
en
t and enable customers to
resp
ond
and jo
in the conversation
Collaborate with our customers
to create broadcast and
webcast productions and
high engagement
multi-media releases
journalists and infl uences across the globe11,000 syndicated websites and 500,000
content across our network of nearly Distribute customer releases and
investmen
t to our customers
distrib
utio
ns to provide return on
Rep
ort an
d analyse results of
med
ia p
ick-
up a
nd c
onte
nt
dis
cove
ry
chan
nel a
nd/o
r in
divi
dual
s) fo
r o
pti
mal
best t
arge
t aud
ienc
es (e
.g. i
den
tify
wh
ich
Advis
e cu
stom
ers
as t
o h
ow t
o
GATHER: 50 EXAMPLES OF BUSINESS MODELS FROM THE FTSE 350
48. UBM
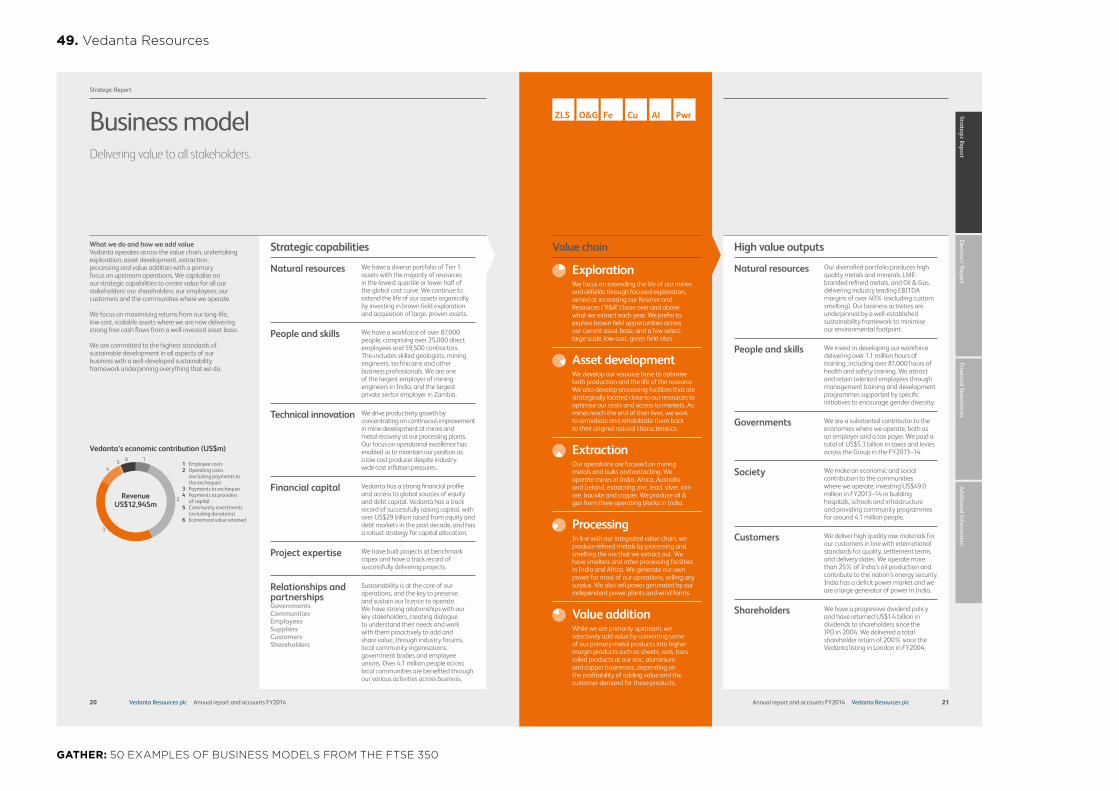
20 Vedanta Resources plc Annual report and accounts FY2014
Vedanta’s economic contribution (US$m)
RevenueUS$12,945m
1 Employee costs2 Operating costs (excluding payments to the exchequer)3 Payments to exchequer4 Payments to providers of capital5 Community investments (including donations)6 Economical value retained
1
2
3
45 6
Strategic Report
Business modelDelivering value to all stakeholders.
What we do and how we add valueVedanta operates across the value chain, undertaking exploration, asset development, extraction, processing and value addition with a primary focus on upstream operations. We capitalise on our strategic capabilities to create value for all our stakeholders: our shareholders; our employees; our customers and the communities where we operate.
We focus on maximising returns from our long-life, low cost, scalable assets where we are now delivering strong free cash flows from a well-invested asset base.
We are committed to the highest standards of sustainable development in all aspects of our business with a well-developed sustainability framework underpinning everything that we do.
Strategic capabilities
Natural resources We have a diverse portfolio of Tier 1 assets with the majority of resources in the lowest quartile or lower half of the global cost curve. We continue to extend the life of our assets organically by investing in brown field exploration and acquisition of large, proven assets.
People and skills We have a workforce of over 87,000 people, comprising over 25,000 direct employees and 59,500 contractors. This includes skilled geologists, mining engineers, technicians and other business professionals. We are one of the largest employer of mining engineers in India, and the largest private sector employer in Zambia.
Technical innovation We drive productivity growth by concentrating on continuous improvement in mine development at mines and metal recovery at our processing plants. Our focus on operational excellence has enabled us to maintain our position as a low cost producer despite industry-wide cost inflation pressures.
Financial capital Vedanta has a strong financial profile and access to global sources of equity and debt capital. Vedanta has a track record of successfully raising capital, with over US$29 billion raised from equity and debt markets in the past decade, and has a robust strategy for capital allocation.
Project expertise We have built projects at benchmark capex and have a track record of successfully delivering projects.
Relationships and partnershipsGovernmentsCommunitiesEmployeesSuppliersCustomersShareholders
Sustainability is at the core of our operations, and the key to preserve and sustain our licence to operate. We have strong relationships with our key stakeholders, creating dialogue to understand their needs and work with them proactively to add and share value, through industry forums, local community organisations, government bodies and employee unions. Over 4.1 million people across local communities are benefited through our various activities across business.
Strategic ReportD
irectors’ ReportFinancial Statem
entsAdditional Inform
ation
21Vedanta Resources plcAnnual report and accounts FY2014
High value outputs
Natural resources Our diversified portfolio produces high quality metals and minerals, LME-branded refined metals, and Oil & Gas, delivering industry leading EBITDA margins of over 40% (excluding custom smelting). Our business activities are underpinned by a well-established sustainability framework to minimise our environmental footprint.
People and skills We invest in developing our workforce delivering over 1.1 million hours of training, including over 81,000 hours of health and safety training. We attract and retain talented employees through management training and development programmes supported by specific initiatives to encourage gender diversity.
Governments We are a substantial contributor to the economies where we operate, both as an employer and a tax payer. We paid a total of US$5.3 billion in taxes and levies across the Group in the FY2013–14.
Society We make an economic and social contribution to the communities where we operate, investing US$49.0 million in FY2013–14 in building hospitals, schools and infrastructure and providing community programmes for around 4.1 million people.
Customers We deliver high quality raw materials for our customers in line with international standards for quality, settlement terms and delivery dates. We operate more than 25% of India’s oil production and contribute to the nation’s energy security. India has a deficit power market and we are a large generator of power in India.
Shareholders We have a progressive dividend policy and have returned US$1.4 billion in dividends to shareholders since the IPO in 2004. We delivered a total shareholder return of 200% since the Vedanta listing in London in FY2004.
Value chain
ExplorationWe focus on extending the life of our mines and oilfields through focused exploration, aimed at increasing our Reserve and Resources (‘R&R’) base over and above what we extract each year. We prefer to explore brown field opportunities across our current asset base, and a few select, large scale, low-cost, green field sites.
Asset developmentWe develop our resource base to optimise both production and the life of the resource. We also develop processing facilities that are strategically located close to our resources to optimise our costs and access to markets. As mines reach the end of their lives, we work to remediate and rehabilitate them back to their original natural characteristics.
ExtractionOur operations are focused on mining metals and bulks and extracting. We operate mines in India, Africa, Australia and Ireland, extracting zinc, lead, silver, iron ore, bauxite and copper. We produce oil & gas from three operating blocks in India.
ProcessingIn line with our integrated value chain, we produce refined metals by processing and smelting the ore that we extract out. We have smelters and other processing facilities in India and Africa. We generate our own power for most of our operations, selling any surplus. We also sell power generated by our independent power plants and wind farms.
Value additionWhile we are primarily upstream, we selectively add value by converting some of our primary metal products into higher margin products such as sheets, rods, bars rolled products at our zinc, aluminium and copper businesses, depending on the profitability of adding value and the customer demand for these products.
ZLS O&G Fe Cu Al Pwr
GATHER: 50 EXAMPLES OF BUSINESS MODELS FROM THE FTSE 350
49. Vedanta Resources

AND THE WINNER IS...
There are all sorts of definitions of business models, and even more interpretations. Our definition is “A clear explanation of how the company creates, consumes, conserves and captures value for the shareholder, distinctively, in the short, medium and long term, across its whole value chain”. This may, or may not, be a diagram, but it certainly needs a lucid, verbal articulation.
There are a dozen or so that are good this year, but two stand out: REXAM and United Utilities Group. One of the main reasons is that they actually do have a primary focus on delivering value to the shareholder, whereas many other models focus on the customer and neglect the shareholder, to a greater or lesser extent.
Both are really very good and definitely worth a look; both talk about capturing value for the
shareholder, and also for other stakeholders. Both are distinctive – they are definitely their own business models, not generic ones.
United Utilities Group focuses on the short and long term, with a useful discussion on assets and value conservation, but REXAM has an edge.
And that edge is the clear positioning of REXAM in the value chain – the reader understands what REXAM does, and does not do, and also what it relies on others to do. It also explains how value is created, consumed, conserved and captured. The diagrams are helpful to illustrate the concepts set out in the text. The other clincher is the position of the business model in the narrative logic flow. It has been placed in context by the preceding market review, and is followed by the discussion of the strategy, which is consequent upon the business model.
GATHER: 50 EXAMPLES OF BUSINESS MODELS FROM THE FTSE 350
50. OUR CHOICE: REXAM

How we create value
A long-term approach is essential to creating value
Longer-term Today we benefit from the strategic decisions and work delivered by our predecessors over the previous 150 years to provide the North West with good quality water and to reduce the environmental impact of the wastewater we treat. The work we do today will help to ensure customers of the North West continue to enjoy an effective, efficient service for many generations to come.
EmployeesWe can increase long-term value generation through the strategic direction and decisions we take and through the hard work of our employees. It is important that we create and retain an engaged and talented team in order to deliver this and we place a strong emphasis on providing comprehensive training and development opportunities. Management has a range of incentives which focus on performance over a number of years, rather than the current year in isolation, to encourage a longer-term approach.
Capital investmentOur fixed assets have a replacement cost of around £80 billion i.e. the estimated amount it would cost for another party to build competing
assets and networks. This means that we are a natural regional monopoly. However, it is not the replacement cost of our assets upon which we are allowed to earn a return, through our revenues. We earn a return on our Regulatory Capital Value (RCV), which is currently close to £10 billion, so it is this asset value which is more important economically.
Many of our assets are long-term in nature: for example, our impounding reservoirs have a useful economic life of around 200 years with some sewers having a life of up to 300 years. By carefully reviewing our potential capital projects, considering the most efficient long-term solutions, we can save future operating costs, also helping to reduce future customer bills.
Since privatisation in 1989, total capital investment of over £13 billion has provided substantial benefits to our customers and our region’s environment. Disciplined investment, along with RPI inflation, also grows our RCV, increasing future revenues.
We need to continue with a substantial investment programme for the foreseeable future in order to meet ever more stringent environmental standards and to maintain and improve the current standards of our assets and services.
However, in deciding on our investment strategy, we also have to be mindful of the impact on our customers’ bills, and this is why, for example, we are spreading some of our currently required environmental spend over the next 15 years.
Regulatory Capital Value (RCV) close to
£10bn
Average life of our term-debt of around
25 years
14 United Utilities Group PLCAnnual Report and Financial Statements 2014
Capital structureIt is important that we continue to attract equity investors to support a robust and responsible capital structure, which enables us to raise new debt. Capital investment is largely financed through a mix of debt and cash generated from our operations. The average life of our term-debt is around 25 years with our final maturity out as far as 2057. By efficiently raising debt at the best possible rates we can help keep our finance costs as low as possible and potentially outperform the industry allowed cost of debt, set by Ofwat every five years.
Regulatory environmentOver a long time frame the regulatory environment can change significantly. In the 25 years since the water industry was privatised we have seen substantial improvements in the regional standards of water quality and wastewater treatment and the cleanliness of rivers and bathing waters. We have also recently seen the progressive implementation of competition for business customers, with full market opening expected in 2017.
Maintaining a good reputation is important to enable positive participation in regulatory discussions. By positively engaging and utilising our industry knowledge, we can help influence future policy with the aim of achieving the best outcome for our customers, shareholders and other stakeholders. We can also help ensure we are well prepared for any changes to the regulatory landscape.
Natural environmentOur region’s natural environment is also changing. Climate change is bringing more extreme weather patterns and we have a long-term strategy to help ensure we have sufficient water resources and are able to meet increased demand on our sewerage network. A phased, long-term approach ensures that the necessary work can be delivered and does not place too much pressure on customer bills.
Planning for future water
demand Read more about our
Water Resource Management Plans by visiting our website: corporate.
unitedutilities.com/waterresourcesplan
PHOTOGRAPH: Network customer technicians Wes Odel (left) and Adrian Booth, helping customers with issues on the wastewater network.
15www.unitedutilities.comStock Code: UU.
Shar
ehol
der i
nfor
mat
ion
Fina
ncia
l sta
tem
ents
Gov
erna
nce
Stra
tegi
c re
port
Strategic report > How we create value
GATHER: 50 EXAMPLES OF BUSINESS MODELS FROM THE FTSE 350
United Utilities Group*
*United Utilities Group’s business model covers pages 14-17.

Business model
Value creation opportunities
Recycled cans
Cash returns toshareholders Taxes Supplier payments Sustainable
development
Salaries and employment and
people development
•Financial capital
•Human capital
•Well invested asset base – Careful capital
allocation
•Understanding user trends
•Supply and demand in balance
•Strong supplier relationships – Aluminium – Inks – Freight
•Sustainability – Licence to operate – Community
engagement
Strategic inputs
•Water•Energy•Aluminium sheet•Recyclate
Materials and resources
•62bn cans annually•Right can at right
price in right place•Innovative solutions
(sizes, finishes, closures)
•Strong relationships•Interdependence
Customers
•Support recovery and recycling of beverage cans
Consumers
Rexam operations 55 plants in five continents•Manufacturing
excellence•Process and
product innovation•Lean principles•Cost management•Inventory
management•Shipping/freight•Sustainable practices
Can and end making
Enterprise risk management
Stakeholder value
Business model
Rexam is a global manufacturer of beverage cans, the vast majority of which are made of aluminium. We make a broad range of can sizes for products such as carbonated soft drinks, beer, energy drinks and other drinks categories. We make approximately 62bn cans a year at 55 plants in five continents. We are part of a supply chain that stretches from ore mining to the consumption of beverages from cans (and their recycling) by the consumer. Within that chain, we have direct control over the manufacture of beverage cans and ends and the financial, human and intellectual capital to make this viable. Our business model (below) is underpinned by clear and consistently applied frameworks for enterprise risk management, including governance and sustainable development.
MANUFACTURINGThe core manufacturing skills around converting sheet metal into beverage cans lie at the heart of our Company. That is where we create the vast majority of our value and generate sustainable competitive advantage. We assume the risk of converting aluminium ingot into coil and of
investing in assets to convert metal sheet into cans for our customers.
Over time, we expect a reward commensurate with this risk. Key to our success and to creating value, therefore, is ensuring a high utilisation of our asset base and our ability to convert aluminium/steel sheet into finished beverage cans and ends at the lowest delivered cost, and as sustainably as possible. We focus on operational excellence using six sigma and lean principles across our operations and processes to reduce cost and material usage (especially aluminium), all the while ensuring the safety and wellbeing of our people.
SUPPLIERSOur aim is to be a key strategic partner for most of our major suppliers who include aluminium, energy, chemical, machinery and freight companies. Aluminium represents almost 50% of our annual cost base: some £2bn annually. We source our metal from well established global aluminium suppliers. We have largely derisked the procurement of aluminium ingot with pass through clauses in customer contracts or long term supply agreements backed by appropriate hedging.
We work closely with all our suppliers to co-develop innovative processes and products. With aluminium, for example, we expect to benefit from developments in aluminium sheet manufacture to help reduce our material usage. With capital equipment suppliers we expect to take advantage of the advances that they make in can making technology to enhance the work we are already doing in this area.
CUSTOMERSFundamental to our success is the establishment of strong and lasting relationships with our customers to ensure that we are the preferred can supplier. Total lowest cost over time is a crucial element of our offering as is our ability to combine our insights, resources and experience to understand our customers’ markets and to provide innovative solutions to their needs. Our customer base is increasingly consolidated and while beverage can making is regional, the larger customers are moving to global procurement models. We are pursuing a key account strategy, including global management of our core global customers, to further align ourselves with them. The location of our can making plants relative to customers’ filling locations is important in minimising logistics and freight costs to ensure low cost supply.
PEOPLE AND CAPABILITIESWe have a highly skilled and motivated workforce, most of whom work in plants, and we develop our people to build a winning organisation and to the requirements of our industry. The complexity of our business is growing with the proliferation of different can sizes and finishes, and shorter product runs. The ability to deliver at low cost in such an environment will become a prime capability. Innovation in products and processes, and our close understanding of the trends affecting our customers, are also critical differentiating factors in shaping our future, as is our constant support and promotion of the beverage can as a viable and sustainable alternative to other drinks packaging.
12 Rexam Annual Report 2013
Create shareholder value by growing while maintaining
ROCE at c 15%
•Returned to shareholders
Surplus cash
•Dividend cover 2.0 – 2.5x
Dividend
•Working capital management
•Strong balance sheet
•Investment grade credit rating
Cash generation
•Protect our strong market positions
•Capture growth, focus on returns
•Organic investment c 1.0x – 1.5x depreciation underpins GDP + growth
• Bolt-on acquisitions
Investment
•Efficiencies and pricing offset cost inflation over time
•Good drop through from increased volume and utilisation
Profit growth GDP ++
•Pack mix change
•New category growth
•Emerging markets growth
Sales growth GDP +
Our aim is to balance growth and returns (measured in return on capital employed: ROCE). In a high investment year, or if we make an acquisition, ROCE may drop slightly, and in a low investment year it may go up: but 15% is the centre of gravity through the cycle.Graham ChipchaseChief executive
SHARED VALUEOur business follows a circle of revenue and profit generation, efficient cash conversion and reinvestment in the business. We share the value we generate with our shareholders through the dividend (see page 80) and with the wider community through employment, salaries, the payment of taxes and supplier payments.
Our aim is to balance growth and returns (measured in return on capital employed: ROCE). In a high investment year, or if we make an acquisition, ROCE may drop slightly, and in a low investment year it may go up: but 15% is the centre of gravity through the cycle. Sales growth is expected to be slightly above the GDP of the countries in which we operate as beverage markets grow and cans take a greater share of the pack mix (as beverage packaging shifts from glass to aluminium and plastic in line with consumer preference and retailer logistics).
We plan for operating efficiencies and pricing to offset cost inflation over time, thereby expecting profits to grow slightly faster than sales. This will translate into strong cash generation which supports a healthy balance sheet and helps maintain an investment grade rating. To underpin sales growth and to protect our business, we will continue to invest at a rate of 1 to 1.5 times depreciation. Any investment in organic growth or bolt-on acquisitions will be determined by where we see the best opportunities to grow with good returns over time. The disciplined allocation of capital is a crucial competency in this respect and, consequently, a source of advantage.
We consider the dividend to be the core element of shareholder remuneration and something on which they should be able to depend. We aim to continue to pay the dividend in line with our policy of 2.0 to 2.5 times cover and return surplus cash to shareholders.
Balancing growth and returns
Overview
Strateg
ic report
Govern
ance
Financia
l statem
ents
Rexam Annual Report 2013 13
GATHER: 50 EXAMPLES OF BUSINESS MODELS FROM THE FTSE 350
REXAM
Gather is a strategic communications consultancy. We join up insight and creativity to develop ideas people gather around, helping organisations build relationships and grow reputation.
We do this by digging for insights and driving them through multiple channels. We focus on stakeholder attitudes and behaviours using our skills in brand, digital, sustainability, reporting and video to achieve practical and measurable results.
For more information, please contact:
Carly Mercer T: +44 (0) 203 176 6600 E: [email protected]


![Final Results 2010 [Presentation slides] - Mitchells & Butlers › pdf › 2010 › results › final_results10_slides.… · Final Results 2010 [Presentation slides] Keywords: Final](https://static.fdocuments.in/doc/165x107/5f2878169df78139e52a7d4d/final-results-2010-presentation-slides-mitchells-butlers-a-pdf-a-2010.jpg)