JoAnn Lense Presented by JoAnn Lense Literacy Intervention Specialist.

September 2007, Volume 63, Issue 3 Supplement,pp.1-49 Introduction S1 Introduction.
J J. Tepas IIII, MD, FACS, FAAP
Editorial Comment S2 EDITORIAL COMMENT.
Judy Schaechter, MD
Simple Things That Work
S3 Unintentional Scald Burns in Children Under 5 Years Old: Common Mechanisms of Injury. G Lowell; K Quinlan
S3 A Home Visitor Program for Improving Home Safety in a Low-Income Community. K K. Kangas; L K. Lee; P Forbes; S K. Osganian; D P. Mooney
S4 Effect of a Child Safety Street Program on Improving Safety Knowledge. R D. Kregenow; D Jaffe
S4 This is RED: A Novel Program For Teen Driving Offenders. B A. Gaines; C M. Vitale; D Jornsay-Hester; L Maloney
S4 All-Terrain Vehicle Safety and Use Patterns in West-Central Illinois Youth. J W. Hafner; S M. Hough; M A. Getz; Y R. Whitehurst; R H. Pearl
S5 Booster Seat Usage in Alabama Children. W D. King; N Wright; M Kahn; K Monroe
S5 Child Safety Seat Inspections Made Easy: An Online Referral System. E M. Walston; M Foxworth
Article S6 Using Focus Groups in Pediatric Injury Prevention Research.
Kyran Quinlan, MD, MPH
S7 Innovations in Injury Prevention Education. Michael J. Mello, MD, MPH; Marjorie A. Getz, MA, MPHIL; Garry Lapidus, PA-C, MPH; Joann Moss, BBA; Pamela Soulos, BA
S10 National Injury-Related Hospitalizations in Children: Public Versus Private Expenditures Across Preventable Injury Mechanisms. Joyce C. Pressley, PhD, MPH; Lisa Trieu; Tiffany Kendig, MSPT; Barbara Barlow, MD

S20 Developing the Miami-Dade County Injury Surveillance System: Using Surveillance to Build Community Capacity for Injury Prevention. Judy Schaechter, MD; Stephen Dearwater, MS; Susan B. Uhlhorn, PhD
S25 The Impact of Education, Legislation and Service on Alabama Child Passenger Safety. William D. King, RPH, MPH, DrPH; Kathy Monroe, MD; Janie Applegate, RN, MPH; Julie Cole-Farmer, RN
S29 Identifying Interventions That Promote Belt-Positioning Booster Seat Use For Parents With Low Educational Attainment. Flaura K. Winston, MD, PhD; Danielle Erkoboni, BA; Dawei Xie, PhD
S39 "Cubs Click It for Safety": A School-Based Intervention for Tween Passenger Safety. Mary E. Aitken, MD, MPH; Samantha H. Mullins; Virginia E. Lancaster; Beverly K. Miller, MEd
S44 Reducing Injury Rates Using a Community-Based Approach. Michael A. Gittelman, MD; Wendy J. Pomerantz, MD, MS; Talicia McNealy, MBA

IntroductionJ. J. Tepas IIII, MD, FACS, FAAP
J Trauma. 2007;63:S1.
The only effective vaccine against the disease of injury isprevention. The heart of prevention is effective educa-tion. The Robert Wood Johnson Injury Free Coalition for
Kids, which now consists of 43 centers throughout the UnitedStates, continues to provide committed clinicians and ex-perienced social scientists a unique clearinghouse for theexchange of concept and construct of effective programsdesigned to control the scourge of childhood injury. Thisyear’s meeting once again brought together recognized ex-perts in all aspects of injury surveillance and preventioneducation for three days of intense discussion and peer reviewof concepts that worked, and those that did not. This supple-ment is dedicated to these individuals. They are frequently
invisible to those who see the drama and pain of trauma care,yet they push ahead on a daily basis to educate society aboutthe disease of injury and to make our children’s environmenta safer place.
This year’s edition consists of four groups of abstractsdescribing injury prevention initiatives that apply new ideasand simple solutions to ongoing problems. The fourth ofthese describes effective prevention programs in four separatecities. Dr. Mello and his colleagues combined their efforts toproduce a more detailed manuscript that examines all four ofthese programs together.
The depth of other problems equally related to the con-trol and understanding of the disease of childhood injury isthen more definitively described and analyzed in the scien-tific reports that follow. The intent of this publication is topresent an overview of the components of childhood injuryprevention and education that stimulates thought and pro-vides insight and new ideas that will push the tide of effectiveprevention even higher.
Copyright © 2007 by Lippincott Williams & WilkinsThis article was written for the proceedings from a conference entitled
10th Annual Injury Free Coalition for Kids Conference in San Antonio,Texas. The opinions or assertions contained herein are the private views ofthe authors.
DOI: 10.1097/TA.0b013e31813e605c
The Journal of TRAUMA� Injury, Infection, and Critical Care
Volume 63 • Number 3 S1
J Trauma. 2007;63:S2.
EDITORIAL COMMENTThe Injury Free Coalition for Kids has always stressed
the importance of site-specific prevention programming. TheInjury Free model calls for local surveillance to dictate localpriorities and for each site to work with local partners todetermine programming initiatives. The resultant programsare conducted in a variety of neighborhoods and agencies thatare nearby, but often extrinsic to the hospital itself. InjuryFree staff may carry with them a vinyl banner or othersignage and most often nomadically operate under someoneelse’s sign post—at a child care center, school, house ofworship, police station, health fair, etc.
Still, despite the diversity of program delivery, mostevery site has in common the inclusion of child passengersafety (CPS) and home safety among its core offerings. Allsites are hospital-based, thus many have focused their CPSand home safety activities within a medical center, creating“safety centers” located in a hospital or clinic. Others, how-ever, have created mobile units, moving the safety center outto the community. Safety centers of both types provide edu-cation, and have space to house learning tools, including toscale vehicles, home interiors or street models. They mayhave access to multimedia equipment and storage space forsafety items for on-site distribution. Both mobile and station-ary safety centers provide sites with tangible and intangiblebenefits. A visual and physical presence increases awarenessin the community, provides a location for media visits, andraises a site’s profile for staff and potential donors. Impor-tantly, safety centers can extend educational reach beyondthose already interested in safety to the casual passerby who
comes in for “just a look,” but spends an hour learning,leaving with cabinet locks and a choke tube tester. As withprogram development, whether a mobile or stationary safetycenter is chosen depends on the fit at each Injury Free site, aswell as other factors such as population density, public trans-portation, and potential resources to be leveraged.
SummaryThe five abstracts that follow provide insight into four
safety centers. Dr. Gittleman, Dr. Belkowitz and Dr. Emeryeach report on evaluations of their safety centers. Dr. Gittle-man’s group tracked services provided, product distributionand quality of service in the first 6 months of Cincinnati’ssafety center operation. The data are important to both thecenter’s formative evaluation and it’s ability to justify futurefunding. Dr. Belkowitz reports on Miami’s mobile safetycenter’s progress in parent safety education, showing aknowledge increases in nearly all participants. Dr. Emery’sevaluation of Denver’s Junglemobile, a mobile safety dem-onstration center targeting children, showed significant gainsin child knowledge regarding CPS, but change was neithersustained nor related to behavior.
In a separate abstract regarding Miami’s mobile safetycenter, Ms. Stepanian reports on the unexpected adjust-ments needed, the lessons learned, over the first year ofoperation. Ms. Philbrook reports on the biggest challengeof all—sudden loss of funding for the hospital-based safetycenter in Minneapolis.
Judy Schaechter, MDUniversity of Miami
The Journal of TRAUMA� Injury, Infection, and Critical Care
S2 Supplement 2007

Simple Things That Work
The following abstracts demonstrate real risks within theenvironment of almost every child every day. Lowelland colleagues point out how the microwave can trans-
form from convenience to threat. The group from BostonChildren’s Hospital then describes how modification of anexisting social resource can significantly improve familyawareness of this type of risk. Kregenow and Gaines eachdescribe how their institutions have extended the preventionmission to a community level. Finally, the last three ab-stracts in this group define the continuing problem withvehicular injury. Hafner demonstrates the effectiveness ofsafety education in limiting ATV injury; King et al. de-scribe the limited appreciation of the value of booster seatsamong children and parents of Alabama, and Walstonpresents a simple and effective system of on-line coordi-nation of safety seat inspection. Taken together, theseshort presentations clearly indicate that effective preven-tion can indeed come from simple solutions.
J Trauma. 2007;63:S3–S5.
Unintentional Scald Burns in Children Under 5 YearsOld: Common Mechanisms of Injury
G. Lowell and K. Quinlan
Background: Previous studies have identified hot bev-erages or cooking liquids as the most common scaldingsubstance in young children. Few studies have describedand analyzed common mechanisms of scald burn injury.
Methods: The University of Chicago Burn Center’s da-tabase was used to identify children under age 5 years whowere admitted for scald burns between January 1, 2002 andDecember 31, 2004. A retrospective chart review identifiedbasic epidemiologic data as well details of the circumstancesand mechanisms of injury.
Results: Of 640 admissions, 140 (22%) were childrenunder age 5 years with scald burns. Of the 137 charts avail-able for review, 118 (86%) were unintentional injuries. Atotal of 104 (88%) scalds were related to hot cooking ordrinking liquids; 71 (60%) injuries occurred in the kitchen. In39 (33%) cases, substances were heated by a stove; 29 (25%)were heated by a microwave. There were 9 (8%) childrenbetween the ages of 18 months and 4 years who were scaldedafter the children opened countertop microwaves and re-moved the hot substance themselves. The 6 most commonmechanisms of injury were as follows: 41 (35%) patients
pulled over a cup, bowl, or cookware onto themselves; 16(14%) patients climbed to reach the hot substance; the hotsubstance spilled onto 16 (14%) patients by someone else; 9(8%) patients opened the microwave, scalding themselves; 8(7%) patients were scalded during a bath; 5 (4%) patientswere scalded while being carried or held.
Conclusions: We conclude that easy access to a micro-wave is an under recognized scald risk to young childrenwho operate them. An engineering design modification ofmicrowaves could help prevent this fourth most commonmechanism of scald burn injury. Progress in preventing themost common mechanisms of child scalds will requireinnovation beyond the currently recommended preventionstrategies.
A Home Visitor Program for Improving Home Safetyin a Low-Income Community
K. K. Kangas, L. K. Lee, P. Forbes, S. K. Osganian,and D. P. Mooney
Background: More than 4.5 million U.S. children areinjured in the home annually. Home visiting programs incor-porating education, environmental modification, and safetyproduct distribution can help protect children from homeinjuries. The objective of the Safer Homes Program is toincrease parental home safety knowledge and practices in alow-income population using home visitors.
Methods: Bilingual home visitors from community or-ganizations were trained to conduct home safety visits. Vis-itors performed an initial home safety assessment. Homesafety kits were given to each family (e.g. smoke detectors,cabinet locks, electrical outlet covers and Poison Centerstickers) with other products available upon request, andparents were educated in their use and importance. Threemonths later a follow-up home visit was performed to directlyobserve changes in home safety practices.
Results: Twenty-seven baseline home visits and 20follow-up visits have been conducted. The use of cabinetlocks increased from 47% at baseline to 80% at follow-up.Forty-three percent of families had a fire escape plan atbaseline and 86% at follow-up. Smoke detector testing in-creased from 87% to 100%. Observed Poison Centersticker and outlet cover use also increased to 100% atfollow-up from 71% and 64% at baseline respectively. No
From University of Chicago Comer Children’s Hospital. From Children’s Hospital Boston.
The Journal of TRAUMA� Injury, Infection, and Critical Care
Volume 63 • Number 3 S3

change was demonstrated in the areas of kitchen, bath-room, or child passenger safety.
Conclusions: Providing safety products was effective inchanging the home environment for the areas of fire safety,poisoning prevention, and the use of outlet covers and cabinetlocks. In areas where only anticipatory guidance was offered,the Safer Homes Program did not demonstrate an appreciablechange.
Effect of a Child Safety Street Program on ImprovingSafety Knowledge
R. D. Kregenow and D. Jaffe
Background: Children between the ages of 5 to 9 yearsare at risk for pedestrian, motor vehicle, bicycle, animal biteinjuries, and stranger assaults. A mobile Safety Street wasdeveloped to educate children in this age group about safebehaviors using didactic teaching and practical training.
Methods: A quasi-experimental study was conducted onkindergarten through second grade children from St. Louisregion schools. Students were tested using a previously val-idated testing method. Intervention school children weretested 1 week before the Safety Street arrival, 1 month later,and 4–6 six months later. Control school children were tested4–6 months before the Safety Street arrival, 1 month later,and immediately before the Safety Street arrival.
Results: Five hundred eighty-seven intervention sub-jects and 343 control subjects took test 1, 2 and 3. Betweentest 1 to test 2, test scores of intervention subjects in-creased 13% while control subjects increased 4% ( p �0.001). Between test 1 to test 3, test scores of interventionsubjects increased 16% while control subjects increased 5%(p � 0.001). This statistical difference was observed whenstratified by grade. Intervention, increasing age, and gradewere significant independent predictors of higher scores (p �0.001).
Conclusions: Using a validated testing method, wetested the Safety Street Program’s ability to transmit safetyknowledge to children between the ages of 5 to 9 years.The results support the efficacy of the program to teachthis knowledge, and to maintain this improvement for 4 – 6months.
This is RED: A Novel Program For TeenDriving Offenders
B. A. Gaines, C. M. Vitale, D. Jornsay-Hester,and L. Maloney
Background: Motor vehicle crashes are the leadingcause of death in teens, with those aged 16–19 four times
more likely to crash than older drivers. We hypothesized thatproviding a multi-faceted educational program to teens withdocumented poor driving habits would result in increasedknowledge regarding driving risks and improved compliancewith safe driving practices.
Methods: District justices offered participation in ourprogram to teens 16–18 years of age who received a movingmotor vehicle citation as part of their sentencing. Subjectswere randomly assigned to either the intervention (I) or con-trol (C) group. Teens assigned to I-group spent a half dayparticipating in a multi-disciplinary, hospital based program.Questionnaires were administered at baseline, 6, and 12months after enrollment. Subjects’ driving records were alsoreviewed. IRB approval and informed consent were obtained.
Results: Eighty teens (40 I and 40 C) were enrolled inthe 2 year pilot study. Participants were predominantly male(73%) and cited for speeding (62%). At both 6 and 12 monthsafter enrollment, the I-group showed statistically significantimprovement in their response to items on spinal cord injuryand on duration of parental grieving after the death of a child.Behavioral improvement in seat belt usage and speedingapproached statistical significance. There was no differencein the rate of recidivism (I � 25%, C � 21% p � NS). Bothteens and parents uniformly believed that the program wasbeneficial.
Conclusions: We are encouraged by these documentedimprovements in knowledge and behavior and the over-whelmingly positive feedback from our participants. Futureplans include increasing the number of programs offered anddeveloping a standardized curriculum.
All-Terrain Vehicle Safety and Use Patterns inWest-Central Illinois Youth
J. W. Hafner, S. M. Hough, M. A. Getz,Y. R. Whitehurst, and R. H. Pearl
Background: All-terrain vehicles (ATVs) are increasingin popularity in the United States with an accompanying risein injuries and deaths. Children under 15 years accounted for31% of ATV-related injuries and 27% of deaths in 2003.Routine patterns of youth ATV use are largely unknown; thisstudy seeks to clarify these practices.
Methods: Youth members in the 4-H club of America(4-H) of four West-Central Illinois counties were surveyed.The instrument consisted of multiple choice, Likert scale andopen-ended questions. Questions focused on demographics,typical ATV use patterns, safety knowledge, safety equip-ment usage, ATV crashes and injuries. Questionnaires weresent to all eligible youth in a household in two separatemailings.
From St. Louis Children’s Hospital.
From Children’s Hospital of Pittsburgh.From Children’s Hoapital of Illinois/OSF Saint Francis Medical
Center.
The Journal of TRAUMA� Injury, Infection, and Critical Care
S4 Supplement 2007

Results: Out of 1850 surveys, 634 were returned (34%);280 indicating recent ATV use (44%; study population).Respondents were principally adolescent males from farms orrural locations. Most were drivers (87.9%), drove on average1 day per week (60.2%), and used ATVs for recreation(36%), work (22.6%), or on farms (27.1%). Most never usedsafety gear, including helmets, and few (14.6%) had receivedsafety education. Of the 67% who experienced a crash on anATV, almost half (44%) were injured. Rollover crashes wereuncommon (7.2%) but produced more severe injuries (30%).Children with safety training had less crashes (p � 0.01).Those riding after dark (p � 0.13) or without adult supervi-sion (p � 0.042) were more often injured.
Conclusions: ATV use is common in a rural 4-H pop-ulation. Most child ATV users are adolescent boys, have littlesafety training and do not use safety equipment or helmets.
Booster Seat Usage in Alabama Children
W. D. King, N. Wright, M. Kahn, and K. Monroe
Background: The majority of states do not specificallyreport booster seat use. This observational survey was per-formed at several Alabama elementary schools to estimatebooster seat use among children ages 4 to 8 years.
Methods: An experienced team of child passenger safetytechnicians visited a sample of Alabama elementary schoolsto observe booster seat use among students 4 to 8 years old.Schools were randomly assigned to an intervention groupwith written educational material and personal counseling orto a control group. Two separate observations were made atall schools (1,249 total intervention school observations and1,599 control school observations).
Results: Intervention schools (n � 23) had overallbooster seat use rate of 36.6% before and 38.5% after edu-cational intervention (z � 0.62, p � 0.53). Control groupschools (n � 20) had 21.6% use and 31.6% use during thesame time frame (z � 4.45, p � 0.001). Intervention schoolshad higher pre education booster seat use than controls(36.6% versus 21.6%, respectively), (z � 5.80, p � 0.001).Post intervention use was higher in the intervention groupschools versus control group schools (38.5% versus 31.6%,respectively), (z � 2.82, p � 0.005). The highest individualbooster seat use rate was 90.6%, (lowest was 3.0%).
Conclusions: This survey provides the first statewideestimates of booster seat use at elementary schools in Ala-bama. 2005 state survey reported child restraint use as 92%.This survey reported an overall booster seat use of 31.6%.Although both study groups had improvements in observedbooster seat use, only the controls had a significant increase.Control group schools also had significantly lower pre- andpost-usage rates.
Child Safety Seat Inspections Made Easy: An OnlineReferral System
E. M. Walston and M. Foxworth
Background: Referrals for child safety seat inspectionsare made at all times. Keeping personnel available to receivereferrals, schedule appointments, and track data from childsafety seat checks is expensive. We developed a user-friendlyonline referral system to address this need.
Methods: A laminated card is given to all potentialreferral sources. The card directs referring community careproviders to a website that guides the provider through anonline appointment process. After the demographic informa-tion is submitted online, a map to the permanent inspectionstation and appointment time is provided. This system allowsthe child passenger safety technicians to estimate the numberof child safety seats needed. Information collected at theevents is maintained in a database that is used for tracking thenumber of child safety seats distributed, the number of seatschecked, and the number of correctly versus incorrectly in-stalled seats.
Results: There have been 467 online appointments madesince the inception of the system in November of 2004.Clients, providers, and child passenger safety technicians arevery pleased with the system. Other outcomes include savingtime and money.
Conclusions: The database provides accurate data thatcan be utilized for tracking purposes. The data serves as anindicator of child safety seat safety trends in eastern NorthCarolina and allows for development of targeted interven-tions. The database facilitates the streamlining of requiredreports. All child safety seat programs should consider im-plementing an online referral system. Information regardingthis site and its URL can be obtained from [email protected]/[email protected].
From Children’s Hospital of Alabama. From Pitt County Memorial Hospital.
Supplement
Volume 63 • Number 3 S5

Using Focus Groups in Pediatric Injury Prevention ResearchKyran Quinlan, MD, MPH
Preventing childhood injuries often in-volves changing behaviors. A focus group is aninterview of usually 6–8 participants con-
ducted for the purpose of better understand-ing perceptions of the group on a certain topic.This type of inquiry has a unique role in child
injury prevention research. Here are five ex-amples of the use of focus group methodologyin child injury prevention research.
J Trauma. 2007;63:S6.
Preventing childhood injuries often involves changingbehaviors. Research into the way individuals makechoices about their safety behaviors frequently neces-
sitates going beyond the capacity of closed-ended questionson surveys or questionnaires.1 A focus group is an interviewof usually 6–8 participants conducted for the purpose ofbetter understanding perceptions of the group on a certaintopic. This type of inquiry has a unique role in child injuryprevention research.2 For example, focus group research ledto an understanding that parents who negotiate with theirchildren regarding motor vehicle restraint choices are lesslikely to use belt-positioning booster seats when they should.3
Here are five examples of the use of focus group methodol-ogy in child injury prevention research.
Quinney et al. from the University of Chicago report thefindings from focus groups of urban caregivers of childrenless than 5 years to better understand perceptions of risk andcontrol regarding child scalds. They found that successfulscald prevention efforts will need to be effective with someparents who are overconfident and others who felt helpless inprotecting their children from scalds.
Richardson and colleagues from Hennepin County Med-ical Center conducted focus groups of injury prevention pro-fessionals working in Minneapolis/St. Paul. This work allowedfor a Twin City-wide picture of the range of activities, including
a self-assessment of “strengths, weaknesses, opportunities andthreats” in these efforts.
In Providence, Rhode Island, Palmisciano et al. orga-nized focus groups of 8th and 9th graders to determine effec-tive communication strategies for a substance abuse preven-tion campaign. They found that focus group participantsfrequently overestimated the true rate of substance abuse.This insight has helped in the design of their campaign whichwill emphasize that non-use is the norm.
At the Children’s Hospital of Denver, Emery and Fariesconducted focus groups of migrant and seasonal farm work-ers who were also parents. This work provided a betterunderstanding of the injury concerns of these parents andhelped mold injury prevention efforts in this community.
Focus groups also were used by Pomerantz et al. atCincinnati Children’s Hospital to involve parents and chil-dren in the design of after-school activities in a high-riskneighborhood. Considering the interests of both parents andchildren may boost participation in these programs and betterprotect children by giving them enriching and safe activities.
These abstracts demonstrate that using focus groups togather complex information regarding safety behavior canoffer key insights. This qualitative research proves that “noteverything that counts can be counted.”2
REFERENCES1. Kreuger RA, Casey MA. Focus Groups: A Practical Guide for
Applied Research. 3rd ed. Thousand Oaks (CA): Sage Publications;2000.
2. Roberts H. Qualitative research methods in interventions in injury.Arch Dis Child. 1997;76(6):487–9.
3. Simpson EM, Moll EK, Kassam-Adams N, Miller GJ, Winston FK.Barriers to booster seat use and strategies to increase their use.Pediatrics 2002;110(4):729–36.
Submitted for publication January 3, 2007.Accepted for publication March 13, 2007.Copyright © 2007 by Lippincott Williams & WilkinsThis article was written for the proceedings from a conference entitled
10th Annual Injury Free Coalition for Kids Conference in San Antonio,Texas. The opinions or assertions contained herein are the private views ofthe authors.
DOI: 10.1097/TA.0b013e31812f5e96
The Journal of TRAUMA� Injury, Infection, and Critical Care
S6 Supplement 2007
Innovations in Injury Prevention EducationMichael J. Mello, MD, MPH, Marjorie A. Getz, MA, MPHIL, Garry Lapidus, PA-C, MPH,Joann Moss, BBA, and Pamela Soulos, BA
Innovations in Injury Prevention Edu-cation describes four programs presented atthe Annual Injury Free Coalition for KidsNational Meeting in December 2006. Theprograms were developed by Injury Freesites in Providence, RI; Detroit, MI; Hart-
ford, CT; and Peoria, IL. Each demon-strates how education continues to be anessential aspect of injury prevention inter-ventions, either as a means of disseminatingknowledge among children or as a way toassess baseline knowledge to develop more
appropriate interventions. For each pro-gram, summaries of methods are provided,along with the results of basic statisticalanalyses. The need for continued researchon education’s role in injury prevention isemphasized.
J Trauma. 2007;63:S7–S9.
Successful interventions in the field of injury preventionoften utilize strategies based on the Four E’s of InjuryPrevention: Education, Engineering, Enforcement, and
Economics. To target the issue of motor vehicle crash injuryprevention, for example, strategies that have been utilizedinclude educating the public about the benefits of wearingseat belts, engineering vehicles with air bags, enforcement bylegislating primary seat belt laws, and providing economicincentives with automobile insurers safe driver credits andcitation surcharges. Each method of intervention provides ben-efits, though they may not always be feasible or appropriate inany given situation. Among the four strategies, education isoften preferable because it can reach a large number of peopleusing the fewest external resources. Education is also the pri-mary means of addressing many targeted public health inter-ventions because it can be tailored to varying audiences, frombroad populations to particular high-risk groups.
This year, the national conference of the Injury FreeCoalition for Kids� featured a symposium entitled “Innova-tions in Education.” The session presented four Injury Freeprograms, each discussed in detail below. Each abstract ad-dressed a specific topic in injury prevention, and in so doing,demonstrated the variety of ways in which education may beused to extend injury prevention knowledge to various pop-ulations. Two of the presentations described programs that
utilized traditional educational settings to teach childrenabout safety. The other two examined the need for educationbeyond what is provided in the classroom with programs thatused community based education techniques.
Injury Free of Providence, RI, piloted a program thataimed to increase knowledge about dog bite prevention inthird-graders.1 Dog bite injury is common and affects anestimated 4.7 million individuals annually.2 To assess themagnitude of this health problem locally, investigators talliedthe frequency of dog bite injuries in patients presenting to theEmergency Department of Hasbro Children’s Hospital inProvidence, RI. Hasbro Children’s Hospital is a pediatricspecialty hospital, the state’s only pediatric trauma center,and a regional referral center. Over the 7-year period underreview, there was a total of 411 documented dog bite injuriesto children. Descriptive analyses of these data showed that59% of dog bite victims were male and 41% female. Themost common injury sites were head/neck (34.4%), lowerextremity (30.0%), upper extremity (28.3%), and trunk(5.8%). Head and neck bites were the most common site ofinjury in those under age five. Those children aged five andolder were significantly more likely to sustain upper andlower extremity bites. These data are comparable to nationalstatistics which show the same type of gender distribution andvariation in injury site by age. These findings, in conjunctionwith published recommendations from the Centers for Dis-ease Control and Prevention2 and the American VeterinaryMedical Association,3 strongly support the need for dog biteprevention education. Injury Free of Providence has part-nered with researchers at Brown University to develop a dogbite prevention program intended to decrease the incidence ofdog bites to children.
The pilot program reported on during the “Innovations inEducation” session was delivered in three third grade class-rooms in Rhode Island. Fifty-one students participated in thisprogram. The program consisted of three classroom sessionsand was delivered over the course of 4–5 weeks. Componentsof the sessions included interaction with a pet therapy dog, avideo demonstrating various dog behaviors, and written com-positions in which the students wrote a letter to the pettherapy dog describing what they had learned. To test the
Submitted for publication February 20, 2007.Accepted for publication April 18, 2007.Copyright © 2007 by Lippincott Williams & WilkinsThis article was written for the proceedings from a conference entitled
10th Annual Injury Free Coalition for Kids Conference in San Antonio,Texas. The opinions or assertions contained herein are the private views ofthe authors.
Injury Prevention Center, Rhode Island Hospital, Providence, RhodeIsland (M.J.M, P.S.); Bradley University, Peoria, Illinois (M.A.G.); Connect-icut Children’s Medical Center, Hartford, Connecticut (G.L.); Children’sHospital of Michigan, Detroit, Michigan (J.M.).
Portions of this manuscript were presented at the Annual Injury FreeCoalition for Kids National Conference, December 10, 2006; Ft. Lauderdale, FL.
Correspondence: Michael J. Mello, MD, MPH, Injury PreventionCenter, Rhode Island Hospital, 593 Eddy St. Claverick 2, Providence, RI02903, [email protected], Ph: (401) 444-2685, Fx: (401) 444-2249.
DOI: 10.1097/TA.0b013e31812f5ecd
The Journal of TRAUMA� Injury, Infection, and Critical Care
Volume 63 • Number 3 S7

effectiveness of the program, anonymous, coded surveyswere administered at baseline (session one) and at completionof the program (session three). The surveys included eight“Safe or Not Safe” classifications, which asked students todetermine whether pictures portraying dogs and children invarious situations were safe or not and eight mood classifi-cations in which students viewed eight pictures of differentdogs and decided whether each dog’s mood was friendly,mean, scared, or not clear.
Results of the pilot test indicated a significant increase indog bite prevention knowledge among participants whencomparing pretest survey scores (67%) and posttest surveyscores (77%; F(1,50)�25.1, p � 0.01). Classroom teacherswho observed each session were satisfied with program con-tent and indicated that the program was optimal in number ofsessions, session length, and in age-appropriate content. Re-sults of this pilot test demonstrate both the effectiveness andacceptability of this program and underscore its potential as ameans of educating school-age children about dog bite pre-vention. The positive results validate the use of a traditionaleducation setting, the school classroom, as an appropriatevenue for delivering non-traditional safety education on safebehaviors for children around dogs. Injury Free of Providenceis continuing its work and will be conducting a randomizedcontrol trial measuring the program’s efficacy in other ele-mentary school populations.
“KTK 2 B Safe (Kids Teaching Kids to be Safe)” is aprogram designed by Injury Free of Detroit, MI, to investigatealternative methods of providing injury prevention education toelementary school students. Recent budget cuts have led toreductions in the availability of community educators (e.g. fire-fighters) who usually provide this information, prompting theDetroit site to explore the effectiveness of using high schoolstudents to disseminate injury prevention knowledge.
The KTK 2 B Safe presentation described two relatedstudies in which high school students were trained to teachelementary school students about motor vehicle safety and“How to call 911,” respectively.4 The classes were interactiveand provided educational materials for the students to take hometo reinforce the information gained. Pre- and posttests wereadministered to assess change in level of knowledge. For themotor vehicle safety study, pre- and posttest scores were 29%and 77.1% respectively, demonstrating a significant increase inknowledge; for the “How to call 911” study, scores were 47.2% andincreased to 91.7% after the program, another significant increase.
The results from these two studies strongly affirm theeffectiveness of high school students as injury preventioneducators. Especially notable is that the benefits were notrestricted to the elementary school students; the high schoolstudents acquired safety knowledge, leadership and commu-nication skills, gained self esteem and confidence, and wereexposed to the concept of service-learning projects. InjuryFree of Detroit intends to conduct further studies examiningthe efficacy of this educational approach for teaching a vari-ety of injury prevention topics.
Injury Free of Hartford, CT, presented “Fire Safety Knowl-edge and Practice among Hartford’s Albanian, Bosnian andHispanic Populations.”5 The presentation described a study con-ducted to assess the level of fire safety knowledge of Albanian andBosnian immigrants compared with that of Hartford’s Hispanicpopulation. Since the 1990s, CT has experienced an influx ofimmigrants from Bosnia and Albania. Immigrants often facemany challenges, including language barriers, unemployment,lack of education, illegal immigration status, and, for these twoimmigrant groups, post traumatic stress disorder due to experi-ences of war. Because of these and other challenges, it is rea-sonable to expect that this population would suffer from dimin-ished access to knowledge about safety and injury prevention.
The objectives of this study were useful in ascertainingwhether fire safety education is needed in Hartford’s Bosn-ian, Albanian, and Hispanic populations. By understandingthe cultural differences across diverse communities, and Bal-kan immigrants in particular, fire safety programs can betailored to more appropriately educate population subgroups.
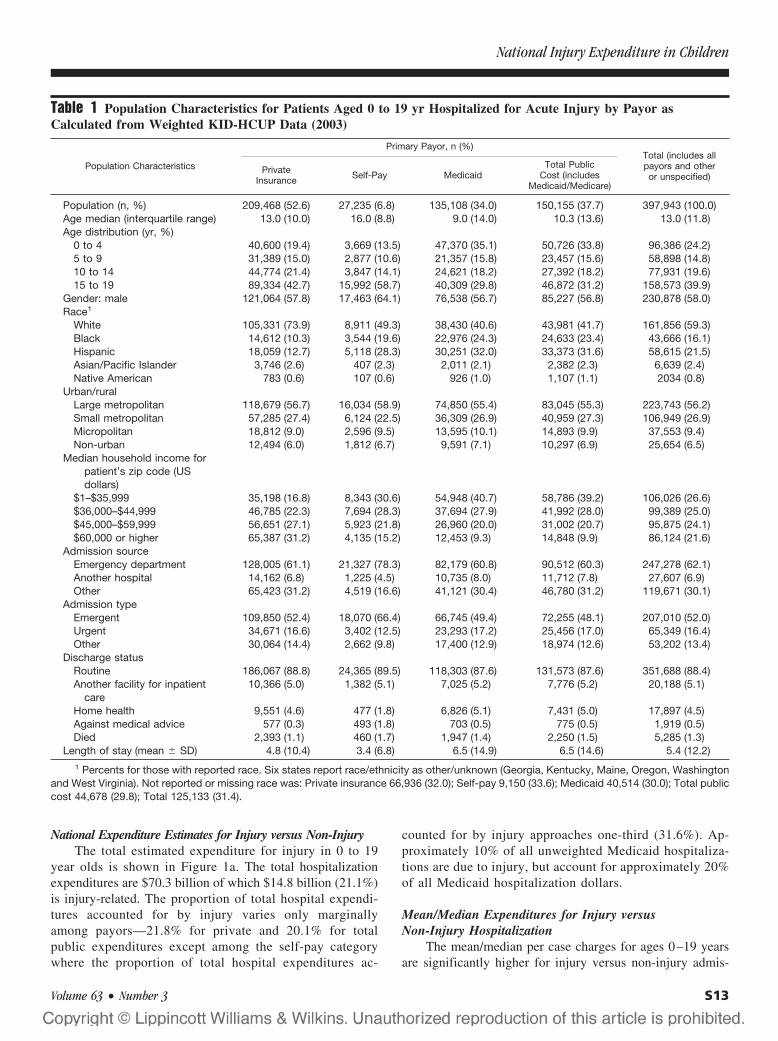
To assess the Bosnian and Albanian immigrant popula-tions’ knowledge about fire safety, Injury Free of Hartford sur-veyed 100 individuals recruited from a convenience sample ofparents attending local elementary school PTO meetings andconferences. The English language survey was translated intoBosnian, Albanian, and Spanish. Of the 100 parents recruited 96agreed to participate. Thirty-one percent self-identified as Bosn-ian (n � 27), 28% as Albanian (n � 30), and 41% as Hispanic(n � 39). Questions included in the survey were, “Does yourhome have a working smoke detector with active batteries?,”“Does your family have an escape plan, either verbal or writ-ten?,” and “Do you keep matches and lighters out of reach ofchildren?” Figure 1 summarizes the survey responses.
There were no significant differences between the threeethnic groups with regards to having a working smoke de-tector and keeping matches/lighters out of reach of children.However, a sizable proportion of Bosnians (48%) and His-panic parents (54%) did not have a fire escape plan. InjuryFree of Hartford used these results to guide its communityfire safety program and to emphasize the need for fire escapeplans among these 2 ethnic subgroups.
The abstract presented by Injury Free of Peoria, IL, “All-terrain vehicle dealership point of sale child safety compliance inIllinois,” investigated how all-terrain vehicle (ATV) dealershipsfunction as a source of injury prevention education.6 Over100,000 children under 15 years of age were treated for nonfatalATV injuries in United States Emergency Departments between2001 and 2003.7 While child safety recommendations for use ofATVs are described by the Consumer Product SafetyCommission,8 the extent to which the dealerships convey theserecommendations to customers is unknown.
The subject pool for this study was all 2004 licensed mo-torcycle dealers in Illinois. Trained investigators conducted tele-phone surveys of the dealerships by posing as parents of a 13year-old child and indicating that they were interested in pur-chasing an ATV, but were uninformed of ATV usage and safety
The Journal of TRAUMA� Injury, Infection, and Critical Care
S8 Supplement 2007

issues. All information from the conversations was recorded ona standardized form and each dealership surveyed was debriefedby letter after completion of the study.
A total of 589 dealerships were surveyed, with 127 com-pleting the survey. In 124 of these cases, investigators spokewith a salesperson. See Table 1 for percentages of respondentswho made specific recommendations about riding ATVs anduse of safety equipment. The results of the telephone surveysindicated that most dealerships followed the appropriate recom-mendations for child use of ATVs. Injury Free of Peoria deter-mined that efforts aimed at promoting injury preventionmessages among ATV dealerships may be unnecessary, as theysimply reinforce what the dealers already do; however, theymaintain that sustaining such efforts or increasing them to beuniversally implemented may decrease ATV injury rates.
By organizing the “Innovations in Education” symposium,the entire Injury Free Coalition for Kids organization has high-
lighted its commitment to developing novel programs that pro-mote the use of education in preventing childhood injury. As theprograms discussed above have illustrated, investigating the roleof education in injury prevention can be undertaken in manydifferent ways. Though the traditional classroom setting and theteacher/student environment may be an adequate system for dis-seminating injury prevention knowledge, it is important to continueresearching alternative, more effective and engaging methods. Inaddition to providing varied programming, however, it is essentialto continually evaluate the effectiveness of educational programs.Especially because education can reach such a wide range ofpopulations, cultural differences must be accounted for by as-sessing the role education may play in specific communities.
REFERENCES1. Mello MJ, Bromberg J, Nirenberg T, et al. Findings from a Dog Bite
Prevention and Literacy Program: A Pilot Test. Abstract presentedat: Annual Injury Free Coalition for Kids National Meeting;December 2006; Ft. Lauderdale, FL.
2. Centers for Disease Control and Prevention (CDC). Nonfatal dogbite – related injuries treated in hospital emergency departments –United States, 2001. MMWR. 2003;52:605–610.
3. American Veterinary Medical Association (AMVA) Task Force onCanine Aggression and Human-Canine Interactions. A communityapproach to dog bite prevention. Journal of the American VeterinaryAssociation. 2001;218:1732–49.
4. Moss J, and Smith SJ. KTK 2 B Safe (Kids Teaching Kids to beSafe). Abstract presented at: Annual Injury Free Coalition for KidsNational Meeting; December 2006; Ft. Lauderdale, FL.
5. Morris LJ, Lapidus G, and Banco L. Fire Safety Knowledge andPractice among Hartford’s Albanian, Bosnian, and HispanicPopulations. Abstract presented at: Annual Injury Free Coalition forKids National Meeting; December 2006; Ft. Lauderdale, FL.
6. Hafner JW, Getz MA, Pearl RH, et al. All-Terrain VehicleDealership Point of Sale Child Safety Compliance in Illinois.Abstract presented at: Annual Injury Free Coalition for KidsNational Meeting; December 2006; Ft. Lauderdale, FL.
7. Shults RA, Wiles SD, Vajani M, et al. All-terrain vehicle-relatednonfatal injuries among young riders: United States, 2001–2003.Pediatrics. 2005;116:e608–612.
8. Consumer Product Safety Commission (CPSC). All-terrain vehiclesafety. Available at http://www.cpsc.gov/cpscpub/pubs/540.html.Accessed on November 1, 2006.
Fig. 1. Percentage of affirmative response to three fire safety measures as stratified by ethnicity. Fire Safety Survey Responses.
Table 1 Percentage of Respondents Making SpecificRecommendations About Riding ATVs and the Use ofSafety Equipment
Recommendation %
Made appropriate recommendation for enginesize (�90 mL)
70.3
Believed rider training was necessary 83.5When pressed about training, indicated that
training could be arranged through adealership course
49.6
Spontaneously mentioned CPSC guidelines forchild ATV use
33.3–66.6
Mentioned age/engine size recommendation 36.2Mentioned that guidelines recommend vehicles
with an engine size of 90 mL or smaller for thechild being shopped for
66.9
Provided information on size of vehicle bestsuited for a child
69.3
Stated that ATVs were dangerous 4.7Considered the vehicles safe 2.4Recommended rider training 76.4Offered training at point of sale 33
Injury Free Innovations
Volume 63 • Number 3 S9
National Injury-Related Hospitalizations in Children:Public Versus Private Expenditures Across PreventableInjury MechanismsJoyce C. Pressley, PhD, MPH, Lisa Trieu, Tiffany Kendig, MSPT, and Barbara Barlow, MD
Background: Examination of expen-ditures in areas where more universal ap-plication of effective injury preventionapproaches is indicated could identify spe-cific mechanisms and age groups whereeffective intervention may impact publicinjury-related expenditures.
Methods: The Healthcare Cost andUtilization Project 2003 (KID-HCUP) con-tains acute care hospitalization data for U.S.children and adolescents residing in 36states. The study population includes240,248 unweighted (397,943 weighted)injury-related hospital discharges for ages0 to 19 years. Injury severity was assessedusing ICDMAP-90 and InternationalClassification of Injury Severity Scores(ICISS). SUDAAN was employed to ad-
just variances for stratified sampling. Ex-penditures were weighted to represent theU.S. population.
Results: Injury-related hospitaliza-tions (mean $28,137 � 64,420, median$10,808) were more costly than non-injurydischarges, accounting for approximately10% of all persons hospitalized (un-weighted), but more than one-fifth of expen-ditures. Public sources were the primarypayor for 37.7% of injured persons. Inci-dence and cost per case variations acrossspecific injury mechanisms heavily influ-enced total mechanism specific expendi-tures. Motor vehicle crashes were thelargest expenditures for private andpublic payors with two thirds of expen-ditures in teenagers – more than 40%
for drivers. Medicaid covered 45.6%($192 million) of burn expenditures and59.2% in 0–4 year olds. Expenditures percase (mean � SD, median) were: firearm($36,196 � 58,052, $19,020), motor vehicledriver ($33,731 � 50,583, $18,431), pedes-trian ($31,414 � 57,103, $16,552); burns($29,242 � 64,271, $10,739); falls ($13,069 �20,225, $8,610); and poisoning ($8,290 �$15,462, $5,208).
Conclusions: More universal appli-cation of proven injury prevention has thepotential to decrease both the public andprivate health expenditure burden amongseveral modifiable injury mechanisms.
Key Words: Injury, Medicaid, Infants,Children, Health expenditures, Disparities.
J Trauma. 2007;63:S10–S19.
Children living in poor, resource-limited neighborhoodshave high morbidity and mortality due to injury acrossseveral preventable injury mechanisms.1–7 Although
the causes are multi-factorial, several safety measures provento be effective at preventing injury have not been imple-mented universally across many injury mechanisms.3,8–11
With Medicaid as the largest single payor for children livingin such neighborhoods, we hypothesize that such measuresrepresent a potentially modifiable component not only toinjury morbidity, disability and death, but also to publicexpenditures for injury.
As the number one cause of death among the age groupsstudied here, injuries are important on several fronts—firstfrom a burden of illness vantage point and secondly from acost of care perspective. Historically, we have seen modifi-able injury mechanisms continue to contribute significantly tothe health care burden despite having an effective best prac-tices approach available for prevention.12–18 When consid-ered in the context of an expanded national child healthinsurance program, periodic re-evaluation of public expendi-tures may catalyze and inform policy debates regarding levels offunding for prevention relative to cost of care and the injury-related mortality, morbidity, and disability burden.7–8,13,19–23
METHODSData Source(s)
The 2003 Kids Inpatient Database of the Health CareCost and Utilization Project (KID-HCUP) contains treatmentand hospital outcome data for discharges from acute carehospitals in 36 states. Variables include demographic, socio-economic (median income for zip code of residence), diag-nostic, place and mechanism of injury (e-codes), admission
Submitted for publication January 10, 2007.Accepted for publication March 13, 2007.Copyright © 2007 by Lippincott Williams & WilkinsThis article was written for the proceedings from a conference entitled
10th Annual Injury Free Coalition for Kids Conference in San Antonio,Texas. The opinions or assertions contained herein are the private views ofthe authors.
From the Departments of Epidemiology (J.C.P., L.T., T.K., B.B.) andHealth Policy and Management (J.C.P.), the Injury Free Coalition for Kids(J.C.P., B.B.) in the Mailman School of Public Health, the Center for theHealth of Urban Minorities (J.C.P., L.T., T.K., B.B.), Columbia University;the Department of Surgery (B.B.), Columbia University College of Physi-cians and Surgeons; and Harlem Hospital (B.B.), New York.
This work was funded by the National Center for Minority Health andHealth Disparities through the EXPORT grant mechanism (NIH grant num-bers 1P60MD000206) and by the Robert Wood Johnson Foundation ofPrinceton, New Jersey.
Correspondence: Joyce C. Pressley, Columbia University, MailmanSchool of Public Health, 722 West 168th St, Room 17-12, New York, NY10032; Telephone: 212-342-0421 Fax: 212-342-0519; email: [email protected].
DOI: 10.1097/TA.0b013e31812f5ea7
The Journal of TRAUMA� Injury, Infection, and Critical Care
S10 Supplement 2007

source/type, month of admission, weekend day, length ofstay, number of e-codes, condition codes, procedure codes,and others.24
The data set is an 80% sample of the Nationwide Inpa-tient Sample (NIS) sampling strata, with an additional stra-tum for freestanding acute care children’s hospitals. Six stateslimited hospitals in the sampling frame (Connecticut, GA, HI,SC, SD, and Virginia). National estimates of expenditureswere facilitated by a weight variable based on the AmericanHospital Association’s universe of hospitals and provided inthe KID-HCUP database for such purposes.24
Patient PopulationKID-HCUP 2003 includes 2,984,129 acute care hospital
discharges of persons aged 0 to 20 years of age. The finalpopulation for this study included 240,248 discharges iden-tified through an injury-related condition or an e-code indi-cating injury. Study exclusions were age greater than 19years, adverse medical or surgical events not associated withprior injury, and patients transferred to another hospital forcare. Injured patients transferred between hospitals (n �7,050) were included at the receiving hospital, but not thetransferring hospital. When weighted to produce nationalestimates, the study population totaled 397,943 discharges forinjury-related diagnoses.
Geographic RegionThe 36 participating states providing statewide hospital
discharge data in 2003 included: AZ, CA, CO, CT, FL, GA,HI, IL, IN, IA, KS, KY, MD, MA, MI, MN, MO, NE, NV,NH, NJ, NY, NC, OH, OR, RI, SC, SD, TN, TX, UT, VT,VA, WA, WV and WI.24
Variable ClassificationsDemographic and Socioeconomic Variables
KID-HCUP provides uniform coding for race whichincluded Hispanics of all races, and non-hispanic whites,blacks, Asians/Pacific Islanders, and American Indian/Alaskan natives.24 Seven states reported all races as other/unknown (GA, IL, KY, ME, OR, WA and WV). These statesare excluded from race and ethnicity analyses, but included intotals not stratified by race/ethnicity. At least two states didnot report age for persons who also had HIV/AIDS or alcoholor substance abuse diagnoses.
In KID-HCUP, income is provided at the community levelusing median income for the zip code of patient residence withthe following 4 categories: 1) $1–$35,999; 2) $36,000–$44,999;3) $45,000–$59,999; and 4) $60,000 or higher.24 The U.S.Census Bureau reported median household income in 2003 to beapproximately $43,318 with 15.9% of households earning lessthan $15,000 and 15.1% earning more than $100,000.25 Urban/rural was categorized as: 1) large metropolitan area with atleast 1 million persons; 2) small metro area of less than 1million persons; 3) non metropolitan areas (micropolitan ar-eas); or 4) non-urban area. Patient disposition was catego-
rized as: 1) routine discharge with/without outpatient ser-vices; 2) transfer to another acute care/short term facility; 3)discharge to skilled nursing, intermediate care, or other fa-cility; 4) discharge to home health care; 5) left against med-ical advice; 6) died in hospital; or 7) other/unknowndisposition.24
Injury and Injury MechanismsWe defined injury using standard classifications based
on external cause of injury (e-codes) and conditions from theInternational Classification of Diseases, ninth clinical modi-fication (ICD-9-CM)26,27 as well as predefined variable clas-sifications available through Clinical Classification Software(CCS) present in KID-HCUP.28
Severity of InjuryWe employed 2 methods to estimate injury severity. A
program developed by the University of South Florida wasused to calculate International Classification of Injury Sever-ity Scores (ICISS) and ICDMAP-90 was used for injuryseverity scores (ISS).29,30 The program for ICISS providesthree survival risk ratio (SRR) databases as reference popu-lations for calculation of SRR. The Florida Agency for HealthCare Administration (AHCA) 2000–2004 database was se-lected for use in deriving SRRs. ICISS scores are derived asa product of the SRRs generated for each ICD-9 code withhigher scores representing lower severity. The ICDMAP-90,also used to produce injury severity scores (ISS) for traumaticinjuries, allows the user to choose among several optionswhen processing the ICD-9-CM codes. For the purposes ofthis study, we used the high severity assumption and ignoreunknown options.29,30 ICDMAP-90 ISS scores were catego-rized as follows: 1) 1–8; 2) 9–15; 3) 16–24; 4) 25–40; and5) 41–75.29 ISS scores range from 1 (lowest severity) to 75(highest severity) and ICISS scores ranged from 0 (highestseverity) to 1.0 (lowest severity).
Public versus Private PayorsWe estimated private versus public expenditures for hos-
pitalization due to injury using the uniform recoded expectedprimary payor data provided in KID-HCUP 2003 for self-pay/uninsured, Medicaid, Medicare, private insurance, and other.The “other” category was quite heterogeneous and sometimescontained payors that could be identified as a public fundingsource. Using the original expected primary payor categorydata as submitted by individual hospitals (non-uniform data),we further refined the differentiation of public payment forinjury care by including the following as public pay sources:local, state, and federal corrections, Champus, the IndianHealth Service, Title V, aid to dependent children, and othergovernmental as public expenditures. Medicare (n � 1,016),identified separately in KID-HCUP, was grouped with publicpayors. Medicaid represented 34.0% of the 37.7% of publicfunding sources for injury.
National Injury Expenditure in Children
Volume 63 • Number 3 S11
Hospital ChargesCharges are in 2003 U.S. dollars rounded to the nearest
dollar.24 Zero and inconsistent charges were set to missingduring the production of the KID-HCUP database.24 Thesedo not appear in mean or median calculations of expendi-tures. Total charges may include emergency departmentfees for the admitting hospitalization, but do not includenoncovered charges or professional fees except wherenoted in KID-HCUP documentation.24
Statistical AnalysesThis study includes analyses of nearly 400,000 weighted
hospitalizations (240,000 unweighted) of children residing in36 states. Individual median and mean charges across indi-vidual patient categories and injury mechanisms were calcu-lated using unweighted data. Weights provided by KID-HCUP2003 are used to estimate national level expenditures.24,31 Be-cause the sample of KID-HCUP discharges is not a simplerandom sample, estimation of variance calculations weremade using SUDAAN software (version 9) as recommendedin HCUP methods series reports.31–33 Wilcoxon rank sumwas used to assess differences between continuous non-normally distributed variables. The Chi-square (X2) test wasused in univariate analyses of categorical variables with sta-tistical significance defined as p � 0.05. Means are presentedwith standard deviations. SAS 9.1 was used for processingthe large database.34
RESULTSPopulation Characteristics
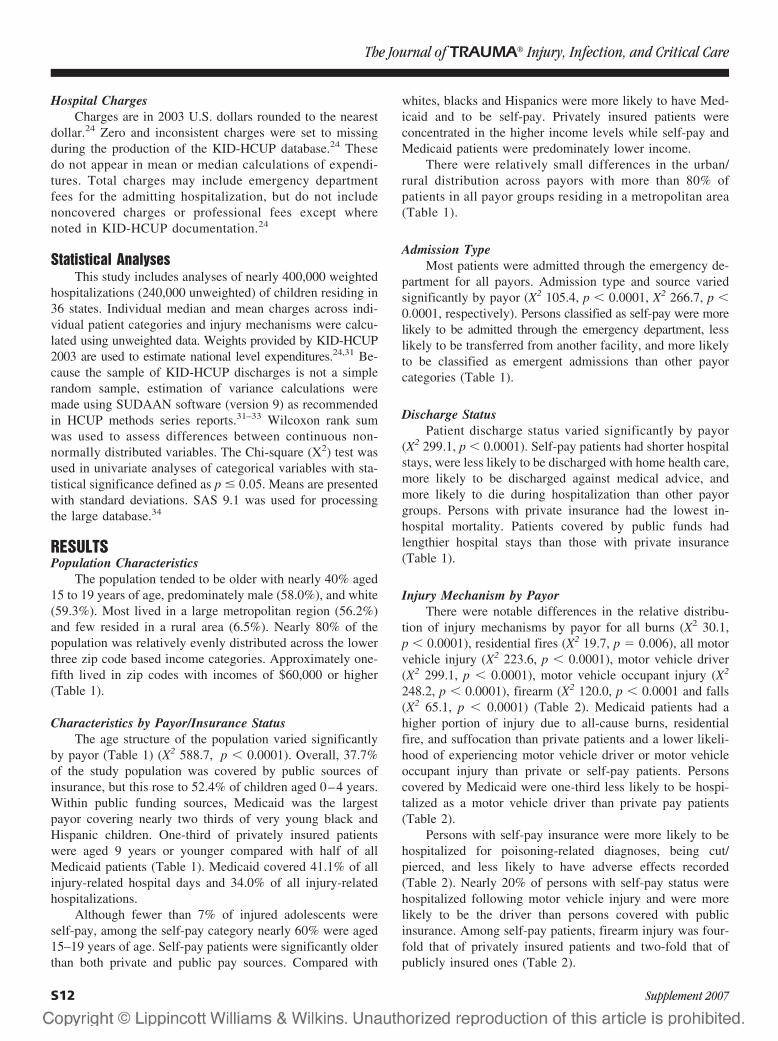
The population tended to be older with nearly 40% aged15 to 19 years of age, predominately male (58.0%), and white(59.3%). Most lived in a large metropolitan region (56.2%)and few resided in a rural area (6.5%). Nearly 80% of thepopulation was relatively evenly distributed across the lowerthree zip code based income categories. Approximately one-fifth lived in zip codes with incomes of $60,000 or higher(Table 1).
Characteristics by Payor/Insurance StatusThe age structure of the population varied significantly
by payor (Table 1) (X2 588.7, p � 0.0001). Overall, 37.7%of the study population was covered by public sources ofinsurance, but this rose to 52.4% of children aged 0–4 years.Within public funding sources, Medicaid was the largestpayor covering nearly two thirds of very young black andHispanic children. One-third of privately insured patientswere aged 9 years or younger compared with half of allMedicaid patients (Table 1). Medicaid covered 41.1% of allinjury-related hospital days and 34.0% of all injury-relatedhospitalizations.
Although fewer than 7% of injured adolescents wereself-pay, among the self-pay category nearly 60% were aged15–19 years of age. Self-pay patients were significantly olderthan both private and public pay sources. Compared with
whites, blacks and Hispanics were more likely to have Med-icaid and to be self-pay. Privately insured patients wereconcentrated in the higher income levels while self-pay andMedicaid patients were predominately lower income.
There were relatively small differences in the urban/rural distribution across payors with more than 80% ofpatients in all payor groups residing in a metropolitan area(Table 1).
Admission TypeMost patients were admitted through the emergency de-
partment for all payors. Admission type and source variedsignificantly by payor (X2 105.4, p � 0.0001, X2 266.7, p �0.0001, respectively). Persons classified as self-pay were morelikely to be admitted through the emergency department, lesslikely to be transferred from another facility, and more likelyto be classified as emergent admissions than other payorcategories (Table 1).
Discharge StatusPatient discharge status varied significantly by payor
(X2 299.1, p � 0.0001). Self-pay patients had shorter hospitalstays, were less likely to be discharged with home health care,more likely to be discharged against medical advice, andmore likely to die during hospitalization than other payorgroups. Persons with private insurance had the lowest in-hospital mortality. Patients covered by public funds hadlengthier hospital stays than those with private insurance(Table 1).
Injury Mechanism by PayorThere were notable differences in the relative distribu-
tion of injury mechanisms by payor for all burns (X2 30.1,p � 0.0001), residential fires (X2 19.7, p � 0.006), all motorvehicle injury (X2 223.6, p � 0.0001), motor vehicle driver(X2 299.1, p � 0.0001), motor vehicle occupant injury (X2
248.2, p � 0.0001), firearm (X2 120.0, p � 0.0001 and falls(X2 65.1, p � 0.0001) (Table 2). Medicaid patients had ahigher portion of injury due to all-cause burns, residentialfire, and suffocation than private patients and a lower likeli-hood of experiencing motor vehicle driver or motor vehicleoccupant injury than private or self-pay patients. Personscovered by Medicaid were one-third less likely to be hospi-talized as a motor vehicle driver than private pay patients(Table 2).
Persons with self-pay insurance were more likely to behospitalized for poisoning-related diagnoses, being cut/pierced, and less likely to have adverse effects recorded(Table 2). Nearly 20% of persons with self-pay status werehospitalized following motor vehicle injury and were morelikely to be the driver than persons covered with publicinsurance. Among self-pay patients, firearm injury was four-fold that of privately insured patients and two-fold that ofpublicly insured ones (Table 2).
The Journal of TRAUMA� Injury, Infection, and Critical Care
S12 Supplement 2007
National Expenditure Estimates for Injury versus Non-InjuryThe total estimated expenditure for injury in 0 to 19
year olds is shown in Figure 1a. The total hospitalizationexpenditures are $70.3 billion of which $14.8 billion (21.1%)is injury-related. The proportion of total hospital expendi-tures accounted for by injury varies only marginallyamong payors—21.8% for private and 20.1% for totalpublic expenditures except among the self-pay categorywhere the proportion of total hospital expenditures ac-
counted for by injury approaches one-third (31.6%). Ap-proximately 10% of all unweighted Medicaid hospitaliza-tions are due to injury, but account for approximately 20%of all Medicaid hospitalization dollars.
Mean/Median Expenditures for Injury versusNon-Injury Hospitalization
The mean/median per case charges for ages 0–19 yearsare significantly higher for injury versus non-injury admis-
Table 1 Population Characteristics for Patients Aged 0 to 19 yr Hospitalized for Acute Injury by Payor asCalculated from Weighted KID-HCUP Data (2003)
Population Characteristics
Primary Payor, n (%)Total (includes allpayors and otheror unspecified)
PrivateInsurance Self-Pay Medicaid
Total PublicCost (includes
Medicaid/Medicare)
Population (n, %) 209,468 (52.6) 27,235 (6.8) 135,108 (34.0) 150,155 (37.7) 397,943 (100.0)Age median (interquartile range) 13.0 (10.0) 16.0 (8.8) 9.0 (14.0) 10.3 (13.6) 13.0 (11.8)Age distribution (yr, %)
0 to 4 40,600 (19.4) 3,669 (13.5) 47,370 (35.1) 50,726 (33.8) 96,386 (24.2)5 to 9 31,389 (15.0) 2,877 (10.6) 21,357 (15.8) 23,457 (15.6) 58,898 (14.8)10 to 14 44,774 (21.4) 3,847 (14.1) 24,621 (18.2) 27,392 (18.2) 77,931 (19.6)15 to 19 89,334 (42.7) 15,992 (58.7) 40,309 (29.8) 46,872 (31.2) 158,573 (39.9)
Gender: male 121,064 (57.8) 17,463 (64.1) 76,538 (56.7) 85,227 (56.8) 230,878 (58.0)Race1
White 105,331 (73.9) 8,911 (49.3) 38,430 (40.6) 43,981 (41.7) 161,856 (59.3)Black 14,612 (10.3) 3,544 (19.6) 22,976 (24.3) 24,633 (23.4) 43,666 (16.1)Hispanic 18,059 (12.7) 5,118 (28.3) 30,251 (32.0) 33,373 (31.6) 58,615 (21.5)Asian/Pacific Islander 3,746 (2.6) 407 (2.3) 2,011 (2.1) 2,382 (2.3) 6,639 (2.4)Native American 783 (0.6) 107 (0.6) 926 (1.0) 1,107 (1.1) 2034 (0.8)
Urban/ruralLarge metropolitan 118,679 (56.7) 16,034 (58.9) 74,850 (55.4) 83,045 (55.3) 223,743 (56.2)Small metropolitan 57,285 (27.4) 6,124 (22.5) 36,309 (26.9) 40,959 (27.3) 106,949 (26.9)Micropolitan 18,812 (9.0) 2,596 (9.5) 13,595 (10.1) 14,893 (9.9) 37,553 (9.4)Non-urban 12,494 (6.0) 1,812 (6.7) 9,591 (7.1) 10,297 (6.9) 25,654 (6.5)
Median household income forpatient’s zip code (USdollars)
$1–$35,999 35,198 (16.8) 8,343 (30.6) 54,948 (40.7) 58,786 (39.2) 106,026 (26.6)$36,000–$44,999 46,785 (22.3) 7,694 (28.3) 37,694 (27.9) 41,992 (28.0) 99,389 (25.0)$45,000–$59,999 56,651 (27.1) 5,923 (21.8) 26,960 (20.0) 31,002 (20.7) 95,875 (24.1)$60,000 or higher 65,387 (31.2) 4,135 (15.2) 12,453 (9.3) 14,848 (9.9) 86,124 (21.6)
Admission sourceEmergency department 128,005 (61.1) 21,327 (78.3) 82,179 (60.8) 90,512 (60.3) 247,278 (62.1)Another hospital 14,162 (6.8) 1,225 (4.5) 10,735 (8.0) 11,712 (7.8) 27,607 (6.9)Other 65,423 (31.2) 4,519 (16.6) 41,121 (30.4) 46,780 (31.2) 119,671 (30.1)
Admission typeEmergent 109,850 (52.4) 18,070 (66.4) 66,745 (49.4) 72,255 (48.1) 207,010 (52.0)Urgent 34,671 (16.6) 3,402 (12.5) 23,293 (17.2) 25,456 (17.0) 65,349 (16.4)Other 30,064 (14.4) 2,662 (9.8) 17,400 (12.9) 18,974 (12.6) 53,202 (13.4)
Discharge statusRoutine 186,067 (88.8) 24,365 (89.5) 118,303 (87.6) 131,573 (87.6) 351,688 (88.4)Another facility for inpatient
care10,366 (5.0) 1,382 (5.1) 7,025 (5.2) 7,776 (5.2) 20,188 (5.1)
Home health 9,551 (4.6) 477 (1.8) 6,826 (5.1) 7,431 (5.0) 17,897 (4.5)Against medical advice 577 (0.3) 493 (1.8) 703 (0.5) 775 (0.5) 1,919 (0.5)Died 2,393 (1.1) 460 (1.7) 1,947 (1.4) 2,250 (1.5) 5,285 (1.3)
Length of stay (mean � SD) 4.8 (10.4) 3.4 (6.8) 6.5 (14.9) 6.5 (14.6) 5.4 (12.2)1 Percents for those with reported race. Six states report race/ethnicity as other/unknown (Georgia, Kentucky, Maine, Oregon, Washington
and West Virginia). Not reported or missing race was: Private insurance 66,936 (32.0); Self-pay 9,150 (33.6); Medicaid 40,514 (30.0); Total publiccost 44,678 (29.8); Total 125,133 (31.4).
National Injury Expenditure in Children
Volume 63 • Number 3 S13

Table 2 Injury-Related Hospitalizations by Payor for the U.S. Population Aged 0 to 19 yr Calculated fromWeighted KID-HCUP Data (2003)
Population Characteristics
Primary Payor, n (%) Total PublicCost (includes
Medicaid/Medicare)
Total (includes allpayors and otheror unspecified)
PrivateInsurance Self-Pay Medicaid
Population (n, %) 209,468 (52.6) 27,235 (6.8) 135,108 (34.0) 150,155 (37.7) 397,943 (100.0)E-codes repored (n, %) 161,627 (77.2) 23,259 (85.4) 99,993 (74.0) 110,771 (73.8) 304,531 (76.5)Distribution of unintentional
injury mechanisms(n,% for those withreported e-codes)
Falls 32,644 (20.2) 3,394 (14.6) 17,716 (17.7) 19,542 (17.6) 56,824 (18.7)Burns, total 5,374 (3.3) 720 (3.1) 5,730 (5.7) 6,099 (5.5) 12,558 (4.1)
Fire/burn 3,827 (2.4) 594 (2.6) 4,828 (4.8) 5,116 (4.6) 9,818 (3.2)Residential fire 1,980 (1.2) 241 (1.0) 2,338 (2.3) 2,489 (2.3) 4,772 (1.6)
Motor vehicle traffic§ 32,812 (20.3) 5,341 (22.9) 12,857 (12.9) 14,632 (13.2) 54,716 (18.0)Occupant, all 23,652 (14.6) 3,807 (16.3) 8,020 (8.0) 9,219 (8.3) 38,166 (12.5)Driver 10,517 (6.5) 1,649 (7.1) 2,315 (2.3) 2,828 (2.6) 15,684 (5.2)Passenger 13,137 (8.1) 2,162 (9.3) 5,706 (5.7) 6,391 (5.8) 22,486 (7.4)
Pedestrian, all 4,732 (2.9) 811 (3.5) 3,201 (3.2) 3,493 (3.2) 9,249 (3.0)Poisoning 20,508 (12.7) 4,136 (17.8) 14,407 (14.4) 15,772 (14.2) 41,501 (13.6)Cut, Pierced 6,280 (3.9) 1,928 (8.3) 5,152 (5.2) 5,744 (5.2) 14,609 (4.8)Pedal cyclist 4,354 (2.7) 536 (2.3) 2,211 (2.2) 2,419 (2.2) 7,490 (2.5)Adverse effects 14,276 (8.8) 545 (2.3) 10,355 (10.4) 12,091 (10.9) 27,297 (9.0)
Drugs 7,522 (4.7) 334 (1.4) 5,903 (5.9) 6,659 (6.1) 14,764 (4.9)Medical care 7,607 (4.7) 254 (1.0) 5,001 (5.0) 5,997 (5.4) 14,123 (4.6)
Drowning 1,073 (0.7) 182 (0.8) 860 (0.9) 920 (0.8) 2,221 (0.7)Struck by/against 12,480 (7.7) 1,726 (7.4) 6,083 (6.1) 6,848 (6.2) 21,838 (7.2)Suffocation 1,379 (0.9) 169 (0.7) 1,480 (1.5) 1,592 (1.4) 3,180 (1.0)Firearm, all intents 2,036 (1.3) 1,221 (5.3) 2,897 (2.9) 3,187 (2.9) 6,691 (2.2)1 For purposes of total cost analysis, there were 85 (self pay), 510 (Medicaid), 530 (other government) 383 (private insurance) and 1,040
(total) additional cases of total burns identified from condition codes where e-codes were not reported. These additional cases are not includedin the cell counts above.
§ Includes occupant, pedestrian, unspecified, and other categories.
Fig. 1. a. Total expenditures (in billion U.S. dollars) for patients aged 0–19 years hospitalized for injury and non-injury diagnoses by payor(2003). Payor categories included private (private insurance) self-pay (self), Medicaid, and total public cost. Figure 1b. Mean and medianexpenditures per patient hospitalization by payor for injured and non-injured patients. Payor categories included private (private insurance)self-pay (self), and Medicaid.
The Journal of TRAUMA� Injury, Infection, and Critical Care
S14 Supplement 2007

sions (Fig. 1b). Within each payor, males accounted for ahigher proportion of all injuries and had slightly highercharges per admission. Self-pay patients had lower mean andmedian charges for injuries than other payor categories.
Expenditures by Injury Severity and Patient DischargeStatus
Median charges are approximately 5 fold higher in per-sons who died versus those discharged alive (Fig. 2a and 2b).This is partially explained by the higher charges associatedwith increasing injury severity and longer length of stays(Fig. 3). There were significant differences in the proportionof patients with severe ISS scores 25 and above who diedversus lived (75% versus 2%, p � 0.0001) and in the chargesby injury severity.
Among patients who lived, increasing injury severity isassociated with gradually increasing median charges at lower
levels of injury (ISS � 25) and exponential increases athigher ISS levels. At the highest severity categories, mediancharges more than double between ISS categories 16–24compared with ISS category 25–40 and increase five foldbetween ISS category 16–24 compared with the highest se-verity ISS category 41–75 (Fig. 2a, 2b).
Among those who died, the lowest injury severity cate-gory had the lowest charges and the highest injury severitycategory had highest, but median charges among those whodied before discharge are less striking than in those wholived. Median length of hospital stay is 1 day for all injuryseverity categories who died, but the mean length of stay inlow injury severity categories indicates stays that are nearly 3times longer for those who died versus lived (Fig. 3).
Mean/Median Expenditures by Payor and Mechanism ofInjury
The highest per person costs of injury are for firearms,motor vehicle (occupant, driver, or pedestrian), and burns.With few exceptions, both mean and median Medicaidcharges tended to exceed those of private and self-pay cate-gories across the most common mechanisms of injury (Fig.4a, 4b). The relative rank of injury mechanism by expenditureper injury is comparable whether mean or median charges areexamined despite the near doubling of mean compared withmedian charges (Fig. 4a, 4b).
National Expenditures for Hospitalization of Injury byMechanism, Payor and Age Group
Total national expenditures are shown for major injurymechanisms by payor in Figure 5a and by age group in Figure5b. Motor vehicle occupant injury (which includes drivers)occurred at a relatively high frequency with high charges percase and contributes the largest portion of expenditures. This
Fig. 2. a. Median per patient charges (unweighted) by patient outcome (lived/died) and Injury Severity Score (ISS). ISS was categorized as1–8, 9–15, 16–24, 25–40, and 41–75. Figure 2b. Median per patient charges (unweighted) by patient outcome (lived/died) and InternationalClassification of Injury Severity Score (ICISS). ICISS was categorized into 4 equal quartiles by survival (high score � low severity).
Fig. 3. Mean and median lengths of stay by ISS category for thosewho lived to be discharged versus died during the hospital stay.
National Injury Expenditure in Children
Volume 63 • Number 3 S15

is followed by falls which had lower expenditures per case,but higher frequency of occurrence.
Although very young children account for relativelysmaller portion of expenditures than adolescents and teenag-ers, injury expenditures in this age group are disproportion-ately paid by Medicaid. Burn-related injury was notable forits relative concentration in very young children where theage group 0–4 years accounted for 59.2% of all burn-relatedexpenditures. Among those aged 0 to 4 years hospitalized forpoisoning, Medicaid covered 58.4% of expenditures and46.4% of motor vehicle occupant injury in this age group.
DISCUSSIONSeveral injury mechanisms with known best practices for
prevention continue to contribute significantly to the total
injury burden, from both a financial and population healthperspective.1,8,11–18 Medical treatment for injury accounts fora significant portion of the U.S. health dollar with direct costspreviously noted to be $80 billion dollars for the U.S. popu-lation in 2000.35 Our study suggests that just under 20% ofthis is for hospital-related care of infants, children, adoles-cents, and teenagers.
This study provides clues to areas where more universalapplication of effective injury prevention interventions—such as fire, burn, poisoning, and occupant restraints in veryyoung children and motor vehicle driver interventions forteens—might be used to lower the hospitalization costs as-sociated with injury. In particular, burn and firearm-relatedinjuries were more costly per case and occurred with greaterfrequency among public versus private payors. Among very
Fig. 4. a, 4b. Mean and median per patient charges (unweighted) by payor and mechanism of injury. Payor categories included self-pay(self), private (private insurance) and Medicaid.
Fig. 5. a, 5b. Total annual hospitalization charges (2003) for the leading mechanisms of injury by payor (5a) and by mechanism and age(5b) of the patient for children and adolescents aged 0–4, 5–9, 10–14, and 15–19 years of age. Data are weighted to produce nationalestimates.
The Journal of TRAUMA� Injury, Infection, and Critical Care
S16 Supplement 2007

young children, Medicaid covered more than half of expen-ditures for burns and poisoning, and nearly half of all motorvehicle occupant injuries.
Injury prevention generally impacts the cost burden througheither decreasing incidence of a particular injury mechanism(primary prevention) or through decreasing severity (secondaryor tertiary prevention) or a combination of the two.36–37 Thesefindings suggest that one might impact total public expendi-tures for injury by identifying and targeting mechanisms thatcontribute significantly to public expenditures through moreuniversal application of proven interventions in resource-limited communities. Interventions that lower either inci-dence and/or severity of injury could impact admissions,length of stay, intensity of care and charges associated withhospitalization.
The implementation of effective prevention measures hasbeen shown to decrease the incidence of injuries or relatedhospitalizations across multiple mechanisms including burns,poisonings, and motor vehicle injuries.1,8,10 Specifically, asuccessful smoke alarm give-away program resulted in an80% decrease in annual rates of fire-related injury in anOklahoma community.38 Injuries are 50% more likely toresult from fires in homes without smoke alarms that workproperly, but functional alarms greatly reduce both fatal andnon-fatal burn injuries.8,39 Smoking rates are reported to behigher in persons of lower educational attainment and tocontribute significantly to burn-related injuries in young chil-dren. Child-safe cigarette lighters have been shown to reducethe number of fires started by young children by 70%.8,40–41
These results suggest that smoking cessation programs, gen-erally initiated for cancer prevention, could benefit commu-nities through lowering burn and fire injury.
A 12% decrease in hospitalizations due to poisonings hasbeen reported with the advent of poison control centers.17
Graduated licensing and zero-tolerance alcohol laws havebeen shown to effectively reduce motor vehicle crashes in-volving young drivers. A median decrease of more than 30%in rates of motor vehicle crashes has been reported followinginitiation of graduated licensing laws, while the number ofcrashes related to alcohol fell by 20%.8,42 A 20% reduction inrates of fatal crashes in which 16 year old drivers are involvedhas been reported in the presence of broad graduated licens-ing laws.43
Increasing injury severity was associated with higherexpenditures among those who lived and died, although thiswas more pronounced in persons who survived to discharge.Two separate injury severity scoring methods yielded similarfindings in the relation between expenditures and injury se-verity among persons who survived with increasing injuryseverity derived from both the ISS and the ICISS demonstrat-ing significant positive association between injury severityand increasing expenditures for non-fatal injuries. The rela-tion between recorded injury severity was weaker amongpatients who subsequently died than those who survived todischarge with the ISS exhibiting a stronger relation between
injury severity and expenditures among those who subse-quently died.
Fatal injuries are reported to account for less than 1% ofall injury but 17% of all costs.8 Our study suggests thatseveral factors contribute to higher costs among those whodie including a more severely injured case mix, higher inten-sity of care, and longer lengths of stay among patients withlower severity scores who subsequently died. In addition,higher incidence of costly mechanisms with greater fatalityrates may contribute to the increased expenditures in thosewho die in-hospital.
Injury in children has been previously noted to comprisea significant portion of the direct medical expenditures ac-counting for 11% of all-cause hospital stays, 39% of emer-gency department visits, and 9% of all physician visits.8 Ourfinding that Medicaid insurance status is associated withlonger hospital stays has been previously reported.44,45 Wedid not find differences in injury severity or in number ofprocedures that would account for the increased length of staybetween public and private payors. Longer hospital stayscontribute to higher per case charges and may reflect the lagin penetration of managed care into public payors or greaterdifficulty in planning for post-discharge care in a resource-limited population.
Since the introduction of national child health insurancein the late 1990s, there have been significant developments ininjury prevention, in the financing and delivery of healthservices, and in the proportion of U.S. children with hospi-talization data available for analysis. Before the widespreadexpansion of the child health insurance program, Medicaidwas noted to cover 39% of all injury-related hospital daysamong children.8 Post-implementation of child health insur-ance, this had increased slightly with Medicaid covering41.1% of all injury-related hospital days and 34% of allinjury-related hospitalizations. The Medicaid population hasbeen reported to have higher injury rates with one studynoting twice the rate of injury of other populations withmedical costs for injuries accounting for about half of thecapitated reimbursement for young children.7,45
This study had limitations. Although the dataset wasdesigned for such purposes, we made national estimatesbased on data from 36 states. Bias may have been introducedif these represented states differ from the U.S. population.Within the injury mechanism categorizations, we were unableto include calculations for injury-related expenditures in per-sons who did not receive an appropriate e-code. Lack ofe-codes on a significant proportion of the population is likelyto produce underestimates of expenditures associated withthose mechanisms. This occurred in approximately 20% ofinjuries. This study includes direct hospitalization expendi-tures. It was not possible to include all professional fees, postdischarge care, emergency department visits, outpatient care,or non-medical costs such as lost work days. Data complete-ness and quality varied by state as did the willingness ofstates to contribute data uniformly to the sampling frame.
National Injury Expenditure in Children
Volume 63 • Number 3 S17

Several states did not provide data on race/ethnicity and atleast 2 states withheld age when alcohol, substance abuse, orHIV/AIDS were present. Weights are based on a hospitalsampling frame. Although not included in public expendi-tures for injury, the self-pay category frequently ends upbeing uncollected funds and gets written off as bad debt orcharity care. When these hospitals are local or state govern-ment funded, these patients may become public expenditures,but are not included in our public expenditure category. Tothe extent this happens, our estimates of public expendituresare likely underestimates of the true public cost burden ofinjuries.
In summary, periodic re-evaluation of where public in-jury dollars are being spent may be useful to injury preven-tion advocates who frequently note the disproportionatelylow funding levels for prevention relative to the injury-relatedmortality, morbidity, and disability burden. As the largestpublic payor, Medicaid spent a significant portion of theirhealth care dollar on injury. Our study demonstrates thatseveral mechanisms for which effective prevention measuresexist continue to be significant contributors to injury-relatedhospital expenditures and call into question whether the cur-rent allocation of resources is optimal. Further use of non-injury related resources, such as legislation and enforcementof that legislation, has been shown to have added impact overeducation and product distribution alone. Thus, implementa-tion and enforcement of a variety of preventive measures arestrategies to reduce not only the burden of injury in thepopulation, but also the excessive public and private costs ofsuch injuries.
ACKNOWLEDGMENTSThis work was supported by NIH grant 1P60MD000206 and by the
Robert Wood Johnson Foundation of Princeton, NJ. We are deeplygrateful to the University of Florida at Jacksonville for providing accessand technical assistance in the use of ICISS injury severity scoring.Invaluable research assistance was provided by Lisa Trieu in computerinjury severity scoring for KID-HCUP using two separate scoring mech-anisms and from Tiffany Kendig in SAS and SUDAAN computer work.This work was presented at the Annual Conference of the Injury FreeCoalition for Kids, December 2006.
REFERENCES1. Institute of Medicine, Bonnie RJ, Fulco CE, Liveryman CT, eds.
Reducing the Burden of Injury: Advancing Prevention andTreatment. Washington, DC: National Academy Press; 1999;85–86.
2. Pressley JC, Barlow BA, Durkin MS, et al. A national program forinjury prevention in children and adolescents: The Injury FreeCoalition for Kids. J Urban Health. 2005;82:389–402.
3. Centers for Disease Control. Child passenger restraint use and motorvehicle related fatalities among children—United States 1982–1990,MMWR Morb Mortal Wkly Rep. 1991;40:600–602.
4. U.S. General Accounting Office. Accidental deaths: many deaths andinjuries caused by firearms could be prevented. Washington, DC; U.S.General Accounting Office, 1991. (Publication no. GAOP/PEMD-91-9.)
5. Pressley JC, Barlow BA. Preventing Injury and Injury-RelatedDisability in Children and Adolescents. Semin Pediatr Surg. 2004;13:133–140.
6. Leroy JL, Habicht JP, Pelto G, et al. Impact of current priorities inhealth research funding on the number of child deaths per year.(Am J Public Health. 2006; in press.)
7. Bishai D, McCauley J, Trifiletti LB, et al. The burden of injury inpreschool children in an urban medicaid managed care organization.Ambul Pediatr. 2002;2:279–83.
8. Miller TR, Romano EO, Spicer RS. The cost of childhoodunintentional injuries and the value of prevention. Future Child.2000;10:137–163.
9. Danseco ER, Miller TR, Spicer RS. Incidence and costs of 1987–1994childhood injuries: demographic breakdowns. Pediatrics. 2000 Feb;105:E27.
10. U.S. Preventive Services Task Force. Guide to clinical preventiveservices, Report of the U.S. Preventive Services Task Force, 2nd ed,Philadelphia, PA, Lippincott Williams and Wilkins.
11. Quayle KS, Wick NA, Gnauck KA, Schootman M, Jaffe DM.Description of Missouri children who suffer from burn injuries. InjPrev. 2000;6:255–8.
12. Pressley JC, Paneth-Pollak RI, Barlow BA, et al. Twenty year trendsin fatal injuries to very young children: The persistence of ethnicdisparities (Pediatrics., in press).
13. Miller TR, Levy DT. Cost-outcome analysis in injury prevention andcontrol: Eighty-Four recent estimates for the United States. MedCare. 2000;38:562–582.
14. Miller TR, Zaloshnja E, Hendrie D. Cost-outcome analysis ofbooster seats for auto occupants aged 4 to 7 years. Pediatrics. 2006;118:1994–8.
15. Pressley JC, Barlow B. Child and adolescent injury as a result offalls from buildings and structures. Inj Prev. 2005;11:267–73.
16. Miller TR, Lestina DC, Spicer RS. Highway crash costs in theUnited States by driver age, blood alcohol level, victim age, andrestraint use. Accid Anal Prev. 1998;30:137–50.
17. Miller TR, Lestina DC. Costs of poisoning in the United States andsavings from poison control centers: a benefit-cost analysis. AnnEmerg Med. 1997;29:239–45.
18. Miller TR, Lestina DC, Galbraith MS. Patterns of childhood medicalspending. Arch Pediatr Adolesc Med. 1995;149:369–73.
19. Christoffel T, Gallagher SS. Injury Prevention and Public Health:Practical Knowledge, Skills, and Strategies. Aspen Publishers,1999.
20. Harlan LC, Harlan WR, Parsons PE. The economic impact of injuries: amajor source of medical costs. Am J Public Health. 1990;80:453–9.
21. Roberts I, DiGuiseppi C, Ward C. Childhood injuries: extent of theproblem, epidemiological trends, and costs. Inj Prev. 1998;4:S10–S16.
22. Runge JW. The cost of injury. Emerg Med Clin North Am. 1993;11:241–53.
23. Simpson L. Health care for children and youth in the United States:2001 annual report on access, utilization, quality, and expenditures.Ambul Pediatr. 2002;2:419–37.
24. HCUP Kids’ Inpatient Database (KID). Healthcare Cost and UtilizationProject (HCUP). 2000 and 2003. Agency for Healthcare Research andQuality, Rockville, MD. www.hcup-us.ahrq.gov/kidoverview.jsp.
25. U.S. Census Bureau. Available at: http://www.census.gov/.26. Morbidity and mortality weekly report. Recommended framework
for presenting injury mortality data MMWR Morb Mortal WklyRep. 1997;46. (Also available electronically http://www.cdc.gov/mmwr/PDF/rr/rr4614.pdf.)
27. World Health Organization. International Classification of Diseases,9th revision, (ICD-9-CM) 1999, Vol 1 and 2, 8th ed. McGraw-Hill,Inc. New York, 1999.
28. Agency for Health Care Policy and Research. 1999. Clinicalclassifications for health policy research: tools for decision makingand research. AHCPR Pub no. 98-0049. Rockville, US: Departmentof Health and Human Services.
The Journal of TRAUMA� Injury, Infection, and Critical Care
S18 Supplement 2007

29. Meredith JW, Kilgo PD, Osler TM. Independently derived survivalrisk ratios yield better estimates of survival than traditional survivalrisk ratios when using the ICISS. J Trauma. 2003;55:933–938.
30. Rutledge R, Osler T, Emery S, et al. The end of the Injury SeverityScore (ISS) and the Trauma and Injury Severity Score (TRISS):ICISS, an International Classification of Diseases, ninth revision-based prediction tool, outperforms both ISS and TRISS as predictorsof trauma patient survival, hospital charges, and hospital length ofstay. J Trauma. 1998;44:41–49.
31. Healthcare Cost and Utilization Project (HCUP). Calculating Kid’sinpatient database (KID) variances. Methods Series Report #2005-5.2005. Agency for Healthcare Research and Quality, Rockville, MD.Available at: http://www.hcup-us.ahrq.gov/db/nation/kid/reports/CalculatingKIDVariances.pdf.
32. Research Triangle Institute (2004). SUDAAN Language Manual,Release 9.0. Research Triangle Park, NC: Research TriangleInstitute.
33. Research Triangle Institute (2004). SUDAAN Example Manual,Release 9.0. Research Triangle Park, NC: Research TriangleInstitute.
34. SAS Institute Inc. (2004). SAS/STAT® 9.1 User’s Guide. Cary, NC:SAS Institue Inc. Accessed at: http://support.sas.com/documentation/onlinedoc/91pdf/sasdoc_91/-stat_ug_7313.pdf.
35. Corso P, Finkelstein E, Miller T, et al. Incidence and lifetime costsof injuries in the United States. Inj Prev. 2006;12:212–218.
36. Rivara FP, Grossman DC, Cummings P. Injury prevention. First oftwo parts. N Engl J Med. 1997;337:543–8.
37. Rivara FP, Grossman DC, Cummings P. Injury prevention. Secondof two parts. N Engl J Med. 1997;337:613–8.
38. Mallonee S, Istre GR, Rosenberg M, et al. Surveillance andprevention of residential-fire injuries. N Engl J Med. 1996;335:27–31.
39. Istre GR, McCoy MA, Osborn L, et al. Deaths and injuries fromhouse fires. N Engl J Med. 2001;344:1911–6.
40. Ellickson PL, Orlando M, Tucker JS, et al. From adolescence toyoung adulthood: racial/ethnic disparities in smoking. Am J PublicHealth. 2004;94:293–9.
41. Istre GR, McCoy M, Carlin DK, et al. Residential fire related deathsand injuries among children: fireplay, smoke alarms, and prevention.Inj Prev. 2002;8:128–32.
42. Hartling L, Wiebe N, Russell K, et al. Graduated driver licensing forreducing motor vehicle crashes among young drivers. CochraneDatabase Syst Rev. 2004;(2):CD003300.
43. Chen LH, Baker SP, Li G. Graduated driver licensing programs andfatal crashes of 16-year-old drivers: a national evaluation. Pediatrics2006;118:56–62.
44. Schneier AJ, Shields BJ, Hostetler SG et al. Incidence of pediatrictraumatic brain injury and associated hospital resource utilization inthe United States. Pediatrics. 2006;118:483–92.
45. Elixhauser A, Machlin SR, Zodet MW, et al. The cost of medicalcare for injuries to children. Ann Emerg Med. 1991;20:997–1005.
National Injury Expenditure in Children
Volume 63 • Number 3 S19

Developing the Miami-Dade County Injury SurveillanceSystem: Using Surveillance to Build Community Capacity forInjury PreventionJudy Schaechter, MD, Stephen Dearwater, MS, and Susan B. Uhlhorn, PhD
The Miami-Dade County InjurySurveillance System was created as partof a hospital-based injury preventionprogram associated with the Injury FreeCoalition for Kids. Initially the programutilized trauma center and mortality
data to describe injury. However, ascommunity programming and coalition-building developed, so did the demandson the surveillance system. Coalitionpartners and potential partners desireda more comprehensive and population-
based system. As a result of the county-wide approach and open access to results,the surveillance system has engaged newpartners and leveraged additional re-sources to injury prevention.
J Trauma. 2007;63:S20–S24.
Public health begins with the description of a problem,its magnitude, and the identification of contributing riskfactors. Prevention strategies are designed to diminish
exposure to risk factors. The effectiveness of these strategiesis most meaningfully measured by a change in the magnitudeof the problem. Surveillance systems are useful at each link,to describe injury, its risk factors, design interventions and toevaluate interventions. Indeed, accurate data acquisition is thecentral purpose of injury surveillance. Thus, injury surveil-lance systems are usually built by and for researchers, plan-ners and health professionals.
Yet, surveillance has multiple purposes, some of whichextend beyond this central purpose. Surveillance can educatecommunity stakeholders and policy makers, build awareness,guide in-depth research and evaluate change over time. Todo so, surveillance systems must be designed for a wideraudience than only those familiar with data. If done well,additional benefits of surveillance include cooperation andresource procurement.1
The Miami-Dade County Injury Surveillance Systemwas designed to assist researchers, pubic health workers andinjury prevention community outreach workers with a moreaccurate understanding of injury in Miami-Dade County. Thesystem began as a necessary component of the four compo-nent model of the Injury Free Coalition for Kids: local data,work in coalition, community and environmental program-ming and evaluation.2 The model has been shown to beeffective in reducing childhood injury.3,4 Consistent withInjury Free’s commitment to work in coalitions, the devel-
opment of the Miami-Dade County Injury Surveillance Sys-tem has meant that its purpose and utilization have extendedbeyond those for whom it was originally conceived.
Surveillance System DevelopmentThe Injury Free Coalition for Kids national office re-
quires that all participating sites engage in injury surveil-lance. How sites do this is decided locally. The national officedoes not specify data sources, covered ages, geographic units,severity or type of injury to be included. At the inception ofInjury Free-Miami in 2001, the Miami site investigators uti-lized its hospital’s trauma data system and county medicalexaminer records to describe severe child injury in the prox-imity of the county’s largest, and only public, hospital. TheRyder Trauma Center at Jackson Memorial Hospital is theonly Level I combined adult and pediatric trauma center inMiami-Dade and Monroe Counties, serving a population of2.4 million persons. The Ryder Trauma Center data systemidentified violence, motor vehicle crashes, pedestrian injuriesand falls as the leading causes of pediatric trauma admission.This information guided the first years of Injury Free–Miamiprogramming.
Thereafter, the Miami site, its community partnersand county decision makers recognized the limits of thistrauma-based surveillance for purposes beyond a preventionprogram serving a single hospital. Investigators wantedmore information concerning the larger scope of injuries,those that resulted in an emergency department visit orhospital admission, but did not warrant a trauma admis-sion. The hospital had a non-contiguous catchment areathat did not correspond to natural or municipal boundaries,and made little sense to policy makers or communityworkers. As the coalition grew, partnerships with individ-uals employed by competing hospitals, or with agencieswhose affiliations crossed hospital and municipal bound-aries were desired. Thus, prevention partners were request-ing data for the county as a whole, and analyzed by
Submitted for publication February 19, 2007.Accepted for publication May 30, 2007.Copyright © 2007 by Lippincott Williams & WilkinsThis article was written for the proceedings from a conference entitled
10th Annual Injury Free Coalition for Kids Conference in San Antonio,Texas. The opinions or assertions contained herein are the private views ofthe authors.
DOI: 10.1097/TA.0b013e31812f5ee0
The Journal of TRAUMA� Injury, Infection, and Critical Care
S20 Supplement 2007

commission district, and by neighborhood. Further, in acommunity of rapid growth and in migration, all concernedwanted to follow trends with population-based rates ratherthan simple admission numbers.
Injury FreeThe Miami site proposed to build a countywide, popu-
lation-based all-injury surveillance system using CDC andSTIPDA guidelines.1,5 To maximize both the detail of infor-mation and the rapidity with which data could be obtainedand reported, the primary data sources sought were a newly-developed electronic medical examiner database for the report-ing of injury deaths and electronic hospital admission data ob-tained directly from all Miami-Dade County hospitals. Updatesfrom these electronic data sources would be requested every 1–3months. Death certificate data would be added for case valida-tion and additional demographics annually.
Data obtained directly from the hospitals instead of thatreported to the state in aggregate was considered advanta-geous for several reasons, including exact residence vari-ables, more diagnosis code fields, inclusion of emergencydepartment visits, and rapidity of direct reporting. However,some participating hospitals were reluctant to provide addressdata, and even those willing to provide such data soon rec-ognized that the quality of residence address data were poor.While other data were of high quality address completionrates were low. Data storage and safety was assured by thecounty health department, which mitigated much hospital andlegal concerns regarding data privacy and security. Ninehospitals seeing the majority of injuries in the county partic-ipated in the surveillance system, but several others resisted,complicating aims at a population-based system. In 2005 thestate mandated the reporting of emergency department data ina format similar to inpatient discharge data. For all thesereasons, Injury-Free Miami adjusted the surveillance systemdesign to rely on state acquired hospital and emergencydepartment data. This resulted in full inclusion of all hospitalsfor a population-based system, but meant that residence datawere limited to zip codes, and there would be a delay in dataacquisition (data reported by state annually).
System Utility in Meeting Goals of Injury FreeAn immediate benefit of changing to an all-hospital,
countywide surveillance system was the recognition thatthough our public hospital saw more patients and moretrauma than any other hospital in the county, it did not see themajority of pediatric injury admissions. (Table 1) Publicrecognition of the dispersion of injury admissions has beenuseful in engaging additional partners and resources. There isa greater willingness across the county and between hospitals,particularly the children’s hospitals, to collaborate on injuryprevention events and programming.
Development of the Miami-Dade County Injury Surveil-lance System has enhanced injury prevention at the countyhealth department in several ways. Before the system, the
county health department had no staff dedicated to injuryprevention, and little information available to residents. Asthe Injury Surveillance System has grown, new resourceshave been identified and applied to injury prevention. First,start up funding for the system included coverage for ahalf-time injury epidemiologist. The health departmentmatched that funding to create a full time position, which isnow continuing in its third year. Second, injury preventionnow has a central role in the work of several county organi-zations. Injury-Free staff worked with the county health de-partment to create for the first time an injury section on theirwebsite (http://www.dadehealth.org/injury/INJURYintro.asp).The web pages include local injury facts, prevention fact sheets,programming and resources, speakers and contacts. Thepages also hold a number of injury data reports, both originalto the Miami-Dade County Injury Surveillance System, andfrom other cited sources. Placing the data on the healthdepartment website makes it widely available to others, with-out concern of putting off present and future partners whomay not have searched on the website of a competing hos-pital. Third, the county health department utilized drowningprevention data from the system to compete for state fundingfor a drowning prevention research project and awarenesscampaign. The Injury Surveillance System was able to iden-tify drowning “hot spots,” water body types and risk factorsfor the region covered. (Fig. 1, Table 2 and Fig. 2) The dataprovided the county health department with a focus on pooldrowning and the most affected zip codes.
The Miami-Dade County Police Department providesanother example of use of the surveillance system to energizeprevention partners and bring new resources to injury pre-vention. The Miami-Dade County Police Department has
Table 1 Hospital Discharges for Injury by Age Group,Miami-Dade Co. Hospitals, 2005
HospitalAges 0–17 Years All Ages
Discharges Percent Discharges Percent
Miami Children’s 533 38.5 545 4.0Jackson Memorial 411 29.7 3,185 23.5Baptist 299 21.6 1,387 10.2Palmetto General 60 4.3 716 5.3Parkway Regional 56 4.0 535 3.9Mercy 721 5.3Kendall Regional 707 5.2Aventura 703 5.2Mount Sinai 694 5.1South Miami 549 4.1Pan American 458 3.4Hialeah 445 3.3Coral Gables 419 3.1Other hospitals 27* 1.9 2,481** 18.3Total 1,386 100.0 13,545 100.0
* The remaining 11 hospitals each represented �2% of the totalpediatric discharges.
** The remaining 11 hospitals each represented �3% of the totaldischarges.
Surveillance System Development
Volume 63 • Number 3 S21
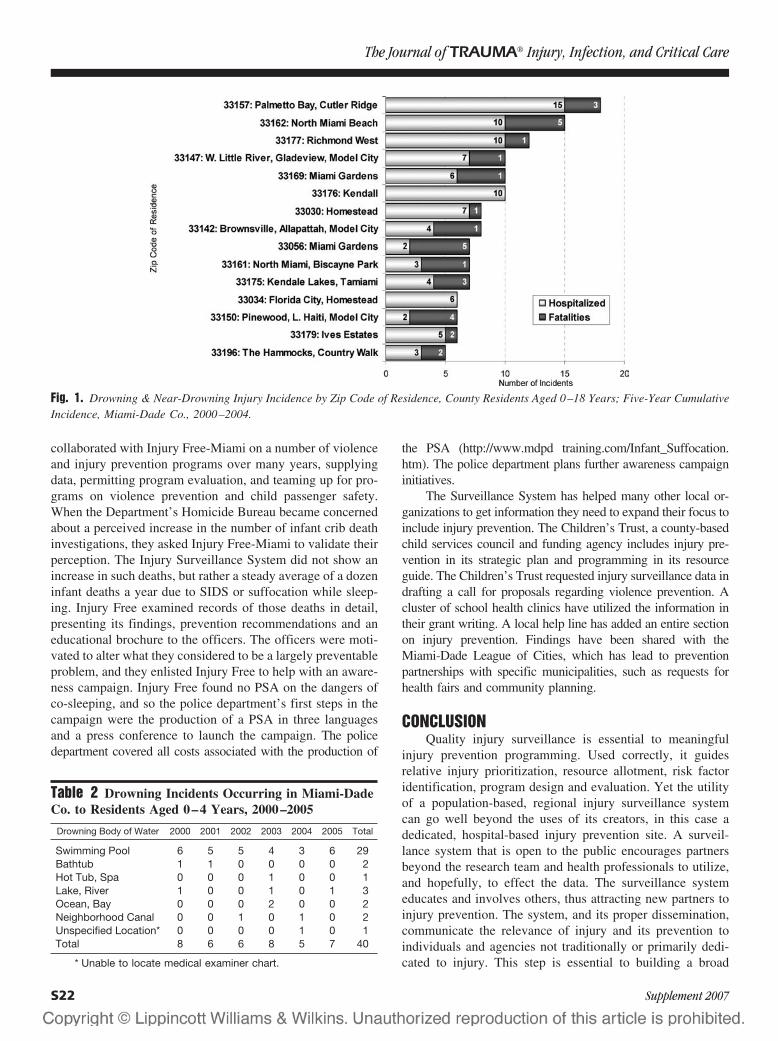
collaborated with Injury Free-Miami on a number of violenceand injury prevention programs over many years, supplyingdata, permitting program evaluation, and teaming up for pro-grams on violence prevention and child passenger safety.When the Department’s Homicide Bureau became concernedabout a perceived increase in the number of infant crib deathinvestigations, they asked Injury Free-Miami to validate theirperception. The Injury Surveillance System did not show anincrease in such deaths, but rather a steady average of a dozeninfant deaths a year due to SIDS or suffocation while sleep-ing. Injury Free examined records of those deaths in detail,presenting its findings, prevention recommendations and aneducational brochure to the officers. The officers were moti-vated to alter what they considered to be a largely preventableproblem, and they enlisted Injury Free to help with an aware-ness campaign. Injury Free found no PSA on the dangers ofco-sleeping, and so the police department’s first steps in thecampaign were the production of a PSA in three languagesand a press conference to launch the campaign. The policedepartment covered all costs associated with the production of
the PSA (http://www.mdpd training.com/Infant_Suffocation.htm). The police department plans further awareness campaigninitiatives.
The Surveillance System has helped many other local or-ganizations to get information they need to expand their focus toinclude injury prevention. The Children’s Trust, a county-basedchild services council and funding agency includes injury pre-vention in its strategic plan and programming in its resourceguide. The Children’s Trust requested injury surveillance data indrafting a call for proposals regarding violence prevention. Acluster of school health clinics have utilized the information intheir grant writing. A local help line has added an entire sectionon injury prevention. Findings have been shared with theMiami-Dade League of Cities, which has lead to preventionpartnerships with specific municipalities, such as requests forhealth fairs and community planning.
CONCLUSIONQuality injury surveillance is essential to meaningful
injury prevention programming. Used correctly, it guidesrelative injury prioritization, resource allotment, risk factoridentification, program design and evaluation. Yet the utilityof a population-based, regional injury surveillance systemcan go well beyond the uses of its creators, in this case adedicated, hospital-based injury prevention site. A surveil-lance system that is open to the public encourages partnersbeyond the research team and health professionals to utilize,and hopefully, to effect the data. The surveillance systemeducates and involves others, thus attracting new partners toinjury prevention. The system, and its proper dissemination,communicate the relevance of injury and its prevention toindividuals and agencies not traditionally or primarily dedi-cated to injury. This step is essential to building a broad
Table 2 Drowning Incidents Occurring in Miami-DadeCo. to Residents Aged 0–4 Years, 2000–2005
Drowning Body of Water 2000 2001 2002 2003 2004 2005 Total
Swimming Pool 6 5 5 4 3 6 29Bathtub 1 1 0 0 0 0 2Hot Tub, Spa 0 0 0 1 0 0 1Lake, River 1 0 0 1 0 1 3Ocean, Bay 0 0 0 2 0 0 2Neighborhood Canal 0 0 1 0 1 0 2Unspecified Location* 0 0 0 0 1 0 1Total 8 6 6 8 5 7 40
* Unable to locate medical examiner chart.
Fig. 1. Drowning & Near-Drowning Injury Incidence by Zip Code of Residence, County Residents Aged 0–18 Years; Five-Year CumulativeIncidence, Miami-Dade Co., 2000–2004.
The Journal of TRAUMA� Injury, Infection, and Critical Care
S22 Supplement 2007
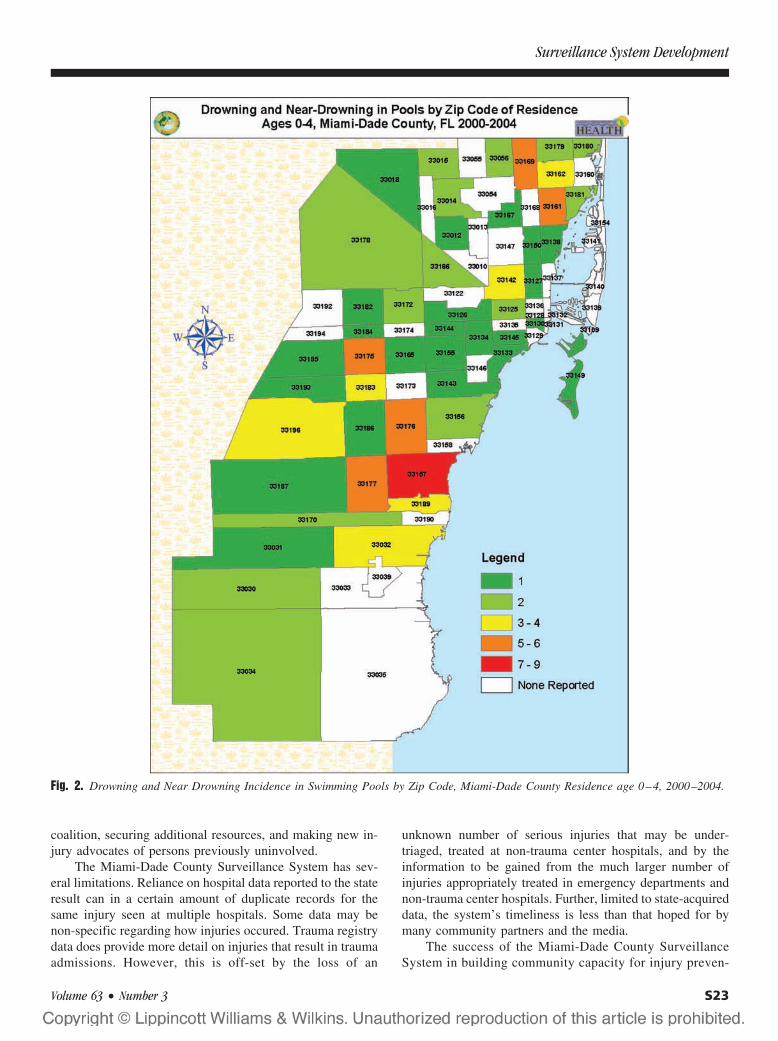
coalition, securing additional resources, and making new in-jury advocates of persons previously uninvolved.
The Miami-Dade County Surveillance System has sev-eral limitations. Reliance on hospital data reported to the stateresult can in a certain amount of duplicate records for thesame injury seen at multiple hospitals. Some data may benon-specific regarding how injuries occured. Trauma registrydata does provide more detail on injuries that result in traumaadmissions. However, this is off-set by the loss of an
unknown number of serious injuries that may be under-triaged, treated at non-trauma center hospitals, and by theinformation to be gained from the much larger number ofinjuries appropriately treated in emergency departments andnon-trauma center hospitals. Further, limited to state-acquireddata, the system’s timeliness is less than that hoped for bymany community partners and the media.
The success of the Miami-Dade County SurveillanceSystem in building community capacity for injury preven-
Fig. 2. Drowning and Near Drowning Incidence in Swimming Pools by Zip Code, Miami-Dade County Residence age 0–4, 2000–2004.
Surveillance System Development
Volume 63 • Number 3 S23

tion relates partly to the comprehensive nature of thesystem—all emergency room visits, hospital and traumaadmissions and deaths for all ages—and partly to thedecision to expand to a population-based system. Thatexpansion may not be necessary in every community, butis quite important in Miami-Dade, a large county withoverlapping jurisdictions, competing hospitals, and chil-dren’s services that span the entire county. It has also beenour experience that making the data easily available on anneutral site has enhanced system utilization. Local datasystems are best not “owned;” those establishing the sys-tem must be willing to forgo much credit due for their ownresource investment. In time, however, that can encourageothers to bring forward new resources. In the experience ofInjury Free – Miami, that is how local injury surveillanceworks for the local community, and the local communityworks for injury prevention.
ACKNOWLEDGEMENTSSurveillance system development was funded in part by the Health Foun-
dation of South Florida. In-kind contributions were made by the Miami-DadeCounty Department of Health and the Jackson Memorial Medical Center.
REFERENCES1. Holder Y, Peden M, Krug E, et al (Eds). Injury Surveillance
Guidelines. Geneva, World Health Organization, 2001.2. http://www.injuryfree.org/about_history.cfm.3. Barlow B, Niemirska M, Gandhi R. Ten years experience with falls
from a height in children. J. Ped. Surg. 1983;18:509–511.4. Durkin MS, Kuhn L, Davidson L, Laraque D, Barlow B.
Epidemiology and prevention of severe assault and gun injuriesto children in an urban community. J. of Trauma. 1996;41:667–673.
5. State and Territorial Injury Prevention Directors’ Association.Consensus Recommendations for Injury Surveillance in State HealthDepartments. Marietta, Georgia, 1999.
The Journal of TRAUMA� Injury, Infection, and Critical Care
S24 Supplement 2007

The Impact of Education, Legislation and Service onAlabama Child Passenger SafetyWilliam D. King, RPH, MPH, DrPH, Kathy Monroe, MD, Janie Applegate, RN, MPH,and Julie Cole-Farmer, RN
J Trauma. 2007;63:S25–S28.
Motor vehicle crashes (MVC) are the leading cause ofdeath and disability for children in the United States andthus represent an important child health issue.1 Nation-
wide efforts have promoted the importance of the appropriateuse of child restraint systems. Effectively increasing and sus-taining appropriate restraint use remains challenging.2,3 Nation-ally, over a period of several years, the National HighwayTraffic Safety Administration directed a series of state incentivegrants that were designed to improve state child passengersafety. These incentive grants encouraged states to 1) includeoccupant safety education; 2) improve existing seat belt andchild restraint legislation; and 3) provide training and servicesdesigned to improve appropriate use of child restraint systems.The availability of these funds led to the creation of a multi-faceted, interventional approach to improve child passengersafety in Alabama. This model approach was designed toenhance caregiver education, increase public awareness, andimprove existing seat belt and child restraint legislation. Thepurpose of this outreach was also to build the capacity toserve Alabama child caregivers with locally based, certifiedchild passenger safety technicians, instructors, and car seatfitting services. The model approach began in late 1999 andcontinued through 2005.
The statewide effort was based upon the popularmodel known as the Four E’s approach, an intervention
using education, environmental modification, engineering,and enforcement.4 Our modification of the Four E’s approachwas intended to maximize favorable impact on child restraintuse, MVC death and serious injury. To accomplish this task,we utilized educational, community services, and legislativeinterventions working in tandem. We hypothesized thatover time the combination of these interventions wouldresult in significant increases in child restraint use withresultant decreases in child passenger death and seriousinjury in Alabama. The purpose of this study was two-fold:1) to prospectively evaluate the effect of the model ap-proach in the intermediate outcomes of child restraintusage (CRU) and improved legislation; and 2) to prospec-tively evaluate changes in child passenger death and seri-ous injury in child passengers less than 10 years of age.
METHODSThe model approach consisted of three main compo-
nents: education, legislation, and services.
EducationThe first component—education—included statewide
print and mass media information which promoted correctchild restraint use. Billboard and radio campaigns designedand implemented by The children’s Hospital of Alabamaadvertised that “80% of loving caring parents put their childat risk by not having their car seat properly installed.” Thecall to action was clear and simple: call a statewide toll freehotline to find out how to get car seats checked. This hotline,staffed by certified RN child passenger safety technicians andinstructors, provided information on proper child restraint useas well as personal consultation (callers could ask specificquestions relating to their child, vehicle, and/or child re-straint system). A statewide Child Passenger Safety (CPS)training and certification program was also designed tocreate an infrastructure of certified technicians, instruc-tors, and permanent fitting stations.
LegislationAlabama Safe Kids served as co-chair of a task force
which supported the passage of the Alabama Primary SeatBelt Law. The Primary Seat Belt Law was enacted in De-cember of 1999. Although this legislation focused upon adultpassengers, previous research cites that adult seat belt use is
Submitted for publication December 5, 2006.Accepted for publication March 23, 2007.Copyright © 2007 by Lippincott Williams & WilkinsThis article was written for the proceedings from a conference entitled
10th Annual Injury Free Coalition for Kids Conference in San Antonio,Texas. The opinions or assertions contained herein are the private views ofthe authors.
Professor of Pediatrics (W.D.K.), University of Alabama, Director ofChild Safety Institute, a division of the Children’s Hospital of Alabama;Associate Professor of Pediatrics (K.M.), University of Alabama; InjuryPrevention Specialist (J.A.); Alabama Safe Kids (J.C.-F.), Children’s Hos-pital of Alabama Birmingham, Alabama.
This study funded by the Alabama Department of Community andEconomic Affairs through a National Highway Traffic Safety FoundationGrant. This study presented in part at the Society for Academic EmergencyMedicine in San Francisco in May 2006 and at the American Academy ofPediatrics meeting in Atlanta in October 2006.
Author for Correspondence: Kathy Monroe, MD, Children’s Hospital,1600 7th Ave South Suite 205 MTC, Birmingham Alabama 35233, Phone:(205)939-9587, Fax: (205) 975-4623, email: [email protected].
DOI: 10.1097/TA.0b013e31812f5e7a
The Journal of TRAUMA� Injury, Infection, and Critical Care
Volume 63 • Number 3 S25
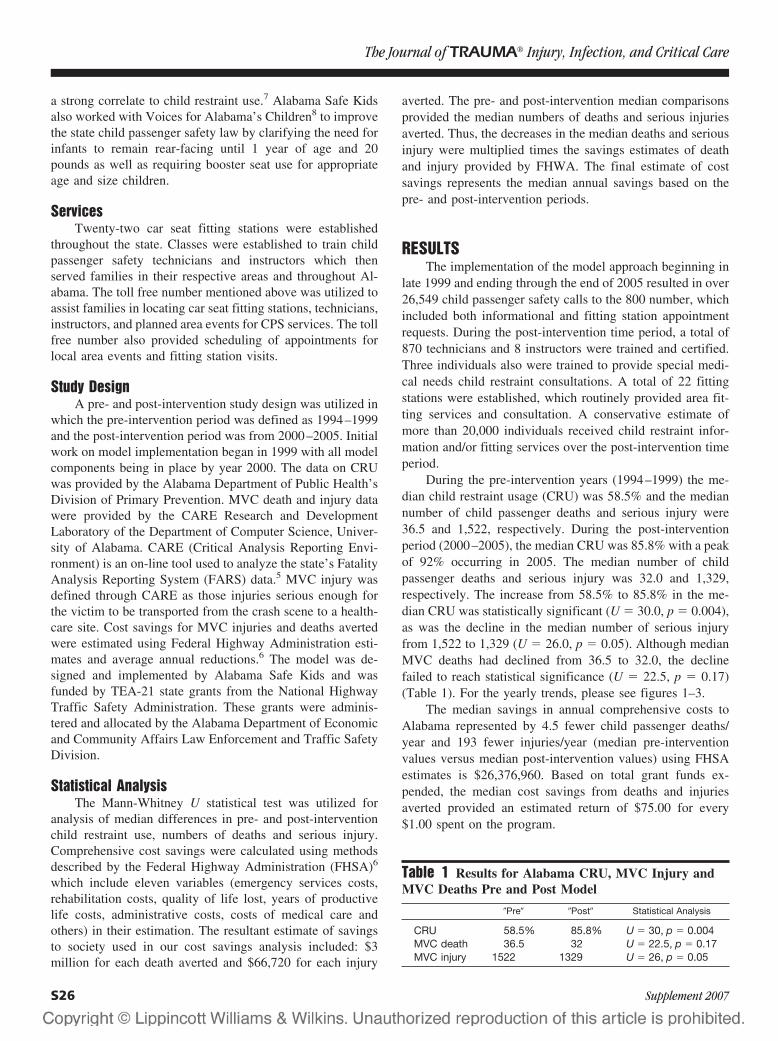
a strong correlate to child restraint use.7 Alabama Safe Kidsalso worked with Voices for Alabama’s Children8 to improvethe state child passenger safety law by clarifying the need forinfants to remain rear-facing until 1 year of age and 20pounds as well as requiring booster seat use for appropriateage and size children.
ServicesTwenty-two car seat fitting stations were established
throughout the state. Classes were established to train childpassenger safety technicians and instructors which thenserved families in their respective areas and throughout Al-abama. The toll free number mentioned above was utilized toassist families in locating car seat fitting stations, technicians,instructors, and planned area events for CPS services. The tollfree number also provided scheduling of appointments forlocal area events and fitting station visits.
Study DesignA pre- and post-intervention study design was utilized in
which the pre-intervention period was defined as 1994–1999and the post-intervention period was from 2000–2005. Initialwork on model implementation began in 1999 with all modelcomponents being in place by year 2000. The data on CRUwas provided by the Alabama Department of Public Health’sDivision of Primary Prevention. MVC death and injury datawere provided by the CARE Research and DevelopmentLaboratory of the Department of Computer Science, Univer-sity of Alabama. CARE (Critical Analysis Reporting Envi-ronment) is an on-line tool used to analyze the state’s FatalityAnalysis Reporting System (FARS) data.5 MVC injury wasdefined through CARE as those injuries serious enough forthe victim to be transported from the crash scene to a health-care site. Cost savings for MVC injuries and deaths avertedwere estimated using Federal Highway Administration esti-mates and average annual reductions.6 The model was de-signed and implemented by Alabama Safe Kids and wasfunded by TEA-21 state grants from the National HighwayTraffic Safety Administration. These grants were adminis-tered and allocated by the Alabama Department of Economicand Community Affairs Law Enforcement and Traffic SafetyDivision.
Statistical AnalysisThe Mann-Whitney U statistical test was utilized for
analysis of median differences in pre- and post-interventionchild restraint use, numbers of deaths and serious injury.Comprehensive cost savings were calculated using methodsdescribed by the Federal Highway Administration (FHSA)6
which include eleven variables (emergency services costs,rehabilitation costs, quality of life lost, years of productivelife costs, administrative costs, costs of medical care andothers) in their estimation. The resultant estimate of savingsto society used in our cost savings analysis included: $3million for each death averted and $66,720 for each injury
averted. The pre- and post-intervention median comparisonsprovided the median numbers of deaths and serious injuriesaverted. Thus, the decreases in the median deaths and seriousinjury were multiplied times the savings estimates of deathand injury provided by FHWA. The final estimate of costsavings represents the median annual savings based on thepre- and post-intervention periods.
RESULTSThe implementation of the model approach beginning in
late 1999 and ending through the end of 2005 resulted in over26,549 child passenger safety calls to the 800 number, whichincluded both informational and fitting station appointmentrequests. During the post-intervention time period, a total of870 technicians and 8 instructors were trained and certified.Three individuals also were trained to provide special medi-cal needs child restraint consultations. A total of 22 fittingstations were established, which routinely provided area fit-ting services and consultation. A conservative estimate ofmore than 20,000 individuals received child restraint infor-mation and/or fitting services over the post-intervention timeperiod.
During the pre-intervention years (1994–1999) the me-dian child restraint usage (CRU) was 58.5% and the mediannumber of child passenger deaths and serious injury were36.5 and 1,522, respectively. During the post-interventionperiod (2000–2005), the median CRU was 85.8% with a peakof 92% occurring in 2005. The median number of childpassenger deaths and serious injury was 32.0 and 1,329,respectively. The increase from 58.5% to 85.8% in the me-dian CRU was statistically significant (U � 30.0, p � 0.004),as was the decline in the median number of serious injuryfrom 1,522 to 1,329 (U � 26.0, p � 0.05). Although medianMVC deaths had declined from 36.5 to 32.0, the declinefailed to reach statistical significance (U � 22.5, p � 0.17)(Table 1). For the yearly trends, please see figures 1–3.
The median savings in annual comprehensive costs toAlabama represented by 4.5 fewer child passenger deaths/year and 193 fewer injuries/year (median pre-interventionvalues versus median post-intervention values) using FHSAestimates is $26,376,960. Based on total grant funds ex-pended, the median cost savings from deaths and injuriesaverted provided an estimated return of $75.00 for every$1.00 spent on the program.
Table 1 Results for Alabama CRU, MVC Injury andMVC Deaths Pre and Post Model
�Pre� �Post� Statistical Analysis
CRU 58.5% 85.8% U � 30, p � 0.004MVC death 36.5 32 U � 22.5, p � 0.17MVC injury 1522 1329 U � 26, p � 0.05
The Journal of TRAUMA� Injury, Infection, and Critical Care
S26 Supplement 2007

DISCUSSIONMotor vehicle crash death and injury is a leading child
health problem in the United States.9 A challenging, yetsupremely important intermediate step in preventing MVCmorbidity and mortality is increasing the proper use of childrestraint systems. Every 90 seconds a child is killed or injuredin an MVC in the United States.10 One-half of children underthe age of 5 years old who died in MVCs in the United Stateswere riding without any child passenger restraint.11 Amongchildren in car seats, as many as 80% may be used incorrectly(e.g. improper installation, wrong position, wrong seat).12
CRUs have been shown to reduce serious and fatal injuries bymore than 50% with rates as high as 70% for infants.13
Appropriate information and fitting station services supportthe proper use of child restraints.
MVCs account for one-half of all unintentional fatalitiesin the state of Alabama with MVCs being the number onecause of death by injury statewide.14 The national age ad-justed fatality rates for MVCs are 14.82 per 100,000 personsas of 2001 while Alabama’s rate is 52% higher at 22.56 per100,000 persons. Age adjusted fatality rates for children (un-der the age of 14) between 1997 and 2001 were 9 per 100,000
versus national rates for the same age group of 4 per100,000.14
Injury prevention is best achieved by staging differenttypes of interventions working in tandem and sustained overthe long term. While education, legislation, and services areall key components, any singular approach would not besufficient. Recently, one study indicated enforcement alonedid not improve booster seat use in a population and educa-tion alone was not as successful as education withdistribution.15 Despite child safety restraint legislation in allfifty states, restraints are used in only about 85% of infants.16
Additionally, many children are incorrectly restrained or carseats are often installed incorrectly in vehicles.17 We incor-porated education, legislation, and services in an attempt totake advantage of the synergy created from the key elementsworking together. The educational component and serviceelement allowed parents access to correct information onCRU and access to experts at car seat fitting stations to ensureproper installation of car seats. Prior to this study, Alabamadid not have a primary seat belt usage law. The legislativecomponent supported parental perception of the importanceof appropriate car seat selection, installation and use.18 Ourcost savings estimates and return on investment are similar towhat others have found for educational with fitting serviceprogram.19
Nationally many efforts to improve child restraint usagewere conducted in the 1990s and early 2000s. These effortsdid result in improved awareness and more children beingrestrained while riding in motor vehicles. In our Alabamaexperience, specifically looking at children under the age of10, we found child restraint usage increased from 58.5% to85.8% after our interventions. Nationally during a similartime frame (1998 until 2002), child restraint usage did in-crease in those children less than 9 years of age however, notto the extent we experienced. In a study looking at a crosssection of children under the age of 9 who were involved inmotor vehicle crashes, the child restraint usage rose from49% in 1999 to 63% in 2002.20
Study LimitationsAs a quasi-experimental study design, historical effects
are an important risk to the validity of our study estimates ofchange in CRU, death, and serious injury. Indeed, the primaryseat belt law was enacted at the end of the pre-interventionperiod and significant educational activities designed to ed-ucate the public of the importance of seat belt use wereongoing throughout the years of 1998 and 1999. However,these activities would influence our study estimates towardthe null (no median differences in CRU, death or injury) andwe did, in fact detect significant uptrends in CRU and down-trends in injury. Only the failure to reach significant de-creases in deaths would represent a potential false negativeresult in this study. Other important state educational influ-ences during both pre- and post-intervention periods were theClick It or Ticket program, educational messages, media, and
Fig. 1. Alabama Child Restraint Usage 1994–2005.
Fig. 2. Alabama Child MVC Deaths Ages �10 Years, 1994–2004.
Fig. 3. Alabama Child MVC Injuries Ages �10 Years, 1994–2004.
Child Passenger Safety
Volume 63 • Number 3 S27

activities sponsored by the State of Alabama’s Department ofPublic Health, Department of Transportation, Chapter of theAmerican Academy of Pediatrics and other agencies. Theseactivities probably did influence CRU, but did so in both pre-and post-intervention time periods. Potential influences leadingto false positive results would include nationwide increases inCRU and subsequent downtrends in death and injury over thestudy post-intervention period. We did not control for nation-wide changes during the pre or post time periods although inthe discussion above we do address the national trends duringthe same time period. Although the static nature of CRU,deaths, and injury in Alabama during the ten years precedingour post-intervention time period should attest to the lack of,or minimal national influence on Alabama child passengersafety estimates.
We also did not control for other variables (e.g. statepopulation, vehicle miles traveled, state speed limits or othertraffic safety legislation), but feel these had a minimal, if anyeffect. The state population numbers were relatively stablebetween the years of 1998 and 2005 increasing only 2.5%while national population increased 5.3%.21 Vehicle milestraveled changed only minimally from 1999 until 2001.22 TheAlabama speed limit for travel on interstates was increasedfrom 65 mph to 70 mph in May of 1996 and was therefore inplace prior to the beginning of our study. The only change intraffic safety legislation other than the primary seat belt lawwas the enactment of a graduated driver’s license rule foradolescents which took effect after 2000.
CONCLUSIONA model intervention approach utilizing education,
legislation, and services has resulted in significant im-provements in Alabama CRU and MVC death and injury.Subsequent to declines in MVC death and injury, annualizedmedian comprehensive cost savings are estimated to be over$26 million. When compared to annual grant funds expended,an estimated return on investment is $75.00 for each dollarused to support the model approach. We believe this modelapproach represents a vital, necessary, and fiscally responsi-ble component to child health and well-being in Alabama.
ACKNOWLEDGMENTSSpecific funding for the statewide child passenger safety model ap-
proach was provided by Alabama Department of Economic and CommunityAffairs through NHTSA state incentive grants for occupant safety. Signifi-cant funding and support of the state model approach was also provided byThe Children’s Hospital of Alabama. Significant public educational cam-paign support and guidance was provided by the Corporate Communicationsand Marketing division and the Child Safety Institute of The Children’sHospital of Alabama.
REFERENCES1. Dowd MD, Keenan HT, Bratton SL. Epidemiology and prevention
of childhood injuries. Crit Care Med 2002;30:S385–S392.2. Bonnie R, Fulco C, Liverman C, eds. Reducing the Burden of
Injury: Advancing Prevention and Treatment. An Institute ofMedicine Report. Washington DC: National Academy Press; 1999.
3. Unintentional Injuries in Childhood. Future of Children.2000;10.Available at http://www.futureofchildren.org/usr_doc/Unintentional_Injuries.pdf.
4. Mace SE, Gerardi MJ, Dietrich AM, et al. Injury Prevention andcontrol in children. Ann Emerg Med. 2001;38:405–414.
5. CARE website at the University of Alabama Birmingham. Availableat: http://care.cs.ua.edu/reportsandpublications.aspx. AccessedNovember 30, 2006.
6. US Department of Transportation, Federal Highway Administration.Available at: http://www.fhwa.dot.gov. Accessed November 30,2006.
7. Agran PF, Anderson CL, Winn DG. Factors associated with restraintuse of children in fatal crashes. Pediatrics. 1998;102:E39.
8. Voices for Alabama’s Children. Available at http://www.alavoices.org.Accessed November 20, 2006.
9. Rivara FP. Pediatric injury control in 1999: where do we go fromhere? Pediatrics. 1999;103:883–888.
10. Centers for Disease Control and Prevention. Injury Fact Book 2001–2002. Atlanta GA: Centers for Disease Control and Prevention;2001.
11. Dowd, D. Motor vehicle injury prevention: current recommendationsfor child passenger safety. Peds Emerg Care. 2004;20:778–782.
12. Bull MF, Stroup KB, Gerhart S. Misuse of car safety seats.Pediatrics 1988;8:98–101.
13. US Department of Transportation. An Evaluation of Child PassengerSafety: the Effectiveness and Benefits of Safety Seats. WashingtonDC: US Department of Transportation; 1986. NHTSA Report DOTHS 806 890.
14. Alabama Department of Public Health. Injury in Alabama: A Focuson Prevention. Montgomery, AL: Alabama Department of PublicHealth; 2004:14–15.
15. Ehiri JE, Ejere H, Osberg J, et al. Interventions to Increase BoosterSeat Use for Children Aged 4–8 Years: a Cochrane SystematicReview. Washington, DC: AAA Foundation for Traffic Safety; 2006.
16. US Department of Transportation. Children-Traffic Safety Facts.Washington, DC: US Department of Transportation, NationalHighway Traffic Safety Administration; 1996.
17. Decina LE, Knoebel KY. Child safety seat misuse patterns in fourstates. Accid Anal Prev. 1997;29:129–132.
18. Winston FK, Chen IG, Smith R, Elliott MR. Parent drivercharacteristics associated with sub-optimal restraint of childpassengers. Traffic Inj Prev. 2006;7:373–380.
19. Pacific Institute for Research and Evaluation. Injury Prevention:What Works? A Summary of Cost-outcome Analysis for InjuryPrevention Programs. Available at: www.pire.org. AccessedNovember 30, 2006.
20. Winston FK, Chen IG, Elliott MR, Arbogast KB, Durbin DR.Recent trends in child restraint practices in the United States.Pediatrics. 2004;113:E458–E464.
21. US Census Bureau. State Quick Facts. Available at: http://www.classbrain.com. Accessed November 18, 2006.
22. Bureau of Transportation Statistics. Available at: http://www.bts.gov.Accessed November 21, 2006.
The Journal of TRAUMA� Injury, Infection, and Critical Care
S28 Supplement 2007

Identifying Interventions That Promote Belt-PositioningBooster Seat Use For Parents With Low EducationalAttainmentFlaura K. Winston, MD, PhD, Danielle Erkoboni, BA, and Dawei Xie, PhD
Background: Many parents with loweducational attainment prematurely grad-uate their children to seat belt restraintrather than use belt-positioning boosterseats. This study aimed to identify inter-ventions that promoted booster seat useamong this population.
Methods: This multi-site study usedfocus groups to elicit contributing factorsto booster seat non-use, which informedsubsequent intervention development. Afirst phase (10 focus groups, N � 117) iden-tified parents’ perceived barriers, benefits,and threats relating to belt-positioningbooster seats. These findings were used toidentify existing and create new interven-tions. A second phase (20 focus groups,
n � 171) elicited parent’s reactions tothese interventions and provided parentswith belt-positioning booster seats and ed-ucation on their use. Follow-up interviewswere conducted six weeks later.
Results: Lack of education and fearof injury were the primary barriers tobelt-positioning booster seat use. Parentswere motivated by interventions that pro-vided them with clear, concrete messagingrelating to use. Parents favored the inter-vention that presented a real story detail-ing a child’s severe injury that could havebeen prevented with appropriate re-straint. At follow-up, parents credited thisintervention with motivating booster seatuse most often. Although parent’s cited
their child’s lack of comfort and non-compliance as barriers to use, they werenot as motivated by interventions thataddressed these barriers.
Conclusions: Effective interventionprograms can be created by identifyingand addressing factors that contributeto a population’s intention to use belt-positioning booster seats. In addition, suc-cessful programs must utilize messagesthat motivate the target population by ad-dressing their perceived threats to boosterseat non-use.
Key Words: motor vehicle safety,child safety seat, booster seat, qualitativeresearch, focus groups.
J Trauma. 2007;63:S29–S38.
Motor vehicle crashes (MVCs) remain a leading causeof injury among children in the United States.1 Useof appropriate restraints in motor vehicles is an ef-
fective strategy for reducing the risk of injury and death tochild passengers in a MVC.2,3,4 Although child restraint usefor children under 8 years in the United States has increasedsince 1998,5 children between the ages of 4 and 8 yearscontinue to be at highest risk for inappropriate restraint byseat belts alone.6 Among this age group, children of parentswhich a high school education or less were 27% more likelyto be inappropriately restrained than those of parents with
higher educational attainment.7 The reasons for low appro-priate restraint use among these at-risk populations wereunclear.
To inform future efforts to increase belt-positioningbooster seat (BPB) use, this study focused on identifyingreasons for BPB non-use for children, ages 4 through 8 years,of parents with a high school education or less. Parents wererecruited with the support of an existing injury preventionnetwork, the Injury Free Coalition for Kids (IFCK), allowingfor the dissemination of study results and proven interven-tions through an existing infrastructure.
The Theory of Planned Behavior8 formed the theoreticalfoundation for the study. According to Ajzen and Fishbein,behavior is preceded by a positive intention to perform thebehavior, which, in turn, is informed by the perceived bene-fits, barriers, and threats to performing that behavior. (Fig. 1)According to this theory, to promote BPB use it is necessaryto encourage positive intentions toward BPB use. This can bedone by overcoming the parents’ perceived barriers to BPBuse, highlighting parents’ perceived benefits to BPB use, andreducing parents’ perceived threats to BPB use (Fig. 1).Therefore, this research aimed to:
1. identify factors that influence parents’ current child re-straint use behaviors and intentions for future use, and
2. test interventions that address these factors as a means topromote appropriate restraint use behaviors, particularlythe use of BPBs.
Submitted for publication February 12, 2007.Accepted for publication May 30, 2007.Copyright © 2007 by Lippincott Williams & WilkinsThis article was written for the proceedings from a conference entitled
10th Annual Injury Free Coalition for Kids Conference in San Antonio,Texas. The opinions or assertions contained therein are the private views ofthe authors.
The Center for Injury Research and Prevention at The Children’s Hospitalof Philadelphia (F.K.W., D.E.), Philadelphia, Pennsylvania; Injury Free Coali-tion for Kids of Philadelphia (F.K.W., D.E.), Philadelphia, Pennsylvania; Divi-sion of General Pediatrics (F.K.W.), Department of Pediatrics, University ofPennsylvania, Philadelphia, Pennsylvania; Center for Clinical Epidemiology andBiostatistics (D.X.), University of Pennsylvania, Philadelphia.
Corresponding Author: Flaura K. Winston, MD, PhD, The Center foremail:Injury Research and Prevention, 34th and Civic Center Boulevard,Suite 1024, Philadelphia, PA 19104, Tele: 215-590-3118, Fax: 215-590-5425; email: [email protected].
DOI: 10.1097/TA.0b013e31812f5ebb
The Journal of TRAUMA� Injury, Infection, and Critical Care
Volume 63 • Number 3 S29

MATERIALS AND METHODSStudy Design
This study was conducted in three phases, the FormativePhase, the Development Phase and the Evaluative Phase.Through focus group discussions, the Formative Phase de-fined a range of perceived barriers, benefits, and threats tocurrent BPB non-use among a diverse population of parentswith a high school education or less. The Development Phaseutilized these findings to identify existing interventions anddevelop new ones that aimed to reduce perceived barriers andthreats, and enhance perceived benefits of BPB use in thetarget populations.
The Evaluative Phase utilized focus groups within thetarget population to acquire feedback on these interventions.Participants’ intentions to use BPBs were monitored througha series of questionnaires administered throughout this phase.At the conclusion of the focus groups, participants wereprovided with a free belt-positioning booster seat. Follow-uptelephone calls were made six weeks later to measure partic-ipants’ change in intention to use and actual use of BPBs.
Inclusion Criteria: Formative and Evaluative PhasesStudy participants were recruited in both phases using
telephone calls and printed flyers, through the framework ofthe IFCK network. Parents of children between the ages of 3and 8 years who never or rarely used appropriate restraints fortheir children were invited to participate. Parents of childrenas young as age 3 were included, as this age is often atransitional period where children move out of a child safetyseat. Additional inclusion criteria included: educational at-tainment of, at most, at most a high school diploma, andtravel with children in motor vehicles at least once a week.Individuals of both African American and White races, aswell as of Hispanic American and non-Hispanic ethnicitywere recruited.
All participants were offered reading assistance and/orSpanish language translation, according to the participants’preference. The Institutional Review Board at The Children’sHospital of Philadelphia approved all recruitment and consentprocedures, as well as all study protocols and surveys.
Data Collection Instruments: Formative andEvaluative Phases
Structured focus group moderator’s guides were devel-oped for both the Formative and Evaluative Phases based ona theoretical foundation (Fig. 1), and were pilot-tested beforeuse in framing both phases of focus group discussions. Toensure that each group explored the issues that were most rele-vant to their lifestyle, discussions were not limited to topics inthe guide. For example, threats were treated as all perceivedthreats on the road as opposed to simply threats to BPB use.
To characterize participants’ baseline knowledge, per-ceptions, attitudes, and intentions, a short, self-completedsurvey instrument was administered in both the Formativeand Evaluative Phases. In the Evaluative Phase, additionalinstruments were administered throughout the Phase to mea-sure changes in perceptions, attitudes, and intentions resultingfrom the study. Instruments measuring immediate changewere administered after participants viewed and discussed theinterventions and after they received a free BPB; longer termchanges in perceptions and attitudes as well as adoption ofand adherence to BPB use behavior and recall of interven-tions was measured by a standard telephone follow-up as-sessment six weeks after the focus group.
Adoption of and adherence to BPB use behavior wasmeasured according to the Prochaska’s Stages of Change:precontemplation, contemplation, preparation, action, andmaintenance of use, and termination of non-use.9 A five-item,progressive, non-threatening algorithm was used. Participantswere first asked whether they thought about using the BPB;if so, whether they tried it; if so, whether they use it regularly;and if so, whether they have told others to use it (a measureof extinguishing of the non-use behavior). Questions weremodeled after previously validated question wording devel-oped by Littell and Girven based on Stages of Change.10
All survey instruments were pilot-tested by parent vol-unteers before use and were available in both English andSpanish, depending on the participant’s preference.
Data Collection Procedures: The Formative PhaseParticipants were asked to complete a brief questionnaire
to document general demographic information along withmore detailed information pertaining to their knowledge,perceptions, attitudes, and intentions relating to BPB use.Discussion topics focused on the factors that affected partic-ipants’ intention to use BPBs: their perceived barriers, ben-efits, and threats relating to the behavior.
Fig. 1. The Theory of Planned Behavior assumes that a person’sintention to perform a behavior predicts his or her behavior andthese intentions result from the person’s perceived barriers, benefitsand threats relating to the behavior.
The Journal of TRAUMA� Injury, Infection, and Critical Care
S30 Supplement 2007

Data Collection Procedures: The Development PhaseA literature search identified existing interventions de-
signed to increase BPB use. This search was supplementedwith a review of BPB use promotion interventions collectedthrough informal surveys of injury prevention list-serves,Internet searches, and personal contact with experts in thefield. The research team selected interventions for evaluationafter determining whether the interventions targeted the ben-efits, barriers, and threats most relevant to the target popula-tions. Interventions that had unclear or non-relevant messageswere eliminated. Interventions utilizing a medium that theparticipants in the Formative Phase cited as being ineffective,such as flyers, were also eliminated.
Four existing interventions or intervention programswere selected. Three of these targeted BPB-aged children: theIFCK of Austin’s “The Buckleteers,” the US Department ofTransportation’s National Highway Traffic Safety Adminis-tration’s “Cinderella” public safety announcement (PSA),and Weiner and Seamen Production’s “The Big GreenSnake.” A fourth intervention, the “Abrocha Tu Vida” cam-paign, created by the University of Washington’s HarborviewInjury Center, targeted Latino parents (Table 1).
Three newly created pilot interventions were designed(to supplement the four existing interventions) with messagesidentified as being relevant to the target populations but notclearly addressed by previously existing interventions. Thesemessages were: importance of booster seat laws, educationaround injuries that are prevented by BPB, and use of BPB aspart of good parenting in the car (Table 2).
Data Collection Procedures: The Evaluative PhaseAfter consent was obtained for the Evaluative Phase,
participants completed the baseline survey and were asked toprioritize lists of benefits, barriers, threats, and influentialpeople/media generated from the Formative Phase focusgroup discussions (Table 3). This activity highlighted theissues of greatest importance to the target population, whichinformed the conduct of the study, as well as future interven-tions developed by the IFCK. The most highly ranked itemsin each group were used to determine which interventionsthat group would review. By selecting interventions thatspecifically addressed the issues important to the participants,the study was able to address the presentation of the messagewithout discussion of the message’s relevance.
Each focus group reviewed 4 of the 7 interventions.Based on the results of the prioritization exercise for eachgroup, 2 interventions were selected for review from the 4existing interventions (Table 1) and the newly designedbooster seat laws radio PSA in English (Table 2). All groupsreviewed the remaining two newly created interventions(Table 2).
The same series of questions were used when discussingeach intervention. These questions assessed whether the in-tervention engaged the participants, addressed their barriers
and threats, and promoted positive booster seat use intention.(Figure 1) Participants then provided recommendations forimprovement to the intervention.
Following the groups’ discussion of the 4 interventions,participants were asked to complete a post-discussion survey(to measure changes in intention), and were offered a freeBPB. Participation in this portion of the study was optional,and the giveaway was not announced until the all surveyswere completed. Each participant electing to receive a BPBwas required to listen to a 15-minute educational presentationdetailing how to properly use the BPB. Certified Child Pas-senger Safety Technicians from the IFCK site local to thefocus group location provided all education. Following thepresentation, participants were allowed time to ask questionsof the technician.
This BPB giveaway eliminated the barriers of access toBPB that the participants might have faced, including costand lack of knowledge about where to buy a seat. By elim-inating these barriers, the research team was able to examinethe effectiveness of the intervention messages, as none of theinterventions shown in the group were able to overcome thecost or inaccessibility barriers alone.
Six weeks after receipt of the BPB, each participant wascontacted for a 20-minute follow-up phone interview. Thisinterview assessed participants’ progression through theStages of Change, elucidated participants’ intentions towardBPB use, and measured their retention of the messages heardin the focus group.
Analysis: Formative PhaseAll focus group discussions were taped and transcribed.
Transcripts were coded, using N6 software (QSR Interna-tional, Doncaster, Victoria, Australia), by two research assis-tants under the supervision of the study coordinator. Codingwas based on the themes of participants’ perceived barriers,benefits, and threats relating to BPB use. All researchers whoobserved the focus groups reviewed the transcript summaries.The researchers and the moderator discussed all comments toreach consensus. In situations in which consensus could notbe reached, all possible interpretations were included in thesummary document.
Analysis: Evaluative PhaseThe Formative and Evaluative Phases utilized the same
method for focus group analysis; however, in the EvaluativePhase, analyses included additional in-depth components,combining both quantitative and qualitative methods. Theseanalyses focused on identifying themes pertaining to theinterventions under study. The overall goals of the analyses inthe Evaluative Phase were to:
1. summarize participants’ rankings of barriers, benefits andthreats to BPB use and the reasons for the rankings;
2. evaluate reactions to the proposed interventions using dis-cussion and reported change in attitude toward BPB; and
Interventions That Promote Booster Seat Use
Volume 63 • Number 3 S31

Tabl
e1
Inte
rven
tion
sw
ere
Cho
sen
that
Add
ress
edth
eP
erce
ived
Bar
rier
san
dT
hrea
tsE
xpre
ssed
byP
aren
tsin
the
For
mat
ive
Pha
se.
The
seIn
terv
enti
ons
Add
ress
edbo
thP
aren
tsan
dC
hild
ren
Thr
ough
aV
arie
tyof
Dis
trib
utio
nM
etho
ds
Cam
pai
gnTi
tleS
pon
sor(
s)M
ater
ials
Targ
etP
opul
atio
nM
ode
ofD
istr
ibut
ion
Targ
eted
Bar
riers
“Ab
roch
aTu
Vid
a”(B
uckl
eup
your
life)
Har
bor
view
Inju
ryP
reve
ntio
nan
dR
esea
rch
Cen
ter,
Latin
oK
ids
Saf
ety
Coa
litio
n,an
dS
tate
Farm
Insu
ranc
e
●Fo
urra
dio
com
mer
cial
sin
Sp
anis
hS
pan
ish-
spea
king
par
ents
and
thei
rch
ildre
n,4
to8-
yr-o
ld●
Reg
iona
lrad
io●
Res
ista
nce
offa
mily
mem
ber
s●
No
one
enfo
rcin
gla
w●
Lack
ofin
fo
The
Buc
klet
eers
Inju
ryFr
eeC
oalit
ion
for
Kid
sof
Aus
tin●
DV
D●
Mem
ber
ship
card
●S
ticke
r●
Pos
ter
●H
eigh
tch
art
●B
race
let
Eng
lish
and
Sp
anis
hsp
eaki
ngch
ildre
n,4
to8-
yr-o
ld●
Chi
ldca
rece
nter
s●
Sch
oolh
ealth
clas
ses
●E
duc
atio
nalp
rogr
ams
●C
omm
unity
cent
ers
●D
octo
r’s
offic
es
●C
hild
resi
sts
rest
rain
t●
Boo
ster
isa
“bab
yse
at”
The
Big
Gre
enS
nake
Wei
ner
and
Sei
man
Pro
duc
tions
●V
ideo
Tap
e●
Pos
ters
●C
olor
ing/
Sto
ryB
ook
●S
ticke
rs●
Boa
rdG
ame
Eng
lish
and
Sp
anis
hsp
eaki
ngch
ildre
n,4
to8-
yr-o
ld●
Chi
ldca
rece
nter
s●
Sch
oolh
ealth
clas
ses
●E
duc
atio
nalp
rogr
ams
●C
omm
unity
cent
ers
●D
octo
r’s
offic
es
●C
hild
resi
sts
rest
rain
t●
Boo
ster
isa
“bab
yse
at”
Cin
der
ella
Inte
rven
tions
Nat
iona
lHig
hway
Traf
ficS
afet
yA
dm
inis
trat
ion
●W
ebsi
te●
PS
A●
Act
ivity
Gui
de
Eng
lish
and
Sp
anis
hsp
eaki
ngch
ildre
n,4
to8-
yr-o
ld●
Nat
iona
ltel
evis
ion
●P
revi
ews
tom
ovie
s●
Chi
ldre
sist
sre
stra
int
●B
oost
eris
a“b
aby
seat
”●
Lack
ofin
fo●
Res
ista
nce
offa
mily
mem
ber
s
The Journal of TRAUMA� Injury, Infection, and Critical Care
S32 Supplement 2007

Table 2 These Interventions were Designed to Address Barriers and Threats that Remained Unaddressed by theSelected Existing Interventions. Each Intervention was Designed as a Draft by the Research Team at The Children’sHospital of Philadelphia
Campaign Title Designer Materials Target Population Mode of Distribution Targeted Barriers
“It’s the law” The Center for InjuryResearch andPrevention at TheChildren’s Hospitalof Philadelphia
● Two radioPSAs in English
English-speakingparents andtheir children, 4to 8-yr-old
● Regional radio ● Resistance of familymembers
● No one enforcinglaw
● Lack of info
“Safer for kids,easier for you”
The Center for InjuryResearch andPrevention at TheChildren’s Hospitalof Philadelphia
● Four-minutevideo
English-speakingparents andtheir children, 4to 8-yr-old
● Childcare centers● School health classes● Educational programs● Community centers● Doctor’s offices● National television● Previews to movies
● Child resistsrestraint
● Booster is a “babyseat”
● Lack of info
“Avoid regret” The Center for InjuryResearch andPrevention at TheChildren’s Hospitalof Philadelphia
● Five-minutevideo
English-speakingparents andtheir children, 4to 8-yr-old
● Childcare centers● School health classes● Educational programs● Community centers● Doctor’s offices● National television● Previews to movies
● Lack of info
Table 3 The Perceived Barriers, Benefits, Threats and People whom Matter, Derived from Participant Responses inthe Formative Phase, and Ranked by Participants in the Evaluative Phase
Bad things that I worry about when I drive my children in the car: People or places whose opinions about booster seatsmatter to me:I might get pulled over by the cops.
I might have to pay for a ticket. I trust my own opinions.I might go to jail if I do not restrain my child correctly. My childOther people might think I am a bad parent if I do something wrong. My child’s doctor or other healthcare providerMy child might bother or distract me. My child’s teacher or schoolI might get into a crash. Groups in my neighborhood or communityMy child might get seriously hurt in an accident. My minister or other church leaderMy child might get hurt by the airbag. My friends, neighbors, or other parentsMy child might get out of her seat belt. My spouse, partner, or child’s parentMy children might fight. Other members of my family
Good things that might happen if my child is in a booster seat: Hospitals or ambulance workersMy child will feel snug and safe in a booster seat. Auto dealersMy child will feel special in her “own seat”. Government officials (mayor, governor, president)My child can see out the window when he is in a booster seat. PoliceMy child will feel like a “big kid” in a booster seat. Things on the InternetMy child will be comfortable in a booster seat. Signs or flyers in neighborhood storesMy child will not bother me because she might behave better. TVI will know that my child is safe when he is in a booster seat. RadioI will have a place to put the child’s food/cups/toys in the booster seat. Newspapers
Things that might make it hard for me to use a booster seat for my child: MagazinesMy child will complain if I make him use a booster seat.My child will feel like a baby if I make him use a booster seat.My child will be uncomfortable in a booster seat.My child will think I am punishing him if I put him in a booster seat.Other children might make fun of my child if he is in a booster seat.I do not think a booster is safe.People I care about told me not to use a booster seat.I do not have room in the car for the booster seat.I think that it is too hard to use a booster seat.I do not know where to get a booster seat.I cannot afford a booster seat.
Interventions That Promote Booster Seat Use
Volume 63 • Number 3 S33

3. summarize participant suggestions for improvements incontent and distribution of the interventions.
The most highly ranked perceived barriers, benefits andthreats were found by summarizing the top five items chosenfrom each list in the list ranking exercise by each focus group.
Participants’ reactions to the selected interventions wereanalyzed by coding sections of the focus group discussionand tracking changes shown in the participant informationcollection forms. Coded transcripts were analyzed for recur-ring themes, as was done in the Formative Phase. Changes inattitudes and intention to use BPB were assessed quantita-tively through the information collection forms. For descrip-tive analyses of interval scale variables (e.g. participant ageand number of children, the mean) median, mode, and rangewere obtained. These variables were also categorized for latercross-tabulation analysis. Frequencies were calculated forcategorical variables. To compare the distribution of categor-ical variables among groups, cross-tabulation analysis wasperformed and Pearson’s Chi-square statistics were used todetermine significance. Some of the categorical variableswere regrouped to increase the expected numbers in the cellsof the cross-tabulation table and thereby ensuring the validityof Chi-square statistics.
RESULTSDescription of Study Population: The Formative Phase
A total of 107 participants from one pilot group andeleven focus groups were included in the Formative Phase ofthis study (Table 4). The pilot data were included in theanalysis as no substantial changes were made to the focusgroup moderator guides or procedures after the pilot. Themajority of parent drivers who participated in the FormativePhase were African American (46.7%), female (86.9%), ages26 to 30 (35.5%), and married (51.4%). Most participantswere employed outside of the home (45.8%), with 63.3% ofthose employed working full time, and 44.9% working in aservice-oriented position.
Description of Study Population: The Evaluative PhaseParticipants for the Evaluative Phase were recruited us-
ing criteria similar to those used in the Formative Phase. Asa result, the study population for the Evaluative Phase wassimilar to that of the Formative Phase. A total of 176 partic-ipants from four pilot groups and sixteen focus groups (6–10participants/group) were included in the Evaluative Phase ofthis study (Table 5). As in the Formative Phase, the majorityof parent drivers who participated in this Phase were AfricanAmerican (56.2%), and female (89.8%). The EvaluativePhase participants were slightly younger than those in theFormative Phase, with a majority of participants betweenages 21 and 25 (27.8%). In addition, the majority of partic-ipants in the Evaluative Phase was single and had never beenmarried (45.5%), which differed from those in the FormativePhase. The majority of participants were employed outside of
the home (56.8%), with 68% of those employed working fulltime, and 44% working in a service oriented position.
Barriers, Threats, and Benefits to BPB use: TheFormative and Evaluative Phases
Focus group discussions in both the Formative and Eval-uative Phases sought to define factors that contribute to BPBuse or intention toward BPB use in the targeted populations.Several themes emerged across all targeted populations inboth phases. Other themes were more relevant for particulargroups. Differences based on focus group location, race, genderor ethnicity were noted where applicable.
Threats—Bad Things that I Worry About when I DriveMy Children in the Car
Threats of similar type were ranked highly among allgroups. Every group ranked “my child might get seriouslyhurt in an accident” within their top five perceived threats.
Table 4 The Formative Phase Study Population (N � 107)
Demographic n � % of Sample
Age (N � 107)Range: 21–53 yrMode: 28 yr21 to 25 28 26.226 to 30 38 35.531 to 35 18 16.836 to 40 12 11.241 to 45 6 5.645 and older 3 2.8Blank 2 1.9
Race (N � 107)African American/Black 50 46.7White 19 17.8Hispanic/Latino 38 35.5
Gender (N � 107)Female 93 86.9Male 14 13.1
Marital status (N � 107)Married 55 51.4Living w/partner 8 7.5Single, never married 33 30.8Separated 6 5.6Divorced 4 3.7Other 1 0.9
Employed (N � 107)No 54 50.5Yes 49 45.8Blank 4 3.7
Work status (N � 49)Full-time 31 63.3Part-time 10 20.4Blank 8 16.3
Job Type (N � 49)Medical 2 4.1Service 22 44.9Administrative 10 20.4Other 10 20.4Blank 5 10.2
The Journal of TRAUMA� Injury, Infection, and Critical Care
S34 Supplement 2007

Participants in each group identified this as something theyworried about often when they drove with their children.Most groups rated either “I will get pulled over by the cops”,or “I might have to pay a ticket” highly. These concernsstemmed primarily from hearing stories from other parents orhaving been pulled over themselves. Participants in eachgroup saw the resultant fine as strong motivation to restraintheir child; however, many also cited that money should notbe a primary factor in their behavior, repeatedly stating thatthey restrain their children to keep them safe.
Benefits—Good Things that Might Happen if I Use aBooster Seat
Parents in each group ranked items relating to theirchild’s safety highly. Benefits such as “my child will feel safeand snug in a booster seat” or “I will know that my child issafe when he is in a booster seat” were ranked among the topfive perceived benefits in all groups.
Participants emphasized safety of their children as para-mount when commenting on these selections. As a result,parents considered any other benefits, such as their childliking the restraint, as a “bonus.”
Perceived benefits of BPB use relating to the child (Mychild will feel like a “big kid” in a booster seat and My childcan see out the window when he is in a booster seat), werehighly ranked in many groups. Parents stated that these ben-efits were important to them, as they increased their children’swillingness to use a BPB. These benefits were crucial to manyparents, especially White parents, who struggled to get theirchildren to use proper restraint. In contrast, African Americanparticipants noted that their child’s approval or disapproval hadno effect on their choice of child restraint.
Barriers—Things that Might Make it Hard to Use a BoosterSeat
Participants in most groups were hesitant to select itemson this list, noting that there were no factors that barred themfrom keeping their child safe. As a result, less than half of theparticipants in The Evaluative Phase ranked the items on thischart. Discussions showed that parents felt strongly that noth-ing would stop them from keeping their children safe; how-ever, they did note several things that made it harder to use aBPB for their children.
Of the barriers discussed in the groups, the most com-monly identified was the effect of the child’s behavior due torestraint use. Several participants in each group noted thattheir children, although comfortable in a BPB, did not want tobe restrained at all. In many groups, a subset of participantsdisagreed with this, stating that their children often remindedthem to put on their safety belts too. As a result, the effect ofthe child passenger’s opinion was divided between thoseparents whose children liked their BPB, and those parentswhose children did not.
Another factor that made using BPB hard for manyparents was lack of room in their vehicle. African Americanparticipants, as well as those participants in Little Rock,Arkansas noted this most often. The participants agreed thatthe BPB took up a lot of room in their cars, and made itdifficult to restrain multiple children properly.
Information Sources—People and Places WhoseOpinions I Trust
Participants across all sites, sexes and racial and ethnicgroups agreed that they trusted their own opinions about BPBthe most. Parents emphasized that although they may acceptadvice from other sources, their own feelings about whatkeeps their child safe superseded all outside advice. The mosthighly ranked outside sources included government officials,physicians and the police. Family members and friends werealso ranked highly, with participants noting that most of theirinformation on CPS is received by word of mouth.
Parents’ Reactions to Interventions: The EvaluativePhase
Analysis of the Evaluative Phase focus group transcriptsrevealed themes in participants’ answers to questions evalu-ating the impact of the interventions. Some sentiments were
Table 5 The Evaluative Phase Study Population (N � 176)
Demographic n � % of Sample
Age (N � 176)Range: 19–60 yrMode: 23 yr21 to 25 49 27.826 to 30 37 21.031 to 35 40 22.736 to 40 23 13.141 to 45 15 8.545 and older 12 6.8
Race (N � 176)African American/Black 99 56.3White 33 18.8Hispanic/Latino 44 25.0
Gender (N � 176)Female 158 89.8Male 18 10.2
Marital status (N � 176)Married 54 30.7Living w/partner 24 13.6Single, never married 80 45.5Separated 7 4.0Divorced 11 6.3
Employed (N � 176)No 76 43.2Yes 100 56.8
Work status (N � 100)Full-time 68 68.0Part-time 32 32.0
Job Type (N � 100)Medical 9 9.0Admin/Office 33 33.0Service 44 44.0Other 14 14.0
Interventions That Promote Booster Seat Use
Volume 63 • Number 3 S35

consistent across all locations, while others were only rele-vant to a particular subset.
Television and Video Programs Targeted TowardChildren
Participants in all groups felt that the right viewers werenot targeted by the intervention programs designed for a childaudience (The Buckleteers, the Big Green Snake and theCinderella ad campaign). Parents emphasized that they alonemade decisions about the restraint habits of their children;therefore, interventions should be aimed at educating andmotivating adults. Although participants found each of theseinterventions entertaining (and felt that the interventionswould engage their children), they felt that they would notmotivate them toward proper restraint use.
Radio Commercials Emphasizing “The Law”Parents were also opposed to messaging utilizing booster
seat laws and potential fines to motivate parents. The partic-ipants noted that concern for their child’s safety should beenough of a motivation without the added consequence of aticket.
This message was presented as a pair of radio commer-cials. African American and White participants felt messageson the radio would not reach as large of an audience asinterventions aired on television. In contrast, Hispanic par-ticipants were very receptive to the information presentedthrough the radio.
Video Programs Educating ParentsParents were motivated by concrete educational mes-
sages that reinforced the injury prevention benefits of BPB.As a result, parents were motivated by the pilot interventiondesigned for this study that provided education around inju-ries that are prevented by BPB (see Table 2; “Avoid Regret”).This intervention utilized an actionable emotion,11,12,13 regret,coupled with education to correct participant’s previous mis-conceptions and promote BPB use. The message was deliv-ered in the form of a true, instructive story told by a parent,the preferred spokesperson by the participants.
During the focus groups, participants were visibly movedby the story and described it as both educational and moti-vational. They requested that the intervention be made avail-able through email and other channels so that they couldshare it with others. At the 6-week follow up call, parents feltthat this intervention alone had changed their intention to usea BPB, as it provided them with the knowledge necessary touse a BPB properly, and the motivation to overcome theiradditional barriers.
Participants had varied reactions to the intervention thatcoupled BPB education with parenting advice (see Table 2;“Safer for kids; easier for you”). Participants felt this inter-vention lacked a strong motivational message. Although theywere concerned about their children misbehaving in the car,
their primary concern was preventing their child from beinginjured in a crash.
Changes in Attitudes and Intentions: The EvaluativePhase
Quantitative analysis of changes in intention to use andattitudes toward BPB (using the participant questionnaires)revealed a positive shift as a result of the interventions andfocus group discussions. The ability of the Evaluative Phasefocus groups to change intention was evident in the percent-age of participants that became more likely to use a BPB bythe conclusion of the groups. (Table 6) The majority ofparticipants who were somewhat unlikely or unlikely to use aBPB initially became more likely to use a BPB. For example,15.5% of participants who were originally somewhat likely touse a BPB became very likely to use a BPB; only 1.4% didnot change their opinion or decreased their likelihood ofusing one.
Changes in Booster Seat use Behavior: TheEvaluative Phase
Of the 176 participants in Evaluative Phase, 94.8% com-pleted the 6-week follow-up telephone interview. This pop-ulation comprised a representative sample of the studypopulation. Of those who complete the interview, 98.9%reported using the BPBs on all trips, and 74.6% reportedtelling others about BPBs.
DISCUSSIONThis study was the first to review BPB use perceptions,
attitudes, and knowledge among parents with limited educa-tional attainment, a known population at high risk for inap-propriate restraint of their children in motor vehicles. Forparents with limited educational attainment (high school ed-ucation or less), lack of knowledge about the injury conse-quences of inappropriate restraint was the major barrier toBPB use. This barrier was the most prevalent barrier across
Table 6 Quantitative Analysis of Changes in Intentionto Use and Attitudes towards BPBs Percentages ShownRepresent Percent of the Total Study Population (N �176)
Change in Participant Response afterDiscussion
BecameMore Likely No Change Became
Less Likely Total
Participant responseprior to discussion
Very Likely 0.0 52.8 1.4 54.2Somewhat Likely 15.5 0.7 0.7 16.9Somewhat Unlikely 0.7 0.0 0.0 0.7Very Unlikely 10.6 0.0 0.0 10.6TOTAL 26.8 53.5 2.1 82.4*
* The remaining 17.6% of participants did not respond to thisquestion.
The Journal of TRAUMA� Injury, Infection, and Critical Care
S36 Supplement 2007

gender, race and ethnicity differences. As a result, all partic-ipants endorsed a simple direct message that reinforced thelife-saving benefits of seat belts and described the injuriesthat could be prevented with BPB use. These parents reportedpositive changes in attitudes and intentions, as well as adop-tion of and adherence to BPB use a result of the educationacquired from this message.
These results demonstrate that effective interventionsmust include messages with relevant knowledge, that thetarget population deems strong and motivational. Social mar-keting research has shown that a strong motivator for behav-ior change is avoidance of an individual’s perceived threats.(i.e. the possibility of resulting death, injury, or illness).14,15
In this study, parents with limited educational attainmentcited the potential of their child being hurt in a crash as theprimary threat they perceived relating to motor vehiclecrashes. A clear educational message toward appropriate re-straint use would therefore be strengthened by pairing it witha message confronting the possibility of injury resulting froma child being improperly restrained in a vehicle.
Individuals with a high school education or less rep-resent 47.5% of United States citizens over the age of 25years.16 Winston et al.7 demonstrated that previous inter-vention tactics have not served to fully educate theseparents concerning appropriate child restraint. Researchhas shown that education, particularly health education,for these populations must be concrete and personal17,18 –it is important not to simply provide information to thesepopulations, but to truly educate them. This educationinvolves providing knowledge, coupled with messages thatmotivate the target parents, shown through channels andmedia that the parents trust and respect.
Study Limitations and Future WorkThis study was limited by the use of focus groups.
Although this format allowed for a thorough discussion on awide range of topics relating to BPB use, it restricted theability of this study to reach saturation in each target popu-lation. While saturation was reached among populations onthe east coast, as well as African American populations, alimited amount of data were collected from midwestern andHispanic populations.
As a result, it would be beneficial for focus groups to beconducted until saturation is reached in all identified targetpopulations. Further work could also expand the study pop-ulation to include additional cities, such as those in thenorthwestern or southern regions of the United States. Thestudy could also be expanded to include other at-risk groups,or at-risk safety behaviors (such as partial belt use).
In addition, randomized control trials could further testthe effectiveness of the injury intervention alone, with dis-cussion groups, and in combination with a BPB giveaway.
ImplicationsBehavioral science theory and research methods are im-
portant in the development of interventions to promote andsustain pro-health behaviors. Until recently, little scholarlyattention has been paid to behavioral science and injuryprevention promotion.19 This study demonstrates the posi-tive impact of applying behavioral science approaches toeducational intervention development around the adoptionof and adherence to BPB use for their children by anat-risk population, parents with low educational attain-ment. Future intervention development around injury pre-vention for a target population, including BPB use, shouldbegin with the study of perceptions, intentions, knowledge,and degree of adoption of the prevention behavior to ad-dress the determinants of the population’s behavior. As inthis study, evaluation of the success of the interventionshould measure changes in behavioral intentions, knowl-edge, and then adoption and sustainability of the behavior.Once effectiveness has been established, distribution andpackaging methods should be employed to encourage wide-spread dissemination.
ACKNOWLEDGMENTSThis research was supported by the National Highway Traffic Safety
Administration, US Department of Transportation, under Contract No.DTNH22-01-C-05845. The opinions, findings, and recommendations con-tained herein are those of the authors and do not necessarily represent thoseof the National Highway Traffic Safety Administration. We acknowledgeDebra Dean and Teresa Koenig of Westat, Inc. for expert conduct of thefocus groups, and May Aiken of the Little Rock Injury Free Coalition forKids (IFCK), Michael Gittelman of the Cincinnati IFCK, and BenjaminSelassie of the Baltimore IFCK for their tireless efforts in recruiting for thefocus groups. The authors would also like to acknowledge Alexandra Winskifor diligence in executing the follow up interviews and analyzing data for thisproject.
REFERENCES1. National Highway Traffic Safety Administration. Race and Ethnicity
in Fatal Motor Vehicle Traffic Crashes 1999 – 2004 (No. DOT HS809 956). Washington, DC: U.S. Department of Transportation,National Highway Traffic Safety Administration. 2006.
2. Arbogast KB, Durbin DR, Kallan MJ, & Winston FK. Effect ofvehicle type on the performance of second generation air bags forchild occupants. Annual Proceedings/Association for theAdvancement of Automotive Medicine. 2003;47:85–99.
3. Elliott MR, Kallan MJ, Durbin DR, & Winston FK.Effectiveness of child safety seats vs seat belts in reducing risk fordeath in children in passenger vehicle crashes. Arch Pediatr AdolescMed. 2006;160:617–621.
4. National Highway Traffic Safety Administration. Traffic safety facts2002: children (No. DOT HS 809 620). Washington, DC: U.S.Department of Transportation, National Highway Traffic SafetyAdministration. 2003.
5. Arbogast KB, Durbin DR, Kallan MJ, & Winston FK.Evaluation of pediatric use patterns and performance of lap shoulderbelt systems in the center rear. Annual Proceedings/Association forthe Advancement of Automotive Medicine. 2004;48:57–72.
6. Partners for Child Passenger Safety. Fact and Trend Report.Philadelphia, PA. The Center for Injury Research and Prevention atthe Children’s Hospital of Philadelphia. 2006.
Interventions That Promote Booster Seat Use
Volume 63 • Number 3 S37

7. Winston FK. Parent driver characteristics associated with sub-optimal restraint of child passengers. Traffic Inj Prev. 2006;7:373– 80.
8. Ajzen I. The Theory of Planned Behavior. Organizational Behavior& Human Decision Processes. 1991;50:179–211.
9. Prochaska J. The Transtheoretical Model of Health BehaviorChange. Am J Health Promot. 1997;5:38–48.
10. Littell JH, & Girvin H. Stages of Change: A Critique. Behav Modif.2002;26:223–273.
11. Kahn BE, Luce MF, & Nowlis SM. Debiasing Insights from processTests. J Consum Res. 2006;33:131–137.
12. Taylor K. A Regret Theory Approach to Assessing ConsumerSatisfaction. Marketing Letters. 1997;8(2):229–238.
13. Zeelenberg M. Anticipated Regret, Expected Feedback andBehavioral Decision Making. Journal of Behavioral DecisionMaking. 1999;12:93–106.
14. Henley N, & Donovan RJ. Death Anxiety and Threat Appeals:Toward a Practical Application in the Context of Health Promotion.Omega. 2003;46:225–239.
15. Rogers RW, & Mewborn CR. Fear appeals and attitude change:effects of a threat’s noxiousness, probability of occurrence, and theefficacy of coping responses. J Pers Soc Psychol. 1976;34:54–61.
16. Bureau, U. S. C. Educational Attainment in the United States:2003: U.S. Department of Commerce: Economics and StatisticsAdministration.
17. Bass L. Health literacy: implications for teaching the adult patient.J Infus Nurs. 2005;28:15–22.
18. Riley JB, Cloonan P, & Norton C. Low health literacy: a challengeto critical care. Crit Care Nurs Q. 2006;29(2):174–178.
19. Gielen AC, & Sleet D. Application of Behavior-Change Theoriesand Methods to Injury Prevention. Epidemiol Rev. 2003;25:65–76.
The Journal of TRAUMA� Injury, Infection, and Critical Care
S38 Supplement 2007

“Cubs Click It for Safety”: A School-Based Intervention forTween Passenger SafetyMary E. Aitken, MD, MPH, Samantha H. Mullins, Virginia E. Lancaster, and Beverly K. Miller, MEd
Background: Children ages 8–12years, also called “Tweens,” demonstratea number of risk factors for motor vehicleinjury, including lack of restraint use andfront seating position, yet few interventionshave targeted this group. We imple-mented a school-based educational inter-vention designed to increase awarenessand encourage safer transportation ofthese children.
Materials: A local school collabo-rated with the study team to develop edu-cational materials based on the schoolmascot and allowed use of school-basedmedia (bulletin boards, closed circuit TV,and newsletters) to deliver key messagesabout restraint use and back seating posi-tion. Selected students participated in de-
livering the message and in evaluation ac-tivities, increasing peer support for theprogram. Evaluation consisted of surveysof reported and observed restraint useand rear seating for children and restraintuse for parents before and after the edu-cational intervention.
Results: School support for the pro-gram was excellent and student enthusi-asm was high. Parent awareness of safepositioning for children improved, withparents endorsing seat belts alone versusseat belts with a booster seat for childrenages 5–8 falling from 37% to 25% (p <0.004). Child report of restraint use in-creased from 78% to 89% (p < 0.001).Reported exposure to the campaign mes-sages was high with 77% of parents and
89% of students recalling the campaign atthe end of the year. Observed restraint usefor both adults and children was some-what lower than reported use. Restraintuse by parents was about 80% both beforeand after the intervention. Restraint useby children increased from 71% to 91%(0.001). No changes were noted in frontseating position for children.
Discussion: Short term positivechanges in observed restraint use andknowledge about safer transportation ofchildren were encouraging. Further studyof the program, including a controlledstudy of the intervention, are needed todemonstrate longer term effectiveness.
J Trauma. 2007;63:S39–S43.
Motor vehicle safety interventions have traditionallyfocused on increasing correct restraint of infants andyoung children in car seats or modifying the risks of
novice teen drivers. Recent efforts to encourage booster seatuse in children ages 4–8 years of age have resulted in in-creased, but still inadequate, use of appropriate restraint inthis age group.1,2 Children in the “Tween” age group—approximately 8–12 years of age—have been a relativelyneglected subpopulation, despite data that indicate they maybe at substantial risk for injury and death due to modifiablebehaviors. In recent national surveys, 10.9% of ninth graders
reported that they rarely buckled their seatbelts when ridingwith another driver, a proportion higher than that of driving-aged adolescents.3 A number of studies have shown thatmany children in the Tween age group sit in the front seat ofthe car, despite evidence that rear seating is safest for allchildren under age 13 years.4,5,6 Recently, increased aware-ness of these risky behaviors has led to calls and efforts toimprove safety awareness in this age group and to seekinterventions that may be helpful in increasing both appro-priate restraint and seating position in these children.7
Tween children present unique challenges for preventioninterventions. Research into the factors influencing Tweenrisk-taking behavior has been somewhat limited. A recentreview, however, demonstrated a multi-dimensional complexof factors that can influence children in this age group.8
Developmentally, this group is beginning to develop theindependent decision-making of adolescence, but is stillstrongly tied to parents and family. Interventions must there-fore include a strong parental component while factoring inthe emerging importance of peers and social pressures. Whileyounger children are frequently exposed to medical settingsfor immunization or other health maintenance issues, the older,school-aged child may only occasionally interact with medicalprofessionals during episodes of illness, making clinic basedinterventions potentially less effective. Cognitively, Tweens areengaged in developing independent reasoning and decision mak-ing skills. They can articulate potential outcomes of a specificexample, such as what might happen during a crash if they are
Submitted for publication March 17, 2007.Accepted for publication May 30, 2007.Copyright © 2007 by Lippincott Williams & WilkinsThis article was written for the proceedings from a conference entitled
10th Annual Injury Free Coalition for Kids Annual Conference in SanAntonio, Texas. The opinions or assertions contained herein are the privateviews of the authors.
From the Department of Pediatrics, University of Arkansas for MedicalSciences, College of Medicine, and Arkansas Children’s Hospital, LittleRock, Arkansas.
Supported by a grant from the Robert Wood Johnson Foundation InjuryFree Coalition for Kids, Grant # 39513 and from the Arkansas State PoliceHighway Safety Office (V.E.L.).
Address all correspondence and reprint requests to: Mary E. Aitken, M.D.,M.P.H., Arkansas Children’s Hospital, 800 Marshall Street, Slot 512-26, LittleRock, AR 72202-3591, Phone (501): 364-3300 Fax (501): 364-1552.
DOI: 10.1097/TA.0b013e31812f5ef4
The Journal of TRAUMA� Injury, Infection, and Critical Care
Volume 63 • Number 3 S39

not wearing a seat belt. Further, they are beginning to under-stand the interaction between behavior and consequence andcan make deliberate changes in behavior to obtain a desiredconsequence.9 Evidence exists that children begin to developskills in identifying risks during this period and take respon-sibility for decisions around injury risk.10,11 Harnessing thisevolving independence may therefore be a viable strategy inthe development of prevention interventions.
As a result of these transitions, schools emerge as anideal location to facilitate exposure to health promotionmessages.12 School-aged children spend more than half of thecalendar year in the school setting, with a typical day lastinga minimum of seven hours. To fully capitalize on thestrengths of school settings, an understanding of the increas-ing importance of peer influences, individually and collec-tively, on behavior change is critical.13 School is often a keyplace where friendships are formed. The dual roles of familyand peers in the lives of children in this age group requiresfurther study to be fully understood; however, it is clear thatchildren spend the most time and experience the most social-ization with peers.14 Influence among peers can be furtherenhanced by the use of students to deliver messages.
As summarized by the CDC in its targeted media cam-paign for Tweens, effective messages must start with thechild instead of the parent, endorse realistic and factual ben-efits, utilize a spokesperson whose identity reinforces thecore message, and deliver multi-channeled messages in aconsistent manner.9 The purpose of this project was to pilotsuch an intervention targeting Tween-aged children in aschool with substantial risk factors for motor vehicle injury.
MATERIALS AND METHODSSetting
An inner city elementary school, in the target communityfor the Injury Free Coalition for Kids of Little Rock atArkansas Children’s Hospital, was the site for the CubsClick-It for Safety campaign. The school principal and staffagreed to participate in the project for an entire school year.Although the target group for the intervention were the 8–12year olds, all children within the school were exposed toeducational messages and observed for restraint changes.During the year studied, 616 pre-kindergarten through fifthgrade students attended the school, representing 473 separatefamilies. Of these children, 436 (70.8%) were in grades 1–5,the major focus of the intervention. Half of the student bodywas from inner city neighborhoods. Seventy percent of thestudents were African American and 61% of the students inthe school qualified for free or reduced lunch based on eco-nomic need. Females accounted for 52.2% of the studentbody.
Project Team and StaffingStaff from the Injury Free Coalition for Kids at Arkansas
Children’s Hospital developed and administered the project.
Selected fifth grade students became part of the project teamafter receiving brief training on motor vehicle safety. Thesestudent team members assisted in material development, pro-cess evaluation, and survey administration. The students alsoacted as role models for their peers and participated in edu-cational activities throughout the year.
Intervention ActivitiesDuring the 5-month intervention period educational ac-
tivities included morning and afternoon announcements viaclosed circuit television, school assemblies, a prominentlyplaced bulletin board, and poster distribution. All educationalmaterials utilized the Cubs Click It for Safety logo andmessage, which was based on the school’s tiger cub mascot.Video and voice messages in the daily morning announce-ments included a visual image of buckling a seat belt aroundthe school mascot, with the admonition: “Remember, CubsClick It for Safety.” Afternoon public address announcementsincluded a verbal message reinforced with a “clicker” soundfor buckling up.
Safety messages were reinforced with parents throughoutthe school year by distributing educational brochures duringfamily-centered activities, such as back-to-school picnics andthe school’s annual festival. Brochures on motor vehiclesafety were distributed during the pre-intervention observa-tional surveys. Wrist bands and other novelty items withsafety messages were given to appropriately restrained andpositioned passengers and drivers during the interim andpost-intervention observational surveys.
Evaluation Tools and Data AnalysisVoluntary surveys were administered before and after
the intervention to parents of students attending the school aswell as students in first through fifth grades. These instru-ments assessed parent and student reported safety behaviorsin motor vehicles, including restraint use and seating position.Three times over the five month period, observations wereconducted to document seat belt use and seating position inthe vehicle. These observational surveys, conducted by studystaff and the student peer assistants during morning studentdrop-off near the school, were brief, anonymous, and non-invasive. Observational survey forms were modified fromthose used in other child passenger safety interventions.15
Observations were conducted in two parking lot areas, in-cluding an area dedicated for pre-K students and older stu-dents whose parents park for an extended period to enter thebuilding and another area for the remaining student body.
SPSS 12.0 (SPSS, Chicago, IL) statistical software wasused to tabulate and analyze data. Descriptive summaries ofdata were developed to characterize survey responses. The �2
test was used to compare populations before and after theintervention. The study protocol was reviewed and approvedby the University of Arkansas for Medical Sciences Institu-tional Review Board.
The Journal of TRAUMA� Injury, Infection, and Critical Care
S40 Supplement 2007

RESULTSStaff Education
The project was conducted during the 2005–2006 schoolyear. At the beginning of the school year, during a regularlyscheduled staff meeting, a brief 15 minute in-service wasconducted for teachers and staff. The goals and plans for theproject were introduced, and general principles of safe childtransportation were reviewed. A 4 question assessment ofstaff knowledge was administered to 39 staff members beforethe presentation and again at the end of the school year.Before the intervention, 35 (90%) of the staff were aware thatmotor vehicle crashes are the leading cause of death forchildren under 14; however, only 14 (36%) knew that thesubgroup of children aged 8–14 years had the highest rates ofmotor vehicle fatalities. Twenty staff members (51%) wereaware of Arkansas’ booster seat law but only nine (23%)knew that less than 14% of Arkansas’ 4 to 8 year oldscurrently utilize booster seats. Following the intervention,knowledge increased substantially, with correct responserates between 95–100% for each question.
Parent/Student SurveysAn anonymous 7 question parent survey, designed to
examine parent perception and parent/child restraint use overtime, was administered at the beginning and the end of thefive-month intervention period. Parents were offered an entryinto a drawing for a $20 gift card as incentive for completingand returning the parent survey. Each family was asked to
complete one survey only, regardless of the number of chil-dren currently attending the school. Students in grades 1–5completed a short six question survey, examining recentmotor vehicle safety practices as well as restraint use overtime. Teachers administered student surveys as classroomtime permitted.
Results of the parent and student knowledge surveys arefound in Table 1. Surveys were returned by 269 parents (57%of families) before the intervention and by 213 (45% offamilies) after the intervention. Gender was the only demo-graphic data collected; 89% (N � 240) of respondents werefemale. At pre-test 37% (N � 100) of parents considered aseat belt without a booster seat to be an appropriate restraintfor a child 5–8 years old. Following the intervention, atti-tudes changed significantly; only 25% (N � 53) of parentsfelt a seat belt alone was adequate (p � 0.004). Parents alsoreported a change in attitude surrounding seating position forchildren; pre-intervention 10% (N � 26) and post-interven-tion 5% (N � 11) of parents agreed with a child age 5–8riding in the front seat of a motor vehicle. Parent-reportedrestraint use remained fairly stable over the target time frame,with about 95% (N � 254 pre-intervention, N � 205 post-intervention) reporting seat belt use on last outing. Followingthe campaign, 77% (N � 163) of parents reported seeing orhearing information about seating position and restraint usefor children under 13.
Students in grades 1–5 completed a 6 question survey; atotal of 380 (87% of 1st–5th grade students) pre-intervention
Table 1 Parent/Student Survey Results
Pre-Intervention
Post-Intervention
N % N % P-Value
Parent survey N � 269 N � 213Appropriate for a child 5–8 to restrained by seatbelt only
Yes 100 37% 53 25% 0.004Appropriate for a child 5–8-yr-old to ride in the front seat
Yes 26 10% 11 5% 0.06Did you wear your seatbelt on your last trip in a motor vehicle
Yes 254 95% 205 96% 0.443Seen/Heard info last 6 mo*
Yes NA NA 163 77%Gender
Female 240 89% 185 87%Male 27 10% 26 12%
Student survey N � 380 N � 245Have you ever ridden in the front seat?
Yes 250 66% 163 67% 0.675Did you wear your seatbelt on your last trip in a motor vehicle?
Yes 297 78% 219 89% 0.001Did you ride in the front on your last trip in a motor vehicle?
Yes 156 41% 101 41% 0.846Seen/Heard info last 6 mo*
Yes NA 0NA 200 82%Gender
Female 182 48% 111 45%Male 198 52% 134 55%
School-Based Intervention for Child Passenger Safety
Volume 63 • Number 3 S41
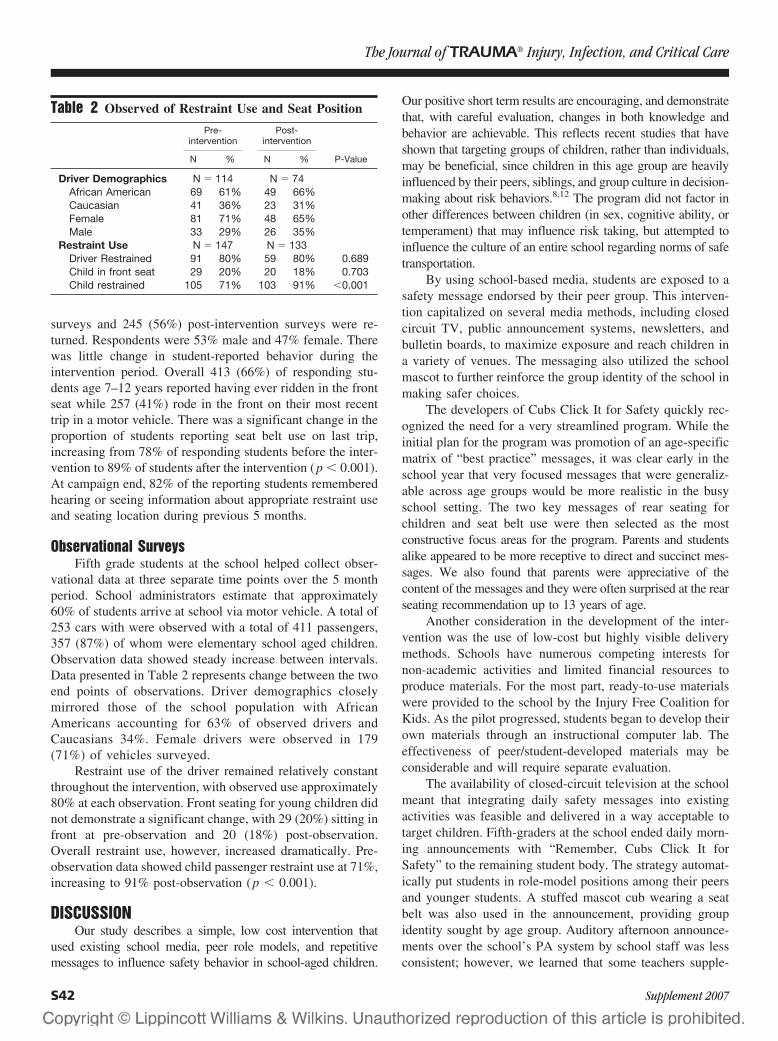
surveys and 245 (56%) post-intervention surveys were re-turned. Respondents were 53% male and 47% female. Therewas little change in student-reported behavior during theintervention period. Overall 413 (66%) of responding stu-dents age 7–12 years reported having ever ridden in the frontseat while 257 (41%) rode in the front on their most recenttrip in a motor vehicle. There was a significant change in theproportion of students reporting seat belt use on last trip,increasing from 78% of responding students before the inter-vention to 89% of students after the intervention (p � 0.001).At campaign end, 82% of the reporting students rememberedhearing or seeing information about appropriate restraint useand seating location during previous 5 months.
Observational SurveysFifth grade students at the school helped collect obser-
vational data at three separate time points over the 5 monthperiod. School administrators estimate that approximately60% of students arrive at school via motor vehicle. A total of253 cars with were observed with a total of 411 passengers,357 (87%) of whom were elementary school aged children.Observation data showed steady increase between intervals.Data presented in Table 2 represents change between the twoend points of observations. Driver demographics closelymirrored those of the school population with AfricanAmericans accounting for 63% of observed drivers andCaucasians 34%. Female drivers were observed in 179(71%) of vehicles surveyed.
Restraint use of the driver remained relatively constantthroughout the intervention, with observed use approximately80% at each observation. Front seating for young children didnot demonstrate a significant change, with 29 (20%) sitting infront at pre-observation and 20 (18%) post-observation.Overall restraint use, however, increased dramatically. Pre-observation data showed child passenger restraint use at 71%,increasing to 91% post-observation (p � 0.001).
DISCUSSIONOur study describes a simple, low cost intervention that
used existing school media, peer role models, and repetitivemessages to influence safety behavior in school-aged children.
Our positive short term results are encouraging, and demonstratethat, with careful evaluation, changes in both knowledge andbehavior are achievable. This reflects recent studies that haveshown that targeting groups of children, rather than individuals,may be beneficial, since children in this age group are heavilyinfluenced by their peers, siblings, and group culture in decision-making about risk behaviors.8,12 The program did not factor inother differences between children (in sex, cognitive ability, ortemperament) that may influence risk taking, but attempted toinfluence the culture of an entire school regarding norms of safetransportation.
By using school-based media, students are exposed to asafety message endorsed by their peer group. This interven-tion capitalized on several media methods, including closedcircuit TV, public announcement systems, newsletters, andbulletin boards, to maximize exposure and reach children ina variety of venues. The messaging also utilized the schoolmascot to further reinforce the group identity of the school inmaking safer choices.
The developers of Cubs Click It for Safety quickly rec-ognized the need for a very streamlined program. While theinitial plan for the program was promotion of an age-specificmatrix of “best practice” messages, it was clear early in theschool year that very focused messages that were generaliz-able across age groups would be more realistic in the busyschool setting. The two key messages of rear seating forchildren and seat belt use were then selected as the mostconstructive focus areas for the program. Parents and studentsalike appeared to be more receptive to direct and succinct mes-sages. We also found that parents were appreciative of thecontent of the messages and they were often surprised at the rearseating recommendation up to 13 years of age.
Another consideration in the development of the inter-vention was the use of low-cost but highly visible deliverymethods. Schools have numerous competing interests fornon-academic activities and limited financial resources toproduce materials. For the most part, ready-to-use materialswere provided to the school by the Injury Free Coalition forKids. As the pilot progressed, students began to develop theirown materials through an instructional computer lab. Theeffectiveness of peer/student-developed materials may beconsiderable and will require separate evaluation.
The availability of closed-circuit television at the schoolmeant that integrating daily safety messages into existingactivities was feasible and delivered in a way acceptable totarget children. Fifth-graders at the school ended daily morn-ing announcements with “Remember, Cubs Click It forSafety” to the remaining student body. The strategy automat-ically put students in role-model positions among their peersand younger students. A stuffed mascot cub wearing a seatbelt was also used in the announcement, providing groupidentity sought by age group. Auditory afternoon announce-ments over the school’s PA system by school staff was lessconsistent; however, we learned that some teachers supple-
Table 2 Observed of Restraint Use and Seat Position
Pre-intervention
Post-intervention
N % N % P-Value
Driver Demographics N � 114 N � 74African American 69 61% 49 66%Caucasian 41 36% 23 31%Female 81 71% 48 65%Male 33 29% 26 35%
Restraint Use N � 147 N � 133Driver Restrained 91 80% 59 80% 0.689Child in front seat 29 20% 20 18% 0.703Child restrained 105 71% 103 91% �0.001
The Journal of TRAUMA� Injury, Infection, and Critical Care
S42 Supplement 2007

mented the announcement by using “clickers” distributed asan incentive at a school event.
The study has a number of limitations that should beacknowledged. The results reflect only short term response tothe educational intervention; sustained change in knowledgeand behavior must be evaluated in further study. The studyalso benefited from a positive pre-existing relationship withthe school staff and a strong school tradition of participationin public health education and research projects, easing theimplementation of the program. It is therefore likely thatreplicating the program in other settings would take moretime and perhaps more staff energy than we experienced.Further, there is the risk of response bias in our survey results,because families with more interest or knowledge on thistopic may have been more likely to respond to the parent andstudent knowledge surveys. The likelihood of response bias ismuch less for the observational surveys, since presumably asimilar population would be driving children to schoolthroughout the academic year and these surveys were con-ducted by staff rather than turned in at will by parents. Theimportance using direct observational surveys to documentactual change in behavior, rather than just reported change, isillustrated in the somewhat lower observed restraint use,especially among parents, compared with the reported use inthe surveys.
CONCLUSIONSAn elementary school-based child passenger safety edu-
cation program targeting Tweens was well received by stu-dents, parents, and faculty. Low-cost materials and infusionof targeted safety messages into existing school activitieswere an important features. Short term improvement in bothknowledge and some targeted safety behaviors was noted, butmuch further study of the long term impacts of such inter-ventions are needed. A controlled study comparing outcomeswith another school is underway.
ACKNOWLEDGMENTSWe thank the staff at Martin Luther King, Jr. Elementary School, and
especially Tyrone Harris, Principal, for their cooperation. Support for theproject was also provided by the Child Passenger Safety Education program
at the University of Arkansas for Medical Sciences via a grant from theHighway Safety Office of the Arkansas State Police.
REFERENCES1. Winston F�, Chen IG, Arbogast KB, Elliott MR, Durbin DR. Shifts
in child restraint use according to child weight in the United Statesfrom 1999 to 2002. Annu Proc Assoc Adv Automot Med. 2003;47:313–328.
2. Winston F�, Chen IG, Elliott MR, Arbogast KB, Durbin DR.Recent trends in child restraint practices in the United States.Pediatrics. 2004;113:e458–464.
3. Centers for Disease Control and Prevention. Morbidity & MortalityWeekly Report. 2006;55(SS-5):1–108.
4. Winston F�, Durbin DR, Kallan MJ, Elliott MR. Rear seating andrisk of injry to child occupants by vehicle type. Annu Proc AssocAdv Automot Med. 2001;45:51–60.
5. Durbin DR, Chen I, Smith R, Elliott MR, Winston FK. Effects ofseating position and appropriate restraint use on the risk of injuryto children in motor vehicle crashes. Pediatrics. 2005 Mar;115:e305–309.
6. Smith KM, Cummings P. Passenger seating position and the risk ofpassenger death or injury in traffic crashes. Accid Anal Prev. 2004Mar;36:257–260.
7. Jennings J, Merzer A, Mitchell P. Tween Traffic Safety. AutomotiveCoalition for Traffic Safety, Inc. Arlington, VA, 2006.
8. �orrongiello ��, Lasenby-Lessard J. Psychological determinants ofrisk taking by children: an integrative model and implications forinterventions. Inj Prev. 2007;13:20–25.
9. Santrock JW. Psychology: The Science of Mind and Behavior.Dubuque, IA:Wm. C. Brown Publishers, 1986.
10. Hillier LM, Morrongiello BA. Age and gender differences in school-age childrens’ appraisals of injury risk. J Pediatr Psychol. 1998;23:229–238.
11. �orrongiello ��, Rennie H. Why do boys engage in more risktaking than girls? The role of attributions, beliefs, and riskappraisals. J Pediatr Psychol. 1998;23:33–43.
12. Life’s first great crossroad, tweens make choices that affect theirlives forever. CDC, Youth Media Campaign, May 2000. http://www.cdc.gov/youthcampaign/research/PDF/LifesFIrstCrossroad.pdflast accessed 02/17/07.
13. Gifford-Smith M, Dodge KA, Dishion TJ, McCord J. Peer influencesin children and adolescents: Crossing the bridge from developmentalto intervention science. J Abnorm Child Psychol. 2005;33:255–265.
14. Hartup WW. Peer interaction: what causes what? J Abnorm ChildPsychol. 2005;33:387–394.
15. Ebel BE, Koepsell TD, Bennett EE, Rivara FP. Use of child boosterseats in motor vehicles following a community campaign: acontrolled trial. JAMA. 2003;289:879–884.
School-Based Intervention for Child Passenger Safety
Volume 63 • Number 3 S43

Reducing Injury Rates Using a Community-Based ApproachMichael A. Gittelman, MD, Wendy J. Pomerantz, MD, MS, and Talicia McNealy, MBA
Background: Injuries are the num-ber one cause of morbidity and mortalityto persons aged 1–44 years in the UnitedStates. Community-based interventionsoffer one approach to reducing injuries.
Objective: To determine whetherinjuries could be reduced over a 5 yearperiod by at least 20% in a midwesterncommunity using a proven community-based model compared with three controlcommunities.
Materials/Methods: The Injury FreeCoalition for Kids of Greater Cincinnatibegan its injury-reducing efforts withinone Intervention Community (IC) in 2000.After reviewing injury data, engaging
community members, and holding focusgroups to assess community needs, spe-cific structural and social alterations weremade to engage youth in safe, supervisedactivities and provide them with safe playplaces. Data were obtained from the Ham-ilton County Injury Surveillance Systemfrom 1999–2004 for deaths, hospitaliza-tions, and emergency department visits.Data in our IC were compared with threecontrol communities in the city with sim-ilar demographics and socioeconomiccharacteristics. 2000 Census data wereused to calculate injury rates.
Results: During study period, 5065 ICyouth sustained 3796 injuries, while 9297
youth from the control settings sustained5445 injuries. Injury rate in the IC de-creased 42% from 1999 to 2004, 17551.83 to10187.56 injuries/100,000 children/year, re-spectively, compared with the mean rateamong the three control sites, which de-creased 25.7%, 12950.41 to 9626.76 injuries/100,000 children/year. This difference wasstatistically significant, p < 0.001.
Conclusions: Community preven-tion efforts that engage youth in super-vised activities and provide safe play areascan help to reduce youth injuries withinspecific high-risk communities.
Key Words: Community-based, In-jury prevention, Injury Free Coalition.
J Trauma. 2007;63:S44–S49.
Injuries continue to be the number one cause of morbidityand mortality to persons aged 1–44 years within theUnited States.1 Community-based interventions offer one
approach to reducing this injury burden. These interventionsmay target a group of individuals or a particular geographicregion (e.g. towns, schools, etc.). The types of community-based interventions chosen often concentrate on educationalefforts to alter attitudes and change behaviors, passing andenforcing legislation, and changing the structural environ-ment within a community to provide safer surroundings foryouth. By analyzing injury data within a specific community,unique problems within a targeted region can be determined
so that appropriate types of community-based interventionsmay be implemented and assessed for effectiveness.
The impact of a community prevention approach onchanging safety practices and reducing pediatric injuries hasbeen mixed within the literature.2 Some success has beendemonstrated with regard to increasing bicycle helmet andcar seat use among children.3–9 Studies concentrating onpreventing other mechanisms of injuries such as child pedes-trian or teen driving-related injuries have been shown to beless effective.2 The true strength of the community-basedprevention approach, however, is the opportunity to addressmore than one injury mechanism within a targeted commu-nity. Studies looking at community efforts to reduce injuriesas a whole have also shown variable results.10–13 Confound-ing variables within each community and difficulties in find-ing comparison regions have been postulated as reasons whysome community interventions have not been shown to beeffective. Despite the minimal program success reported inthe literature, some of the studies have shown positiveeffects.10 Besides reducing injuries, the ability to mobilizecommunities and the idea of mass marketing general safetyadvice to higher risk individuals offer other promising aspectsto this injury prevention approach.
One particularly successful community-based injury pre-vention program is the Harlem Hospital Injury PreventionProgram. Dr. Barbara Barlow and colleagues started the In-jury Free Coalition for Kids (IFCK) based on the HarlemInjury Prevention Program.14 The focus of this organizationis to develop community-based interventions through hospital-community partnerships that ultimately decrease childhoodinjuries. Injury reducing techniques include: educating par-
Submitted for publication March 16, 2007.Accepted for publication May 30, 2007.Copyright © 2007 by Lippincott Williams & WilkinsThis article was written for the proceedings from a conference entitled
10th Annual Injury Free Coalition for Kids Conference in San Antonio,Texas. The opinions or assertions contained herein are the private views ofthe authors.
From the Division of Emergency Medicine, Cincinnati Children’s Hos-pital Medical Center (M.A.G., W.J.P.); Injury Free Coalition for Kids ofGreater Cincinnati, Division of Emergency Medicine, Cincinnati Children’sHospital Medical Center (T.M.), Cincinnati, Ohio.
Abstract presentations: Oral presentation at the Annual Meeting of theAmbulatory Pediatric Association, San Francisco, CA, May 2006; Oralpresentation at the Injury Free Coalition for Kids National Conference, Ft.Lauderdale, FL, December 2006.
Address reprints to: Michael A. Gittelman, MD, Principal Investigator,Associate Professor, Division of Emergency Medicine, Cincinnati Children’sHospital Medical Center, 3333 Burnet Avenue, ML# 2008, Cincinnati, OH45229; email: [email protected].
DOI: 10.1097/TA.0b013e31812f5f09
The Journal of TRAUMA� Injury, Infection, and Critical Care
S44 Supplement 2007

ents and children about risky behaviors, changing the phys-ical environment of the community to provide safe places forchildren to play, and implementing social changes to provideactivities which revolve around sports and cultural learning toengage youth during high injury times. Each of these efforts isdriven by surveillance data which determine how and wherechildren are injured, in conjunction with the individual commu-nity’s concerns about their children. By utilizing these tech-niques, Dr. Barlow and her associates successfully decreasedinjuries among Harlem children by greater than 60%.14 Becauseof their success, IFCK, funded by the Robert Wood JohnsonFoundation and other private supporters, disseminated its strat-egies to other cities across the United States. Cincinnati Chil-dren’s Hospital Medical Center’s (CCHMC) IFCK chapter wasofficially established in October of 2000 with the goal of reduc-ing injuries to youth in Cincinnati, OH. The objective of thisstudy was to determine whether injuries could be reduced overa five year period by at least 20% in a Cincinnati community,using the IFCK model, compared with three control Cincinnaticommunities with similar demographics.
MATERIALS AND METHODSThis is a case control study designed to examine the
effects of the Injury Free Coalition for Kids of Greater Cin-cinnati’s (IFCK-C) injury prevention program on reduction ofinjuries in one Cincinnati community. Children from birththrough 18 years of age were included. The study took placefrom January 1, 2000 through December 31, 2004. A multi-faceted intervention was put into place in one community;three other communities of similar demographics and socio-economic statuses were chosen to serve as control commu-nities. Injury rates were examined in all 4 communities beforeand after the intervention to determine changes.
IFCK-C is a multi-disciplinary group composed ofhospital personnel (physicians, nurses, paramedics, etc.)and community leaders, with representation from organi-zations such as the poison control center, the CincinnatiRecreation Commission (CRC), the community council,and business owners. Utilizing the Harlem Hospital IFCKmodel, injury prevention reforms in lower socioeconomiccommunities where the injury data suggests a high inci-dence of pediatric injuries were initiated.
IFCK-C chose to concentrate on reducing injuries toyouth within one intervention community (IC) within Cin-cinnati, OH. This community was chosen for its injury pre-vention interventions because it has one of the highest youthinjury rates in the city, and it is adjacent to CCHMC. It is oneof the largest communities within the city with almost 17,000residents, of which more than 5,000 are children under 18years of age. Ninety-one percent of the population is African-American, making it the largest African-American commu-nity in the city. The median family income is $22,500 peryear, and more than 33% of families live at or below povertylevel. Guided by the injury data and local community con-cerns, several social and physical environmental alterations
were implemented to make the community a safer place forchildren.
The IFCK-C program and data tracking for this studywere approved by the Cincinnati Children’s Hospital MedicalCenter’s institutional review board (IRB). Individual pro-grams that were implemented and evaluated separately withinthe IC were also approved by the CCHMC IRB.
Interventions Among Study PopulationIFCK-C’s approach to preventing injuries combines
hospital expertise of knowing injury data with communityrecommendations and input for addressing concerns anddeveloping interventions. The theory used to promotechange within this community was to provide youth withsafe play places and to engage them in supervised, coor-dinated activities during high injury times. After analyzingthe data as to types of injuries seen, before the studyperiod, it was noted there were many types of injuriesoccurring to the youth, and no one injury mechanismappeared more commonly than another. The most commoninjury mechanisms were falls, being struck by or against,cuts, bites/stings, sports-related injuries, motor-vehiclecrashes, and poisonings. Sixty four percent of injuriesoccurred in males and 95% in African Americans. Themost common places for injuries to occur were at homeand in the street. As our primary goal was to engage youthin safe, supervised activities during times they were likelyto be injured, times that injuries were occurring wereexamined. It was found that the majority of the injuriesoccurred during after school (4 pm–10 pm) and weekendhours.
At the beginning of our intervention period, our firstinitiative, building playgrounds, was aimed at altering thephysical environment within the community and providingchildren safe places to play. Play spaces owned by the CRC,with few or no play structures, located in high injury regionsof the community, were developed and redesigned to housestate-of-the-art playgrounds. The location and structure foreach playground was decided upon by members of the com-munity and families with a vested interest in the play areas.The labor was supplied by IFCK-C volunteers and commu-nity members, especially those living near the play areas.Four community-built playgrounds were constructed acrossthe IC between 2000 and 2003. Other structural alterationsaccomplished during the study period included: building afootball stadium adjacent to one of the community’s elemen-tary schools to accommodate local football teams practicesand home games and spearheading construction of speedbumps strategically placed in high pedestrian-injury areas.
Institution of supervised, coordinated activities began withfocus groups to determine the desires of the community. Focusgroups were held with parents obtained from the local schools,youth in the elementary school system, and community re-sources (e.g. local churches, recreation centers, the city zoolocated in the IC, etc.) to develop activities that would entice
Community-Based Approach to Reduce Injuries
Volume 63 • Number 3 S45

youth to participate. From these focus groups and through dis-cussions with community leaders, additional resources withinthe community joined the coalition and specific programs weredeveloped. Activities developed and provided during the studyperiod to engage youth on weekend, after school, and summertimes consisted of: after-school programming for at least 50students per day at each of the three elementary schools in thecommunity, summer educational classes, and a Friday nightbasketball league for youth aged 12–18. Our coalition alsoassisted with a pre-existing football league that engaged morethan 600 youth per year. In addition, educational endeavors topromote safety were provided for families at school and com-munity fairs with prevention messages geared toward the pop-ulation present. Finally, products such as booster seats and homesafety kits, with instructions on their use, were given away free,when available, to promote safer behaviors.
Data SourcesInjury rates were documented before beginning the study.
Information on injuries was obtained from the Hamilton CountyInjury Surveillance System (HCISS) and the CCHMC traumaregistry. HCISS is an ongoing database, established in 1996,housed at the Hamilton County Health Department, that containsdata regarding deaths, hospitalizations, and emergency depart-ment visits for injured patients cared for at all of the hospitals inHamilton County, OH. The CCHMC trauma registry is an on-going database, established in 1991 and maintained by thetrauma services department, which contains information aboutall patients sustaining injuries. Information for the CCHMCtrauma registry is obtained by abstracting medical charts of allpatients seen in the emergency department, admitted to thehospital, or reported deaths in the hospital as a result of injury(ICD-9 E-codes 800.00–995.09). Data from the CCHMCtrauma registry contains more detailed information than that ofthe HCISS. Data from the CCHMC trauma registry is submittedto the HCISS. Aside from number of injuries, other informationobtained from the data sources included: age, gender, and race ofthe child, where the child lived, whether the child lived or diedas a result of the injury, whether the child was admitted to thehospital or discharged home, site where the injury took place,injury mechanism, time, day, and month in which the injury tookplace.
Control PopulationsThree communities within the city of Cincinnati were
chosen by an independent reviewer before the beginning of
the study period to serve as control communities. The threecontrol communities, Communities A, B, and C, were se-lected based on their similarity to the IC with regard todemographics and socioeconomic status. The 4 parametersused to determine their similarity were percent of the popu-lation less than 18 years of age, percent African American,median family income, and percent living in poverty. Thesedemographical data points were chosen due to the fact thatrace and lower socioeconomic status are high risk factors forunintentional injuries.15
Data AnalysisInjury data from the HCISS for 1999 versus 2004 for
deaths, hospitalizations, and emergency department visits wereexamined. Census data were queried for each community tocalculate injury rates. Injury rates for the study and controlcommunities were calculated using injured children as the nu-merator and 2000 United States Census statistics as the denom-inator. Numerator data from the HCISS are reported based oncommunity boundaries, while the denominator data were calcu-lated using the census tracts within the community boundaries.Injury rate for the study group was compared with the meaninjury rate within the control communities. Chi-square test wasused to determine significance of the change.
RESULTSThe demographics of the study and control communities
are shown in Table 1. In the IC, during the study period, therewere 3796 injuries: 6 deaths, 201 hospitalizations, and 3589ED visits. Sixty percent of the injuries occurred in males and92.9% in African Americans. The most common places forinjuries to occur were at home and in the street. The mostcommon mechanisms of injuries were falls, being struck byor against, cut/pierce, overexertion, bites/stings, and motor-vehicle occupant injuries.
The baseline injury rate of the IC before the studyperiod, in 1999, was 17551.83 injuries/100,000 children/year. The baseline injury rate in the control communitieswas 12950.41 injuries/100,000 children/year. During thestudy period, 5065 IC youth sustained a total of 3796injuries. The overall injury rate in the IC in 2004 was 10187.56injuries/100,000 children/year. In the control communities, 9297youth sustained 5445 injuries. The overall injury rate in 2004 forthese communities was 9626.76 injuries/100,000 children/year.Thus, the IC showed a 42% reduction in the injury rate com-pared with only a 25.7% reduction of the mean rate in the control
Table 1 Comparison of Demographic Information between Study and Control Sites Based on 2000 Census Data
Neighborhood TotalPopulation
Percent of PopulationLess Than 18-yr-old (n)
% African-American
Median FamilyIncome
% BelowPoverty
Intervention Community 16,298 29% (5065) 91% $22,500 33%Community A 7928 31% (4577) 88% $32,500 24%Community B 6516 28% (2384) 73% $27,500 26%Community C 7790 27% (2336) 84% $22,500 33%
The Journal of TRAUMA� Injury, Infection, and Critical Care
S46 Supplement 2007

communities. (Fig. 1) The reduction in the overall rate of injurywas significantly less in the control communities compared withthe study population (p � 0.001).
For the individual communities that made up the con-trol sites, the injury rates were as follows: Community Ahad an injury rate of 8651.96/100,000 children/year in1999 and a rate of 7799.87/100,000 children/year in 2004(9.8% reduction); Community B had an injury rate of14010.07/100,000 children/year in 1999 and a rate of10360.74/100,000 children/year in 2004 (26.0% reduction),and Community C had an injury rate of 20291.10/100,000children/year in 1999 and a rate of 12457.19/100,000 chil-dren/year in 2004 (38.6% reduction).
Injuries impacted by this community prevention tech-nique were spread across nearly all injury mechanisms asshown in Figure 2. There was an 84.8% reduction in bites/stings, an 82.6% reduction in pedestrian injuries, a 58.8%reduction in bicycle-related injuries, a 53.8% reduction inoverexertion injuries, a 50.0% reduction in poisonings, a48.9% reduction in motor-vehicle occupant injuries, a46.9% reduction in cut/pierce injuries, a 40.2% reductionin being struck by things, a 29.0% reduction in falls.However an increase of 275% (from 4 to 11 cases) wasnoted in firearm-related injuries. This increase in firearm-related injuries was similar in the control communities(from 1 to 8 cases).
Fig. 1. Reduction of injuries comparing intervention and control sites.
Fig. 2. Reduction of injuries in the intervention community in 1999 versus 2004 by mechanism of injury.
Community-Based Approach to Reduce Injuries
Volume 63 • Number 3 S47

DISCUSSIONCommunity-based injury prevention interventions have
shown varying results in changing safety behaviors or reduc-ing injury rates among children.10–13 The Safe Kids/HealthyNeighborhoods Coalition in Harlem, New York, has reportedstatistically significant decreases in outdoor injuries; how-ever, it is questionable whether the decrease in injury rateswas solely attributable to their intervention.11 Svanstrom, andcolleagues, on the other hand, implemented community pro-grams in Sweden to prevent unintentional injuries and showedminimal change in injury rate between the intervention andthe control municipalities.12 General safety campaigns aboutthe problems seen in the intervention community, mobilizingexisting community organizations, and finding the right datasets to develop appropriate interventions and evaluate the ef-fects of the interventions have been cited as important compo-nents of community-based injury prevention programs.2 IFCKhas taken the community-based strategy for preventing injuriesand shown that this model for prevention can be successful.14
IFCK-C has replicated the National IFCK model initiated inHarlem, NY, and shown it can be successful in a Midwesterncommunity. By comparing communities in Cincinnati withpopulations of similar demographic make-up, reviewing datasets with outpatient, inpatient, and death records, and work-ing with the community council and other existing commu-nity organizations to know other programs/changes within theIC, we have attempted to limit some of the potential con-founding variables cited in other community-based interven-tions within the literature. With this approach, we have shownthat a hospital and community coalition, with the commongoal of preventing childhood injuries, can significantly re-duce pediatric injuries.
In reviewing our successes in Cincinnati, some key con-cepts are essential to getting started to replicate this model inother communities. Utilizing accurate hospital data to deter-mine the injury patterns and locations is an important way todetermine where to begin injury prevention efforts. Once datahas been gathered and a location is chosen to begin workingon the injury problem, building a coalition with both com-munity members and hospital personnel is essential. Thecoalition that is formed, along with community resources, canthen develop interventions geared to solving the problemsidentified through the data and those identified by communitymembers specific to the chosen community. Any interventioninitiated must then be evaluated. Evaluation is essential todetermine the effectiveness of the intervention. This modelmay sound uncomplicated; however, it takes several yearsand strong, consistent leadership to begin to see successful,sustained reductions in injuries.
IFCK-C was fortunate to already have the HCISS data-base and the CCHMC trauma registry established to obtaindata to determine where to begin targeting injury reduction.By starting our interventions with community-built play-grounds, our IC was able to see a tangible change. This led to
additional resources and people joining together within ourcoalition so that other interventions for the future could bediscussed, planned, and implemented. We believe that start-ing with a tangible structural change allowed our coalition toobtain buy-in from community members more rapidly and fora longer duration.
Although our data shows a significant reduction in un-intentional injury, it is important to compare these resultswith the control communities in more detail. In the IC therewas a 42.0% reduction in overall injury, while there was a25.7% reduction in the three control communities combined.In two of the control communities, Community A and Com-munity B, the reduction in injury was only 9.8% and 26.0%,respectively; however, in Community C there was a 38.6%reduction. This reduction of injury in Community C may besomewhat inflated. This community is directly adjacent to theIC; therefore, some of the structural alterations in the IC andsome of the programs provided for the youth may havepositively affected the population in Community C. Thiseffect might account for the greater reduction in injuries thanin the other control populations.
LimitationsThis study compares injury rates between our study pop-
ulation and three comparable control populations before andafter structural and social interventions were implemented.During this time period, other programs or positive structuralchanges may have occurred within the study and/or the con-trol regions that were not a part of IFCK-C; thus, we cannotsay that the interventions from IFCK-C alone were the rea-sons for the reduction in injury rates in the IC. However, inworking closely with the IC, we became aware of many of theother programs offered for youth. In addition, we canvassedthe community in great depth to determine any new signifi-cant structural changes, few to none of which were found.During the study period, the local recreation commissionrevitalized some of their other play spaces within the county.Also, other programs for youth may have been implementedin the control communities that we were unaware of that mayhave led to the reduction of injuries in these locations.
Another potential limitation of our study was thatcensus data are not updated yearly within the neighbor-hoods studied. As a result, the number used as the denom-inator to calculate injury rates may have changed duringthe study period for the study and control regions. There-fore, all rates might not be accurate in all areas. We didexamine school enrollment within the study and controlpopulations to gauge the change in the number of youthwithin the neighborhoods. Although there was a slightreduction in youth within the IC schools, there was asimilar reduction in the control school neighborhoods.Thus, we feel that if the population data were differentbetween 1999 and 2004, it was likely changed equallybetween our study and our control groups.
The Journal of TRAUMA� Injury, Infection, and Critical Care
S48 Supplement 2007

CONCLUSIONSCommunity-based injury prevention initiatives can be
a successful approach to reducing unintentional injurieswithin a specific region or community. IFCK-C utilized acommunity-based prevention model and sought to provideyouth with safe places to play and engage them in super-vised, structured activities during times of day when inju-ries were more likely to occur. In comparing injury ratesseen in the IC to three control communities before andafter our intervention, a significant reduction in injurieswas seen. This model could potentially be replicablewithin other communities given time, data resources, andcoalition building skills.
ACKNOWLEDGMENTSWe would like to thank several individuals and organizations for
their assistance in making our research project and the IFCK-C a suc-cessful program: Cynthia Yund, PhD, Director of Epidemiology andAssessment, Hamilton County General Health District, and MargieBrunn, CCHMC Trauma Registry Coordinator for their assistance incollecting and providing data; Gayle Harden-Renfro, for being theIFCK-C original community coordinator; Katie Williams and LaurenFrey, for their work as research coordinators throughout the duration ofthe study; the intervention community council along with the manycommunity organizations and members we partnered with to accomplishall of the structural and social modifications in the IC and helping tomobilize this community for change; and the Robert Wood JohnsonFoundation and National Injury Free Coalition for Kids® for fundingsupport and guidance throughout the development of our local IFCK-Cprogram.
REFERENCES1. Centers for Disease Control and Prevention National Center for
Injury Prevention and Control. Scientific Data, Statistics, andSurveillance. Atlanta, GA: Centers for Disease Control andPrevention. Available at: http://www.cdc.gov/ncipc/osp/data.htm.Accessed July 5, 2007.
2. Klassen TP, MacKay JM, Moher D, et al. Community-based injuryprevention interventions. The Future of Children: UnintentionalInjuries in Childhood 2000;10:83–110.
3. Cote TR, Sacks JJ, Lambert-Huber DA, et al. Bicycle helmet useamong Maryland children: effect of legislation and education.Pediatrics 1992;89:1216–1220.
4. DiGuiseppi CG, Rivara FP, Koepsell TD, Polissar L. Bicycle helmetuse by children. Evaluation of a community-wide helmet campaign.JAMA. 1989;262:2256–2261.
5. Farley C, Haddad S, Brown B. The effects of a four-year programpromoting bicycle helmet use among children in Quebec. Am JPublic Health 1996;86:46–51.
6. Dannenberg AL, Gielen AC, Beilenson PL, Wilson MH. Bicyclehelmet laws and educational campaigns: an evaluation ofstrategies to increase children’s helmet use. Am J Public Health1994;83:667– 674.
7. Chang A, Dillman AS, Leonard E, English P. Teaching carpassenger safety to preschool children. Pediatrics 1985;76:425–428.
8. Hazinski MF, Eddy VA, Morris JAJ. Children’s traffic safetyprogram: influence of early elementary school safety education onfamily seat belt use. J Trauma 1995;39:1063–1068.
9. Stuy M. Green M, Doll J. Child care centers: a community resourcefor injury prevention. J Dev Behav Pediatr 1993;14:224–229.
10. Donnelly PG, Kimble CE. An evaluation of the effects ofneighborhood mobilization on community problems. J PreventionInterv Commun 2006;32:61–79.
11. Davidson LL, Durkin MS, Kuhn L, et al. The impact of the SafeKids/Healthy Neighborhoods Injury Prevention Program in Harlem,1988–1991. Am J Public Health 1994;84:580–586.
12. Svanstrom L. The Lidkoping Accident Prevention Programme: acommunity approach to preventing childhood injuries in Sweden.Injury Prevention 1995;1:169–172.
13. Schlesinger ER, Dickson DG, Westaby J, et al. A controlled study ofhealth education in accident prevention: the Rockland County ChildInjury Project. Inj Prev 1997;3:218–223.
14. Pressley JC, Barlow B, Durkin M, et al. A national program forinjury prevention in children and adolescents: the Injury FreeCoalition for Kids. J Urban Health 2005;82:389–402.
15. Durkin MS, Davidson LL, Kuhn L, et al. Low-incomeneighborhoods and the risk of severe pediatric injury: a small-areaanalysis in northern Manhattan. Am J Public Health 1994;84:587–592.
Community-Based Approach to Reduce Injuries
Volume 63 • Number 3 S49