SEPIa, a knowledge-driven algorithm for predicting ... · SEPIa, a knowledge-driven algorithm for...
12
RESEARCH ARTICLE Open Access SEPIa, a knowledge-driven algorithm for predicting conformational B-cell epitopes from the amino acid sequence Georgios A. Dalkas 1,3 and Marianne Rooman 1,2* Abstract Background: The identification of immunogenic regions on the surface of antigens, which are able to be recognized by antibodies and to trigger an immune response, is a major challenge for the design of new and effective vaccines. The prediction of such regions through computational immunology techniques is a challenging goal, which will ultimately lead to a drastic limitation of the experimental tests required to validate their efficiency. However, current methods are far from being sufficiently reliable and/or applicable on a large scale. Results: We developed SEPIa, a B-cell epitope predictor from the protein sequence, which is sufficiently fast to be applicable on a large scale. The originality of SEPIa lies in the combination of two classifiers, a naïve Bayesian and a random forest classifier, through a voting algorithm that exploits the advantages of both. It is based on 13 sequence-based features, whose values in a 9-residue sequence window are compiled to predict the epitope/ non-epitope state of the central residue. The features are related to the type of amino acid, its conservation in homologous proteins, and its tendency of being exposed to the solvent, soluble, flexible, and disordered. The highest signal is obtained from statistical amino acid preferences, but all 13 features contribute non-negligibly in the predictor. SEPIa’s average prediction accuracy is limited, with an AUC score (area under the receiver operating characteristic curve) that reaches 0.65 both in 10-fold cross-validation and on an independent test set. It is nevertheless slightly higher than that of other methods evaluated on the same test set. Conclusions: SEPIa was applied to a test protein whose epitopes are known, human β2 adrenergic G-protein-coupled receptor, with promising results. Although the actual AUC score is rather low, many of the predicted epitopes cluster together and overlap the experimental epitope region. The reasons underlying the limitations of SEPIa and of all other B-cell epitope predictors are discussed. Keywords: Immunoinformatics, Machine learning, Antigen-antibody complexes, B-cell epitopes, Statistical potentials, Physicochemical properties, Bioinformatics predictor, β2 adrenergic G-protein-coupled receptor Background The humoral immune system protects the extracellular space from foreign objects like bacteria and viruses. A central role in the immune response is played by anti- bodies that are secreted by B-cells. These proteins recognize the disease-causing agents and thereby trigger their neutralization. The recognition mechanism involves the binding of antibodies to antigens, which are usually proteins or polysaccharides from the pathogenic sub- stances. Epitopes are the regions of the antigen surface that are bound by the antibodies. The localization and identification of epitopes, which are targeted by specific antibodies and are capable of inducing an efficient immune response, is of utmost importance for the rational design of potential vaccines [1–3]. We focused in this paper on protein antigens. These are classified as linear (or continuous) and conformational (or discontinuous) epitopes, depending on their structure and interaction with antibodies [4]. Specifically, linear epitopes consist of amino acids that are contiguous in * Correspondence: [email protected] 1 BioModeling, BioInformatics & BioProcesses (3BIO), Université Libre de Bruxelles (ULB), CP 165/61, 50 Roosevelt Ave, 1050 Brussels, Belgium 2 Interuniversity Institute of Bioinformatics in Brussels, ULB-VUB, CP 263, Triumph Bld, 1050 Brussels, Belgium Full list of author information is available at the end of the article © The Author(s). 2017 Open Access This article is distributed under the terms of the Creative Commons Attribution 4.0 International License (http://creativecommons.org/licenses/by/4.0/), which permits unrestricted use, distribution, and reproduction in any medium, provided you give appropriate credit to the original author(s) and the source, provide a link to the Creative Commons license, and indicate if changes were made. The Creative Commons Public Domain Dedication waiver (http://creativecommons.org/publicdomain/zero/1.0/) applies to the data made available in this article, unless otherwise stated. Dalkas and Rooman BMC Bioinformatics (2017) 18:95 DOI 10.1186/s12859-017-1528-9
Transcript of SEPIa, a knowledge-driven algorithm for predicting ... · SEPIa, a knowledge-driven algorithm for...

RESEARCH ARTICLE Open Access
SEPIa, a knowledge-driven algorithm forpredicting conformational B-cell epitopesfrom the amino acid sequenceGeorgios A. Dalkas1,3 and Marianne Rooman1,2*
Abstract
Background: The identification of immunogenic regions on the surface of antigens, which are able to berecognized by antibodies and to trigger an immune response, is a major challenge for the design of new andeffective vaccines. The prediction of such regions through computational immunology techniques is a challenginggoal, which will ultimately lead to a drastic limitation of the experimental tests required to validate their efficiency.However, current methods are far from being sufficiently reliable and/or applicable on a large scale.
Results: We developed SEPIa, a B-cell epitope predictor from the protein sequence, which is sufficiently fast to beapplicable on a large scale. The originality of SEPIa lies in the combination of two classifiers, a naïve Bayesian anda random forest classifier, through a voting algorithm that exploits the advantages of both. It is based on 13sequence-based features, whose values in a 9-residue sequence window are compiled to predict the epitope/non-epitope state of the central residue. The features are related to the type of amino acid, its conservationin homologous proteins, and its tendency of being exposed to the solvent, soluble, flexible, and disordered. Thehighest signal is obtained from statistical amino acid preferences, but all 13 features contribute non-negligibly in thepredictor. SEPIa’s average prediction accuracy is limited, with an AUC score (area under the receiver operatingcharacteristic curve) that reaches 0.65 both in 10-fold cross-validation and on an independent test set. It is neverthelessslightly higher than that of other methods evaluated on the same test set.
Conclusions: SEPIa was applied to a test protein whose epitopes are known, human β2 adrenergic G-protein-coupledreceptor, with promising results. Although the actual AUC score is rather low, many of the predicted epitopes clustertogether and overlap the experimental epitope region. The reasons underlying the limitations of SEPIa and of all otherB-cell epitope predictors are discussed.
Keywords: Immunoinformatics, Machine learning, Antigen-antibody complexes, B-cell epitopes, Statistical potentials,Physicochemical properties, Bioinformatics predictor, β2 adrenergic G-protein-coupled receptor
BackgroundThe humoral immune system protects the extracellularspace from foreign objects like bacteria and viruses. Acentral role in the immune response is played by anti-bodies that are secreted by B-cells. These proteinsrecognize the disease-causing agents and thereby triggertheir neutralization. The recognition mechanism involves
the binding of antibodies to antigens, which are usuallyproteins or polysaccharides from the pathogenic sub-stances. Epitopes are the regions of the antigen surfacethat are bound by the antibodies. The localization andidentification of epitopes, which are targeted by specificantibodies and are capable of inducing an efficientimmune response, is of utmost importance for the rationaldesign of potential vaccines [1–3].We focused in this paper on protein antigens. These are
classified as linear (or continuous) and conformational (ordiscontinuous) epitopes, depending on their structureand interaction with antibodies [4]. Specifically, linearepitopes consist of amino acids that are contiguous in
* Correspondence: [email protected], BioInformatics & BioProcesses (3BIO), Université Libre deBruxelles (ULB), CP 165/61, 50 Roosevelt Ave, 1050 Brussels, Belgium2Interuniversity Institute of Bioinformatics in Brussels, ULB-VUB, CP 263,Triumph Bld, 1050 Brussels, BelgiumFull list of author information is available at the end of the article
© The Author(s). 2017 Open Access This article is distributed under the terms of the Creative Commons Attribution 4.0International License (http://creativecommons.org/licenses/by/4.0/), which permits unrestricted use, distribution, andreproduction in any medium, provided you give appropriate credit to the original author(s) and the source, provide a link tothe Creative Commons license, and indicate if changes were made. The Creative Commons Public Domain Dedication waiver(http://creativecommons.org/publicdomain/zero/1.0/) applies to the data made available in this article, unless otherwise stated.
Dalkas and Rooman BMC Bioinformatics (2017) 18:95 DOI 10.1186/s12859-017-1528-9

the polypeptide chain, while conformational epitopes con-tain amino acids that are distant along the sequence butspatially close in the native structure. Linear epitopesare often found in peptides and conformational epi-topes in proteins.For over 30 years, computational methods have been
developed for facilitating epitope recognition [5]. In thepast, the majority of the in silico methods were focusedon linear epitopes. Most of these approaches aresequence-based and use amino acid-based propensityscales, such as hydrophilicity, solvent accessibility, sec-ondary structure and flexibility; a score derived from thepropensity scales is assigned to each residue, and thewhole sequence is examined for high-scoring windowfragments, which are then predicted as epitopes [6–12].However, the prediction results of these methods haveonly marginally better performances than random selec-tions [13]. In the last few years, several groups investigatedthe combination of multiple amino acid propensity scalesto predict linear B-cell epitopes [14–17] with no signifi-cant improvement of the prediction success rate. Recently,not only sequence-based, but also structure-based, aminoacid features have been used in conjunction with machinelearning methods and have been shown to slightlyimprove the prediction accuracy of linear B-cell epitopepredictions [14–23].Although the large majority of B-cell epitopes are
conformational [24], they started to be studied later.Many groups have analyzed various physicochemical,structural, and geometrical features of epitopes in orderto determine which of them significantly distinguishepitope from non-epitope antigen residues [25–29] andwhat are the characteristics of antigen-antibody in-terfaces compared to other protein-protein interfaces[30–33]. The existing conformational epitope predic-tion tools were developed by combining such inform-ative attributes, which are based either purely on thesequence, or both on the sequence and the structure[34–39]. More recently, machine-learning techniqueshave been used to improve the prediction perform-ance of conformational epitopes [40–47].In this study, we describe SEPIa, a conformational epi-
tope prediction method that requires only the aminoacid sequence as input and is based on commonly usedfeatures, but also on new ones. It utilizes a meta-learning approach, which combines the predictionsobtained with two different classifiers through a votingprocedure and yields a single prediction with improvedaccuracy [48].
MethodsDatasetsWe constructed a non-redundant data set of 85 ofantigen-antibody complexes, noted S85, from the Immune
Epitope Database (IEDB-3D) [49], which is an updatedand extended version of the one we used earlier [29]. Toincrease the number of antigen sequences used for devel-oping our method, and given that the 3-dimensional (3D)structure is only required for the identification of epitoperesidues, we considered structures with resolution betterthan 3 Å, against 2.5 Å in our previous study. The othercriteria remained the same: (i) for complexes representedby more than one crystal structure, the 3D structure withthe best resolution was chosen; (ii) structures in which theantibody binds the antigen but involves no residues fromcomplementarity determining regions (CDRs) were ex-cluded; (iii) complexes in which the antibody does notcontain both the light and heavy chains were discarded;(iv) for structures with more than one complex in oneasymmetric unit and no structural difference betweenthem, only one complex was chosen; and (v) to obtain anon-redundant data set, the sequences were pairwisealigned using the ClustalW program [50], and if twosequences had a sequence identity of more than 70%,only one was kept. Note that epitopes from similarantigens were kept if these antigens were in complexwith different antibody CDR sequences. With this pro-cedure, antibody–antigen complexes were selected andthe corresponding coordinate files were obtained fromthe Protein Data Bank (PDB) [51].Two of the antigens of the S85 dataset have common
epitopes, which are not identified as epitopes in allantigen-antibody complexes. We defined the S83 set thatcontains all 85 antigen chains of S85 except these two.The lists of antigens of the S85 and S83 sets are given inAdditional file 1: Table S1.To determine the epitopes, we proceeded as in refer-
ence [29]. We calculated the solvent accessibility valuesof the antigen residues without taking the antibody intoaccount (ACCunbound), using an in-house program [29],and compared them with the accessibility of antigenresidues in the complex (ACCbound). All antigen residueswith a solvent accessibility variation of 5% at least uponantibody binding (ACCunbound - ACCbound ≥ 5%) wereconsidered as epitope residues. The S85 set contains1,667 conformational B-cell epitope residues and 16,780other residues. The ratio between epitopes and non-epitopes is thus almost exactly 1:10.An independent dataset of 19 antigen sequences [42],
noted S19, was used to evaluate the predictor and tocompare it with other methods; it has already been usedfor that purpose in other investigations [42, 45, 52].These sequences and epitope assignments were takenfrom the conformational epitope database (CED) [53].The epitope residues were here not identified on thebasis of the 3D structure of the complexes, but ratherexperimentally, with the help of techniques such assurface plasmon resonance, ELISA and immunoblotting.
Dalkas and Rooman BMC Bioinformatics (2017) 18:95 Page 2 of 12
The ratio between epitope and non-epitope residuesin this set is 1:13, with 407 epitope and 5,192 non-epitope residues. The members the S19 set are listedin Additional file 1: Table S2The sequences from both datasets S85 and S19 were
pairwise aligned using the ClustalW server [50]. Noneshowed a sequence identity of more than 70%, which isthe identity threshold used for building S85. The twodatasets may thus be considered as independent.
FeaturesWe evaluated 14 sequence-derived features, referred toas F1–F14. These are:
Amino acid compositionIt is well known that certain amino acid types show pref-erences to be located in epitopes, in non-epitope proteinsurfaces, or in the protein core [29]. We used here twofeatures related to the amino acid composition: the ratioof the amino acid frequency observed in epitopes and inthe remaining antigen surface (referred to as F1), andthe ratio of the amino acid frequency in epitopes and inthe remaining antigen (F2). These two features werecomputed on the S85 dataset. Their values are given inAdditional File 1: Table S3.
HydrophilicityA characteristic closely related to the amino acid com-position is the hydrophilicity. Epitopes are known to beenriched in charged and hydrophilic amino acids [29].We used here the hydrophilicity scale of Hopp andWoods [6] as feature F3.
Secondary structureAs epitopes have been shown to be more often locatedin the loop regions of the antigen [29], the predictedsecondary structure was added as feature F4. We usedfor that purpose the program NetSurfP [54] thatprovides amino acid propensities for being in an α-helix,β-strand or coil. We also used the program BetaTPred3[55] that estimates the β-turn propensities in proteinsequences, and tested them as epitope feature F14.
FlexibilityGiven that epitopes often involve loop regions, flexibilitycould be expected to be an informative factor. We usedtwo programs to predict flexibility from sequence, Dyna-Mine [56] (F5) and PredyFlexy [57] (F6), which are basedon two different definitions of flexibility. DynaMinepredicts the backbone flexibility at the residue level inthe form of backbone N-H S2 order parameter values; avalue of 1 means a rigid conformation, while a value of 0means highly dynamic. PredyFlexy is instead based on
root mean square fluctuations (RMSF) obtained frommolecular dynamics simulations.
Intrinsically disordered regionsThe tendency of protein sequences of being structuredor unstructured is another feature that could helpdistinguishing epitope from non-epitope regions. Twoweb servers were used to calculate such regions fromthe amino acid sequence. IUPred [58] (F7) predictsintrinsically disordered regions and ANCHOR [59] (F8)disordered binding regions.
Energy-likeA novel feature that we introduce here is based on thestatistical potential formalism [60–62] to evaluate thepropensity of a residue to be part of an epitope. The first“potential”, Δw1, measures the influence of a residue oftype s at position j along the sequence on the epitope/non-epitope state u (u = E for epitopes and u = N fornon-epitopes) of the residue at position i:
Δw1 ui; sj� � ¼ −RT ln
F ui; sj� �
F uið ÞF sj� � ; ð1Þ
where F are relative frequencies computed from thelearning dataset S85, R is the Boltzmann constant, T theabsolute temperature taken to be room temperature, andj −w ≤ i ≤ j + w, with w an integer between 0 and 8. Thewindow size I = 2w + 1 is a parameter that will beoptimized to get the best prediction performances.The second “potential”, Δw2 , measures the influence
of two residues of types s and s′ at positions j and kalong the sequence on the epitope/non-epitope state uof the residue at position i:
Δw2 ui; sj; s0k
� � ¼ −RTlnF ui; sj; s0k� �
F uið ÞF sj; s0k� � ; ð2Þ
with j −w ≤ i ≤ j + w and k −w ≤ i ≤ k + w.To correct for sparse data, we applied the usual cor-
rection [54–56]:
F ui; sj� �
F uið ÞF sj� �→ 1
σ þ n sj� � σ þ n sj
� � F ui; sj� �
F uið ÞF sj� �
!;
F ui; sj; s0k� �
F uið ÞF sj; s0k� �→ 1
σ þ n sj; s0k� � σ þ n sj; s
0k
� � F ui; sj; s0k� �
F uið ÞF sj; s0k� �
!;
ð3Þ
with n (sj) and n (sj,s′k) the number of residues of thesetypes in the learning set, and σ = 10. This correctionensures that the “potentials” tend to 0 when the numberof observations in the data set is too small.Using these “potentials”, we computed an energy-like
contribution for each residue i in a protein sequence,
Dalkas and Rooman BMC Bioinformatics (2017) 18:95 Page 3 of 12

which measures their propensity of being an epitope(u = E) or a non-epitope (u = N):
ΔW1 uið Þ ¼X
j
Δw1 ui; sj� �
; ΔW2 uið Þ ¼X
j;k
Δw2 ui; sj; s0k
� �;
ð4Þ
with j and k in a sequence interval I around residue i.We consider as feature F9 the sum ΔW(ui) = ΔW1(ui)+ ΔW2(ui). The values of this feature, for different aminoacids and amino acid pairs, are given in Additional file 2.
Solvent accessibilityAs epitopes are located at the protein surface, an indis-pensable feature is the predicted solvent accessibility.We used two different programs for that purpose. Thefirst is NetSurfP [54] (F10), which not only predicts thesecondary structure but also classifies residues in buried(B) and exposed residues (E). The second (F11) is anenergy-like solvent accessibility predictor that is similarto the epitope/non-epitope predictor described in Eqs(1–4) with the state ui of residue i being exposed (u = E)or buried (u = B). We define a residue to be in the stateE (B) if its solvent accessibility is higher (lower) than 5%.This quite low percentage was chosen to ensure that allepitope residues are exposed [29]. The values of thisfeature, for different amino acids and amino acid pairs,are given in Additional file 3.
SolubilityThe intrinsic solubility of the amino acid residues in asequence is closely related to their propensity of havinga certain solvent accessibility. The solubility per residuewas calculated using the sequence-based version of theCamSol [63] program (F12).
Evolutionary informationIt is a priori not obvious whether epitope residues areequally conserved during evolution than non-epitoperesidues. To analyze this, we evaluated the evolutionaryconservation of the epitope and non-epitope residuesusing the position-specific scoring matrix (PSSM) ob-tained by aligning the target antigen sequence against anon-redundant set of protein sequences with the PSI-BLAST [64] tool. The so obtained conservation valueper residue was used as feature F13.
Feature windowsAs the characteristics of a residue are influenced notonly by the residue itself but also by the neighboringamino acids along the chain, we considered the featuresin a sequence window around the targeted residue topredict the epitope/non-epitope state of the latter. Notethat this effect is already built in the energy-like features.
We considered windows W from 3 to 9-residues centeredon the central residue.
Machine learningWe applied two machine-learning methods to classifyresidues as epitopes or non-epitopes on the basis of the13 features F1-F13. These are the Gaussian Naïve Bayes[65] and Random Forest [66] algorithms. All the param-eters of these classifiers were optimized first; in particu-lar, better performances were achieved using RandomForest with 100 trees. The predictions of these two basicclassifiers were then combined using a voting algorithm,based on averages of the predicted probabilities. Thistechnique tends to balance out the weaknesses ofindividual machine-learning classifiers. We used theimplementation of these techniques in the scikit-learn[67] package.
Imbalanced datasetOne of the difficulties in predicting epitopes is thestrongly imbalanced dataset. Indeed, the number ofepitopes is one order of magnitude smaller than thenumber of non-epitopes. All classifiers that use thisdataset for training tend to predict every residue as non-epitope. We tested several standard techniques to dealwith such imbalanced data. We finally selected a variantof the SMOTE [68] algorithm, i.e. the SVM SMOTEalgorithm [69]. The SMOTE algorithm proceeds byoversampling the minority class by creating synthetic in-stances using a k-nearest-neighbor approach. Similarly,the SVM SMOTE is an oversampling method that uses aSupport Vector Machines (SVM) classifier to create newinstances of the minority class. This approach wasimplemented with the Imbalanced-learn python toolbox[70], which is compatible with scikit-learn. We opti-mized the parameters of the radial basis function kernelin SVM; the parameters achieving the highest scoreswere C = 1 and γ = 0.01.In this way, the size of the original dataset was chan-
ged, leading to roughly the same number of epitope andnon-epitope residues. This procedure was found to besuperior to the common method consisting in dividingthe majority class randomly into N equal parts (N beingequal to the ratio of non-epitopes to epitopes) andcombining each part with the minority class to form Ndistinct learning sets.
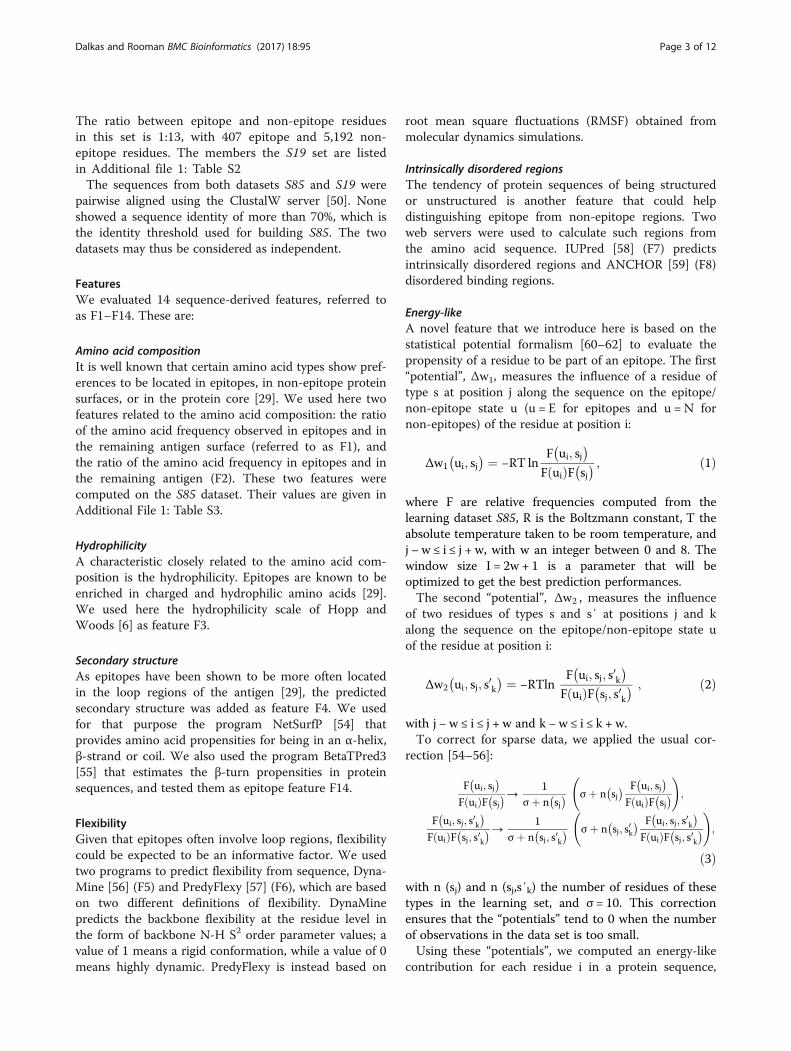
Performance evaluation metricsThe Kolmogorov-Smirnov (KS) statistic [71, 72] is anonparametric test that quantifies a distance (D-value)between the empirical distribution function of twosamples, as shown in Fig. 1. We used it for analyzing, foreach feature, the difference – if any - between the distribu-tions observed for epitope and non-epitope residues.
Dalkas and Rooman BMC Bioinformatics (2017) 18:95 Page 4 of 12
The performance of the prediction models was mea-sured by the area under the receiver operating charac-teristic (ROC) curve (AUC) [73]. This curve is obtained byplotting the true positive rate (TP) against the false posi-tive rate (FP) for various threshold values, and illustratesthe performance of binary classifiers.The prediction performances were evaluated in 10-
fold cross validation on the S85 set, as well as on theindependent test set S19. Note that in the 10-foldcross validation procedure, the dataset was split be-fore applying the SVM SMOTE algorithm (see section“Imbalanced dataset” here above), to avoid introdu-cing similarities between the training and test sets.The different classifiers were applied on the sametraining and test folds.
Results and discussionThe 14 amino acid-based physicochemical, energy-like,evolutionary and statistical features F1-F14 described inMethods were first evaluated separately and then com-bined to build our B-cell epitope predictor SEPIa.Importantly, all the features were calculated on the basisof the sole amino acid sequences of the antigens and donot require any structural information.
Feature analysisWe first analyzed the 14 features separately, and com-pared their capacity to distinguish epitope from non-epitope residues. We used therefore the statistical KS-test,which involves computing the D-value that correspondsto the largest vertical distance between the cumulative
Fig. 1 Cumulative distributions for individual features, with the D-value of the KS test indicated (a) Energy-like solvent accessibility feature F11 forthe sequence interval of size I = 7, with a D-value of 0.185; (b) Feature F2 defined as the ratio of the amino acid frequency in epitopes and in theremaining antigen, with a D-value of 0.177
Dalkas and Rooman BMC Bioinformatics (2017) 18:95 Page 5 of 12

distributions of epitope and non-epitope samples com-puted from the S85 learning set (See Methods and Fig. 1).Another measure that we used for that purpose is basedon the construction of a prediction model using theGaussian Naïve Bayes and Random Forest machine learn-ing algorithms, and combining them using a voting pro-cedure, as explained in Methods. The AUC score of thisprediction model, calculated in 10-fold cross validation onthe S85 set, yields another estimation of the informativepower of the individual features.A novel sequence-based characteristic introduced in
this study in the context of B-cell epitope predictionconsists of the energy-like features ΔW1 (E/N) and ΔW2
(E/N) (Eq. (4)), which compute the influence of singleamino acids and amino acid pairs, respectively, in a se-quence interval of I residues centered around a centralresidue on the epitope/non-epitope state on this centralresidue. To identify the optimal size of I, we first usedthe KS-test. For all tested sizes, ranging for I = 3 to 17,the cumulative distributions of energy values for epitopeand non-epitope residues were found to be significantlydifferent (P-value < 0.0001). The best size, determined asthe one that gives the largest D-value, is I = 3 and I = 7almost ex-aequo for ΔW1, and I = 7 for ΔW2. Testing theinformative value of these features on the basis of the AUCof the prediction model also selects I = 7 as the optimal se-quence interval size. We hence fixed I = 7, and consideredas feature F9 the sum of the two potentials, ΔW (E/N)=ΔW1 (E/N) +ΔW2 (E/N). The cumulative distributionsfor E/N states obtained from this feature are slightly betterseparated than for the individual potentials, with a D-valueof 0.166 and an AUC score of 0.551 (Table 1).Epitope residues are always located near the surface,
and solvent accessibility is thus obviously an importantepitope characteristic. We introduced an energy-likefeature that compiles solvent accessibility propensitiesin much the same way than the energy-like epitope/non-epitope feature analyzed above. In this case thestate of a residue is surface/buried (S/B) rather thanepitope/non-epitope. The optimal sequence interval size I
was evaluated on the basis of the KS D-value and theAUC score of the prediction model. Again, I = 7 appearsas the best compromise, both for the feature ΔW1 (S/B)based on individual amino acid propensities and ΔW2
(S/B) based on pairs of amino acids. The sum of thesetwo potentials, ΔW (S/B) = ΔW1 (S/B) + ΔW2 (S/B)with I = 7 is defined as feature F11, and leads to cumu-lative distributions that are slightly better separatedthan the individual ones, with a D-value of 0.185(Fig. 1), and an AUC score of 0.521 (Table 1).Note that the other energy-like feature F11, which is
based on the preference of amino acids to be at thesurface or buried, distinguishes better epitopes fromnon-epitopes than feature F9, which is based on thepreference of amino acids to be (non-) epitopes. Thisapparent discrepancy is due to the fact that the epitope/non-epitope assignments in the S85 dataset includemore errors than the surface/buried assignments. In-deed, the latter are obtained from the structure and thusare basically error-free. The epitope residues are alsocorrectly assigned, as they are obtained from the struc-tures of the antigen/antibody complexes. In contrast,some of the residues assigned as non-epitopes are prob-ably epitopes in other antigen/antibody complexes. Thisobviously induces noise in the epitope learning dataset.Besides the features F9 and F11, we tested the inform-
ative content of all other features F1-F14. According to theKS-test, the features F1-F13 differ significantly between theepitope and non-epitope samples with P-values < 0.05, andhave higher than random AUC scores (see Table 1). Onlythe β-turn feature F14 did not show a statistically signifi-cant difference between epitope and non-epitope residues.Indeed, the KS-test D-value was found to be equal to 0.028with a P-value of 0.183, and the AUC score is 0.506. Wethus dropped this feature and kept the 13 features F1-F13for building the epitope predictor.The characteristics of a residue are influenced not only
by the residue itself but also by the neighboring residuesalong the chain. They are also influenced by the residuesthat are in spatial contact, but as we restrict ourselves to
Table 1 Prediction performance of the individual features F1-13 and of their combination (F), for all window sizes W = 0-9, estimatedby the AUC score and evaluated by 10-fold cross validation of the S85 set. The features indicate intrinsically disordered regions (F8 andF7), flexibility (F5 and F6), evolutionary information (F13), energy-like (F9), secondary structure (F4), solvent accessibility (F10 and F11),solubility (F12), hydrophilicity (F3), and amino acid composition (F1 and F2)
AUC score for different window sizes W
W F1 F2 F3 F4 F5 F6 F7 F8 F9 F10 F11 F12 F13 F
0 0.586 0.574 0.545 0.561 0.517 0.560 0.523 0.519 0.551 0.516 0.521 0.547 0.532 0.644
3 0.591 0.615 0.576 0.533 0.544 0.579 0.543 0.514 0.569 0.548 0.542 0.585 0.547 0.639
5 0.604 0.597 0.579 0.552 0.542 0.580 0.544 0.511 0.580 0.583 0.575 0.588 0.554 0.635
7 0.600 0.603 0.570 0.558 0.541 0.580 0.545 0.495 0.580 0.590 0.609 0.591 0.548 0.640
9 0.614 0.619 0.593 0.560 0.533 0.579 0.557 0.525 0.553 0.569 0.586 0.570 0.550 0.646
Values in bold correspond to the optimal window sizes for each feature
Dalkas and Rooman BMC Bioinformatics (2017) 18:95 Page 6 of 12

sequence-based features, we cannot consider them. Wetested the information gain obtained with sequencewindows W between 3 to 9 residues. Note that thesewindows are related to the sequence intervals consideredfor the two energy-like features F9 and F11, for whichthe optimal value was I = 7. These intervals are consid-ered in the feature construction, whereas the windowsare used at the level of the prediction. We tested varyingwindow sizes W in designing the predictor for allfeatures including F9 and F11.The results of the AUC scores, computed in 10-fold
cross validation, are given in Table 1 for the differentwindow sizes and the 13 individual features. For 7 out ofthe 13 features, the optimal value is W = 9. We thusselected this window size.The 13 features are ranked as a function of increasing
AUC in Fig. 2 (for W = 9). The best individual featuresare F1, F2 and F3, and are related to the amino acidcomposition. The best one, F2, is equal to the ratio ofamino acid frequencies in epitopes and in the remainingantigen, and reaches an AUC of 0.62. The second best,F1, is the ratio of the amino acid frequency in epitopesand in the remaining antigen surface, and has an AUCof 0.61. The third best feature, F3, is hydrophilicity, withan AUC score of 0.59. The energy-like epitope/non-epi-tope feature F9, which is based on more complexcombinations of amino acid propensities, is slightly lessperforming, with an AUC of 0.55. Note that it is higher(0.58) for W = 5 and 7.The next best features are related to the solvent ac-
cessibility prediction, which is obviously an importantfactor since epitopes are at the protein surface. The bestof these is the energy-like accessibility feature F11, with
an AUC of 0.59, followed by the solvent accessibilityfeature F10, based on NetSurfP predictions, with anAUC of 0.57. The related feature F12, solubility, alsopresents an AUC of 0.57.The flexibility features F5 and F6 also carry some in-
formation. F6, obtained from the RMSF computed frommolecular dynamics simulations, shows an AUC of 0.58,while F5, obtained from backbone N-H S2 order param-eters, is only slightly above random, with an AUC of0.53. This reflects the observations that epitope residuesare usually positioned in flexible regions. Similarly, epi-topes are more often localized in loop regions than inhelices and strands; the predicted secondary structure,feature F4, has an intermediate AUC of 0.56. The relatedfeatures F7 and F8, based on the prediction of intrinsic-ally disordered regions, have AUC values in the samerange: 0.56 and 0.53, respectively.The last feature, F13, which is based on evolutionary
sequence conservation, has a low AUC of 0.55: epitoperegions are slightly less conserved than other regions,but the difference is small.Overall, the analysis of the individual features in-
dicates that all the tested attributes possess a weak tomedium ability of differentiating epitope from non-epitope residues.
SEPIa predictorWe combined the 13 tested features to set up the finalpredictor, called SEPIa. The algorithm used is the sameas for the individual features, a combination of GaussianNaïve Bayes and Random Forest algorithms using avoting procedure (see Methods). Note that even thosefeatures that are only slightly better than random carry
Fig. 2 Prediction performance of the individual features F1-13 and of their combination (F), estimated by the AUC and evaluated by 10-fold crossvalidation of the S85 set, using a sequence window size W = 9. The bold horizontal line indicates the level of random prediction. From least tobest performing: intrinsically disordered regions (F8 and F7), flexibility (F5 and F6), evolutionary information (F13), energy-like (F9), secondarystructure (F4), solvent accessibility (F10 and F11), solubility (F12), hydrophilicity (F3), and amino acid composition (F1 and F2)
Dalkas and Rooman BMC Bioinformatics (2017) 18:95 Page 7 of 12

some information. Indeed, their elimination decreasesthe prediction score.The results obtained in 10-fold cross validation pro-
cedure on the S85 set are given in Table 1 for windowsizes W = 0-9 (column F). The best AUC scores areobtained for W = 9, like for the individual features. Theyreach 0.65, which is small but significant increase withrespect to the individual features. Indeed, the bestfeature, F2, reached only 0.62. The gradual improvementof the overall performance upon sequential addition ofthe features is given in Table 2.Two of the antigens of the S85 training set have
residues that are epitopes in some antigen-antibodycomplexes and non-epitopes in others. As most suchcommon epitopes have been found related to auto-immunity [74], we removed these antigens from the S85set, and trained another model on this restricted set S83(Additional file 1: Table S1). The AUC obtained in 10-fold cross validation is equal to 0.65, and is thus identi-cal to that obtained from the full dataset. We thus choseto keep the SEPIa predictor obtained with the completeS85 training set.We also tested the SEPIa predictor on S19, an inde-
pendent dataset of 19 antigen sequences [42], whoseepitope assignment was made on the basis of experimen-tal (non-structural) data (see Methods), and which ishere used for comparison with other methods (see nextsection). The results on this test set were quite similarto those obtained from S85, as shown in Table 3: thewindow size 9 appears to be the best, and the AUC scorereaches 0.65. The agreement between the results ob-tained from these two independent datasets increasestheir confidence level.
The SEPIa prediction model, obtained with thescikit-learn package, is available as a file SEPIa.zip inAdditional file 4. It needs as input the sequence ofthe target protein, and the 13 features computed on it.
Comparison with other methodsSeveral other B-cell epitope prediction methods havebeen developed, of which a certain number have beentested on the S19 set, while trained on an independentset. These are: Zhangbound and Zhangunbound [45],Zhengbound and Zhengunbound [52], CBTOPE [75],EPCES [76], Epitopia [41], DiscoTope [34], BPredictor[43], SEPPA [39], and EPSVR [42]. The former five usethe amino acid sequence as sole input, whereas the lastsix also use the 3D structure. The AUC scores obtainedby these methods are given in Table 4; they are takenfrom the original articles and from [45].With its AUC score of 0.65, SEPIa appears to slightly
outperform the other methods. The second bestsequence-based method, CBTOPE, has an AUC of 0.61.Note, however, that the S19 dataset is too small for thesescore differences to be statistically significant.Table 2 Increase of the prediction performance upon sequential
addition of features. The window size is W = 9, and the AUC scoreis evaluated in 10-fold cross validation on the S85 dataset
Feature combination AUC score
F1 0.619
F1 + F2 0.624
F1 + F2 + F10 0.629
F1 + F2 + F10 + F11 0.630
F1 + F2 + F10 + F11 + F12 0.631
F1 + F2 + F9 + F10 + F11 + F12 0.631
F1 + F2 + F6 + F9 + F10 + F11 + F12 0.636
F1 + F2 + F3 + F6 + F9 + F10 + F11 + F12 0.636
F1 + F2 + F3 + F6 + F9 + F10 + F11 + F12 + F13 0.637
F1 + F2 + F3 + F6 + F9 + F10 + F11 + F12 + F13 + F7 0.640
F1 + F2 + F3 + F6 + F9 + F10 + F11 + F12 + F13 + F7 + F4 0.644
F1 + F2 + F3 + F6 + F9 + F10 + F11 + F12 + F13 + F7 + F4 + F5 0.644
F1+ F2+ F3+ F6+ F9+ F10+ F11+ F12+ F13+ F7+ F4+ F5+ F8 0.646
The largest AUC score is indicated in bold
Table 3 Prediction performance of the combination of featuresas a function of the window size, estimated by the AUC scoreand evaluated on the S19 test set
Window size AUC score
0 0.643
3 0.639
5 0.635
7 0.640
9 0.646
The best score is indicated in bold
Table 4 The performance of different epitope prediction servers,estimated by the AUC score and evaluated on the S19 test set
Category Method AUC
Sequence- based Ensemblebound [52] 0.579
Zhangbound [45] 0.600
Zhangunbound [45] 0.601
Ensembleunbound [52] 0.604
CBTOPE [74] 0.607
SEPIa 0.646
Structure-based EPCES [75] 0.569
EPITOPIA [41] 0.572
DiscoTope [34] 0.579
BPredictor [43] 0.587
SEPPA [39] 0.589
EPSVR [42] 0.606
The largest score is indicated in bold
Dalkas and Rooman BMC Bioinformatics (2017) 18:95 Page 8 of 12
The structure-based methods do not perform better thanthe sequence-based methods. The best one, EPSVR, has anAUC of 0.61. This can seem surprising, given that consider-ing the 3D structure obviously adds information. However,in this case, the predictors focus on surface residues onlyand classify them into epitope and non-epitope regions.Therefore, the scores of the sequence- and structure-basedpredictors cannot be compared: the former distinguishepitope residues out of all surface and core residues, andthe latter epitope residues out of surface residues only.
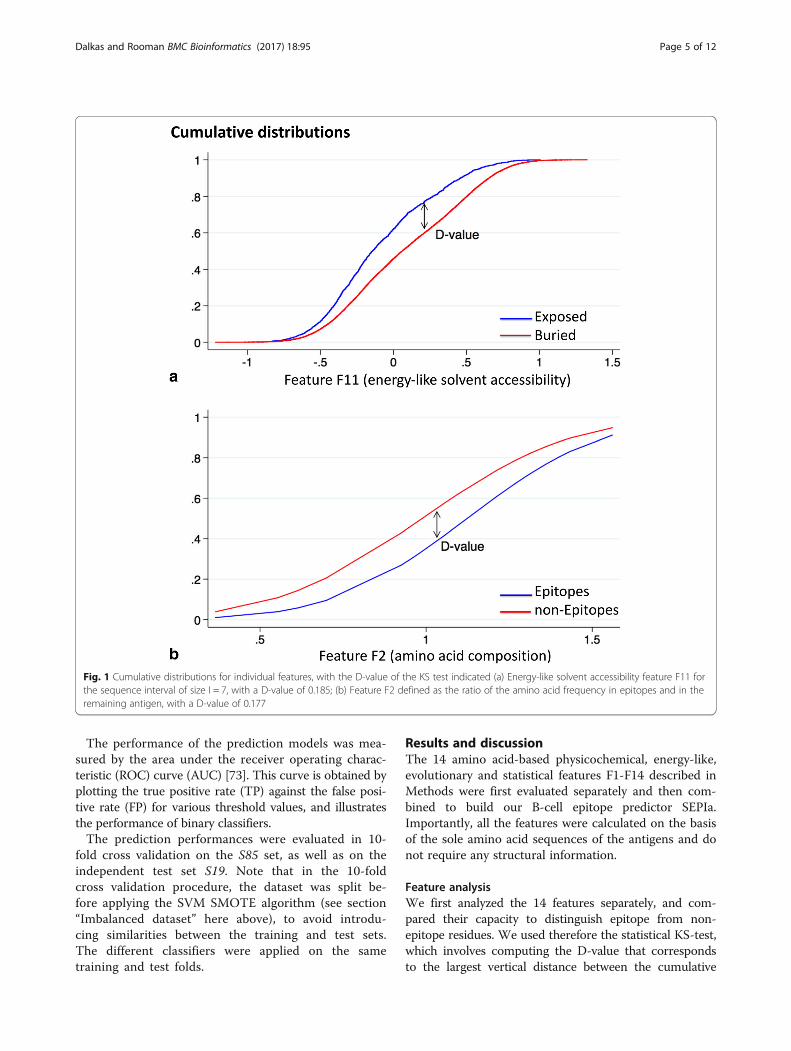
Case studyTo test the performance of the SEPIa predictor, weapplied it on the human β2 adrenergic G-protein-coupled receptor (β2AR), which was co-crystallized withan antigen-binding fragment (Fab) and solved by X-raycrystallography (PDB ID: 2R4R) [77]. Due to its lowresolution of 3.4 Å, it was excluded from the learning setS85. Its sequence identity with the antigens from the S85learning set is below 20%, which makes it a good case
study. Several sequence regions are absent in the X-raystructure: the C-terminus, the three extracellular loopsand the third intracellular loop. Comparative modelingwith the help of the SwissModel [78] server was used tobuild a complete structural model of β2AR, using the2R4R structure as a template. The structure of thecomplex is depicted in Fig. 3.The epitope residues were assigned from the structure
of the antibody-antigen complex as described in Methods.There are 12 epitope residues, depicted in red and blue inFig. 3. The predictions obtained with SEPIa involve 29epitope residues (in green and blue). Only 4 epitopes areboth predicted and observed (blue). Hence, the number ofcorrectly predicted epitopes is TP = 4, of correctly pre-dicted negatives TN= 272, of incorrectly predicted epi-topes FP = 8, and of incorrectly predicted non-epitopes FN= 28. The AUC score on this test protein is equal to 0.77.Although the score is quite low, it is worth looking in
more detail at the predictions shown in Fig. 3. Sixresidues that are incorrectly predicted as epitopes are
Fig. 3 Predicted and observed epitope residues in the human β2AR receptor. The predicted epitope residues are in green, the observed epitopesare in red, and the residues that are both predicted and observed as epitopes are in blue. Above: amino acid sequence, with the modeled loopregions in italic and underlined. Below: structure of β2AR co-crystallized with a Fab fragment, shown as ribbons with predicted and observed epitopesin sticks; β2AR is colored in light purple with modeled regions in light pink, Fab heavy chain in dark gray and Fab light chain in light gray
Dalkas and Rooman BMC Bioinformatics (2017) 18:95 Page 9 of 12
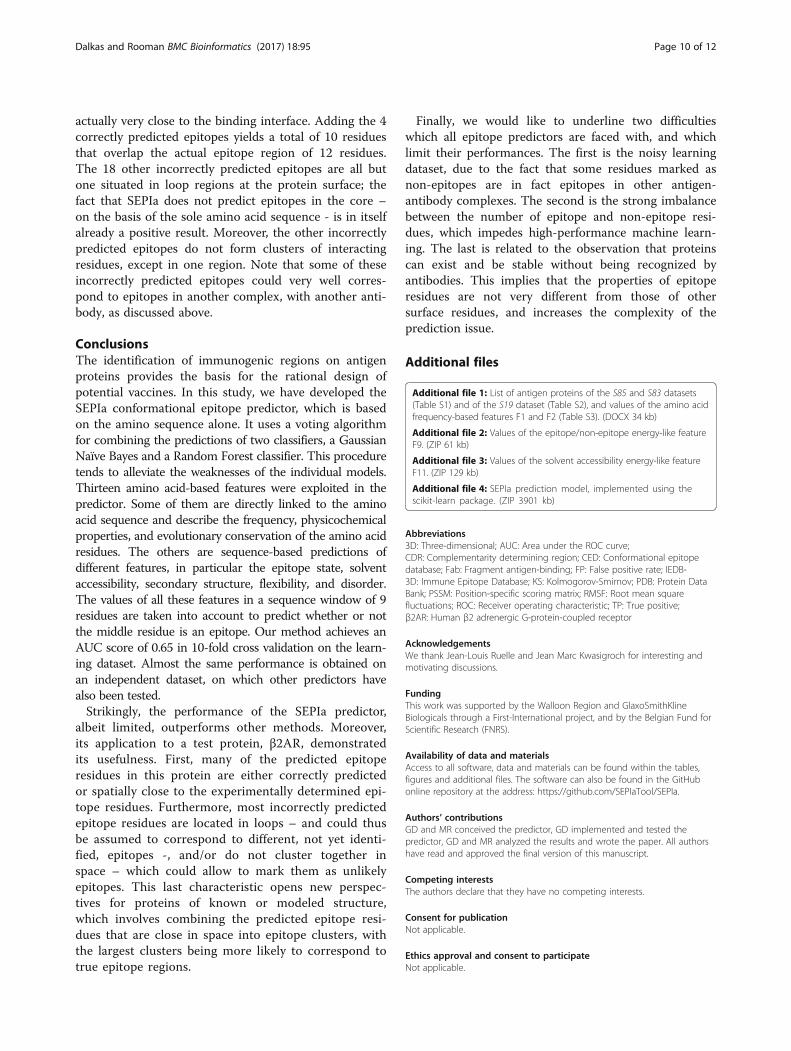
actually very close to the binding interface. Adding the 4correctly predicted epitopes yields a total of 10 residuesthat overlap the actual epitope region of 12 residues.The 18 other incorrectly predicted epitopes are all butone situated in loop regions at the protein surface; thefact that SEPIa does not predict epitopes in the core –on the basis of the sole amino acid sequence - is in itselfalready a positive result. Moreover, the other incorrectlypredicted epitopes do not form clusters of interactingresidues, except in one region. Note that some of theseincorrectly predicted epitopes could very well corres-pond to epitopes in another complex, with another anti-body, as discussed above.
ConclusionsThe identification of immunogenic regions on antigenproteins provides the basis for the rational design ofpotential vaccines. In this study, we have developed theSEPIa conformational epitope predictor, which is basedon the amino sequence alone. It uses a voting algorithmfor combining the predictions of two classifiers, a GaussianNaïve Bayes and a Random Forest classifier. This proceduretends to alleviate the weaknesses of the individual models.Thirteen amino acid-based features were exploited in thepredictor. Some of them are directly linked to the aminoacid sequence and describe the frequency, physicochemicalproperties, and evolutionary conservation of the amino acidresidues. The others are sequence-based predictions ofdifferent features, in particular the epitope state, solventaccessibility, secondary structure, flexibility, and disorder.The values of all these features in a sequence window of 9residues are taken into account to predict whether or notthe middle residue is an epitope. Our method achieves anAUC score of 0.65 in 10-fold cross validation on the learn-ing dataset. Almost the same performance is obtained onan independent dataset, on which other predictors havealso been tested.Strikingly, the performance of the SEPIa predictor,
albeit limited, outperforms other methods. Moreover,its application to a test protein, β2AR, demonstratedits usefulness. First, many of the predicted epitoperesidues in this protein are either correctly predictedor spatially close to the experimentally determined epi-tope residues. Furthermore, most incorrectly predictedepitope residues are located in loops – and could thusbe assumed to correspond to different, not yet identi-fied, epitopes -, and/or do not cluster together inspace – which could allow to mark them as unlikelyepitopes. This last characteristic opens new perspec-tives for proteins of known or modeled structure,which involves combining the predicted epitope resi-dues that are close in space into epitope clusters, withthe largest clusters being more likely to correspond totrue epitope regions.
Finally, we would like to underline two difficultieswhich all epitope predictors are faced with, and whichlimit their performances. The first is the noisy learningdataset, due to the fact that some residues marked asnon-epitopes are in fact epitopes in other antigen-antibody complexes. The second is the strong imbalancebetween the number of epitope and non-epitope resi-dues, which impedes high-performance machine learn-ing. The last is related to the observation that proteinscan exist and be stable without being recognized byantibodies. This implies that the properties of epitoperesidues are not very different from those of othersurface residues, and increases the complexity of theprediction issue.
Additional files
Additional file 1: List of antigen proteins of the S85 and S83 datasets(Table S1) and of the S19 dataset (Table S2), and values of the amino acidfrequency-based features F1 and F2 (Table S3). (DOCX 34 kb)
Additional file 2: Values of the epitope/non-epitope energy-like featureF9. (ZIP 61 kb)
Additional file 3: Values of the solvent accessibility energy-like featureF11. (ZIP 129 kb)
Additional file 4: SEPIa prediction model, implemented using thescikit-learn package. (ZIP 3901 kb)
Abbreviations3D: Three-dimensional; AUC: Area under the ROC curve;CDR: Complementarity determining region; CED: Conformational epitopedatabase; Fab: Fragment antigen-binding; FP: False positive rate; IEDB-3D: Immune Epitope Database; KS: Kolmogorov-Smirnov; PDB: Protein DataBank; PSSM: Position-specific scoring matrix; RMSF: Root mean squarefluctuations; ROC: Receiver operating characteristic; TP: True positive;β2AR: Human β2 adrenergic G-protein-coupled receptor
AcknowledgementsWe thank Jean-Louis Ruelle and Jean Marc Kwasigroch for interesting andmotivating discussions.
FundingThis work was supported by the Walloon Region and GlaxoSmithKlineBiologicals through a First-International project, and by the Belgian Fund forScientific Research (FNRS).
Availability of data and materialsAccess to all software, data and materials can be found within the tables,figures and additional files. The software can also be found in the GitHubonline repository at the address: https://github.com/SEPIaTool/SEPIa.
Authors’ contributionsGD and MR conceived the predictor, GD implemented and tested thepredictor, GD and MR analyzed the results and wrote the paper. All authorshave read and approved the final version of this manuscript.
Competing interestsThe authors declare that they have no competing interests.
Consent for publicationNot applicable.
Ethics approval and consent to participateNot applicable.
Dalkas and Rooman BMC Bioinformatics (2017) 18:95 Page 10 of 12

Author details1BioModeling, BioInformatics & BioProcesses (3BIO), Université Libre deBruxelles (ULB), CP 165/61, 50 Roosevelt Ave, 1050 Brussels, Belgium.2Interuniversity Institute of Bioinformatics in Brussels, ULB-VUB, CP 263,Triumph Bld, 1050 Brussels, Belgium. 3Present address: Institute ofMechanical, Process & Energy Engineering, Heriot-Watt University, EdinburghEH14 4AS, UK.
Received: 20 October 2016 Accepted: 6 February 2017
References1. Irving MB, Pan O, Scott JK. Random-peptide libraries and antigen-fragment
libraries for epitope mapping and the development of vaccines anddiagnostics. Curr Opin Chem Biol. 2001;5:314–24.
2. Regenmortel MHV Van: Epitope Mapping Protocols. 2009, 524. [Methods inMolecular BiologyTM]
3. Gershoni JM, Roitburd-Berman A, Siman-Tov DD, Tarnovitski Freund N,Weiss Y. Epitope Mapping. BioDrugs. 2007;21:145–56.
4. Barlow DJ, Edwards MS, Thornton JM. Continuous and discontinuousprotein antigenic determinants. Nature. 1986;322:747–8.
5. El-Manzalawy Y, Honavar V. Recent advances in B-cell epitope predictionmethods. Immunome Res. 2010;6 Suppl 2:S2.
6. Hopp TP, Woods KR. Prediction of protein antigenic determinants fromamino acid sequences. Proc Natl Acad Sci U S A. 1981;78:3824–8.
7. Parker JM, Guo D, Hodges RS. New hydrophilicity scale derived from high-performance liquid chromatography peptide retention data: correlation ofpredicted surface residues with antigenicity and X-ray-derived accessiblesites. Biochemistry. 1986;25:5425–32.
8. Pellequer JL, Westhof E, Van Regenmortel MHV. Predicting location ofcontinuous epitopes in proteins from their primary structures. In: LangoneJJ, editor, Methods of Enzymology. San Diego: Academic Press; 1991;203:176–201.
9. Emini EA, Hughes JV, Perlow DS, Boger J. Induction of hepatitis Avirus-neutralizing antibody by a virus-specific synthetic peptide.J Virol. 1985;55:836–9.
10. Karplus PA, Schulz GE. Prediction of chain flexibility in proteins.Naturwissenschaften. 1985;72:212–3.
11. Kolaskar AS, Tongaonkar PC. A semi-empirical method for prediction ofantigenic determinants on protein antigens. FEBS Lett. 1990;276:172–4.
12. Welling GW, Weijer WJ, van der Zee R, Welling-Wester S. Prediction ofsequential antigenic regions in proteins. FEBS Lett. 1985;188:215–8.
13. Blythe MJ, Flower DR. Benchmarking B cell epitope prediction:Underperformance of existing methods. Protein Sci. 2005;14:246–8.
14. Larsen JEP, Lund O, Nielsen M. Improved method for predicting linear B-cellepitopes. Immunome Res. 2006;2:2.
15. Saha S, Raghava GPS: Prediction of Continuous B-Cell Epitopes in anAntigen Using Recurrent Neural Network. Bioinformatics 2006, 48(May2005):40–48
16. Chen J, Liu H, Yang J, Chou K-C. Prediction of linear B-cell epitopes usingamino acid pair antigenicity scale. Amino Acids. 2007;33:423–8.
17. El-Manzalawy Y, Dobbs D, Honavar V. Predicting linear B-cell epitopes usingstring kernels. J Mol Recognit JMR. 2008;21:243–55.
18. Wee LJ, Simarmata D, Kam Y-W, Ng LF, Tong JC. SVM-based prediction oflinear B-cell epitopes using Bayes Feature Extraction. BMC Genomics. 2010;11 Suppl 4:S21.
19. Wang Y, Wu W, Negre NN, White KP, Li C, Shah PK. Determinants ofantigenicity and specificity in immune response for protein sequences. BMCBioinformatics. 2011;12:251.
20. Gao J, Faraggi E, Zhou Y, Ruan J, Kurgan L. BEST: improved prediction ofB-cell epitopes from antigen sequences. PLoS One. 2012;7:e40104.
21. Yao B, Zhang L, Liang S, Zhang C. SVMTriP: A Method to Predict AntigenicEpitopes Using Support Vector Machine to Integrate Tri-Peptide Similarityand Propensity. PLoS One. 2012;7:e45152.
22. Sweredoski MJ, Baldi P. COBEpro: a novel system for predicting continuousB-cell epitopes. Protein Eng Des Sel. 2009;22:113–20.
23. Lian Y, Ge M, Pan X-M. EPMLR: sequence-based linear B-cell epitope predictionmethod using multiple linear regression. BMC Bioinformatics. 2014;15:414.
24. Van Regenmortel MH. Mapping Epitope Structure and Activity: FromOne-Dimensional Prediction to Four-Dimensional Description of AntigenicSpecificity. Methods. 1996;9:465–72.
25. Rubinstein ND, Mayrose I, Halperin D, Yekutieli D, Gershoni JM, PupkoT. Computational characterization of B-cell epitopes. Mol Immunol.2008;45:3477–89.
26. Ofran Y, Schlessinger A, Rost B. Automated identification ofcomplementarity determining regions (CDRs) reveals peculiar characteristicsof CDRs and B cell epitopes. J Immunol. 2008;181:6230–5.
27. Sun J, Xu T, Wang S, Li G, Wu D, Cao Z. Does difference exist betweenepitope and non-epitope residues? Analysis of the physicochemical andstructural properties on conformational epitopes from B-cell proteinantigens. Immunome Res. 2011;7:1–11.
28. Kringelum JV, Nielsen M, Padkjær SB, Lund O. Structural analysis of B-cellepitopes in antibody:protein complexes. Mol Immunol. 2013;53:24–34.
29. Dalkas GA, Teheux F, Kwasigroch JM, Rooman M. Cation-π, amino-π, π-π,and H-bond interactions stabilize antigen-antibody interfaces. ProteinsStruct Funct Bioinforma. 2014;82:1734–46.
30. Jones S, Thornton JM. Prediction of protein-protein interaction sites usingpatch analysis. J Mol Biol. 1997;272:133–43.
31. Jones S, Thornton JM. Analysis of protein-protein interaction sites usingsurface patches. J Mol Biol. 1997;272:121–32.
32. Jones S, Thornton J. Principles of protein-protein interactions. Proc NatlAcad Sci. 1996;93:13–20.
33. Lo Conte L, Chothia C, Janin J. The atomic structure of protein-proteinrecognition sites. J Mol Biol. 1999;285:2177–98.
34. Andersen PH, Nielsen M, Lund O. Prediction of residues indiscontinuous B‐cell epitopes using protein 3D structures. Protein Sci.2006;15:2558–67.
35. Sweredoski MJ, Baldi P. PEPITO: improved discontinuous B-cell epitopeprediction using multiple distance thresholds and half sphere exposure.Bioinformatics. 2008;24:1459–60.
36. Ponomarenko J, Bui H-H, Li W, Fusseder N, Bourne PE, Sette A, Peters B.ElliPro: a new structure-based tool for the prediction of antibody epitopes.BMC Bioinformatics. 2008;9:514.
37. Rapberger R, Lukas A, Mayer B. Identification of discontinuous antigenicdeterminants on proteins based on shape complementarities. J MolRecognit. 2007;20:113–21.
38. Ren J, Liu Q, Ellis J, Li J. Tertiary structure-based prediction of conformationalB-cell epitopes through B factors. Bioinformatics. 2014;30:i264–73.
39. Sun J, Wu D, Xu T, Wang X, Xu X, Tao L, Li YX, Cao ZW. SEPPA: acomputational server for spatial epitope prediction of protein antigens.Nucleic Acids Res. 2009;37(2):W612-6.
40. Rubinstein ND, Mayrose I, Pupko T. A machine-learning approach forpredicting B-cell epitopes. Mol Immunol. 2009;46:840–7.
41. Rubinstein ND, Mayrose I, Martz E, Pupko T. Epitopia: a web-server forpredicting B-cell epitopes. BMC Bioinformatics. 2009;10:287.
42. Liang S, Zheng D, Standley DM, Yao B, Zacharias M, Zhang C. EPSVR andEPMeta: prediction of antigenic epitopes using support vector regressionand multiple server results. BMC Bioinformatics. 2010;11:381.
43. Zhang W, Xiong Y, Zhao M, Zou H, Ye X, Liu J. Prediction of conformationalB-cell epitopes from 3D structures by random forest with a distance-basedfeature. BMC Bioinformatics. 2011;12:341.
44. Hu Y-J, Lin S-C, Lin Y-L, Lin K-H, You S-N. A meta-learning approachfor B-cell conformational epitope prediction. BMC Bioinformatics. 2014;15:378.
45. Zhang W, Niu Y, Xiong Y, Zhao M, Yu R, Liu J. Computational prediction ofconformational B-cell epitopes from antigen primary structures byensemble learning. PLoS One. 2012;7:e43575.
46. Habibi M, Bakhshi PK, Aghdam R. LRC: A new algorithm for prediction ofconformational B-cell epitopes using statistical approach and clusteringmethod. J Immunol Methods. 2015;427:51–7.
47. Ren J, Liu Q, Ellis J, Li J. Positive-unlabeled learning for the predictionof conformational B-cell epitopes. BMC Bioinformatics. 2015;16 Suppl18:S12.
48. Kittler J, Hatef M. On combining classifiers. IEEE Trans Pattern Anal MachIntell. 1998;20:226–39.
49. Ponomarenko J, Papangelopoulos N, Zajonc DM, Peters B, Sette A, BournePE. IEDB-3D: structural data within the immune epitope database. NucleicAcids Res. 2011;39(Database issue):D1164–70.
50. Thompson JD, Higgins DG, Gibson TJ. CLUSTAL W: improving the sensitivityof progressive multiple sequence alignment through sequence weighting,position-specific gap penalties and weight matrix choice. Nucleic Acids Res.1994;22:4673–80.
Dalkas and Rooman BMC Bioinformatics (2017) 18:95 Page 11 of 12

51. Berman HM, Westbrook J, Feng Z, Gilliland G, Bhat TN, Weissig H, ShindyalovIN, Bourne PE. The Protein Data Bank. Nucleic Acids Res. 2000;28:235–42.
52. Zheng W, Zhang C, Hanlon M, Ruan J, Gao J. An ensemble method forprediction of conformational B-cell epitopes from antigen sequences.Comput Biol Chem. 2014;49:51–8.
53. Huang J, Honda W. CED: a conformational epitope database. BMCImmunol. 2006;7:7.
54. Petersen B, Petersen TN, Andersen P, Nielsen M, Lundegaard C. A genericmethod for assignment of reliability scores applied to solvent accessibilitypredictions. BMC Struct Biol. 2009;9:51.
55. Singh H, Singh S, Raghava GPS. In silico platform for predicting andinitiating β-turns in a protein at desired locations. Proteins. 2015;83:910–21.
56. Cilia E, Pancsa R, Tompa P, Lenaerts T, Vranken WF: The DynaMinewebserver: predicting protein dynamics from sequence. Nucleic Acids Res2014:gku270-.
57. de Brevern AG, Bornot A, Craveur P, Etchebest C, Gelly J-C. PredyFlexy:flexibility and local structure prediction from sequence. Nucleic Acids Res.2012;40(Web Server issue):W317–22.
58. Dosztányi Z, Csizmok V, Tompa P, Simon I. IUPred: web server for theprediction of intrinsically unstructured regions of proteins based onestimated energy content. Bioinformatics. 2005;21:3433–4.
59. Dosztányi Z, Mészáros B, Simon I. ANCHOR: web server for predicting proteinbinding regions in disordered proteins. Bioinformatics. 2009;25:2745–6.
60. Dehouck Y, Gilis D, Rooman M. A new generation of statistical potentials forproteins. Biophys J. 2006;90:4010–7.
61. Sippl MJ. Calculation of conformational ensembles from potentials of meanforce. An approach to the knowledge-based prediction of local structures inglobular proteins. J Mol Biol. 1990;213:859–83.
62. Rooman MJ, Kocher JP, Wodak SJ. Prediction of protein backboneconformation based on seven structure assignments. Influence of localinteractions. J Mol Biol. 1991;221:961–79.
63. Sormanni P, Aprile FA, Vendruscolo M. The CamSol method of rational designof protein mutants with enhanced solubility. J Mol Biol. 2015;427:478–90.
64. Altschul S. Gapped BLAST and PSI-BLAST: a new generation of proteindatabase search programs. Nucleic Acids Res. 1997;25:3389–402.
65. Kuncheva LI. On the optimality of Naïve Bayes with dependent binaryfeatures. Pattern Recognit Lett. 2006;27:830–7.
66. Breiman L. Random Forests. Mach Learn. 2001;45:5–32.67. Pedregosa F, Varoquaux G, Gramfort A, Michel V, Thirion B, Grisel O, Blondel
M, Prettenhofer P, Weiss R, Dubourg V, Vanderplas J, Passos A, CournapeauD, Brucher M, Perrot M, Duchesnay E. Scikit-learn: Machine Learning inPython. J Mach Learn Res. 2011;12:2825–30.
68. Chawla NV, Bowyer KW, Hall LO, Kegelmeyer WP. SMOTE: Synthetic MinorityOver-sampling Technique. J Artif Intell Res. 2002;16:321–57.
69. Nguyen HM, Cooper EW, Kamei K. Borderline over-sampling for imbalanceddata classification. Int J Knowl Eng Soft Data Paradig. 2011;3:4.
70. Lemaitre G, Nogueira F, Aridas CK: Imbalanced-learn: A Python Toolbox toTackle the Curse of Imbalanced Datasets in Machine Learning. CoRR 2016,abs/1609.0.
71. Smirnov NV. Estimate of deviation between empirical distribution functionsin two independent samples. Bull Moscow Univ. 1933;2:3–16.
72. Kolmogorov AN. Sulla determinazione empirica di una legge didistribuzione. G dell’ Ist Ital degli Attuari. 1933;4:83–91.
73. Swets JA. ROC analysis applied to the evaluation of medical imagingtechniques. Invest Radiol. 1979;14:109–21.
74. Singh H, Ansari HR, Raghava GPS. Improved method for linear B-cell epitopeprediction using antigen’s primary sequence. PLoS One. 2013;8:e62216.
75. Ansari HR, Raghava GP. Identification of conformational B-cell Epitopes in anantigen from its primary sequence. Immunome Res. 2010;6:6.
76. Liang S, Zheng D, Zhang C, Zacharias M. Prediction of antigenic epitopeson protein surfaces by consensus scoring. BMC Bioinformatics. 2009;10:302.
77. Rasmussen SGF, Choi H-J, Rosenbaum DM, Kobilka TS, Thian FS, EdwardsPC, Burghammer M, Ratnala VRP, Sanishvili R, Fischetti RF, Schertler GFX,Weis WI, Kobilka BK. Crystal structure of the human beta2 adrenergicG-protein-coupled receptor. Nature. 2007;450:383–7.
78. Biasini M, Bienert S, Waterhouse A, Arnold K, Studer G, Schmidt T, Kiefer F,Gallo Cassarino T, Bertoni M, Bordoli L, Schwede T. SWISS-MODEL:modelling protein tertiary and quaternary structure using evolutionaryinformation. Nucleic Acids Res. 2014;42(Web Server issue):W252–8.
• We accept pre-submission inquiries
• Our selector tool helps you to find the most relevant journal
• We provide round the clock customer support
• Convenient online submission
• Thorough peer review
• Inclusion in PubMed and all major indexing services
• Maximum visibility for your research
Submit your manuscript atwww.biomedcentral.com/submit
Submit your next manuscript to BioMed Central and we will help you at every step:
Dalkas and Rooman BMC Bioinformatics (2017) 18:95 Page 12 of 12