Printing 3D lithium-ion microbattery using stereolithography
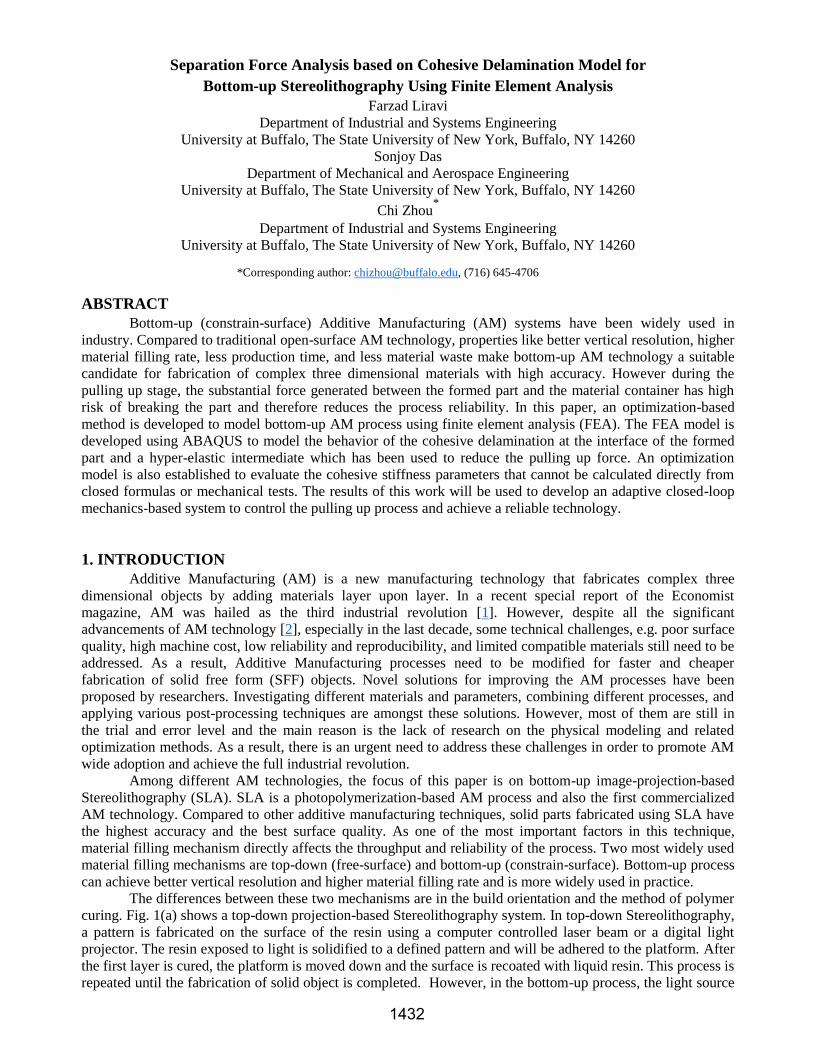
Separation Force Analysis based on Cohesive Delamination Model for
Bottom-up Stereolithography Using Finite Element Analysis
Farzad Liravi Department of Industrial and Systems Engineering
University at Buffalo, The State University of New York, Buffalo, NY 14260
Sonjoy Das
Department of Mechanical and Aerospace Engineering University at Buffalo, The State University of New York, Buffalo, NY 14260
Chi Zhou*
Department of Industrial and Systems Engineering University at Buffalo, The State University of New York, Buffalo, NY 14260
*Corresponding author: [email protected], (716) 645-4706
ABSTRACT
Bottom-up (constrain-surface) Additive Manufacturing (AM) systems have been widely used in
industry. Compared to traditional open-surface AM technology, properties like better vertical resolution, higher
material filling rate, less production time, and less material waste make bottom-up AM technology a suitable
candidate for fabrication of complex three dimensional materials with high accuracy. However during the
pulling up stage, the substantial force generated between the formed part and the material container has high
risk of breaking the part and therefore reduces the process reliability. In this paper, an optimization-based
method is developed to model bottom-up AM process using finite element analysis (FEA). The FEA model is
developed using ABAQUS to model the behavior of the cohesive delamination at the interface of the formed
part and a hyper-elastic intermediate which has been used to reduce the pulling up force. An optimization
model is also established to evaluate the cohesive stiffness parameters that cannot be calculated directly from
closed formulas or mechanical tests. The results of this work will be used to develop an adaptive closed-loop
mechanics-based system to control the pulling up process and achieve a reliable technology.
1. INTRODUCTION Additive Manufacturing (AM) is a new manufacturing technology that fabricates complex three
dimensional objects by adding materials layer upon layer. In a recent special report of the Economist
magazine, AM was hailed as the third industrial revolution [1]. However, despite all the significant
advancements of AM technology [2], especially in the last decade, some technical challenges, e.g. poor surface
quality, high machine cost, low reliability and reproducibility, and limited compatible materials still need to be
addressed. As a result, Additive Manufacturing processes need to be modified for faster and cheaper
fabrication of solid free form (SFF) objects. Novel solutions for improving the AM processes have been
proposed by researchers. Investigating different materials and parameters, combining different processes, and
applying various post-processing techniques are amongst these solutions. However, most of them are still in
the trial and error level and the main reason is the lack of research on the physical modeling and related
optimization methods. As a result, there is an urgent need to address these challenges in order to promote AM
wide adoption and achieve the full industrial revolution.
Among different AM technologies, the focus of this paper is on bottom-up image-projection-based
Stereolithography (SLA). SLA is a photopolymerization-based AM process and also the first commercialized
AM technology. Compared to other additive manufacturing techniques, solid parts fabricated using SLA have
the highest accuracy and the best surface quality. As one of the most important factors in this technique,
material filling mechanism directly affects the throughput and reliability of the process. Two most widely used
material filling mechanisms are top-down (free-surface) and bottom-up (constrain-surface). Bottom-up process
can achieve better vertical resolution and higher material filling rate and is more widely used in practice.
The differences between these two mechanisms are in the build orientation and the method of polymer
curing. Fig. 1(a) shows a top-down projection-based Stereolithography system. In top-down Stereolithography,
a pattern is fabricated on the surface of the resin using a computer controlled laser beam or a digital light
projector. The resin exposed to light is solidified to a defined pattern and will be adhered to the platform. After
the first layer is cured, the platform is moved down and the surface is recoated with liquid resin. This process is
repeated until the fabrication of solid object is completed. However, in the bottom-up process, the light source
1432
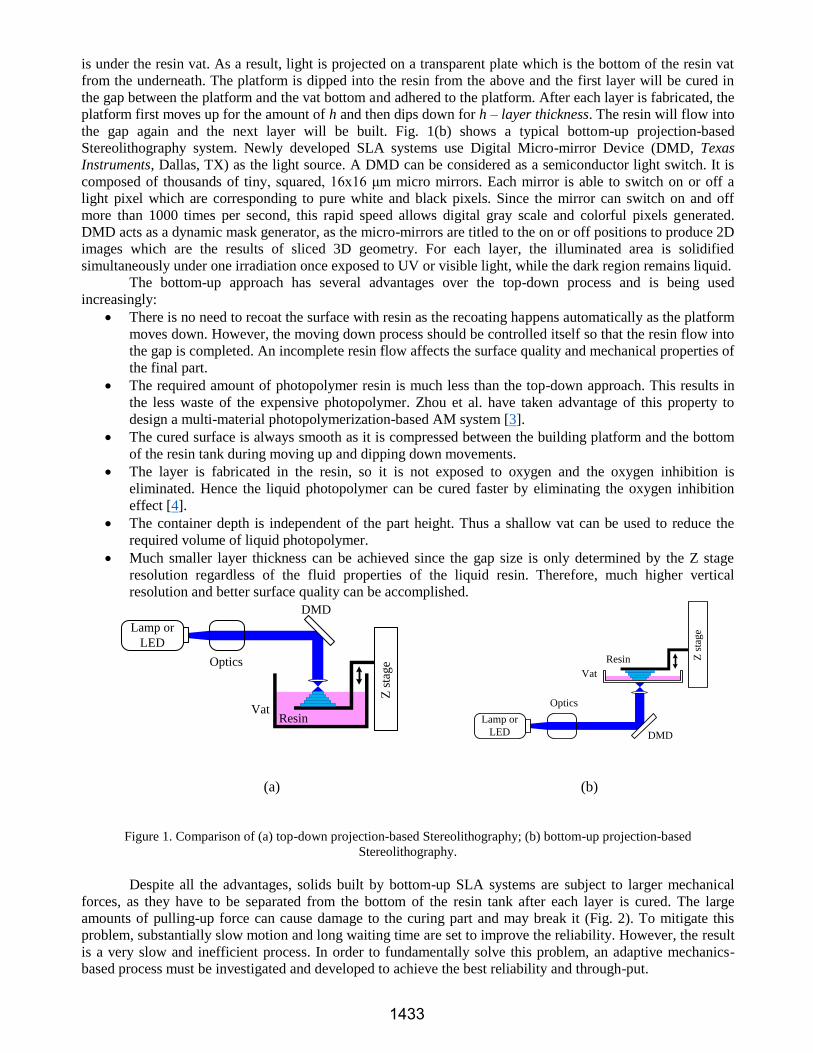
is under the resin vat. As a result, light is projected on a transparent plate which is the bottom of the resin vat
from the underneath. The platform is dipped into the resin from the above and the first layer will be cured in
the gap between the platform and the vat bottom and adhered to the platform. After each layer is fabricated, the
platform first moves up for the amount of h and then dips down for h – layer thickness. The resin will flow into
the gap again and the next layer will be built. Fig. 1(b) shows a typical bottom-up projection-based
Stereolithography system. Newly developed SLA systems use Digital Micro-mirror Device (DMD, Texas
Instruments, Dallas, TX) as the light source. A DMD can be considered as a semiconductor light switch. It is
composed of thousands of tiny, squared, 16x16 μm micro mirrors. Each mirror is able to switch on or off a
light pixel which are corresponding to pure white and black pixels. Since the mirror can switch on and off
more than 1000 times per second, this rapid speed allows digital gray scale and colorful pixels generated.
DMD acts as a dynamic mask generator, as the micro-mirrors are titled to the on or off positions to produce 2D
images which are the results of sliced 3D geometry. For each layer, the illuminated area is solidified
simultaneously under one irradiation once exposed to UV or visible light, while the dark region remains liquid.
The bottom-up approach has several advantages over the top-down process and is being used
increasingly:
There is no need to recoat the surface with resin as the recoating happens automatically as the platform
moves down. However, the moving down process should be controlled itself so that the resin flow into
the gap is completed. An incomplete resin flow affects the surface quality and mechanical properties of
the final part.
The required amount of photopolymer resin is much less than the top-down approach. This results in
the less waste of the expensive photopolymer. Zhou et al. have taken advantage of this property to
design a multi-material photopolymerization-based AM system [3].
The cured surface is always smooth as it is compressed between the building platform and the bottom
of the resin tank during moving up and dipping down movements.
The layer is fabricated in the resin, so it is not exposed to oxygen and the oxygen inhibition is
eliminated. Hence the liquid photopolymer can be cured faster by eliminating the oxygen inhibition
effect [4].
The container depth is independent of the part height. Thus a shallow vat can be used to reduce the
required volume of liquid photopolymer.
Much smaller layer thickness can be achieved since the gap size is only determined by the Z stage
resolution regardless of the fluid properties of the liquid resin. Therefore, much higher vertical
resolution and better surface quality can be accomplished.
Lamp or
LED
Optics
DMD
Z s
tage
VatResin
Lamp or
LED
Optics
DMD
Z s
tag
e
Vat
Resin
(a)
(b)
Figure 1. Comparison of (a) top-down projection-based Stereolithography; (b) bottom-up projection-based
Stereolithography.
Despite all the advantages, solids built by bottom-up SLA systems are subject to larger mechanical
forces, as they have to be separated from the bottom of the resin tank after each layer is cured. The large
amounts of pulling-up force can cause damage to the curing part and may break it (Fig. 2). To mitigate this
problem, substantially slow motion and long waiting time are set to improve the reliability. However, the result
is a very slow and inefficient process. In order to fundamentally solve this problem, an adaptive mechanics-
based process must be investigated and developed to achieve the best reliability and through-put.
1433

The objective of this research work is to systematically study the fundamental principles and
mechanism of the separation and accordingly present a predictive methodology and in-situ feedback control
system to substantially improve the through-put and reliability of the bottom-up projection-based additive
manufacturing process. In this paper, the cohesive interface between the built parts (e.g. solidified
photopolymer) and the media (e.g. Silicone film) is modeled by having resource to mechanical-based interface
concept, Cohesive Zone Model (CZM) to accurately account for the effects of the separation mechanism. In
addition, finite element methods will be used to investigate the relation between motion profile and the crack
initialization and propagation during the separation process.
Figure 2. The failure in production of a hearing aid via bottom-up
Stereolithography due to excessive pulling-up force.
An optimization-based method is also presented for evaluation of the mechanical parameters
associated with the cohesive behavior. These parameters known as cohesive stiffness parameters cannot be
calculated directly from closed formulas or mechanical tests. The outcome of the proposed research can also
advance the knowledge and understanding of the material filling mechanism since it will be rigorously founded
on the concepts of the solid mechanics and fracture mechanics.
The separation between the cured part and the base media during the pulling-up process is dynamically
shown in Fig. 3 (a~d). The cured layer is sandwiched between the previously built layer and the top surface of
the media as shown in Fig. 3(a). As the part moves up with the platform, the media begins to deform and
separation (crack) begins to initiate at the boundary area of the interface as shown in Fig. 3(b). In Fig. 3(c), the
separation propagates into interior area while the platform continues moving up. The separation is completed
after the platform moves enough distance, as shown in Fig. 3(d).
Figure 3. The separation process in bottom-up SLA; (a) layer is cured and sandwiched between the previous layers and the
vat bottom; (b) crack is initiated at the interface of layer and vat bottom; (c) crack is propagated as the platform moves up;
(d) the complete delamination happens.
During the pulling-up stage, the cured layer might not levitate together with the above layers and stay
on the bottom of the resin tank. As a result, the part will break and should be fabricated from the beginning.
One approach to conquer the attachment force is to increase the exposure to significantly over-cure the current
layer such that its bonding force with previous layer can be increased. However, at the same time, the bonding
force with the vat surface is also increased. Furthermore, over-curing can lead to poor surface quality and
inaccurate dimensions. Another approach to address this problem is to apply a certain type of coating to the
resin vat so that the attachment force of a cured layer will be reduced. Suitable coatings including Teflon and
Silicone films can help the separation of the part from the vat [3, 5]. Denken and EnvisionTec have used a
coated Teflon glass as a media. Denken Co. has developed DLP system which works based on bottom-up
Stereolithography. DLP system uses two solutions to break the vacuum between the curing layer and vat
bottom. First, using a coated Teflon glass as the resin tank and second, scanning the surface of the layer in a
large scanning pitch that will have partial cured resin between scanning lines. The partially cured resins will
1434

produce elastic and shear strength properties that ease breaking the vacuum at the interface of the cured layer
and the resin vat. The Teflon also makes the separation easier. However, using both these solutions, still the
required pulling force is very big and may damage the cured part [6]. Another bottom-up system was
developed by Autostrade [7]. The performance of this system called EDARTS is similar to DLP. However,
instead of Teflon, a layer of silicone film has been used as an intermediate between the part and the resin vat.
The silicone-film is a hyper-elastic material that provides both suitable mechanical properties, e.g. shear
strength, and the separation ability. In addition to suitable properties, using silicone film eliminates the need for
large scanning pitch, as a result, we have used a type of silicone film called Polydimethylsiloxane (PDMS,
Sylgard 184, Dow Corning Co.) in this research work.
Huang and Jiang investigated the attachment force of the coating of an elastic silicone film and
developed a direct mask curing system that uses silicone film to separate the curing part easily as the platform
moves up [5].They proposed the degree of cure and the area of cure as influential factors on pulling force. The
reason is that after the solidification of a layer, the gap between the silicone film and the cured part becomes
vacuum state, so a pulling force occurs when the platform is moving up. They have also designed a
measurement system to analyze the pulling force. They utilized a load cell which is connected to both the
platform and elevator of z-axis. A computer collects the real voltage as the platform moves up and an
experiment was conducted by them to find the relationship of real pulling force and the voltage value.
EnvisionTec developed another approach in its Perfactory Systems to reduce the large attachment
force. They incorporated additional mechanisms to add tilting motions in the part separation, i.e. one side of
the platform can be moved up slowly before the other side during the separation. As a result, the part can be
peeled off from the vat surface instead of being pulled up and the detaching force will be significantly reduced.
However, this method can only work for the cases where the parts are located close to the tilting side. The
proposed method may fail if the parts are large or they are located close to the pivot axis. The additional tilting
motion will also increase the fabrication time. The result of their work shows that using other approaches for
detaching the part from the resin vat rather than the direct pulling up in normal direction may decrease the
amount of detachment forces. A two-channel system [3] and a two-way linear motion system [8] have been
proposed based on this fact and have significantly reduced the separation force between the cured later and the
resin vat.
The two-channel system introduced by Zhou et al. [3] was utilized by an open-source personal 3D
printer (B9 Creator). They first came up with a new measure system to investigate the pulling-up force. In their
measurement system, two flexible sensors (Tekscan, South Boston, MA) with a range of 0-25 lbs are
sandwiched between the fixture and vat. Since the vat is free at the bottom and the side, and only fixed at the
top, the pulling force by the part will be transferred to the sensors when the platform levels up. The two sensors
are connected to a microcontroller, which can sample and record the sensor readout in over 50 Hz. They
ignored the first 25 layers and began to record the separation force after that. They designed experiments to
investigate the effects of three important factors on the separation force: (1) exposure time; (2) image area; (3)
image shape. The result of their work shows that the image shape has some effects on the peak force but not as
significant as the exposure time and the projection area. Their work also showed that even using coated PDMS
film on the vat, the separation force is still considerably large (~100 oz or 27.8 N for an image area of 625 mm2
with 1 second exposure). It also authenticates the necessity of designing a more solid on-line monitoring
system. Having an efficient measurement system, Zhou et al. introduced the two-channel design and used
PDMS silicone film as an intermediate. They introduced a photolithography-based micro-fluid technique for
continuously fabricating polymeric particles. The developed technique is based on the oxygen-aided inhibition
near the PDMS surfaces to form chain-terminating peroxide radicals. As a result, a very thin oxygen inhibition
layer will be formed that can prevent cured layer attach to the PDMS film. The oxygen-aided inhibition around
the PDMS surface leaves a non-polymerized lubricating layer. Hence, the cured layer can easily slide on the
PDMS surface. Based on this property, they apply a transparent PDMS film on half of the bottom surface of a
transparent glass vat dividing it into two channels: with and without PDMS coating. A mask image will be only
exposed on the channel with PDMS. After a layer is cured, the vat will be translated in x-axis such that the part
will be moved to the channel without PDMS and the vacuum will be broken. Hence, if the PDMS film is thick
enough (> 0.5 mm), the part can be easily separated from the vat. After moving up the part by a certain
distance d, the vat is moved back such that the part is on top of the channel with PDMS. Finally the platform
will move down by a distance of d – layer thickness. They repeated the calculation of the pulling-up force
using the same measurement system with a small modification so it can measure the shearing force. The results
show that the peak separation forces are relatively small (around 2-4 oz or ~ 0.83 N) which are only 4-5% of
the related ones observed in the conventional one-channel system. However, Two-channel system and systems
1435

similar to it reduce the amount of pulling force, they require two extra motions in x-direction which will
dramatically slow down the building speed. In addition half of the resin vat remains unused resulting in
material and space waste.
To remove the extra motion for tilting and sliding, the direct pulling approach is used by EnvisionTec
in its Ultra2 and Micro Printer Systems. The common strategy used to conquer the large separation force is to
move the platform up very slowly and allow the separation to be successfully initiated and then propagated.
However, this strategy cannot be reliably applied to more intricate parts with multi-scale features. Furthermore,
the slow moving speed reduces the building speed. Attributed to high accuracy and fast speed, bottom-up
projection-based additive manufacturing process is widely used in mass customization applications e.g.
medical (Siemens Inc.) and dental area (Invisalign Inc.). However, the drawbacks and challenges associated
with this process hinder the further development of this technology. As a result, there is an urgent need to
attack these challenges in order to more efficiently and effectively promote its wide adoption to various
industries. 2. MODELING COHESIVE DELAMINATION
Different methods have been used for the simulation of delamination using Finite Element Analysis.
Virtual Crack Closure Technique (VCCT) and Cohesive Zone Model (CZM) are the most popular methods
used for this purpose.
In VCCT, the assumption is that the energy release during delamination is equal to the work required
to close the crack back to its original position [9]. This technique has been provided in ABAQUS packages and
can be used in ABAQUS/Standard to analyze brittle interfacial crack propagation due to delamination or
debonding. It is a post-processing and remeshing technique that provides progressive crack growth between
bonded surfaces based on the fracture toughness of the bond and the strain energy release rate at the crack tip.
However, VCCT is a powerful technique for modeling delamination and computing strain energy release rate
(SERR), but it has some disadvantages that make it hard to use in our case. It is useful for sharp cracks and
linear elastic materials, but in reality neither sharp crack nor linear elastic materials exist. This model also
requires calculation of fracture parameters, e.g. stress intensity factors or SERR which require nodal variable
and topological information from the nodes ahead and behind the crack front. These calculations can be really
tedious for the cases in which the crack propagation is involved [10].
Cohesive Zone Model (CZM) properties, however, make it a suitable candidate for our purpose. CZM
has been extensively used for simulation of delamination [11-19]. The assumption in this methodology is that a
cohesive damage zone develops near the crack top. This delamination modeling method links the
microstructural failure mechanism to the continuum fields governing bulk deformations. Thus, it is
characterized by the properties of bulk materials, the crack initiation, and the crack evolution function [10].
Cohesive damage zone model relates cohesive surface traction to displacement or separation at the interface
where a crack may occur which is called traction-separation model. CZM can be modeled in ABAQUS in two
ways: (1) cohesive elements method; (2) surface-based cohesive behavior. The surface-based cohesive
behavior is primarily intended for situations where the thickness is negligibly small. In our case, the thickness
of the cohesive layer is zero, therefore the surface-based cohesive model can be used to best characterize the
bonding property of the intermediate material. Both of these methods follow traction-separation model. Figure
4 shows a bilinear traction-separation model. This model assumes initially a linear elastic behavior and after
that the delamination progresses by initiation and evolution of damage. The elastic-constitutive matrix relating
normal and shear stresses to the normal and shear separations across the interface is shown in Eq. 1.
Where K is the stiffness parameters matrix and t is the nominal traction stress vector which consists of
three components (two components in two dimensional problems): tn, ts, tt, which represent the normal and two
shear tractions, respectively. The corresponding separations are denoted by δn, δs, and δt. In our case, the only
values that matter are the ones in the normal direction, because our object is only moving in the normal
direction. Thus, our model can be considered a pure mode I delamination.
(1)
1436
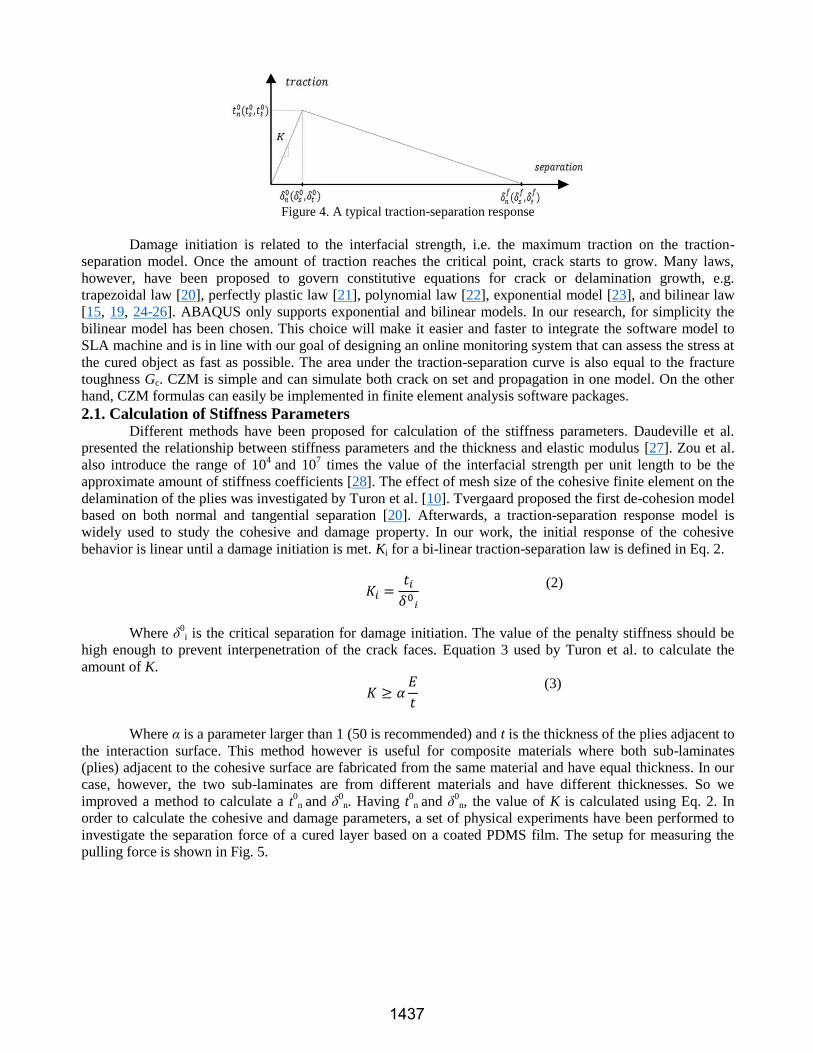
Figure 4. A typical traction-separation response
Damage initiation is related to the interfacial strength, i.e. the maximum traction on the traction-
separation model. Once the amount of traction reaches the critical point, crack starts to grow. Many laws,
however, have been proposed to govern constitutive equations for crack or delamination growth, e.g.
trapezoidal law [20], perfectly plastic law [21], polynomial law [22], exponential model [23], and bilinear law
[15, 19, 24-26]. ABAQUS only supports exponential and bilinear models. In our research, for simplicity the
bilinear model has been chosen. This choice will make it easier and faster to integrate the software model to
SLA machine and is in line with our goal of designing an online monitoring system that can assess the stress at
the cured object as fast as possible. The area under the traction-separation curve is also equal to the fracture
toughness Gc. CZM is simple and can simulate both crack on set and propagation in one model. On the other
hand, CZM formulas can easily be implemented in finite element analysis software packages.
2.1. Calculation of Stiffness Parameters Different methods have been proposed for calculation of the stiffness parameters. Daudeville et al.
presented the relationship between stiffness parameters and the thickness and elastic modulus [27]. Zou et al.
also introduce the range of 104
and 107 times the value of the interfacial strength per unit length to be the
approximate amount of stiffness coefficients [28]. The effect of mesh size of the cohesive finite element on the
delamination of the plies was investigated by Turon et al. [10]. Tvergaard proposed the first de-cohesion model
based on both normal and tangential separation [20]. Afterwards, a traction-separation response model is
widely used to study the cohesive and damage property. In our work, the initial response of the cohesive
behavior is linear until a damage initiation is met. Ki for a bi-linear traction-separation law is defined in Eq. 2.
Where δ0i is the critical separation for damage initiation. The value of the penalty stiffness should be
high enough to prevent interpenetration of the crack faces. Equation 3 used by Turon et al. to calculate the
amount of K.
Where α is a parameter larger than 1 (50 is recommended) and t is the thickness of the plies adjacent to
the interaction surface. This method however is useful for composite materials where both sub-laminates
(plies) adjacent to the cohesive surface are fabricated from the same material and have equal thickness. In our
case, however, the two sub-laminates are from different materials and have different thicknesses. So we
improved a method to calculate a t0n and δ
0n. Having t
0n and δ
0n, the value of K is calculated using Eq. 2. In
order to calculate the cohesive and damage parameters, a set of physical experiments have been performed to
investigate the separation force of a cured layer based on a coated PDMS film. The setup for measuring the
pulling force is shown in Fig. 5.
(2)
(3)
1437

Figure 5. Experimental setup for studying the part separation forces
Two FlexiForce sensors (Tekscan, South Boston, MA) with a range of 0-25 lbs are sandwiched
between the fixture and the vat. Since the vat is free at the bottom and the side, and only fixed at the top, the
pulling force by the part will be transferred to the sensors when the platform rises. The two sensors are
connected to a microcontroller, which can record the sensors’ readouts at over 3 KHz. In the experiments, we
first use a given mask image to build a certain number of layers (e.g. 25 layers). We then begin to record the
separation force in the building process of the next few layers. For each layer, after the designed mask image
has been exposed for a certain time, the platform is raised up slowly at 0.6 mm/sec and the readouts of the two
sensors are then recorded. Different image patterns with the same area are designed. Figure 6 shows the
measured separation forces of a sensor for different patterns. The horizontal axis indicates the distance in the z-
direction (in the unit of 10 µm), and the vertical axis indicates the recorded pulling force (in ounce).
The area of the test pattern is 625 mm2. As can be seen from Fig. 6, for a shape with a cross section of
square, the damage initiation starts at δ0n = 0.4 mm which is associated with the peak force of 80 oz. (22.24 N).
Therefore, the amount of stress when damage is initiated is t0
n = 22.24(N) / 625(mm2) = 0.036 (MPa), and the
stiffness parameter is K = 0.036(N/mm2) / 0.4(mm) = 0.09 (MPa).
×10µm
Figure 6. Pull force – Position plot for bottom-up SLA
(Courtesy of Zhou et al.)
2.2. Calculation of Damage Parameters Damage modeling is used to simulate the degradation and eventual failure of the bond between the two
cohesive surfaces. It consists of two parts: (1) damage initiation; (2) damage evolution. Damage initiation starts
when the traction meets a criterion, and the damage evolution is controlled by either a linear or exponential
behavior in ABAQUS.
2.2.1 Damage initiation criterion. A quadratic traction criterion has been chosen to define the damage
initiation. In our model, damage is initiated when a quadratic traction function involving the contact stress
1438
ratios reach the value of one.
According to the experiment that was described in section 2.1, the damage criterion is t0
n = 0.036 MPa.
2.2.2 Damage evolution. Benzeggah et al. have evaluated the initiation of cracking and delamination growth in
a unidirectional glass/epoxy composite under mode I, mode II, and mixed mode I+II static loading [29].
Camanho et al. have also developed the rules and regulations of delamination of cohesive plies [30]. They
proposed a single relative displacement-based damage parameter for softening law that controls the damage
evolution. Damage evolution law is the rate at which the cohesive stiffness is degraded after the damage
initiation has occurred. D is the scalar damage variable which has a value between 0 and 1. During damage
evolution, D monotonically evolves from 0 to 1 upon further loading after initiation of damage [31]. The
relationship between the stress components and scalar damage variable is:
Where , , and are the contact stress components predicted by the elastic traction separation
behavior for the current separation without damage [31].
As mentioned before, the softening behavior in our model has been chosen to be linear and ABAQUS
ensures that the area under the linear or the exponential damage response is equal to the fracture energy. Linear
energy evolution can be expressed as:
Where δfm = 2G
c / T
0eff and δ
maxm is the maximum value of the effective separation and T
0eff is the
effective traction at damage initiation. As mentioned before, the amount of fracture energy for damage
evolution will be the area under the triangle. In our case, δfn = 0.48 mm, thus G
c = (1/2)(0.48)(0.036) =
8.64×10⁻³
(N/mm). The viscosity coefficient for damage stabilization has been considered 10-15
. In section 3, a
method will be proposed to optimize these cohesive and damage parameters using MATLAB.
3. PARAMETERS OPTIMIZATION This section covers the procedure of development of an optimization model to estimate stiffness parameters of
the cohesive layer between photopolymer solid and the PDMS silicone film as these parameters cannot be
calculated using direct mechanical tests and should be extracted from experimental data.. The general idea is
minimizing the error between experimental data and ABAQUS predication as the parameters values are
changed dynamically in ABAQUS. An objective method should be developed to evaluate and compare the
performance of the various models. We have used mean squared error as objective method to calculate the
error between experimental and predicted data. Similar models have been developed employing finite
difference method [32], as well as finite element method [33]. Lei et al. have also developed their own code
using MATALB and ABAQUS to evaluate material parameters of biological soft tissues [34].
We have used MATLAB to program a code that satisfies all we discussed previously as the optimization
procedure. MATALB provides an excellent environment for such a task as it can call any external command or
executable file [34]. The developed MATALB code executes ABAQUS to obtain predicted finite element
results and reads the results from the ABAQUS output file. It also executes a text file to read the experimental
data and modifies the ABAQUS input file through a special code to change the amount of parameters values
dynamically. It generates a special input file containing parameter values for each run and that input file is
(4)
(5)
(6)
(7)
(8)
1439

connected to the main input file using the PYTHON command *INCLUDE. The optimization procedure uses
mean squared error as objective function to calculate the error and the minimum value will be calculated using
fmincon function. The displacement in normal direction is considered as our desirable variable to study the
cohesive behavior and optimize parameters. The optimization procedure can be summarized into four steps:
1. Reading experimental data: The displacement values for nodes of the target (real) case are considered
experimental data. These values have been stored in a text file. MATLAB reads those values by
loading that text file.
2. Calculating predicted data: Running ABAQUS for different values of a parameter and reading the
predicted results from ABAQUS output (.dat) file. We have considered different meshing policies of
the same model as different cases. Then by choosing one of them as a target or experimental case, the
amount of displacement for every node in non-target cases will be estimated from the displacement of
the nodes near that location in target case using interpolation.
3. Calculation of error: The difference between the displacement values is calculated using a mean
squared error objective function:
Where refers to experimental data and refers to a predicted data.
4. Plotting the error over different values of the parameter we want to optimize and calculating the
optimum value using optimization formulas.
A limitation of this procedure is that it may yield a local minimum if the “parameter under study –
error” plot is not convex. Global optimization or heuristic methods can be employed to overcome this problem.
However, these methods are expensive in terms of computation and are not useful in our case as we want to
shorten the fabrication time and complete the force analysis in the least possible time. We have used different
functions e.g. Cubic3, ScatteredInterpolant, and 10th degree polynomial to perform interpolation on scattered
error data. In addition, running the code for a large range of parameters at first to get an overall idea of the
location of the global minimum and selection of the best initial point will also help. This method can integrate
MATLAB and ABAQUS and if needed also other software which makes it an accessible and powerful tool to
use for evaluation of mechanical parameters based on experimental data. We started developing the
optimization code from a very simple model. Optimization of mechanical parameters for a static bottom-up
model without considering the cohesive behavior was chosen as the first step. 3.1. Static Bottom-up Model without Considering the Cohesive Behavior
In this step, the actual bottom-up model is used to optimize parameters. All the mechanical properties
and boundary conditions are same as the original model, except for the cohesive behavior. The cohesive
interaction was removed and two parts were merged together instead. This is also a static simulation, so a static
step was defined to eliminate the effect of the time. In original model, the photopolymer cube moves up at the
constant velocity of 0.1 mm per second. In this step, however, this fixed velocity boundary condition should be
replaced with a uniform pressure applied on top surface of the solid. The amount of pressure should be
calculated in such a way that:
The maximum stress at photopolymer solid should be less than the yield stress of photopolymer.
The maximum displacement at the interface between two parts should be less than 1 mm which has
been chosen based on experience.
The maximum stress at the silicone film should be less than its fracture (tensile) strength.
The minimum amount of pressure for three criteria mentioned above is going to be chosen as the
amount of pressure. The mechanical properties of photopolymer and PDMS silicone film are presented in
Table 1.
Table 1. Mechanical properties of materials
Material Young’s
modulus (MPa) Poisson’s ratio
Yield Stress
(MPa)
Tensile Strength
(MPa)
Photopolymer 2000 0.45 12 -
Silicone Film 0.36 0.5 - 2.24
(9)
1440

The amounts of pressure equal to −8 MPa, −0.7 MPa, and −1.8 MPa satisfy the requirement 1, 2, and
3, respectively. Table 2 summaries the results of using these pressure values and whether they satisfy all the
requirements or not. Green cells refer to satisfied requirements and yellow cells refer to unsatisfied
requirements.
Table 2. Calculation of pressure
Criteria P = −8
MPa
P = −0.7
MPa
P = −1.8
MPa
Max. Stress in Solid
(<12 MPa)
11.76
MPa 1.04 MPa 2.23 MPa
Max. Displacement
(<1 mm) 11.51 mm 0.97 mm 2.6 mm
Max. Stress in Film
(<2.24 MPa) 9.93 MPa 0.87 MPa 2.69 MPa
Based on the results of Table 2, P = −0.7 MPa is a suitable amount for the pressure and it will not
cause damage to the solid and film and also will move up the solid more than the amount required for complete
delamination. Pressure equal to −0.7 MPa, however, was not suitable for the case we remeshed the model. So
the same procedure was repeated for adaptively remeshed model and P = −0.5 MPa was chosen. The amount of
pressure equal to 0.5 MPa produces the maximum stress of 2.667 MPa in the solid which is less than solid’s
yield stress (12 MPa). The maximum amount of stress in the film will be 1.7 MPa for this amount of pressure
which is less than the film’s tensile strength (2.24 MPa). The maximum displacement at the interface between
two parts corresponding to P = −0.5 MPa will be 0.94 mm.
Figure 7. Displacement (U3) contour for P = −0.5 MPa
Figure 8. Stress contour for P = −0.5 MPa
The optimization was done for four different scenarios:
Scenario 1: Changing Young’s modulus of photopolymer while other parameters are fixed.
Scenario 2: Changing Young’s modulus of silicone film while other parameters are fixed.
Scenario 3: Changing Poisson’ ratio of photopolymer while other parameters are fixed.
Scenario 4: Changing Poisson’s ratio of silicone film while other parameters are fixed.
To generate different cases from the original model, different remeshing policies were used to get
different number of elements. The film was partitioned into two different portions in order to assign smaller
error distribution percentage to the portion of film near the interface. Different cased were created by assigning
different error distribution percentages (4%, 4.5%, 5%, 5.5%, 6%, 8%, and 10%) to the solid and inner portion
of the film. The uniform error distribution percent for the outer part of the film is 10% for all cases. The case
with error distribution percentages of 5% for solid and inner film and 10% for outer film was chosen as our
target experimental case. The optimization plots for 6% error model for different scenarios are shown in Fig. 9
1441

(a~d) as an example.
(a)
(b)
(c)
(d)
Figure 9. Results of the optimization for 6% error distribution model: (a) Young’s modulus of photopolymer (1800 < E <
2200); (b) Young’s modulus of silicone film (0.34 < E < 0.38); (c) Poisson’s ratio of photopolymer (0.4 < ν < 0.5); (d)
Poisson’s ratio of silicone film (0.465 < ν < 0.5)
Table 3 contains the optimization results for four different elastic parameters evaluated in four different
scenarios.
Table 3. Optimization results for static bottom-up model without cohesive behavior
Model
Number Percentage Scenario 1 Scenario 2 Scenario3 Scenario4
1 4% - 10% 2000 - 0.45 0.4888
2 4.5% - 10% 2000 - 0.45 0.485
3 5% - 10% 2000 0.36 0.45 0.49
4 5.5% - 10% 2000 - 0.45 0.4886
5 6% - 10% 1991.4 - 0.45 0.486
6 8% - 10% 1989.9 - 0.445 0.4871
7 10% - 10% 1970 - 0.44 0.4871
3.2. Pseudo-dynamic Bottom-up Model Considering the Cohesive Behavior At this step, the optimization was done for the cohesive stiffness parameters (Ki) of the original model.
The model was run for 20 seconds. However, considering the time in the model will increase the time of
adaptivity remeshing dramatically. First, the model was run with the remeshing policies of 8%, 15%, and 18%
for solid, inner portion of the film, and outer portion of the film, respectively. The remeshing was repeated 100
1442
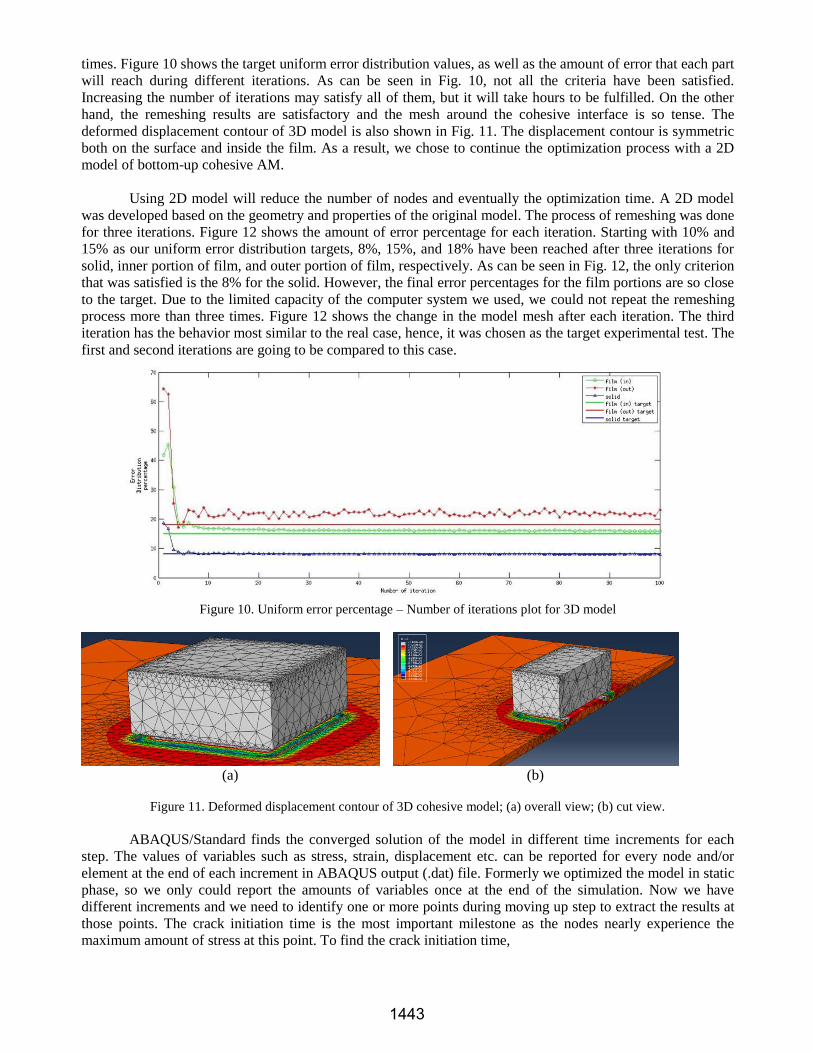
times. Figure 10 shows the target uniform error distribution values, as well as the amount of error that each part
will reach during different iterations. As can be seen in Fig. 10, not all the criteria have been satisfied.
Increasing the number of iterations may satisfy all of them, but it will take hours to be fulfilled. On the other
hand, the remeshing results are satisfactory and the mesh around the cohesive interface is so tense. The
deformed displacement contour of 3D model is also shown in Fig. 11. The displacement contour is symmetric
both on the surface and inside the film. As a result, we chose to continue the optimization process with a 2D
model of bottom-up cohesive AM.
Using 2D model will reduce the number of nodes and eventually the optimization time. A 2D model
was developed based on the geometry and properties of the original model. The process of remeshing was done
for three iterations. Figure 12 shows the amount of error percentage for each iteration. Starting with 10% and
15% as our uniform error distribution targets, 8%, 15%, and 18% have been reached after three iterations for
solid, inner portion of film, and outer portion of film, respectively. As can be seen in Fig. 12, the only criterion
that was satisfied is the 8% for the solid. However, the final error percentages for the film portions are so close
to the target. Due to the limited capacity of the computer system we used, we could not repeat the remeshing
process more than three times. Figure 12 shows the change in the model mesh after each iteration. The third
iteration has the behavior most similar to the real case, hence, it was chosen as the target experimental test. The
first and second iterations are going to be compared to this case.
Figure 10. Uniform error percentage – Number of iterations plot for 3D model
(a)
(b)
Figure 11. Deformed displacement contour of 3D cohesive model; (a) overall view; (b) cut view.
ABAQUS/Standard finds the converged solution of the model in different time increments for each
step. The values of variables such as stress, strain, displacement etc. can be reported for every node and/or
element at the end of each increment in ABAQUS output (.dat) file. Formerly we optimized the model in static
phase, so we only could report the amounts of variables once at the end of the simulation. Now we have
different increments and we need to identify one or more points during moving up step to extract the results at
those points. The crack initiation time is the most important milestone as the nodes nearly experience the
maximum amount of stress at this point. To find the crack initiation time,
1443

Figure 12. Uniform error percentage – number of iterations plot for 2D model
(a)
(b)
(c)
Figure 13. Undeformed displacement contours for 2D model;
(a) 1st iteration; (b) 2
nd iteration; (c) 3
rd iteration
stress was plotted for different nodes on interface of the solid and PDMS silicone film over the time. Figure 14
shows the stress – time plot for one of the nodes. The maximum stress happens at a time around 4 seconds and
the complete delamination at around 5.5 seconds. Other nodes on the interface have the exact same behavior.
In order to report the displacement amounts at exact crack initiation and complete delamination times, we
divided the 20 seconds moving up step into three parts: (1) crack initiation step (4 seconds); (2) crack evolution
step (1.5 seconds); (3) moving up step (14 seconds). Using *NODE PRINT command in input file, the
amounts of displacement in normal direction for desired increments of every step. However, displacement was
only reported for a special node set on the cohesive interaction between the two objects not all the nodes to
decrease the computational time. This target area experiences the most amount of stress as well as the largest
displacement.
1444

Figure 14. Stress – time plot for a single node on the cohesive area of the film
The results of optimization for the first and second iterations are shown in Fig. 15. The optimized
value of K is equal to 0.0855 N/mm3 for the 1
st iteration 1 and 0.09455 N/mm
3 for the 2
nd iteration.
3.3. Validation of the Optimization Model The main target of developing an optimization model is to evaluate the cohesive stiffness parameters.
However, the optimized values should help to improve the performance of the models with coarser meshes
which is helpful in reduction of the total time of analysis once the ABAQUS model is integrated into the SLA
machine. To investigate the validation of optimization model, the 2nd
iteration was run with the optimized
value of cohesive stiffness (k = 0.09455 N/mm3). The results of the simulation in terms of displacement were
plotted over the cohesive interface for different increments of time. The same procedure was done for the
results of 3rd
iteration with non-optimized stiffness parameter (k = 0.09 N/mm3). It is expected that the model
with coarser mesh (2nd
iteration) should produce the similar results to the model with finer mesh (3rd
iteration),
once provided with the optimized parameters. Figure 16 shows the results of displacement over the time for
both cases.
(a) (b)
Figure 15. Results of the optimization for remeshing iterations 1 and 2;
(a) 1st iteration (0.04 < K < 0.14); (b) 2
nd iteration (0.04 < K < 0.14)
1445
(a)
(b)
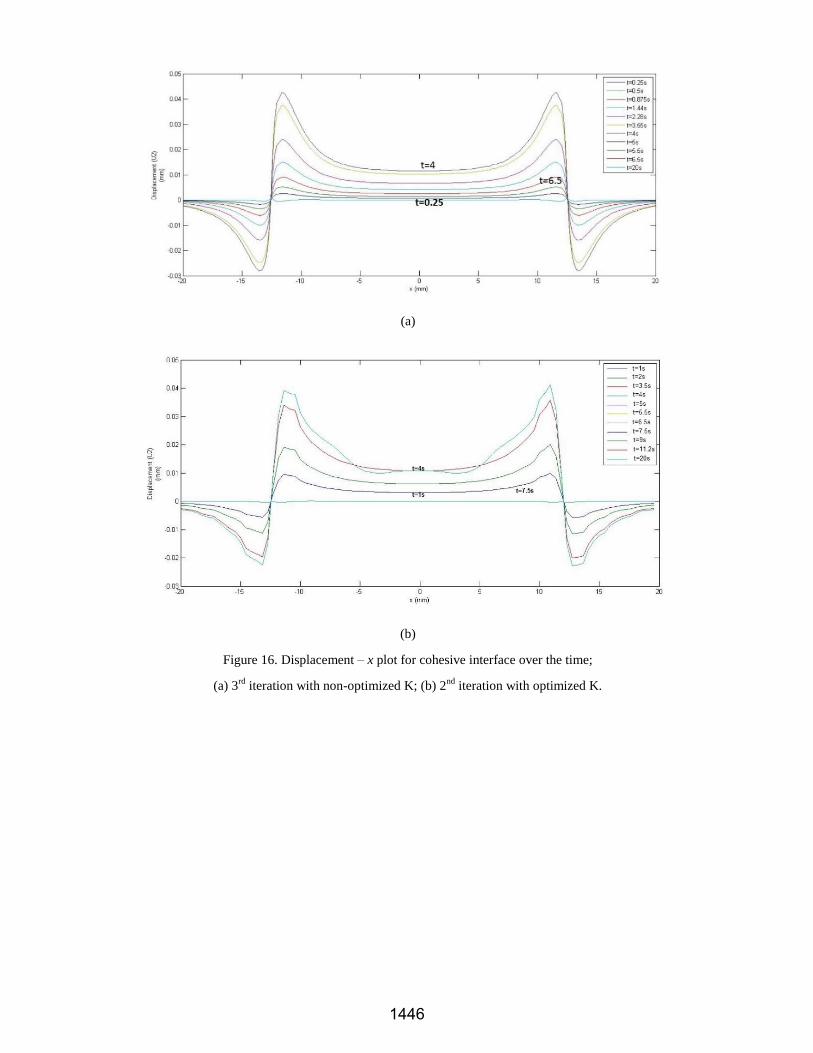
Figure 16. Displacement – x plot for cohesive interface over the time;
(a) 3rd
iteration with non-optimized K; (b) 2nd
iteration with optimized K.
1446

As can be seen from Fig. 16, the behavior of the two cases is the same both quantitatively and
qualitatively. They both reach a maximum displacement of nearly 0.04 mm and their displacement behavior
follows a certain pattern. First, it gradually increase until it gets to the maximum displacement at t = 4 seconds;
then a sudden drop (or softening with sharp slope) happens which is the result of the quick degradation of
cohesive effect of surface elements in crack evolution stage. Fig. 16 (a~b) testifies that the proposed optimization
method is valid and can be used to increase the time efficiency of the final online force control system.
4. MODEL RESULTS The goal of this paper is developing a FEM model using ABAQUS to model the behavior of
the cohesive delamination at the interface of a photopolymer solid and a PDMS silicone film in a
bottom-up projection-based additive manufacturing process. This research is motivated by the fact that
the pulling up force plays an important role in the final quality of the parts and the reliability of the
bottom-up projection-based process. However, the research work is not well conducted yet in this area.
To fill this gap, our goal is developing a mechanics-based closed-loop force monitoring system. To do
that, the first step was to study and model the cohesive delamination and peeling. We simulated the
bottom-up projection-based process in ABAQUS/Standard and evaluated the cohesive stiffness
parameters using an optimization method which integrates ABAQUS and MATALB and optimizes the
mechanical parameters using a mean squared error function. Running the model with the evaluated
parameters, the cohesive behavior result is shown in Fig. 17.
Figure 17. Magnified cohesive behavior
To give a better view of the displacement, the movement in y direction is magnified 100 times. The
results show that the behavior of the cohesive model is in line with what it is expected from theory and
the experience. Elements with cohesive property follow the bi-linear traction-separation law perfectly.
The sudden degradation of the cohesive effect which also can be expected from experience has been
achieved very well. The results presented in section 3.3 also testify the validity of the optimization
model. Figure 18 also shows the delamination process over the time.
1447
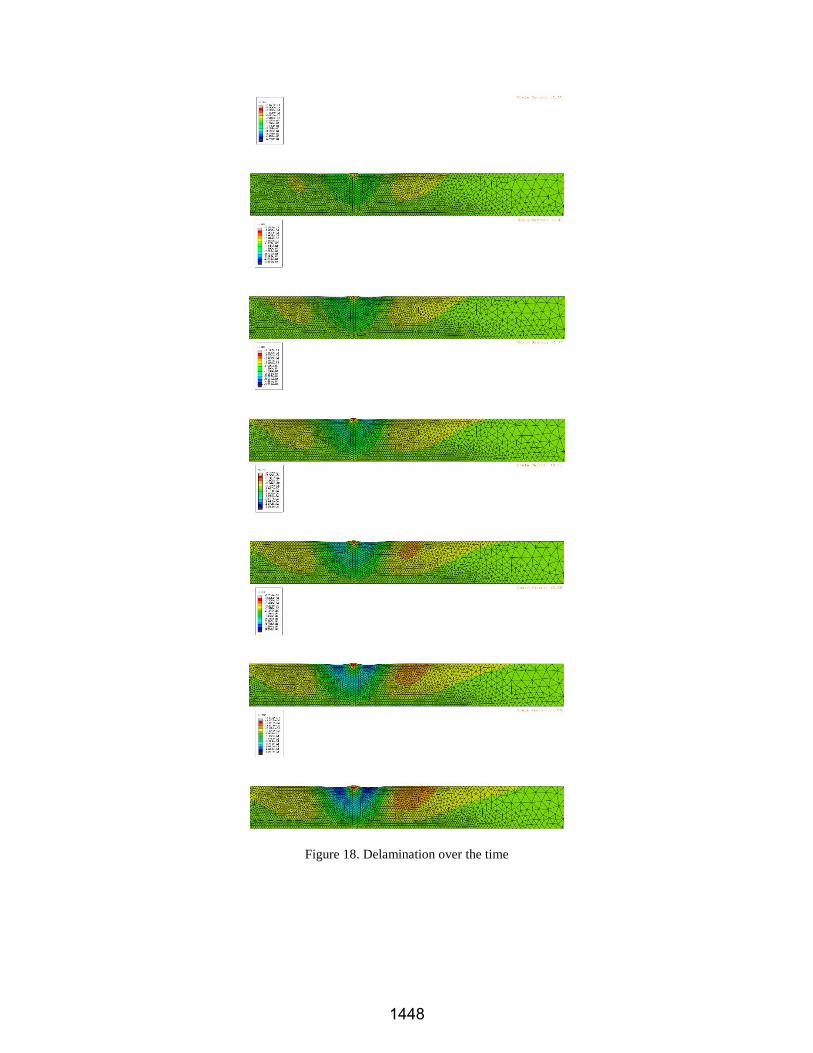
Figure 18. Delamination over the time
1448

5. CONCLUSION AND FUTURE WORK The result of this work would be very influential in manufacturing area, since this method will
improve the fabrication speed and part quality. However, simplification of the final FEM model in
such a way that the simulation results be satisfactory and integrating this model into the bottom-up
projection-based stereolithography machine will be very challenging. Therefore, this research is very
helpful and at the same time lots of research work is expected to be done in the future. This research
has made the following contributions:
(1) Utilize finite element method to model the cohesive delamination process in bottom-up
projection-based additive manufacturing process which will be used as a basis to develop an
online closed-loop force monitoring system.
(2) Establish an optimization model to evaluate the mechanical parameters that cannot be
calculated directly from closed formulas or mechanical tests and need to be estimated from
experimental results.
Designing an online force monitoring system for bottom-up projection-based model is very
challenging and will be an ongoing research topic. Even this very first task obtained some results; it
has lots of limitations and still at preliminary stage. More comparisons similar to the optimized
iteration 2 and iteration 3 should be done to confirm the optimization method. It also has been assumed
that the silicone film sticks to the resin tank and its bottom surface is fixed. This assumption needs to
be validated. The feasibility of defining film as a hyper-elastic material instead of an elastic material in
terms of simulation cost should also be investigated. In order to get a more realistic model, the
cohesive model should be completed applying stochastic parameters. REFERENCES [1] Economist, 2011, "Print me a Stradivarius: How a new manufacturing technology will change
the world," http://www.economist.com/node/18114327.
[2] Bourell, D. L., Leu, M. C., and Rosen, D. W., 2009, "Roadmap for additive manufacturing:
identifying the future of freeform processing," The University of Texas, Austin.
[3] Zhou, C., Chen, Y., Yang, Z. G., and Khoshnevis, B., 2011, "Development of a multi-material
mask-image-projection-based stereolithography for the fabrication of digital materials."
[4] Melchels, F. P. W., Feijen, J., and Grijpma, D. W., 2010, "A review on stereolithography and
its applications in biomedical engineering," Biomaterials, 31(24), pp. 6121-6130.
[5] Huang, Y.-M., and Jiang, C.-P., 2005, "On-line force monitoring of platform ascending rapid
prototyping system," Journal of materials processing technology, 159(2), pp. 257-264.
[6] Denken, 1997, "SLP-4000 Solid Laser Diode Plotter, Product Brochure."
[7] Monneret, S., Loubere, V., and Corbel, S., 1999, "Microstereolithography using a dynamic
mask generator and a noncoherent visible light source," International Society for Optics and
Photonics, pp. 553-561.
[8] Pan, Y., Chen, Y., and Zhou, C., "Fast Recoating Methods for the Projection-based
Stereolithography Process in Micro-and Macro-Scales."
[9] Krueger, R., 2004, "Virtual crack closure technique: history, approach, and applications,"
Applied Mechanics Reviews, 57(2), pp. 109-143.
[10] Turon, A., Davila, C. G., Camanho, P. P., and Costa, J., 2007, "An engineering solution for
mesh size effects in the simulation of delamination using cohesive zone models," Engineering
Fracture Mechanics, 74(10), pp. 1665-1682.
[11] Schellekens, J. C. J., and De Borst, R., 1993, "A non-linear finite element approach for the
analysis of mode-I free edge delamination in composites," International Journal of Solids and
Structures, 30(9), pp. 1239-1253.
[12] Allix, O., Ladeveze, P., and Corigliano, A., 1995, "Damage analysis of interlaminar fracture
1449

specimens," Composite Structures, 31(1), pp. 61-74.
[13] Allix, O., and Corigliano, A., 1996, "Modeling and simulation of crack propagation in mixed-
modes interlaminar fracture specimens," International Journal of Fracture, 77(2), pp. 111-140.
[14] Chaboche, J. L., Girard, R., and Schaff, A., 1997, "Numerical analysis of composite systems
by using interphase/interface models," Computational Mechanics, 20(1-2), pp. 3-11.
[15] Mi, Y., Crisfield, M. A., Davies, G. A. O., and Hellweg, H. B., 1998, "Progressive
delamination using interface elements," Journal of composite materials, 32(14), pp. 1246-
1272.
[16] Chen, 1999, "Predicting progressive delamination of composite material specimens via
interface elements," Mechanics of composite materials and structures, 6(4), pp. 301-317.
[17] Alfano, G., and M. A. Crisfield. "Finite element interface models for the delamination analysis
of laminated composites: mechanical and computational issues." International journal for
numerical methods in engineering 50.7 (2001): 1701-1736.
[18] Goyal, V. K., Johnson, E. R., and Dávila, C. G., 2004, "Irreversible constitutive law for
modeling the delamination process using interfacial surface discontinuities," Composite
Structures, 65(3), pp. 289-305.
[19] Turon, A., Camanho, P. P., Costa, J., and Dávila, C. G., 2006, "A damage model for the
simulation of delamination in advanced composites under variable-mode loading," Mechanics
of Materials, 38(11), pp. 1072-1089.
[20] Tvergaard, V., and Hutchinson, J. W., 1992, "The relation between crack growth resistance
and fracture process parameters in elastic-plastic solids," Journal of the Mechanics and
Physics of Solids, 40(6), pp. 1377-1397.
[21] Cui, W., and Wisnom, M. R., 1993, "A combined stress-based and fracture-mechanics-based
model for predicting delamination in composites," Composites, 24(6), pp. 467-474.
[22] Needleman, A., 1987, "A continuum model for void nucleation by inclusion debonding,"
Journal of applied mechanics, 54(3), pp. 525-531.
[23] Xu, X. P., and Needleman, A., 1994, "Numerical simulations of fast crack growth in brittle
solids," Journal of the Mechanics and Physics of Solids, 42(9), pp. 1397-1434.
[24] Reedy, E. D., Mello, F. J., and Guess, T. R., 1997, "Modeling the initiation and growth of
delaminations in composite structures," Journal of Composite Materials, 31(8), pp. 812-831.
[25] Camanho, P. P., Davila, C. G., and De Moura, M. F., 2003, "Numerical simulation of mixed-
mode progressive delamination in composite materials," Journal of composite materials,
37(16), pp. 1415-1438.
[26] Turon, A., Camanho, P. P., Costa, J., and Dávila, C. G., 2004, "An interface damage model for
the simulation of delamination under variable-mode ratio in composite materials,"
NASA/Technical Memorandum, 213277.
[27] Daudeville, L., Allix, O., and Ladeveze, P., 1995, "Delamination analysis by damage
mechanics: some applications," Composites Engineering, 5(1), pp. 17-24.
[28] Zou, Z., Reid, S. R., Li, S., and Soden, P. D., 2002, "Modelling interlaminar and intralaminar
damage in filament-wound pipes under quasi-static indentation," Journal of composite
materials, 36(4), pp. 477-499.
[29] Benzeggagh, M. L., and Kenane, M., 1996, "Measurement of mixed-mode delamination
fracture toughness of unidirectional glass/epoxy composites with mixed-mode bending
apparatus," Composites Science and Technology, 56(4), pp. 439-449.
[30] Camanho, P. P., and Dávila, C. G., 2002, "Mixed-mode decohesion finite elements for the
simulation of delamination in composite materials," NASA-Technical paper, 211737(1), p. 33.
[31] Song, K., Dávila, C. G., and Rose, C. A., 2008, "Guidelines and parameter selection for the
simulation of progressive delamination," pp. 1-15.
1450
[32] Ateshian, G. A., Warden, W. H., Kim, J. J., Grelsamer, R. P., and Mow, V. C., 1997, "Finite
deformation biphasic material properties of bovine articular cartilage from confined
compression experiments," Journal of biomechanics, 30(11), pp. 1157-1164.
[33] Laible, J. P., Pflaster, D., Simon, B. R., Krag, M. H., Pope, M., and Haugh, L. D., 1994, "A
dynamic material parameter estimation procedure for soft tissue using a poroelastic finite
element model," Journal of biomechanical engineering, 116(1), pp. 19-29.
[34] Lei, F., and Szeri, A. Z., 2007, "Inverse analysis of constitutive models: biological soft
tissues," Journal of biomechanics, 40(4), pp. 936-940.
1451