
Separating the impacts of climate change and land surface...
7
Separating the impacts of climate change and land surface alteration on runoff reduction in the Jing River catchment of China Tingting Ning a,c , Zhi Li b, ⁎, Wenzhao Liu a,c, ⁎ a State Key Laboratory of Soil Erosion and Dryland Farming on the Loess Plateau, Institute of Soil and Water Conservation, Chinese Academy of Sciences and Ministry of Water Resources, Yangling, Shaanxi 712100, China b College of Natural Resources and Environment, Northwest A&F University, Yangling, Shaanxi 712100, China c University of Chinese Academy of Sciences, Beijing 100049, China abstract article info Article history: Received 8 February 2016 Received in revised form 26 May 2016 Accepted 28 June 2016 Available online xxxx The Loess Plateau of China is subject to severe water shortages, and the runoff reduction observed in most water- sheds exacerbates the problem. Quantifying the contributions of environmental changes to runoff reduction is thus very important for water resources management. Taking the Jing River catchment as the study area, the changes in runoff for the period of 1961–2010 at three gauge stations—the catchment outlet (Zhang Jia Shan, ZJS) and the two others from the upper reach (Yang Jia Ping, YJP, and Yu Luo Ping, YLP) were analyzed in this study. Using the Budyko framework, the spatiotemporal variations of the contributions of precipitation (P), po- tential evapotranspiration (ET 0 ), and land surface conditions (represented by the parameter n in the Choudhury–Yang equation) to runoff changes were evaluated. A significant downward trend in runoff was de- tected for the ZJS and YJP stations. The sensitivity of the runoff changes to the different environmental factors considered was different. The sensitivity coefficient was the greatest for P, intermediate for ET 0 , and smallest for the land surface condition (n). However, the sensitivity coefficients are becoming greater over time. The de- crease in P was the dominant factor in the runoff reduction at the three stations, but its effect was largely offset by the increase in n at YLP. The contribution of land surface alteration to runoff reduction has been increasing in re- cent years, which indicates that the improvement of vegetation coverage and the construction of terraces and check dams have strengthened their impacts on runoff. Therefore, careful attention should be paid to the hydro- logical effects of soil conservation measures on runoff. © 2016 Elsevier B.V. All rights reserved. Keywords: Budyko framework elasticity coefficients runoff climate variability land surface condition Loess Plateau 1. Introduction The Loess Plateau (6.4 × 10 5 km 2 ) is located in the upper and middle reaches of the Yellow River in northern China (Fig. 1). Because of the high erodibility of loessial soil and the intensive rainstorms and low vegetation coverage of the area, the Loess Plateau has become one of the most severely eroded areas in the world (Zhu et al. 1983). Several measures have been implemented since the 1950s in attempts to con- trol soil loss in the area, including biological measures (replanting trees and improving pastures) and engineering measures (building ter- races and sediment trapping dams). The effects of such soil conservation measures on water yield need to be assessed because the region is high- ly vulnerable to water shortages (Mu et al. 2007b). Three methods have been developed to assess the hydrological ef- fects of environmental changes: the paired catchments approach, hy- drological modeling, and statistical methods (Li et al. 2009). The paired catchments approach is superior to modeling of small catchments in compensating for climate variability, but it is difficult to apply this approach to medium or large catchments because the natural conditions are rarely similar in large catchments (Huang et al. 2003; Mu et al. 1999). Hydrological models, including process-based models and conceptual models, are powerful tools for investigating the rela- tionships between climate, human activities, and water resources (Jothityangkoon et al. 2001; Leavesley 1994). However, few process- based models can be directly used for this purpose because they lack a component for engineering measures (McVicar et al. 2007). Conceptual models and regression-based statistical models have thus been widely used to quantify the effects of environmental changes on runoff. The climate elasticity method based on catchment-scale water and energy balance, such as the Budyko hypothesis (Budyko 1961; Budyko 1974), has been very popular in recent years because of its simple for- mulation but full representation of climate and land surface changes (Dooge et al. 1999; Sankarasubramanian et al. 2001). Using the water balance equation of P = Q + ET + ΔS (where P, Q, ET and ΔS respective- ly represents precipitation, runoff, actual evapotranspiration and changes in water storage) and the Budyko solution for ET, some analyt- ical formulas have been developed to represent the impacts of Catena 147 (2016) 80–86 ⁎ Corresponding authors. E-mail addresses: [email protected] (Z. Li), [email protected] (W. Liu). http://dx.doi.org/10.1016/j.catena.2016.06.041 0341-8162/© 2016 Elsevier B.V. All rights reserved. Contents lists available at ScienceDirect Catena journal homepage: www.elsevier.com/locate/catena
Transcript of Separating the impacts of climate change and land surface...
Catena 147 (2016) 80–86
Contents lists available at ScienceDirect
Catena
j ourna l homepage: www.e lsev ie r .com/ locate /catena
Separating the impacts of climate change and land surface alteration onrunoff reduction in the Jing River catchment of China
Tingting Ning a,c, Zhi Li b,⁎, Wenzhao Liu a,c,⁎a State Key Laboratory of Soil Erosion and Dryland Farming on the Loess Plateau, Institute of Soil andWater Conservation, Chinese Academy of Sciences andMinistry ofWater Resources, Yangling,Shaanxi 712100, Chinab College of Natural Resources and Environment, Northwest A&F University, Yangling, Shaanxi 712100, Chinac University of Chinese Academy of Sciences, Beijing 100049, China
⁎ Corresponding authors.E-mail addresses: [email protected] (Z. Li), wenzhaoli
http://dx.doi.org/10.1016/j.catena.2016.06.0410341-8162/© 2016 Elsevier B.V. All rights reserved.
a b s t r a c t
a r t i c l e i n f oArticle history:Received 8 February 2016Received in revised form 26 May 2016Accepted 28 June 2016Available online xxxx
The Loess Plateau of China is subject to severewater shortages, and the runoff reduction observed inmostwater-sheds exacerbates the problem. Quantifying the contributions of environmental changes to runoff reduction isthus very important for water resources management. Taking the Jing River catchment as the study area, thechanges in runoff for the period of 1961–2010 at three gauge stations—the catchment outlet (Zhang Jia Shan,ZJS) and the two others from the upper reach (Yang Jia Ping, YJP, and Yu Luo Ping, YLP) were analyzed in thisstudy. Using the Budyko framework, the spatiotemporal variations of the contributions of precipitation (P), po-tential evapotranspiration (ET0), and land surface conditions (represented by the parameter n in theChoudhury–Yang equation) to runoff changes were evaluated. A significant downward trend in runoff was de-tected for the ZJS and YJP stations. The sensitivity of the runoff changes to the different environmental factorsconsidered was different. The sensitivity coefficient was the greatest for P, intermediate for ET0, and smallestfor the land surface condition (n). However, the sensitivity coefficients are becoming greater over time. The de-crease in Pwas the dominant factor in the runoff reduction at the three stations, but its effectwas largely offset bythe increase in n at YLP. The contribution of land surface alteration to runoff reduction has been increasing in re-cent years, which indicates that the improvement of vegetation coverage and the construction of terraces andcheck dams have strengthened their impacts on runoff. Therefore, careful attention should be paid to the hydro-logical effects of soil conservation measures on runoff.
© 2016 Elsevier B.V. All rights reserved.
Keywords:Budyko frameworkelasticity coefficientsrunoffclimate variabilityland surface conditionLoess Plateau
1. Introduction
The Loess Plateau (6.4 × 10⁵ km2) is located in the upper andmiddlereaches of the Yellow River in northern China (Fig. 1). Because of thehigh erodibility of loessial soil and the intensive rainstorms and lowvegetation coverage of the area, the Loess Plateau has become one ofthe most severely eroded areas in the world (Zhu et al. 1983). Severalmeasures have been implemented since the 1950s in attempts to con-trol soil loss in the area, including biological measures (replantingtrees and improving pastures) and engineeringmeasures (building ter-races and sediment trapping dams). The effects of such soil conservationmeasures onwater yield need to be assessed because the region is high-ly vulnerable to water shortages (Mu et al. 2007b).
Three methods have been developed to assess the hydrological ef-fects of environmental changes: the paired catchments approach, hy-drological modeling, and statistical methods (Li et al. 2009). Thepaired catchments approach is superior to modeling of small
[email protected] (W. Liu).
catchments in compensating for climate variability, but it is difficult toapply this approach tomedium or large catchments because the naturalconditions are rarely similar in large catchments (Huang et al. 2003;Mu et al. 1999). Hydrological models, including process-based modelsand conceptual models, are powerful tools for investigating the rela-tionships between climate, human activities, and water resources(Jothityangkoon et al. 2001; Leavesley 1994). However, few process-based models can be directly used for this purpose because they lack acomponent for engineeringmeasures (McVicar et al. 2007). Conceptualmodels and regression-based statistical models have thus been widelyused to quantify the effects of environmental changes on runoff.
The climate elasticity method based on catchment-scale water andenergy balance, such as the Budyko hypothesis (Budyko 1961; Budyko1974), has been very popular in recent years because of its simple for-mulation but full representation of climate and land surface changes(Dooge et al. 1999; Sankarasubramanian et al. 2001). Using the waterbalance equation of P=Q+ ET+ΔS (where P, Q, ET andΔS respective-ly represents precipitation, runoff, actual evapotranspiration andchanges in water storage) and the Budyko solution for ET, some analyt-ical formulas have been developed to represent the impacts of
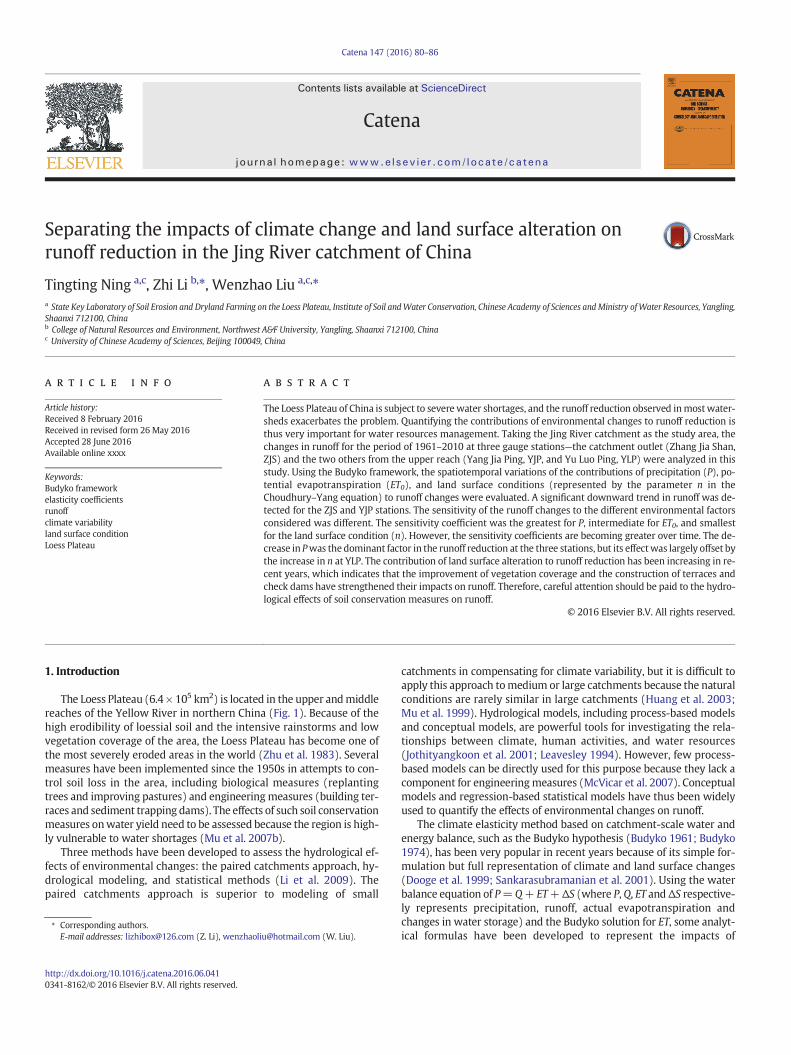
Fig. 1. Location of the Jing River catchment and the hydrologic and weather stations.
81T. Ning et al. / Catena 147 (2016) 80–86
environmental factors on runoff or actual evapotranspiration. Roderickand Farquhar (2011) derived the relationship of the elasticity of runoffto three parameters, i.e., precipitation, potential evapotranspiration,and land surface conditions. Yang and Yang (2011) related the elasticityof runoff to precipitation, net radiation, air temperature, wind speed,and relative humidity and then separated the contributions of differentclimatic variables. AssumingΔS as zero for long-termwater balance, theelasticity method is effective to describe the sensitivity of runoff to en-vironment factors. However, the analytical formulas have been rarelyused for analysis of inter-annual variations in the elasticity coefficientsthough it might provide important information for water resourcesmanagement.
Spatiotemporal variations exist in the hydrological effects of bothhuman activities and climate variability on the Loess Plateau. In general,human activities account for N50% of the changes in runoff in mostcatchments (Zhang et al., 2008a; Zhao et al. 2014), while climate vari-ability plays a more important role in some catchments (Hu et al.2007; Li et al. 2009). Decade-scale variations in hydrological effectshave also been observed (Mu et al. 2007a). Opinions differ on the extentof the total runoff change that has occurred in the Loess Plateau, as wellas to the extent to which each factor has influenced that change. There-fore, assessing the changes and their causes at the catchment scale is im-portant because it can provide important information for use inenvironmental protection and water resource management.
The objectives of this study were to (i) analyze the spatiotemporalchanges in runoff in a sample catchment for the period of 1961–2010,(ii) assess the inter-annual variability of the elasticity coefficients ofrunoff to climatic factors and land surface conditions, and (iii) furtherquantify the contributions of various factors to runoff changes. A meth-odwas developed to analyze the inter-annual variability of the elasticitycoefficient and the spatiotemporal variability of the runoff as well as itsattributionwas analyzed in detail to obtain information for use in waterresource management.
2. Materials and Methods
2.1. Study area
The Jing River is a second-order tributary of the Yellow River, and itscatchment is located in the south of the Loess Plateau (Fig. 1). The
catchment covers an area of 45,421 km2. The average annual precipita-tion is 542.5mm, 50–60% of which falls between June and September inheavy storms. The average annual temperature for the period of 1961–2010 is 9.6 °C. The southern part of the catchment iswarmer andwetterthan the northern part. Farmlands and grasslands cover 88% of thewhole catchment (Li et al., 2013a). The soil is predominantly silt loam,with a silt content N50%. The elevation varies from 416 to 2908 m, andthe northwestern portion of the catchment is higher than the southeast-ern portion. The catchment is composed of five types of landform. Thetwo main types (hilly–gully terrain and tableland–gully terrain) cover81.2% of the catchment. These are the most eroded regions of thecatchment.
Since the 1950s, a series of soil conservation practices has been im-plemented in the catchment. These measures have included both bio-logical measures, such as planting of trees and improvement ofpastures, and engineering measures, such as construction of terracesand sediment-trapping dams. The controlled area has increased, and ac-celerated after 1970s. The total controlled area reached 7562 km2 by1996, accounting for 23% of the water-eroded area (Ran et al. 2006).
2.2. Data collection
Three hydrologic stations, i.e., Yang Jia Ping (YJP), Yu Luo Ping (YLP),and Zhang Jia Shan (ZJS), were selected in this study because they arethe most important outlets of two sub-watersheds and the whole wa-tershed, respectively (Fig. 1). The ZJS station is the outlet of the JingRiver before it feeds into the Wei River. The control areas of the YJP,YLP, and ZJS stations are 14,124 km2, 19,019 km2 and 43,216 km2, re-spectively, which correspond to 31%, 42%, and 95%, respectively, of thetotal area of the Jing River catchment. The amounts of runoff of YJPand YLP and the lower reaches from the two stations to ZJS accountfor 54%, 32%, and 14%, respectively, of the total runoff of the catchment.Monthly runoff data for the three catchments for the period of 1961–2010 were collected from the Yellow River Conservancy Commission(YRCC). Daily meteorological data for 26 stations for the period of1961–2010 were collected from the China Meteorological Administra-tion. Themeteorological data consisted of precipitation, dailymaximumand minimum temperatures at a height of 2 m, atmospheric pressure,wind speed at a height of 10 m, mean relative humidity and sunshineduration data.
82 T. Ning et al. / Catena 147 (2016) 80–86
2.3. Attribution analysis of runoff variation
The elasticity method, based on the Budyko hypothesis, was used toanalyze the contributions of climate change and land surface alterationto runoff variation. The sensitivity of runoff to environmental factorswas analyzed based on the water balance equation, and the contribu-tions of environmental changes to runoff variations were then quanti-fied. The methods are described in detail as follows.
2.3.1. Water balance equationThewater balance for a catchment can be described by the following
equation:
Q ¼ P−ET−ΔS ð1Þ
where P, ET, Q, and ΔS represent the precipitation, actual evapotranspira-tion, runoff, and change inwater storage, respectively. The values ofQ andP can be observed directly, but the values of ET andΔS cannot be observeddirectly on the catchment scale and must be estimated indirectly.
The Budyko framework is a powerful method for ET estimation byvarious empirical formulas, such as the Fu equation (Fu 1981; Zhanget al. 2004), the Zhang equation (Zhang et al. 2001), the Choudhury–Yang equation (Choudhury 1999; Yang et al. 2008) and the Wang–Tang equation (Wang and Tang 2014). These equations were all devel-oped based on the relationships between P, ET0, and the controlling pa-rameters (the land surface conditions), and they yield similarperformance in terms of ET estimation. The Choudhury–Yang equationwas selected for use with the following equation, in which ET0 is esti-mated by the Priestley and Taylor method (Priestley and Taylor, 1972):
ET ¼ P � ET0
Pn þ ETn0
� �1=n ð2Þ
where n is the controlling parameter that determine the shape of theBudyko curve, which primarily represents the integrated effects of thecatchment landscape characteristics on the water balance (Xu et al.2014; Yang et al. 2014a).
The value of ΔS is usually assumed to be zero for the purposes oflong-term analysis. In this study, elasticity coefficients were calculatedfor both annual scale and long-term periods based on the assumptionof invariant water storage. The reliability of this hypothesis for annualscale analysis will be examined in the discussion section.
The water balance equation can therefore be expressed in the fol-lowing form:
Q ¼ P−P � ET0
Pn þ ETn0
� �1=n ð3Þ
According to Eq. (3), the annual value of n can be estimatedusing theannual data for Q, P, and ET0.
2.3.2. Sensitivity analysisBecause the water balance equation can be rewritten as Q = f
(P, ET0, n), the elasticity of runoff to a particular independent variablex can be calculated as follows (McCuen 1974):
εxi ¼∂Q∂xi
� xiQ
ð4Þ
where εxi is the elasticity coefficient and xi represents P, ET0, or n.Assuming that∅ ¼ ET0
P , the elasticity coefficients of Eq. (4) are as follows(Xu et al. 2014; Yang et al. 2015):
εP ¼ 1þ∅n� �1=nþ1−∅nþ1
1þ∅n� �1þ∅n� �1=n−∅
h i ð5aÞ
εET0 ¼1
1þ∅n� �1− 1þ∅−n� �1=nh i ð5bÞ
εn ¼ ln 1þ∅n� �þ∅n ln 1þ∅−n� �
n 1þ∅n� �− 1þ∅n� �1=nþ1
h i ð5cÞ
A positive/negative elasticity coefficient of a certain variable indi-cates thatQwill increase/decrease with an increase/decrease of the var-iable. Using the above equations, the annual or periodic elasticitycoefficients of runoff with respect to P, ET0, and n can be obtained for dif-ferent hydrological stations, and the temporal evolution of the elasticitycoefficients can be determined.
2.3.3. Quantification of contributionThe runoff change induced by a certain factor can be estimated by
the product of the factor change and its partial derivative. Thus, the con-tribution of each factor to changes in runoff can be calculated using thefollowing differentiating equation:
dQ ¼ ∂Q∂P
dP þ ∂Q∂ET0
dET0 þ ∂Q∂n
dn ð6Þ
or more briefly:
L Qð Þ ¼ C Pð Þ þ C ET0ð Þ þ C nð Þ ð7Þ
where L_(Q) is the actual linear trend of Q and C_(P), C_(ET0), andC_(n) are the contributions of changes in climate (P, ET0) and land sur-face (n), respectively, to the variation in Q. The sum of C_(P), C_(ET0),and C_(n) is simplified as C_(Q).
The relative contributions of each factor to the runoff change can becalculated as:
RC xið Þ ¼ C xið ÞL Qð Þ � 100% ð8Þ
where xi represents each of the above three variables.The non-parametric Mann–Kendall test was used to detect the
change point of the annual runoff series. This test has the advantagesof robustness for data with a non-normal distribution along with apower nearly as great as its parametric competitors (Liang et al.2010). Details of the theory and calculation steps have been describedby Modarres and Sarhadi (2009).
After the study period was divided into two sub-periods before andafter abrupt changes occurred, the contributions of the different vari-ables considered to runoff changes were quantified for the two periods.The variations in the contribution of each variable to runoff changecould then be detected and used to provide information for use inwater resource management.
3. Results
3.1. Changes in runoff and environmental factors
The annual runoff had a downward trend for all the three gauge sta-tions (Table 1). However, the downward trends were only significantfor the whole catchment (ZJS) and one of the two sub-watersheds ofthe upper reach (YJP). The annual runoff for ZJS and YJP decreased by0.65 and 1.14 mm yr−1, which accounted for 1.7% and 2.4%, respective-ly, of the corresponding annual runoff. The change in precipitation ex-hibited a trend similar to that of runoff, decreasing in ZJS and YJP by1.94 and 2.01 mm yr−1, whereas the decrease in YLP was insignificant.However, ET0 exhibited an insignificant upward trend for all stations.The increase in n was significant in YJP but insignificant in ZJS and
Table 1Averages and changes of runoff and environmental factors in the Jing River during 1961–2010.
Station
Q, mm yr−1 P, mm yr−1 ET0, mm yr−1 n
Average Slope Average Slope Average Slope Average Slope
Whole periodZJS 37.2 −0.65** 542.5 −1.94* 936.5 0.41 2.783 0.004YJP 46.8 −1.14** 537.7 −2.01* 921.3 0.42 2.518 0.013*YLP 22.4 −0.15 530.2 −1.75 938.2 0.60 3.293 −0.017
Period I (1961–1995 for ZJS; 1961–1984 for YJP)ZJS 42.5 −0.58 552.2 −3.32 930.3 −0.21 2.714 −0.01YJP 62.3 −1.57 567.3 −3.25 915.7 −0.01 2.383 0.005
Period II (1996–2010 for ZJS; 1985–2010 for YJP)ZJS 25.0 −0.54 520.1 0.15 951.0 −1.50 3.028 0.027YJP 32.5 −0.54 510.4 0.40 926.4 0.73 2.728 0.021
The unit of Q, P and ET0 is mm; the slope unit of them is mm/yr. *p b 0.05; **p b 0.01.
83T. Ning et al. / Catena 147 (2016) 80–86
YLP. According to the Budyko framework, an increase in nwill increaseET0 and further decrease runoff.
The annual runoff in YLP did not occur abrupt change; however, thatin YJP and ZJS respectively changed abruptly in 1985 and 1996(p b 0.05). Therefore, the whole study period of 1961–2010 can be di-vided into two sub-periods to compare the values of environmental fac-tors and further qualitatively attribute the changes in runoff. Take ZJS asan example, although runoff decreased in both two sub-periods, precip-itation and parameter n decreased in the first sub-period while in-creased in the second sub-period. In general, upward trend inprecipitation should increase runoff while that in parameter n shoulddecrease runoff. However, the combined effect caused a downwardtrend in runoff, which implies that the changes in land surface mighthave greater impacts on runoff than those in precipitation.
3.2. Elasticity of runoff to environmental factors
The elasticity coefficients of runoff with respect to the potentialevapotranspiration, precipitation, and land surface are presented inTable 2 for the whole catchment and the sub-watersheds and for thewhole study period and the sub-periods. Overall, runoff was negativelycorrelated with ET0 and n but positively correlated with P. The absolutevalues of the three elasticity coefficients were the largest for P, interme-diate for ET0, and the smallest for n. The elasticity coefficients rangedfrom −1.96 to −3.00 for ET0, from 2.96 to 4.00 for P, and from −1.88to −2.69 for n. These ranges suggest that a 1% increase in ET0, P, or nwould result in a 1.96–3.00% decrease, 2.96–4.00% increase, or 1.88–2.69% decrease in runoff. However, spatiotemporal variations existedin the elasticity coefficients. Spatially, the variation in the elasticity
Table 2Elasticity coefficients of runoff to climate variables and catchment land surface conditionchanges.
εET0 εP εn
Whole periodZJS −2.44 3.44 −2.30YJP −2.15 3.15 −2.11YLP −3.00 4.00 −2.69
Period I (1961–1995 for ZJS; 1961–1984 for YJP)ZJS −2.34 3.34 −2.18YJP −1.96 2.96 −1.88
Period II (1996–2010 for ZJS; 1985–2010 for YJP)ZJS −2.74 3.74 −2.63YJP −2.42 3.42 −2.41
coefficients was the largest for YLP, intermediate for the whole catch-ment ZJS, and the smallest for YJP. The coefficients were greater in thesecond sub-period than in the first sub-period.
To further assess the temporal evolution of the impacts of climatechange and land surface change on runoff, the annual elasticity coeffi-cients for the period of 1961–2010 for the three stations were deter-mined and are presented in Fig. 2. The absolute values of εET0 and εPincreased in YJP and ZJS but decreased in YLP, which suggests that Q be-came more sensitive to climate change in YJP and ZJS but less sensitivein YLP. The absolute values of εn all increased significantly for the threehydrological stations, which suggests that Q became more sensitive tovariation in the land surface conditions.
3.3. Attribution of temporal changes in runoff
The changes in runoff due to climate change (ET0 and P) and landsurface alteration (n) were estimated using Eqs. (6)-(8), and the resultsare shown in Table 3. The calculated changes in Q (C_(Q)) were verysimilar to the observedQ trend (L_(Q)),which suggests that themethodused was effective in assessing the contributions of the relevant envi-ronment factors to the runoff variation. For theperiod of 1961–2010, cli-mate change and land surface alteration both decreased runoff in ZJSand YJP, and changes in Pmade the greatest contributions to the runoffchanges (76% and 86% for ZJS and YJP, respectively). However, climatechange decreased runoff while land surface alteration increased runoffin YLP, and the contribution of the former change was greater thanthat of the latter change. The spatial variations in the land surfacewere possibly the dominant cause of the different change trends inrunoff.
Themain factors controlling the changes in runoff varied for the dif-ferent sub-periods. The runoff reduction in ZJS and YJP for Period I (thesub-period before abrupt change, 1961–1995 for ZJS and 1961–1984 forYJP) was controlled by changes in precipitation (the contributions ofwhich were 157% and 84%, respectively). However, land surface alter-ation became the dominant factor in ZJS and YJP for Period II (the periodafter abrupt change, 1996–2010 for ZJS and 1985–2010 for YJP). Thetemporal variations in the dominant factors controlling runoff suggestthat land surface alteration due to soil conservation measures becamemore pronounced.
4. Discussion
To assess the temporal variations in the sensitivity of runoff to cli-mate and land surface, the annual elasticity coefficients of Q with re-spect to ET0, P, and n were estimated by neglecting ΔS. Neglecting ΔSis reasonable for long-term analysis (Koster and Suarez 1999; Potterand Zhang 2009; Yang et al. 2007), but whether or not it is reasonable
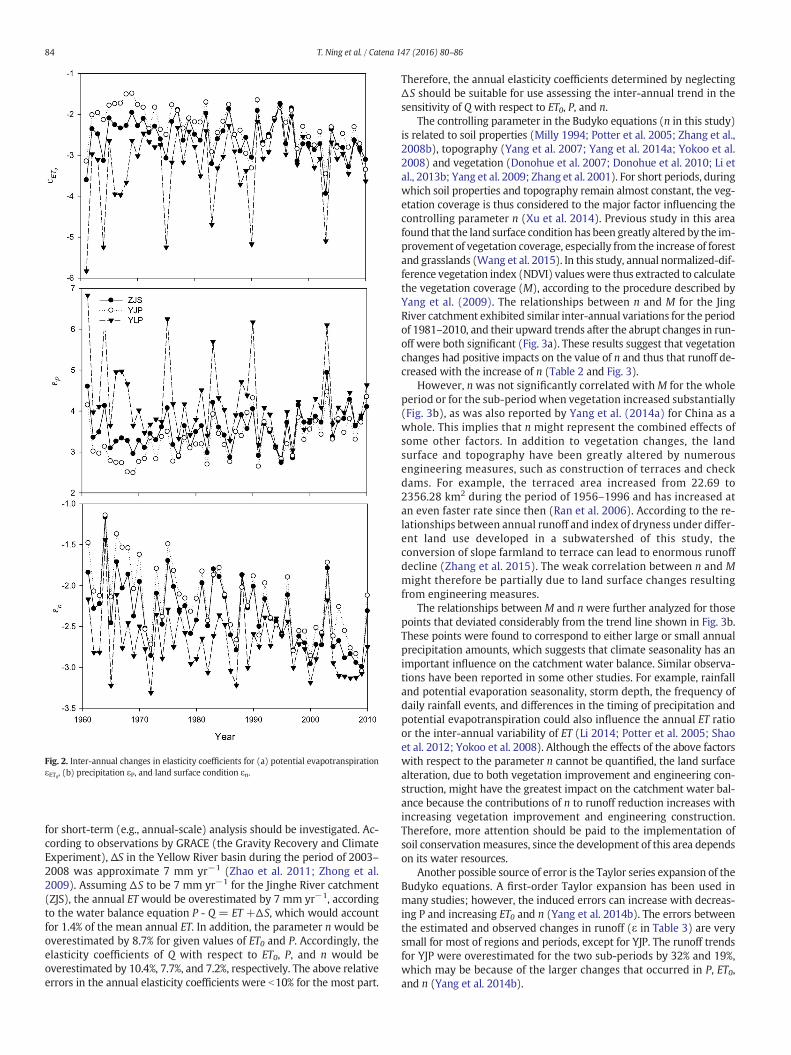
Fig. 2. Inter-annual changes in elasticity coefficients for (a) potential evapotranspirationεET0, (b) precipitation εP, and land surface condition εn.
84 T. Ning et al. / Catena 147 (2016) 80–86
for short-term (e.g., annual-scale) analysis should be investigated. Ac-cording to observations by GRACE (the Gravity Recovery and ClimateExperiment), ΔS in the Yellow River basin during the period of 2003–2008 was approximate 7 mm yr−1 (Zhao et al. 2011; Zhong et al.2009). Assuming ΔS to be 7 mm yr−1 for the Jinghe River catchment(ZJS), the annual ET would be overestimated by 7 mm yr−1, accordingto the water balance equation P - Q = ET +ΔS, which would accountfor 1.4% of the mean annual ET. In addition, the parameter n would beoverestimated by 8.7% for given values of ET0 and P. Accordingly, theelasticity coefficients of Q with respect to ET0, P, and n would beoverestimated by 10.4%, 7.7%, and 7.2%, respectively. The above relativeerrors in the annual elasticity coefficients were b10% for the most part.
Therefore, the annual elasticity coefficients determined by neglectingΔS should be suitable for use assessing the inter-annual trend in thesensitivity of Q with respect to ET0, P, and n.
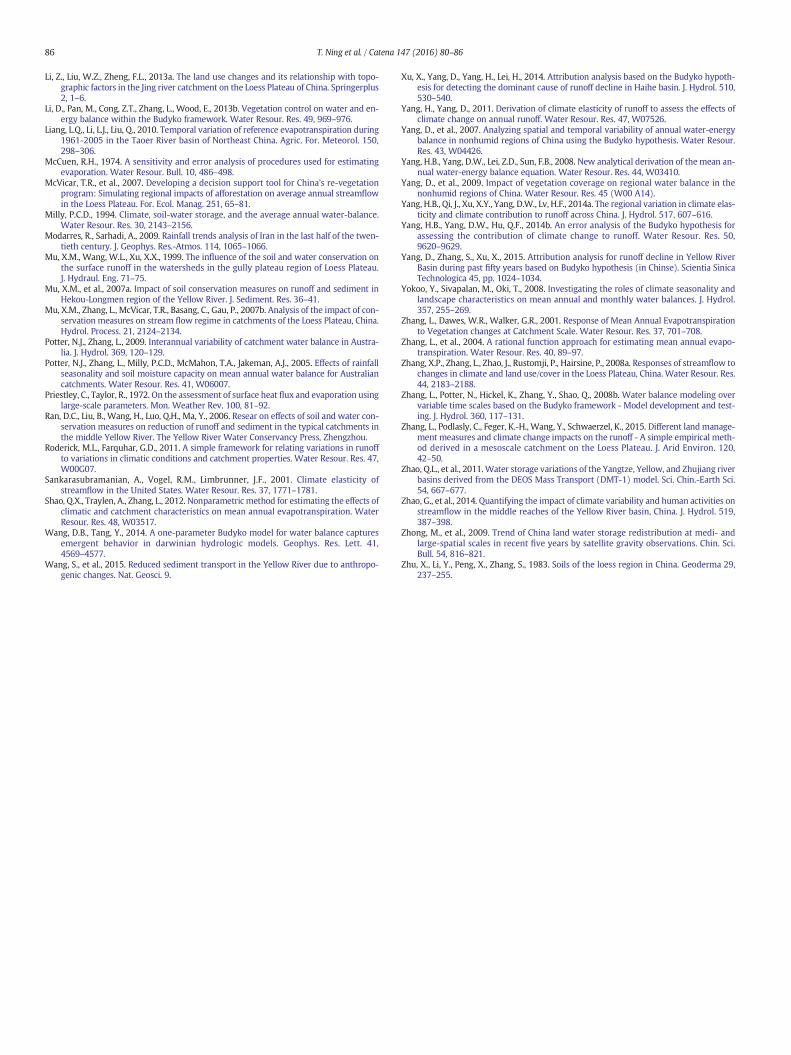
The controlling parameter in the Budyko equations (n in this study)is related to soil properties (Milly 1994; Potter et al. 2005; Zhang et al.,2008b), topography (Yang et al. 2007; Yang et al. 2014a; Yokoo et al.2008) and vegetation (Donohue et al. 2007; Donohue et al. 2010; Li etal., 2013b; Yang et al. 2009; Zhang et al. 2001). For short periods, duringwhich soil properties and topography remain almost constant, the veg-etation coverage is thus considered to the major factor influencing thecontrolling parameter n (Xu et al. 2014). Previous study in this areafound that the land surface condition has been greatly altered by the im-provement of vegetation coverage, especially from the increase of forestand grasslands (Wang et al. 2015). In this study, annual normalized-dif-ference vegetation index (NDVI) valueswere thus extracted to calculatethe vegetation coverage (M), according to the procedure described byYang et al. (2009). The relationships between n and M for the JingRiver catchment exhibited similar inter-annual variations for the periodof 1981–2010, and their upward trends after the abrupt changes in run-off were both significant (Fig. 3a). These results suggest that vegetationchanges had positive impacts on the value of n and thus that runoff de-creased with the increase of n (Table 2 and Fig. 3).
However, n was not significantly correlated withM for the wholeperiod or for the sub-period when vegetation increased substantially(Fig. 3b), as was also reported by Yang et al. (2014a) for China as awhole. This implies that n might represent the combined effects ofsome other factors. In addition to vegetation changes, the landsurface and topography have been greatly altered by numerousengineering measures, such as construction of terraces and checkdams. For example, the terraced area increased from 22.69 to2356.28 km2 during the period of 1956–1996 and has increased atan even faster rate since then (Ran et al. 2006). According to the re-lationships between annual runoff and index of dryness under differ-ent land use developed in a subwatershed of this study, theconversion of slope farmland to terrace can lead to enormous runoffdecline (Zhang et al. 2015). The weak correlation between n and Mmight therefore be partially due to land surface changes resultingfrom engineering measures.
The relationships between M and n were further analyzed for thosepoints that deviated considerably from the trend line shown in Fig. 3b.These points were found to correspond to either large or small annualprecipitation amounts, which suggests that climate seasonality has animportant influence on the catchment water balance. Similar observa-tions have been reported in some other studies. For example, rainfalland potential evaporation seasonality, storm depth, the frequency ofdaily rainfall events, and differences in the timing of precipitation andpotential evapotranspiration could also influence the annual ET ratioor the inter-annual variability of ET (Li 2014; Potter et al. 2005; Shaoet al. 2012; Yokoo et al. 2008). Although the effects of the above factorswith respect to the parameter n cannot be quantified, the land surfacealteration, due to both vegetation improvement and engineering con-struction, might have the greatest impact on the catchment water bal-ance because the contributions of n to runoff reduction increases withincreasing vegetation improvement and engineering construction.Therefore, more attention should be paid to the implementation ofsoil conservationmeasures, since the development of this area dependson its water resources.
Another possible source of error is the Taylor series expansion of theBudyko equations. A first-order Taylor expansion has been used inmany studies; however, the induced errors can increase with decreas-ing P and increasing ET0 and n (Yang et al. 2014b). The errors betweenthe estimated and observed changes in runoff (ε in Table 3) are verysmall for most of regions and periods, except for YJP. The runoff trendsfor YJP were overestimated for the two sub-periods by 32% and 19%,which may be because of the larger changes that occurred in P, ET0,and n (Yang et al. 2014b).
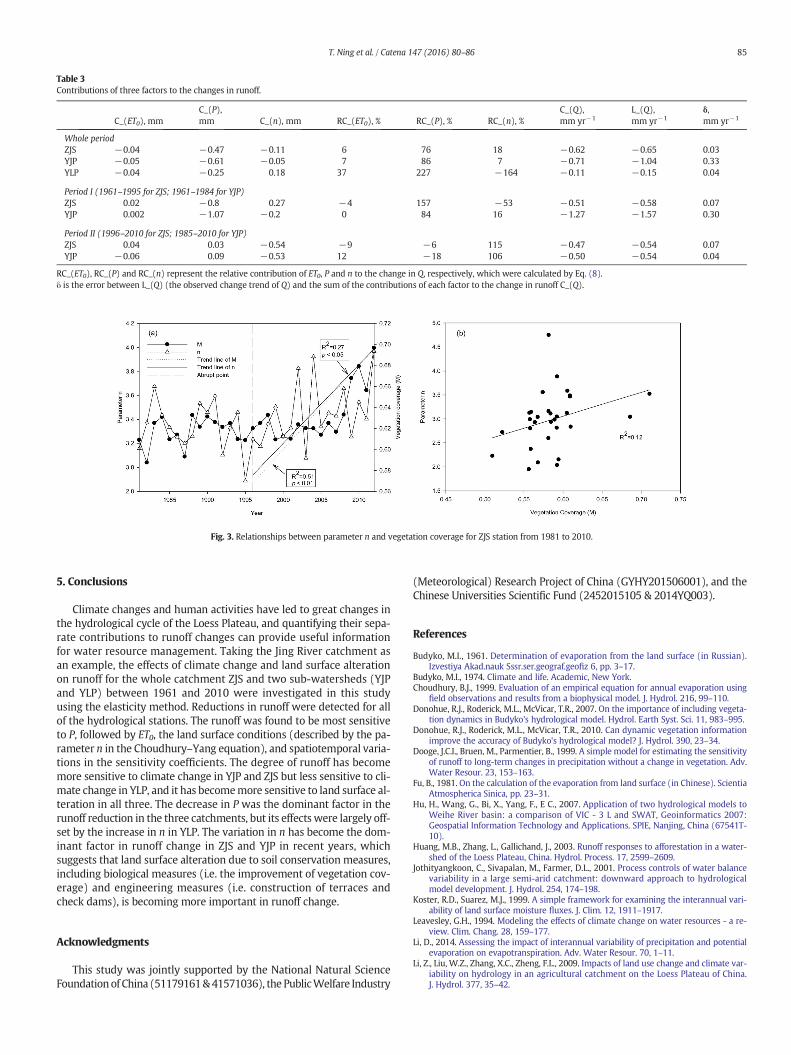
Fig. 3. Relationships between parameter n and vegetation coverage for ZJS station from 1981 to 2010.
Table 3Contributions of three factors to the changes in runoff.
C_(ET0), mmC_(P),mm C_(n), mm RC_(ET0), % RC_(P), % RC_(n), %
C_(Q),mm yr−1
L_(Q),mm yr−1
δ,mm yr−1
Whole periodZJS −0.04 −0.47 −0.11 6 76 18 −0.62 −0.65 0.03YJP −0.05 −0.61 −0.05 7 86 7 −0.71 −1.04 0.33YLP −0.04 −0.25 0.18 37 227 −164 −0.11 −0.15 0.04
Period I (1961–1995 for ZJS; 1961–1984 for YJP)ZJS 0.02 −0.8 0.27 −4 157 −53 −0.51 −0.58 0.07YJP 0.002 −1.07 −0.2 0 84 16 −1.27 −1.57 0.30
Period II (1996–2010 for ZJS; 1985–2010 for YJP)ZJS 0.04 0.03 −0.54 −9 −6 115 −0.47 −0.54 0.07YJP −0.06 0.09 −0.53 12 −18 106 −0.50 −0.54 0.04
RC_(ET0), RC_(P) and RC_(n) represent the relative contribution of ET0, P and n to the change in Q, respectively, which were calculated by Eq. (8).δ is the error between L_(Q) (the observed change trend of Q) and the sum of the contributions of each factor to the change in runoff C_(Q).
85T. Ning et al. / Catena 147 (2016) 80–86
5. Conclusions
Climate changes and human activities have led to great changes inthe hydrological cycle of the Loess Plateau, and quantifying their sepa-rate contributions to runoff changes can provide useful informationfor water resource management. Taking the Jing River catchment asan example, the effects of climate change and land surface alterationon runoff for the whole catchment ZJS and two sub-watersheds (YJPand YLP) between 1961 and 2010 were investigated in this studyusing the elasticity method. Reductions in runoff were detected for allof the hydrological stations. The runoff was found to be most sensitiveto P, followed by ET0, the land surface conditions (described by the pa-rameter n in the Choudhury–Yang equation), and spatiotemporal varia-tions in the sensitivity coefficients. The degree of runoff has becomemore sensitive to climate change in YJP and ZJS but less sensitive to cli-mate change in YLP, and it has becomemore sensitive to land surface al-teration in all three. The decrease in P was the dominant factor in therunoff reduction in the three catchments, but its effects were largely off-set by the increase in n in YLP. The variation in n has become the dom-inant factor in runoff change in ZJS and YJP in recent years, whichsuggests that land surface alteration due to soil conservation measures,including biological measures (i.e. the improvement of vegetation cov-erage) and engineering measures (i.e. construction of terraces andcheck dams), is becoming more important in runoff change.
Acknowledgments
This study was jointly supported by the National Natural ScienceFoundationof China (51179161&41571036), the PublicWelfare Industry
(Meteorological) Research Project of China (GYHY201506001), and theChinese Universities Scientific Fund (2452015105 & 2014YQ003).
References
Budyko, M.I., 1961. Determination of evaporation from the land surface (in Russian).Izvestiya Akad.nauk Sssr.ser.geograf.geofiz 6, pp. 3–17.
Budyko, M.I., 1974. Climate and life. Academic, New York.Choudhury, B.J., 1999. Evaluation of an empirical equation for annual evaporation using
field observations and results from a biophysical model. J. Hydrol. 216, 99–110.Donohue, R.J., Roderick, M.L., McVicar, T.R., 2007. On the importance of including vegeta-
tion dynamics in Budyko's hydrological model. Hydrol. Earth Syst. Sci. 11, 983–995.Donohue, R.J., Roderick, M.L., McVicar, T.R., 2010. Can dynamic vegetation information
improve the accuracy of Budyko's hydrological model? J. Hydrol. 390, 23–34.Dooge, J.C.I., Bruen, M., Parmentier, B., 1999. A simple model for estimating the sensitivity
of runoff to long-term changes in precipitation without a change in vegetation. Adv.Water Resour. 23, 153–163.
Fu, B., 1981. On the calculation of the evaporation from land surface (in Chinese). ScientiaAtmospherica Sinica, pp. 23–31.
Hu, H., Wang, G., Bi, X., Yang, F., E C., 2007. Application of two hydrological models toWeihe River basin: a comparison of VIC - 3 L and SWAT, Geoinformatics 2007:Geospatial Information Technology and Applications. SPIE, Nanjing, China (67541T-10).
Huang, M.B., Zhang, L., Gallichand, J., 2003. Runoff responses to afforestation in a water-shed of the Loess Plateau, China. Hydrol. Process. 17, 2599–2609.
Jothityangkoon, C., Sivapalan, M., Farmer, D.L., 2001. Process controls of water balancevariability in a large semi-arid catchment: downward approach to hydrologicalmodel development. J. Hydrol. 254, 174–198.
Koster, R.D., Suarez, M.J., 1999. A simple framework for examining the interannual vari-ability of land surface moisture fluxes. J. Clim. 12, 1911–1917.
Leavesley, G.H., 1994. Modeling the effects of climate change on water resources - a re-view. Clim. Chang. 28, 159–177.
Li, D., 2014. Assessing the impact of interannual variability of precipitation and potentialevaporation on evapotranspiration. Adv. Water Resour. 70, 1–11.
Li, Z., Liu, W.Z., Zhang, X.C., Zheng, F.L., 2009. Impacts of land use change and climate var-iability on hydrology in an agricultural catchment on the Loess Plateau of China.J. Hydrol. 377, 35–42.
86 T. Ning et al. / Catena 147 (2016) 80–86
Li, Z., Liu, W.Z., Zheng, F.L., 2013a. The land use changes and its relationship with topo-graphic factors in the Jing river catchment on the Loess Plateau of China. Springerplus2, 1–6.
Li, D., Pan, M., Cong, Z.T., Zhang, L., Wood, E., 2013b. Vegetation control on water and en-ergy balance within the Budyko framework. Water Resour. Res. 49, 969–976.
Liang, L.Q., Li, L.J., Liu, Q., 2010. Temporal variation of reference evapotranspiration during1961-2005 in the Taoer River basin of Northeast China. Agric. For. Meteorol. 150,298–306.
McCuen, R.H., 1974. A sensitivity and error analysis of procedures used for estimatingevaporation. Water Resour. Bull. 10, 486–498.
McVicar, T.R., et al., 2007. Developing a decision support tool for China's re-vegetationprogram: Simulating regional impacts of afforestation on average annual streamflowin the Loess Plateau. For. Ecol. Manag. 251, 65–81.
Milly, P.C.D., 1994. Climate, soil-water storage, and the average annual water-balance.Water Resour. Res. 30, 2143–2156.
Modarres, R., Sarhadi, A., 2009. Rainfall trends analysis of Iran in the last half of the twen-tieth century. J. Geophys. Res.-Atmos. 114, 1065–1066.
Mu, X.M., Wang, W.L., Xu, X.X., 1999. The influence of the soil and water conservation onthe surface runoff in the watersheds in the gully plateau region of Loess Plateau.J. Hydraul. Eng. 71–75.
Mu, X.M., et al., 2007a. Impact of soil conservation measures on runoff and sediment inHekou-Longmen region of the Yellow River. J. Sediment. Res. 36–41.
Mu, X.M., Zhang, L., McVicar, T.R., Basang, C., Gau, P., 2007b. Analysis of the impact of con-servation measures on stream flow regime in catchments of the Loess Plateau, China.Hydrol. Process. 21, 2124–2134.
Potter, N.J., Zhang, L., 2009. Interannual variability of catchment water balance in Austra-lia. J. Hydrol. 369, 120–129.
Potter, N.J., Zhang, L., Milly, P.C.D., McMahon, T.A., Jakeman, A.J., 2005. Effects of rainfallseasonality and soil moisture capacity on mean annual water balance for Australiancatchments. Water Resour. Res. 41, W06007.
Priestley, C., Taylor, R., 1972. On the assessment of surface heat flux and evaporation usinglarge-scale parameters. Mon. Weather Rev. 100, 81–92.
Ran, D.C., Liu, B., Wang, H., Luo, Q.H., Ma, Y., 2006. Resear on effects of soil and water con-servation measures on reduction of runoff and sediment in the typical catchments inthe middle Yellow River. The Yellow River Water Conservancy Press, Zhengzhou.
Roderick, M.L., Farquhar, G.D., 2011. A simple framework for relating variations in runoffto variations in climatic conditions and catchment properties. Water Resour. Res. 47,W00G07.
Sankarasubramanian, A., Vogel, R.M., Limbrunner, J.F., 2001. Climate elasticity ofstreamflow in the United States. Water Resour. Res. 37, 1771–1781.
Shao, Q.X., Traylen, A., Zhang, L., 2012. Nonparametric method for estimating the effects ofclimatic and catchment characteristics on mean annual evapotranspiration. WaterResour. Res. 48, W03517.
Wang, D.B., Tang, Y., 2014. A one-parameter Budyko model for water balance capturesemergent behavior in darwinian hydrologic models. Geophys. Res. Lett. 41,4569–4577.
Wang, S., et al., 2015. Reduced sediment transport in the Yellow River due to anthropo-genic changes. Nat. Geosci. 9.
Xu, X., Yang, D., Yang, H., Lei, H., 2014. Attribution analysis based on the Budyko hypoth-esis for detecting the dominant cause of runoff decline in Haihe basin. J. Hydrol. 510,530–540.
Yang, H., Yang, D., 2011. Derivation of climate elasticity of runoff to assess the effects ofclimate change on annual runoff. Water Resour. Res. 47, W07526.
Yang, D., et al., 2007. Analyzing spatial and temporal variability of annual water-energybalance in nonhumid regions of China using the Budyko hypothesis. Water Resour.Res. 43, W04426.
Yang, H.B., Yang, D.W., Lei, Z.D., Sun, F.B., 2008. New analytical derivation of the mean an-nual water-energy balance equation. Water Resour. Res. 44, W03410.
Yang, D., et al., 2009. Impact of vegetation coverage on regional water balance in thenonhumid regions of China. Water Resour. Res. 45 (W00 A14).
Yang, H.B., Qi, J., Xu, X.Y., Yang, D.W., Lv, H.F., 2014a. The regional variation in climate elas-ticity and climate contribution to runoff across China. J. Hydrol. 517, 607–616.
Yang, H.B., Yang, D.W., Hu, Q.F., 2014b. An error analysis of the Budyko hypothesis forassessing the contribution of climate change to runoff. Water Resour. Res. 50,9620–9629.
Yang, D., Zhang, S., Xu, X., 2015. Attribution analysis for runoff decline in Yellow RiverBasin during past fifty years based on Budyko hypothesis (in Chinse). Scientia SinicaTechnologica 45, pp. 1024–1034.
Yokoo, Y., Sivapalan, M., Oki, T., 2008. Investigating the roles of climate seasonality andlandscape characteristics on mean annual and monthly water balances. J. Hydrol.357, 255–269.
Zhang, L., Dawes, W.R., Walker, G.R., 2001. Response of Mean Annual Evapotranspirationto Vegetation changes at Catchment Scale. Water Resour. Res. 37, 701–708.
Zhang, L., et al., 2004. A rational function approach for estimating mean annual evapo-transpiration. Water Resour. Res. 40, 89–97.
Zhang, X.P., Zhang, L., Zhao, J., Rustomji, P., Hairsine, P., 2008a. Responses of streamflow tochanges in climate and land use/cover in the Loess Plateau, China. Water Resour. Res.44, 2183–2188.
Zhang, L., Potter, N., Hickel, K., Zhang, Y., Shao, Q., 2008b. Water balance modeling overvariable time scales based on the Budyko framework - Model development and test-ing. J. Hydrol. 360, 117–131.
Zhang, L., Podlasly, C., Feger, K.-H., Wang, Y., Schwaerzel, K., 2015. Different landmanage-ment measures and climate change impacts on the runoff - A simple empirical meth-od derived in a mesoscale catchment on the Loess Plateau. J. Arid Environ. 120,42–50.
Zhao, Q.L., et al., 2011.Water storage variations of the Yangtze, Yellow, and Zhujiang riverbasins derived from the DEOS Mass Transport (DMT-1) model. Sci. Chin.-Earth Sci.54, 667–677.
Zhao, G., et al., 2014. Quantifying the impact of climate variability and human activities onstreamflow in the middle reaches of the Yellow River basin, China. J. Hydrol. 519,387–398.
Zhong, M., et al., 2009. Trend of China land water storage redistribution at medi- andlarge-spatial scales in recent five years by satellite gravity observations. Chin. Sci.Bull. 54, 816–821.
Zhu, X., Li, Y., Peng, X., Zhang, S., 1983. Soils of the loess region in China. Geoderma 29,237–255.