Sepacore X50, Multivapor, Melting Point M-565 Separation ... · be synthesized from SA by acid...
7
084/2012 Sepacore X50, Multivapor, Melting Point M-565 Separation, concentration, and identification of aspirin and salicylic acid
Transcript of Sepacore X50, Multivapor, Melting Point M-565 Separation ... · be synthesized from SA by acid...
084/2012
Sepacore X50, Multivapor, Melting Point M-565
Separation, concentration, and identification of aspirin and salicylic acid
SHORT NOTE Separation, concentration, and identification of aspirin and
salicylic acid
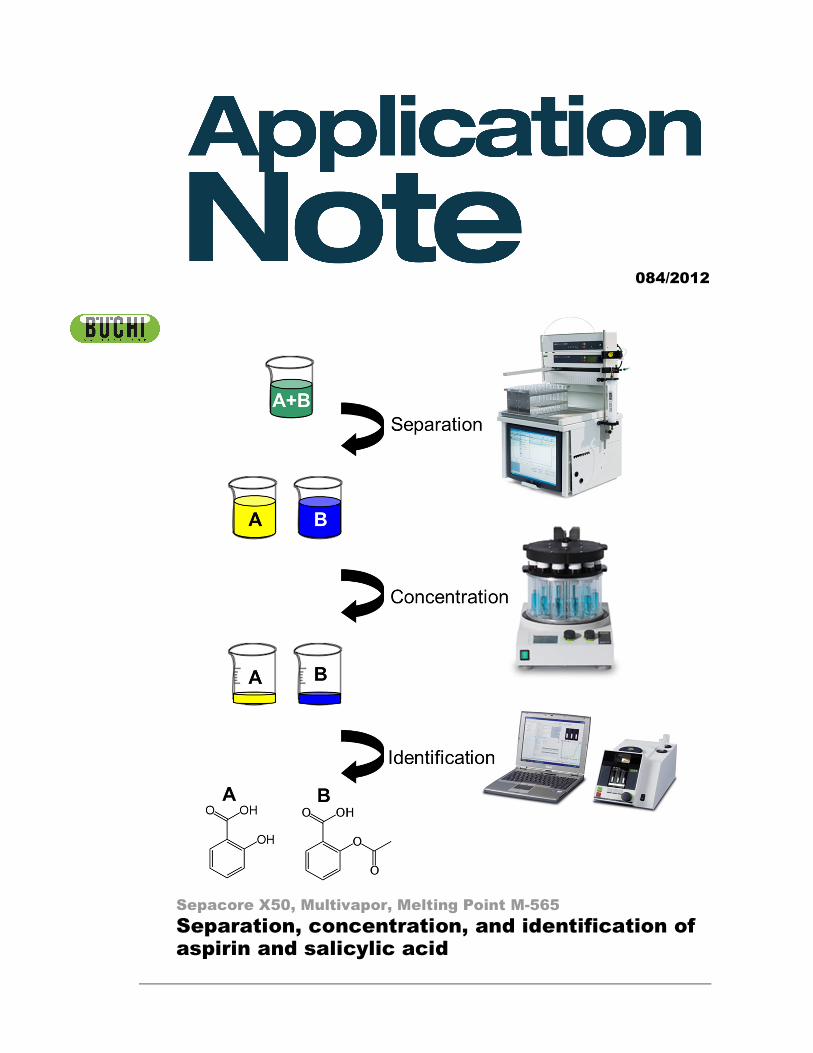
Work-up procedures of after chemical synthesis are indispensable but time consuming. Here we demonstrate a semi-automatized work-up procedure for the separation, concentration and identification of aspirine and salicylic acid.
Introduction
Separation and purification, concentration and identification of substances are indispensable steps in lab- and industrial scale chemical synthesis. Since these work-up procedures are often more time consuming, and thus more costly, than the reaction itself, they are true bottlenecks, for example in the pursuit of new drugs [1]. Furthermore, due to the many and repetitive steps, post reaction operations are sources of errors and sample confusion.
The aim of this note is to show how the separation, concentration and identification of multiple samples can be performed efficiently and reproducible. Therefore, flash chromatography is used for the product separation, parallel vortex evaporation for the concentration and melting point determination for identification. Employed BUCHI equipment was designed to automate these processes.
In an example case, aspirin (acetylsalicylic acid, ASA) and salicylic acid (SA) are separated from a liquid mixture, concentrated, dried and finally analysed by measuring the melting point.
Experimental
1 mM SA and 1 mM ASA were dissolved in 10 ml of a 3:1 vol. solution of cyclohexane:ethyl acetate, and 1 Vol. % of formic acid. Isocratic feed of the mobile phase to the cartridge was achieved by two independent controlled pumps C-605 and consisted of 75 vol % cyclohexane and 24 % ethyl acetate and 1 % formic acid.
The mobile phase flow rate for separation was 20 ml/min. Prior to the separation the cartridge was conditioned for 5 min using the same mobile phase. Separated substances were detected by a C-640 UV-Vis detector. For the detection the signal maxima at 303 nm for SA and 277 nm for ASA, were recorded in parallel.
From the chromatographic fractions containing the SA and ASA the solvent was removed by vortex evaporation. For evaporation the vacuum was reduced from 300-140 mbar in 5 min using a gradient function and evaporated to dryness at 140 mbar. Vortex speed was set to 7. Obtained samples were dried in the drying oven at 90 °C until a constant sample weight was obtained.
The melting process was recorded using the M-565 equipped with the Melting Point Monitor Software. A temperature gradient of 1 °C/min was applied and started about 10 °C below the expected melting point.
Results and Conclusion
Combination of the Sepacore X50 flash chromatography system, the Multivapor P-12 and the Melting Point M-565 led to an efficient and semi-automated work-up. Following key results were achieved:
� SA and ASA were successfully isolated from solution phase in high purity using flash chromatography; the separation process was finished in less than 10 minutes.
� Fractions of the isolated substances were automatically collected using two independent detection wavelengths.
� The solvents of the two fractions were evaporated by applying a vacuum gradient. No supervision was necessary and the process was finished within 20 minutes.
� Unambiguous identification of the substances was done by comparison of the measured melting point with the values from literature.
� It was demonstrated that the semi-automated processes widened the bottleneck for post synthetic processes by shortening the work-up time.
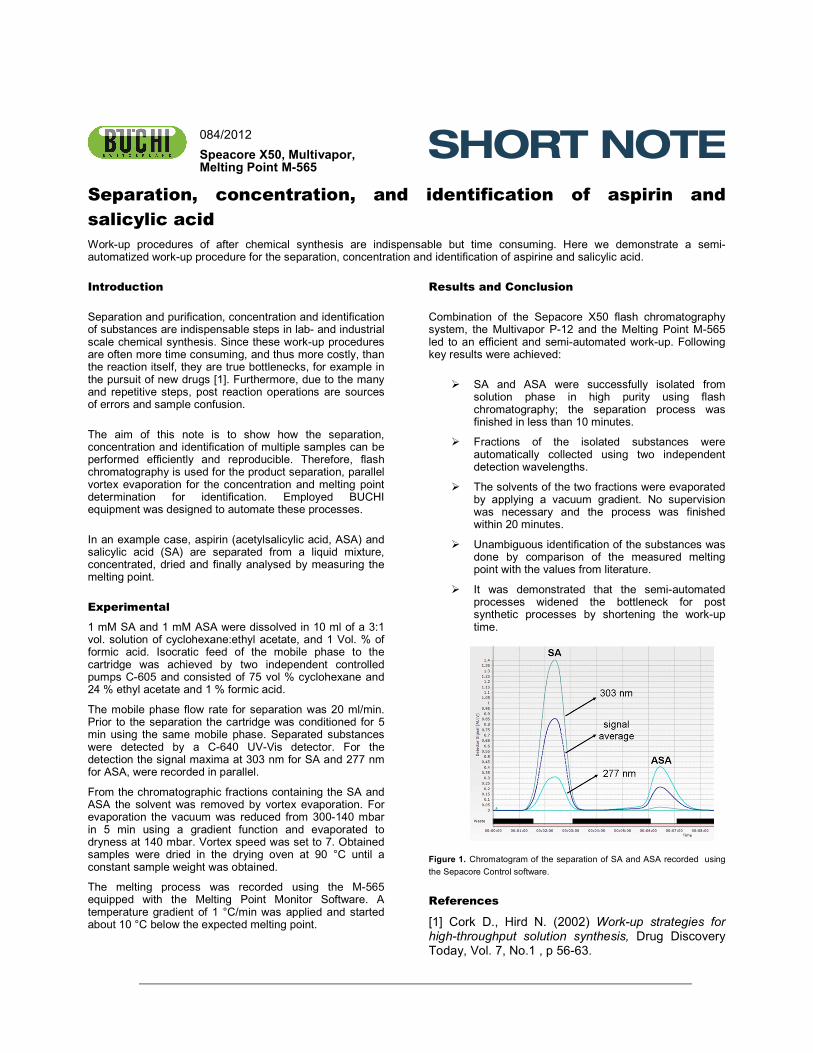
Figure 1. Chromatogram of the separation of SA and ASA recorded using
the Sepacore Control software.
References
[1] Cork D., Hird N. (2002) Work-up strategies for high-throughput solution synthesis, Drug Discovery Today, Vol. 7, No.1 , p 56-63.
084/2012
Speacore X50, Multivapor, Melting Point M-565
Application Note 084/2012 Version X, Copyright © 2012 Büchi Labortechnik AG 3/7
1 Introduction
Post reaction operations
Separation and purification, concentration and identification of substances are indispensable steps in lab- and industrial scale chemical synthesis. Since these work-up procedures are often more time consuming, and thus costly, than the reaction itself, they are true bottlenecks, for example in the pursuit of new drugs [1]. Furthermore, due to the many and repetitive steps, post reaction operations are sources of errors and sample confusion. The aim of this note is to show how the separation, concentration and identification of multiple samples can be performed efficiently and reproducible. Therefore, flash chromatography is used for the product separation, parallel vortex evaporation for the concentration and melting point determination for identification. Employed BUCHI equipment was designed to automate these processes. In an example case, aspirin (acetylsalicylic acid, ASA) and salicylic acid (SA) are separated from a liquid mixture, concentrated, dried and finally analysed by measuring the melting point.
Example case - salicylic acid and aspirin
ASA, well known for its analgesic, anti-platelet [2] and even anti-cancer effect [3], may be synthesized from SA by acid catalyzed esterification. It is claimed that an aspirin a day doubles the chances of a long life and aspirin is the most widely used drug in the world [4]. In Figure 1 the molecular structures of SA and ASA are shown. SA, a starting material for ASA production, is employed in the treatment of skin diseases and as food preservative. Industrially, SA is obtained by derivatization of benzene [5]. From this synthetic route it is obvious that SA is also the main contaminant in ASA.
Figure 1. Molecular structures of salicylic acid (SA) left and acetylsalicylic acid (ASA) right.
2 Equipment
− Sepacore Flash System X50 − Multivapor P-12 equipped with a vacuum pump V700, a vacuum controller
V-855, and a recirculating chiller F-105 − Analytical balance (accuracy +/- 0.1 mg) − Melting point analyzer M-565 with Melting Point Monitor software and sample
loader M-569 − Drying oven − Ultrasonic Bath
3 Chemicals and Materials
− Salicylic acid (>98% purity, Fluka) − o-acetylsalicylic acid (>99%, Fluka) − Cyclohexane (≥ 99%, Sigma-Aldrich) − Ethyl acetate (≥ 99.5%, Sigma-Aldrich)
Application Note 084/2012 Version X, Copyright © 2012 Büchi Labortechnik AG 4/7
− Formic acid (>99% purity, Merck) − Prepacked Flash-Columns (Sepacore Silica 25 g, BUCHI Labortechnik AG) − Filter (Paradisc 25TF, Whatman) − TLC Plates (Silica 60 on glass, Fluka)
4 Experimental
4.1 Sample Preparation
1 mM SA and 1 mM ASA were dissolved in 10 ml of a 3:1 vol. solution of cyclohexane:ethylacetate, and 1 Vol. % of formic acid. The solution was treated for 15 min in the ultrasonic bath. Before injection to the column, the solution was filtrated to remove re-precipitated substance.
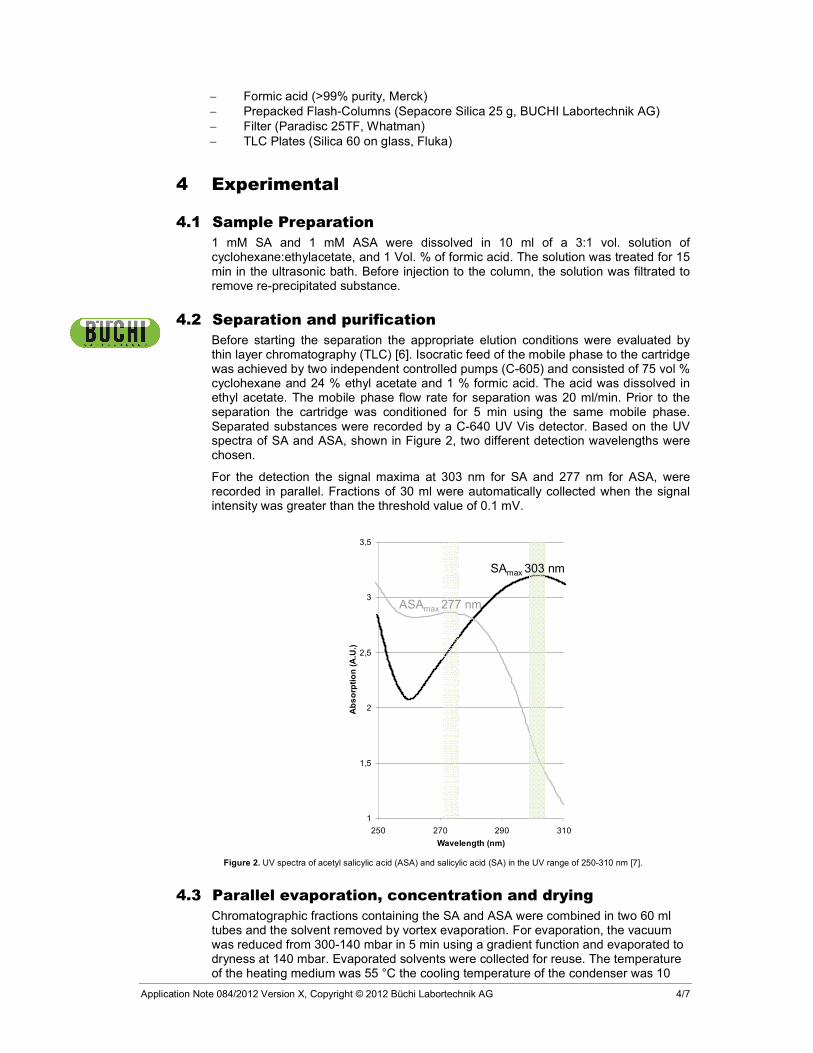
4.2 Separation and purification Before starting the separation the appropriate elution conditions were evaluated by thin layer chromatography (TLC) [6]. Isocratic feed of the mobile phase to the cartridge was achieved by two independent controlled pumps (C-605) and consisted of 75 vol % cyclohexane and 24 % ethyl acetate and 1 % formic acid. The acid was dissolved in ethyl acetate. The mobile phase flow rate for separation was 20 ml/min. Prior to the separation the cartridge was conditioned for 5 min using the same mobile phase. Separated substances were recorded by a C-640 UV Vis detector. Based on the UV spectra of SA and ASA, shown in Figure 2, two different detection wavelengths were chosen.
For the detection the signal maxima at 303 nm for SA and 277 nm for ASA, were recorded in parallel. Fractions of 30 ml were automatically collected when the signal intensity was greater than the threshold value of 0.1 mV.
Figure 2. UV spectra of acetyl salicylic acid (ASA) and salicylic acid (SA) in the UV range of 250-310 nm [7].
4.3 Parallel evaporation, concentration and drying Chromatographic fractions containing the SA and ASA were combined in two 60 ml tubes and the solvent removed by vortex evaporation. For evaporation, the vacuum was reduced from 300-140 mbar in 5 min using a gradient function and evaporated to dryness at 140 mbar. Evaporated solvents were collected for reuse. The temperature of the heating medium was 55 °C the cooling temperature of the condenser was 10
1
1,5
2
2,5
3
3,5
250 270 290 310
Wavelength (nm)
Absorption (A.U.)
ASAmax 277 nm
SAmax 303 nm
1
1,5
2
2,5
3
3,5
250 270 290 310
Wavelength (nm)
Absorption (A.U.)
ASAmax 277 nm
SAmax 303 nm
Application Note 084/2012 Version X, Copyright © 2012 Büchi Labortechnik AG 5/7
°C. Vortex speed was set to 7. As obtained samples were dried in the drying oven at 90 °C until a constant sample weight was obtained.
4.4 Melting point determination
The melting point of SA and ASA was measured for three samples in parallel and determined according to pharmacopoeia. The melting process was recorded using the Melting Point Monitor Software. A temperature gradient of 1 °C/min was applied and started about 10 °C below the expected melting point (see Table 1).
5 Results and Discussion
5.1 Separation and purification
From the thin liquid chromatogram obtained it was concluded that SA is eluting before ASA. Additionally, the retention factors (Rf) for SA (0.43) and ASA (0.25) as well as the difference in the Rf’s allow a good separation with a flash chromatographic system.
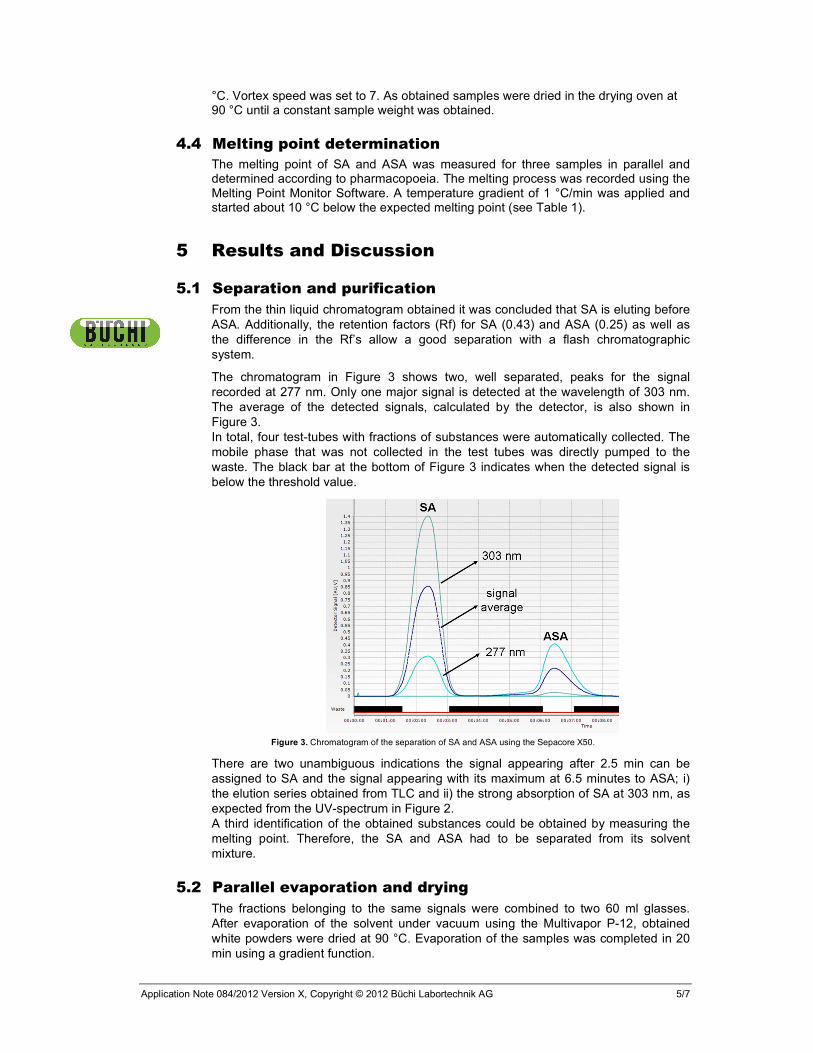
The chromatogram in Figure 3 shows two, well separated, peaks for the signal recorded at 277 nm. Only one major signal is detected at the wavelength of 303 nm. The average of the detected signals, calculated by the detector, is also shown in Figure 3. In total, four test-tubes with fractions of substances were automatically collected. The mobile phase that was not collected in the test tubes was directly pumped to the waste. The black bar at the bottom of Figure 3 indicates when the detected signal is below the threshold value.
Figure 3. Chromatogram of the separation of SA and ASA using the Sepacore X50.
There are two unambiguous indications the signal appearing after 2.5 min can be assigned to SA and the signal appearing with its maximum at 6.5 minutes to ASA; i) the elution series obtained from TLC and ii) the strong absorption of SA at 303 nm, as expected from the UV-spectrum in Figure 2. A third identification of the obtained substances could be obtained by measuring the melting point. Therefore, the SA and ASA had to be separated from its solvent mixture.
5.2 Parallel evaporation and drying
The fractions belonging to the same signals were combined to two 60 ml glasses. After evaporation of the solvent under vacuum using the Multivapor P-12, obtained white powders were dried at 90 °C. Evaporation of the samples was completed in 20 min using a gradient function.
Application Note 084/2012 Version X, Copyright © 2012 Büchi Labortechnik AG 6/7
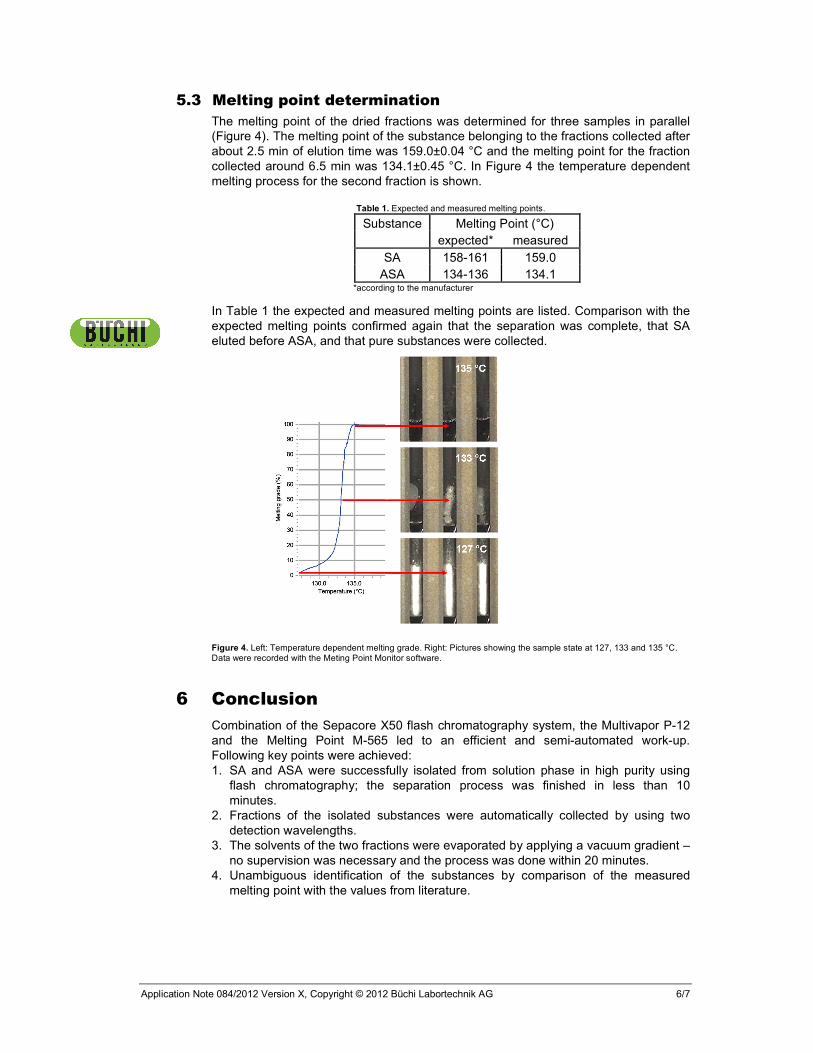
5.3 Melting point determination
The melting point of the dried fractions was determined for three samples in parallel (Figure 4). The melting point of the substance belonging to the fractions collected after about 2.5 min of elution time was 159.0±0.04 °C and the melting point for the fraction collected around 6.5 min was 134.1±0.45 °C. In Figure 4 the temperature dependent melting process for the second fraction is shown.
Table 1. Expected and measured melting points.
Substance Melting Point (°C)
expected* measured
SA 158-161 159.0
ASA 134-136 134.1 *according to the manufacturer
In Table 1 the expected and measured melting points are listed. Comparison with the expected melting points confirmed again that the separation was complete, that SA eluted before ASA, and that pure substances were collected.
Figure 4. Left: Temperature dependent melting grade. Right: Pictures showing the sample state at 127, 133 and 135 °C. Data were recorded with the Meting Point Monitor software.
6 Conclusion
Combination of the Sepacore X50 flash chromatography system, the Multivapor P-12 and the Melting Point M-565 led to an efficient and semi-automated work-up. Following key points were achieved: 1. SA and ASA were successfully isolated from solution phase in high purity using
flash chromatography; the separation process was finished in less than 10 minutes.
2. Fractions of the isolated substances were automatically collected by using two detection wavelengths.
3. The solvents of the two fractions were evaporated by applying a vacuum gradient – no supervision was necessary and the process was done within 20 minutes.
4. Unambiguous identification of the substances by comparison of the measured melting point with the values from literature.
Application Note 084/2012 Version X, Copyright © 2012 Büchi Labortechnik AG 7/7
It was demonstrated that the semi-automated processes widened the bottleneck for post synthetic processes. This will help to streamline and simplify laboratory work-up
procedures.
7 References
[1] Cork D., Hird N. (2002) Work-up strategies for high-throughput solution synthesis, Drug Discovery Today, Vol. 7, No.1 , p 56-63. [2] Lewis D.H. et al. (1983), Protective effects of aspirin against acute myocardial infarction and death in men with unstable angina — Results of a veterans administration cooperative study, N. Engl. J. Med. Vol. 309 p. 396-403.
[3] Langley R.E., et al. (2011), Aspirin and cancer: has aspirin been overlooked as an
adjuvant therapy?, Brit. J Cancer, Vol. 105, p. 1107-1113. [4] Vane J.R, Botting R.M. (2003), The mechanism of action of aspirin, Thrombosis Research, Vol. 110, p. 255-258. [5] Hoffman R (1991) In praise of synthesis, Am. Scientist, Vol. 79, p 11-14. [6] Talamona A (2005), Laboratory Chromatography Guide, Büchi Labortechnik AG, ISBN 3-033-00339-7. [7] SA UV spectrum: V. Talrose, E.B. Stern, A.A. Goncharova, N.A. Messineva, N.V. Trusova, M.V. Efimkina, "UV/Visible Spectra" in NIST Chemistry WebBook, NIST Standard Reference Database Number 69, Eds. P.J. Linstrom and W.G. Mallard, National Institute of Standards and Technology, Gaithersburg MD, 20899, http://webbook.nist.gov, (retrieved November 3, 2011). ASA UV spectrum, V. Talrose, A.N. Yermakov, A.A. Usov, A.A. Goncharova, A.N. Leskin, N.A. Messineva, N.V. Trusova, M.V. Efimkina, "UV/Visible Spectra" in NIST Chemistry WebBook, NIST Standard Reference Database Number 69, Eds. P.J. Linstrom and W.G. Mallard, National Institute of Standards and Technology, Gaithersburg MD, 20899, http://webbook.nist.gov, (retrieved November 3, 2011).
BÜCHI Labortechnik AG CH-9230 Flawil 1/Switzerland T +41 71 394 63 63 F +41 71 394 65 65 www.buchi.com Quality in your hands