Sep 02, 2015 Welspun India LtdSep 02, 2015 Welspun … Initiation Report Sep...Aniket Pande 040 -...
17
1 Consumer Discretionary - Apparel & Textile Products Sep 02, 2015 Welspun India Ltd India Research - Stock Broking BUY Bloomberg Code: WLSI IN Recommendation (Rs.) CMP (as on Sep 01, 2015) 758 Target Price 910 Upside (%) 20 Stock Information Mkt Cap (Rs.mn/US$ mn) 77037 / 1160 52-wk High/Low (Rs.) 963 / 210 3M Avg. daily volume (mn) 0.3 Beta (x) 0.9 Sensex/Nifty 25696 / 7788 O/S Shares(mn) 100.5 Face Value (Rs.) 10.0 Shareholding Pattern (%) Promoters 73.5 FIIs 6.1 DIIs 4.8 Others 15.7 Stock Performance (%) 1M 3M 6M 12M Absolute (8) 40 119 254 Relative to Sensex (5) 45 144 257 Source: Bloomberg Relative Performance* Source: Bloomberg; *Index 100 Analyst Contact Aniket Pande 040 - 3321 6277 [email protected] Weaving Innovation for Worldwide Clientele Leader in Home Textiles Market Welspun is one of the largest terry towel producers and is the second largest bed sheet producer. Welspun India is No:1 Home textile supplier to US for the third consecutive year. We expect the revenues to grow at 15% CAGR from FY15-FY17E on the back of strong volume growth, margins improvement, company’s size, focus on quality products and marquee big clients globally. Capacity Expansion and High utilization levels to aid the future growth Welspun plans to invest Rs.13 Bn over the next 12-18 months for modernization, automation and capacity enhancement for towels & sheets with focus on backward integration and debottlenecking. Welspun is expanding its capacity in towel, sheets and rugs. Anjar facility is the largest home textiles facility in Asia. With the growing capacity expansion, we expect the EBITDA margins and revenues to rise forward. Increasing sales of innovative products, brands and good product mix to drive growth in coming year A key differentiator for Welspun has been its focus on innovation and new product development. Currently, ~30% of FY15 sales comes from innovative technologies developed/owned by the company. Welspun India owns premium brands like Christy, Kinglsey; and Indian brands like Spaces and Welhome. Increasing revenues from innovative products and brands on the back of good product mix, will help to keep the EBITDA margins between 23%-25% for FY16E-FY17E. Valuation and Outlook At CMP Rs.758, the stock is trading at 7.3x and 5.9x FY16E & FY17E EV/ EBITDA respectively. We expect the new capacity addition, focus on innovative products, increase of branded sales and better product mix to drive the revenue for FY16E-17E. We initiate a “BUY” recommendation with a target price of Rs. 910 per share, which represents an upside potential of 20%. Key Risks y Global slowdown may impact demand conditions. y Increase in competition. y Foreign exchange risk. For private circulation only. For important information about Karvy’s rating system and other disclosures refer to the end of this material. Karvy Stock Broking Research is also available on Bloomberg, KRVY<GO>, Thomson Publishers & Reuters Exhibit 1: Valuation Summary (Rs. Mn) YE Mar (Rs. Mn) FY13 FY14 FY15 FY16E FY17E Net Sales 36473 44954 53025 59780 69562 EBITDA 5946 10435 12742 14351 17284 EBITDA Margin (%) 16.3 23.2 24.0 24.0 24.8 Adj. Net Profit 2248 2145 5398 5565 7599 EPS (Rs.) 22.5 21.4 53.7 55.4 75.7 RoE (%) 26.1 20.4 42.5 34.5 35.6 PE (x) 6.0 23.5 9.5 13.7 10.0 Source: Company, Karvy Research; *Represents multiples for FY13, FY14 & FY15 are based on historic market price 0 350 700 Aug-10 Aug-11 Aug-12 Aug-13 Aug-14 Aug-15 Welspun Sensex
Transcript of Sep 02, 2015 Welspun India LtdSep 02, 2015 Welspun … Initiation Report Sep...Aniket Pande 040 -...

1
Sep 02, 2015Welspun India LtdConsumer Discretionary - Apparel & Textile Products Sep 02, 2015
Welspun India LtdIndia Research - Stock Broking BUYBloomberg Code: WLSI IN
Recommendation (Rs.)
CMP (as on Sep 01, 2015) 758Target Price 910Upside (%) 20
Stock InformationMkt Cap (Rs.mn/US$ mn) 77037 / 116052-wk High/Low (Rs.) 963 / 2103M Avg. daily volume (mn) 0.3Beta (x) 0.9Sensex/Nifty 25696 / 7788O/S Shares(mn) 100.5Face Value (Rs.) 10.0
Shareholding Pattern (%) Promoters 73.5FIIs 6.1DIIs 4.8Others 15.7
Stock Performance (%) 1M 3M 6M 12M
Absolute (8) 40 119 254 Relative to Sensex (5) 45 144 257 Source: Bloomberg
Relative Performance*
Source: Bloomberg; *Index 100
Analyst ContactAniket Pande040 - 3321 [email protected]
Weaving Innovation for Worldwide Clientele
Leader in Home Textiles Market Welspun is one of the largest terry towel producers and is the second largest bed sheet producer. Welspun India is No:1 Home textile supplier to US for the third consecutive year. We expect the revenues to grow at 15% CAGR from FY15-FY17E on the back of strong volume growth, margins improvement, company’s size, focus on quality products and marquee big clients globally.
Capacity Expansion and High utilization levels to aid the future growthWelspun plans to invest Rs.13 Bn over the next 12-18 months for modernization, automation and capacity enhancement for towels & sheets with focus on backward integration and debottlenecking. Welspun is expanding its capacity in towel, sheets and rugs. Anjar facility is the largest home textiles facility in Asia. With the growing capacity expansion, we expect the EBITDA margins and revenues to rise forward.
Increasing sales of innovative products, brands and good product mix to drive growth in coming yearA key differentiator for Welspun has been its focus on innovation and new product development. Currently, ~30% of FY15 sales comes from innovative technologies developed/owned by the company. Welspun India owns premium brands like Christy, Kinglsey; and Indian brands like Spaces and Welhome. Increasing revenues from innovative products and brands on the back of good product mix, will help to keep the EBITDA margins between 23%-25% for FY16E-FY17E.
Valuation and Outlook At CMP Rs.758, the stock is trading at 7.3x and 5.9x FY16E & FY17E EV/EBITDA respectively. We expect the new capacity addition, focus on innovative products, increase of branded sales and better product mix to drive the revenue for FY16E-17E. We initiate a “BUY” recommendation with a target price of Rs. 910 per share, which represents an upside potential of 20%.
Key Risksyy Global slowdown may impact demand conditions.yy Increase in competition.yy Foreign exchange risk.
For private circulation only. For important information about Karvy’s rating system and other disclosures refer to the end of this material. Karvy Stock Broking Research is also available on Bloomberg, KRVY<GO>, Thomson Publishers & Reuters
Exhibit 1: Valuation Summary (Rs. Mn)
YE Mar (Rs. Mn) FY13 FY14 FY15 FY16E FY17E
Net Sales 36473 44954 53025 59780 69562 EBITDA 5946 10435 12742 14351 17284 EBITDA Margin (%) 16.3 23.2 24.0 24.0 24.8Adj. Net Profit 2248 2145 5398 5565 7599 EPS (Rs.) 22.5 21.4 53.7 55.4 75.7RoE (%) 26.1 20.4 42.5 34.5 35.6PE (x) 6.0 23.5 9.5 13.7 10.0Source: Company, Karvy Research; *Represents multiples for FY13, FY14 & FY15 are based on historic market price
0
350
700
Aug
-10
Aug
-11
Aug
-12
Aug
-13
Aug
-14
Aug
-15
Welspun Sensex
2
Sep 02, 2015Welspun India Ltd
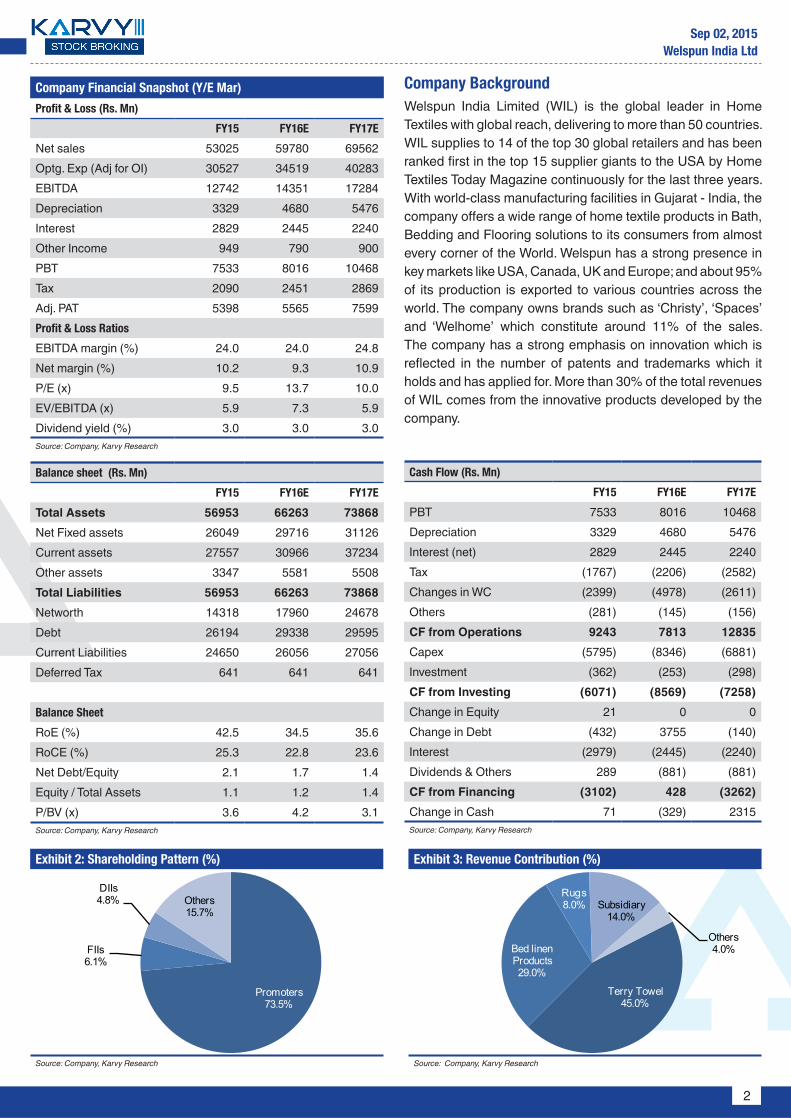
Company BackgroundWelspun India Limited (WIL) is the global leader in Home Textiles with global reach, delivering to more than 50 countries. WIL supplies to 14 of the top 30 global retailers and has been ranked first in the top 15 supplier giants to the USA by Home Textiles Today Magazine continuously for the last three years. With world-class manufacturing facilities in Gujarat - India, the company offers a wide range of home textile products in Bath, Bedding and Flooring solutions to its consumers from almost every corner of the World. Welspun has a strong presence in key markets like USA, Canada, UK and Europe; and about 95% of its production is exported to various countries across the world. The company owns brands such as ‘Christy’, ‘Spaces’ and ‘Welhome’ which constitute around 11% of the sales. The company has a strong emphasis on innovation which is reflected in the number of patents and trademarks which it holds and has applied for. More than 30% of the total revenues of WIL comes from the innovative products developed by the company.
Exhibit 2: Shareholding Pattern (%)
Source: Company, Karvy Research
Exhibit 3: Revenue Contribution (%)
Source: Company, Karvy Research
Balance sheet (Rs. Mn)
FY15 FY16E FY17E
Total Assets 56953 66263 73868 Net Fixed assets 26049 29716 31126 Current assets 27557 30966 37234 Other assets 3347 5581 5508 Total Liabilities 56953 66263 73868 Networth 14318 17960 24678 Debt 26194 29338 29595 Current Liabilities 24650 26056 27056 Deferred Tax 641 641 641
Balance Sheet
RoE (%) 42.5 34.5 35.6RoCE (%) 25.3 22.8 23.6Net Debt/Equity 2.1 1.7 1.4Equity / Total Assets 1.1 1.2 1.4P/BV (x) 3.6 4.2 3.1Source: Company, Karvy Research
Cash Flow (Rs. Mn)
FY15 FY16E FY17E
PBT 7533 8016 10468 Depreciation 3329 4680 5476 Interest (net) 2829 2445 2240 Tax (1767) (2206) (2582)Changes in WC (2399) (4978) (2611)Others (281) (145) (156)CF from Operations 9243 7813 12835 Capex (5795) (8346) (6881)Investment (362) (253) (298)CF from Investing (6071) (8569) (7258)Change in Equity 21 0 0 Change in Debt (432) 3755 (140)Interest (2979) (2445) (2240)Dividends & Others 289 (881) (881)CF from Financing (3102) 428 (3262)Change in Cash 71 (329) 2315 Source: Company, Karvy Research
Company Financial Snapshot (Y/E Mar)
Profit & Loss (Rs. Mn)
FY15 FY16E FY17E
Net sales 53025 59780 69562 Optg. Exp (Adj for OI) 30527 34519 40283 EBITDA 12742 14351 17284 Depreciation 3329 4680 5476 Interest 2829 2445 2240 Other Income 949 790 900 PBT 7533 8016 10468 Tax 2090 2451 2869 Adj. PAT 5398 5565 7599 Profit & Loss Ratios
EBITDA margin (%) 24.0 24.0 24.8Net margin (%) 10.2 9.3 10.9P/E (x) 9.5 13.7 10.0EV/EBITDA (x) 5.9 7.3 5.9Dividend yield (%) 3.0 3.0 3.0Source: Company, Karvy Research
Promoters73.5%
FIIs6.1%
DIIs4.8% Others
15.7%
Terry Towel45.0%
Bed linen Products29.0%
Rugs8.0% Subsidiary
14.0%
Others4.0%
3
Sep 02, 2015Welspun India Ltd
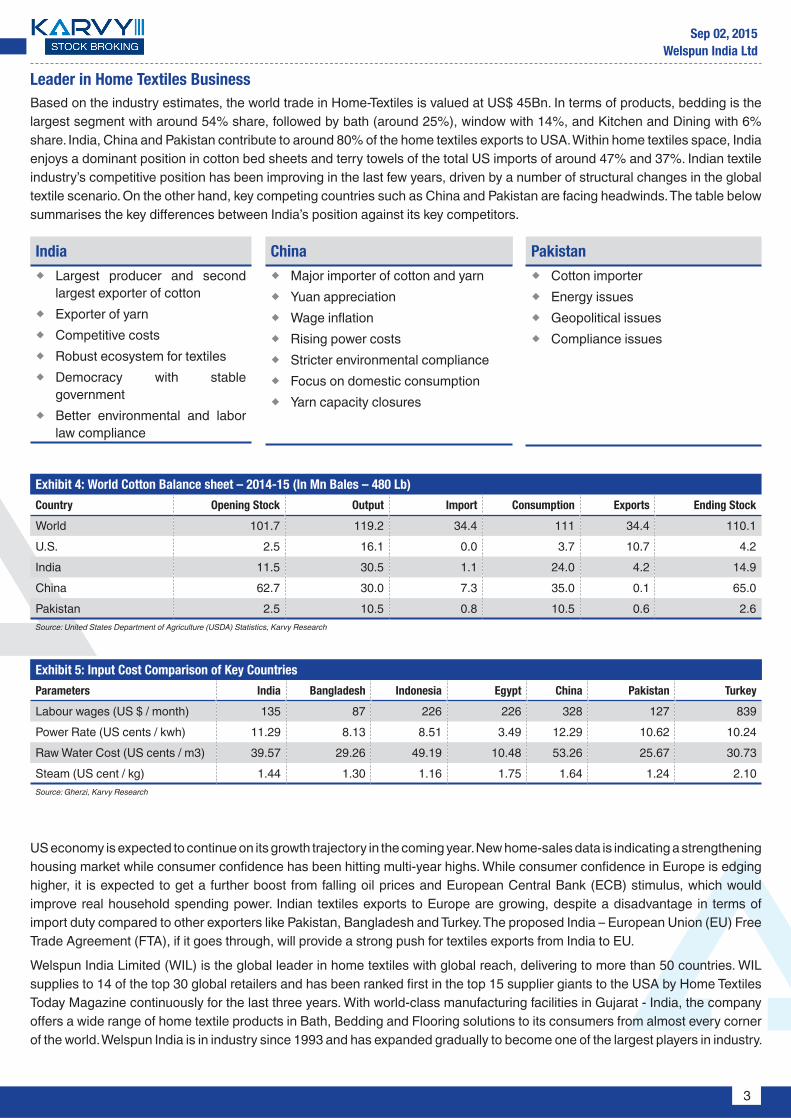
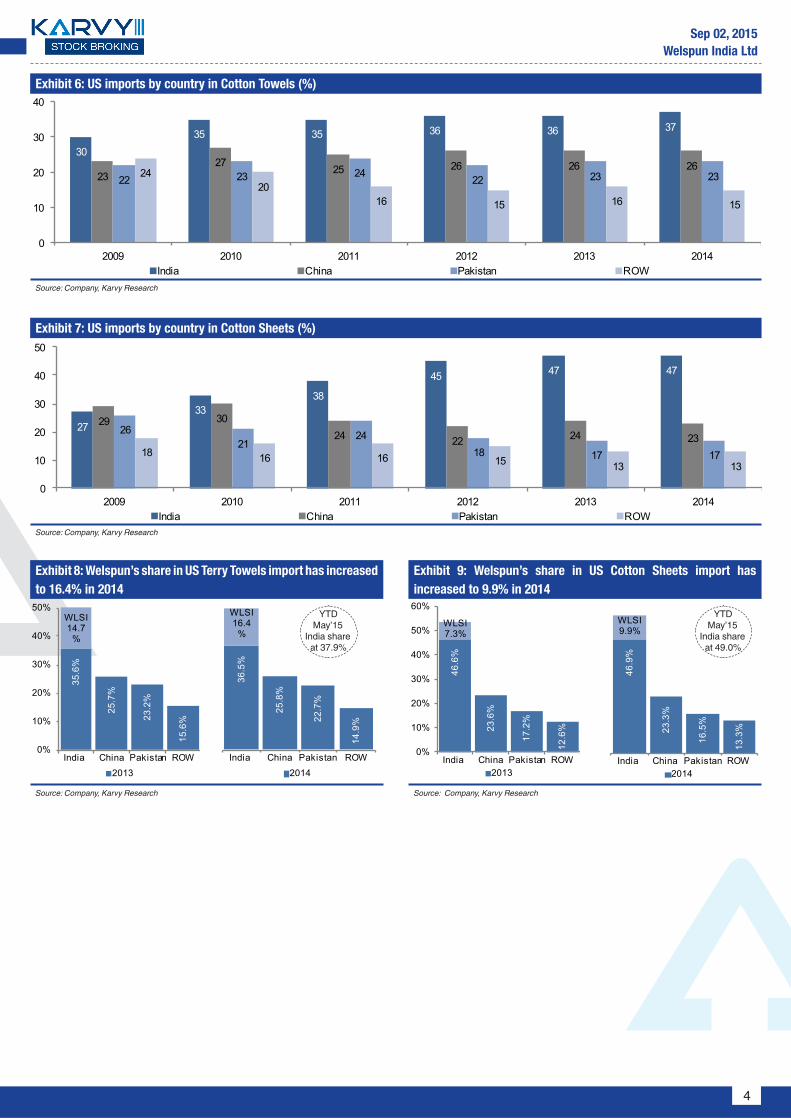
Leader in Home Textiles Business Based on the industry estimates, the world trade in Home-Textiles is valued at US$ 45Bn. In terms of products, bedding is the largest segment with around 54% share, followed by bath (around 25%), window with 14%, and Kitchen and Dining with 6% share. India, China and Pakistan contribute to around 80% of the home textiles exports to USA. Within home textiles space, India enjoys a dominant position in cotton bed sheets and terry towels of the total US imports of around 47% and 37%. Indian textile industry’s competitive position has been improving in the last few years, driven by a number of structural changes in the global textile scenario. On the other hand, key competing countries such as China and Pakistan are facing headwinds. The table below summarises the key differences between India’s position against its key competitors.
US economy is expected to continue on its growth trajectory in the coming year. New home-sales data is indicating a strengthening housing market while consumer confidence has been hitting multi-year highs. While consumer confidence in Europe is edging higher, it is expected to get a further boost from falling oil prices and European Central Bank (ECB) stimulus, which would improve real household spending power. Indian textiles exports to Europe are growing, despite a disadvantage in terms of import duty compared to other exporters like Pakistan, Bangladesh and Turkey. The proposed India – European Union (EU) Free Trade Agreement (FTA), if it goes through, will provide a strong push for textiles exports from India to EU.
Welspun India Limited (WIL) is the global leader in home textiles with global reach, delivering to more than 50 countries. WIL supplies to 14 of the top 30 global retailers and has been ranked first in the top 15 supplier giants to the USA by Home Textiles Today Magazine continuously for the last three years. With world-class manufacturing facilities in Gujarat - India, the company offers a wide range of home textile products in Bath, Bedding and Flooring solutions to its consumers from almost every corner of the world. Welspun India is in industry since 1993 and has expanded gradually to become one of the largest players in industry.
India � Largest producer and second
largest exporter of cotton � Exporter of yarn � Competitive costs � Robust ecosystem for textiles � Democracy with stable
government � Better environmental and labor
law compliance
China � Major importer of cotton and yarn � Yuan appreciation � Wage inflation � Rising power costs � Stricter environmental compliance � Focus on domestic consumption � Yarn capacity closures
Pakistan � Cotton importer � Energy issues � Geopolitical issues � Compliance issues
Exhibit 4: World Cotton Balance sheet – 2014-15 (In Mn Bales – 480 Lb)
Country Opening Stock Output Import Consumption Exports Ending Stock
World 101.7 119.2 34.4 111 34.4 110.1U.S. 2.5 16.1 0.0 3.7 10.7 4.2India 11.5 30.5 1.1 24.0 4.2 14.9China 62.7 30.0 7.3 35.0 0.1 65.0Pakistan 2.5 10.5 0.8 10.5 0.6 2.6Source: United States Department of Agriculture (USDA) Statistics, Karvy Research
Exhibit 5: Input Cost Comparison of Key Countries
Parameters India Bangladesh Indonesia Egypt China Pakistan Turkey
Labour wages (US $ / month) 135 87 226 226 328 127 839Power Rate (US cents / kwh) 11.29 8.13 8.51 3.49 12.29 10.62 10.24Raw Water Cost (US cents / m3) 39.57 29.26 49.19 10.48 53.26 25.67 30.73Steam (US cent / kg) 1.44 1.30 1.16 1.75 1.64 1.24 2.10Source: Gherzi, Karvy Research
4
Sep 02, 2015Welspun India Ltd
Exhibit 6: US imports by country in Cotton Towels (%)
Source: Company, Karvy Research
Exhibit 7: US imports by country in Cotton Sheets (%)
Source: Company, Karvy Research
Exhibit 8: Welspun’s share in US Terry Towels import has increased to 16.4% in 2014
Source: Company, Karvy Research
Exhibit 9: Welspun’s share in US Cotton Sheets import has increased to 9.9% in 2014
Source: Company, Karvy Research
3035 35 36 36 37
2327 25 26 26 26
22 23 24 22 23 232420
16 15 16 15
0
10
20
30
40
2009 2010 2011 2012 2013 2014India China Pakistan ROW
2733
38
45 47 47
29 3024 22 24 23
2621
2418 17 1718 16 16 15 13 13
0
10
20
30
40
50
2009 2010 2011 2012 2013 2014India China Pakistan ROW
35.6
%
25.7
%
23.2
%
15.6
%
WLSI14.7
%
0%
10%
20%
30%
40%
50%
India China Pakistan ROW2013
36.5
%
25.8
%
22.7
%
14.9
%
WLSI16.4
%
India China Pakistan ROW2014
46.6
%
23.6
%
17.2
%
12.6
%
WLSI7.3%
0%
10%
20%
30%
40%
50%
60%
India China Pakistan ROW2013
46.9
%
23.3
%
16.5
%
13.3
%
WLSI9.9%
India China Pakistan ROW2014
YTD May’15
India share at 37.9%
YTD May’15
India share at 49.0%
5
Sep 02, 2015Welspun India Ltd
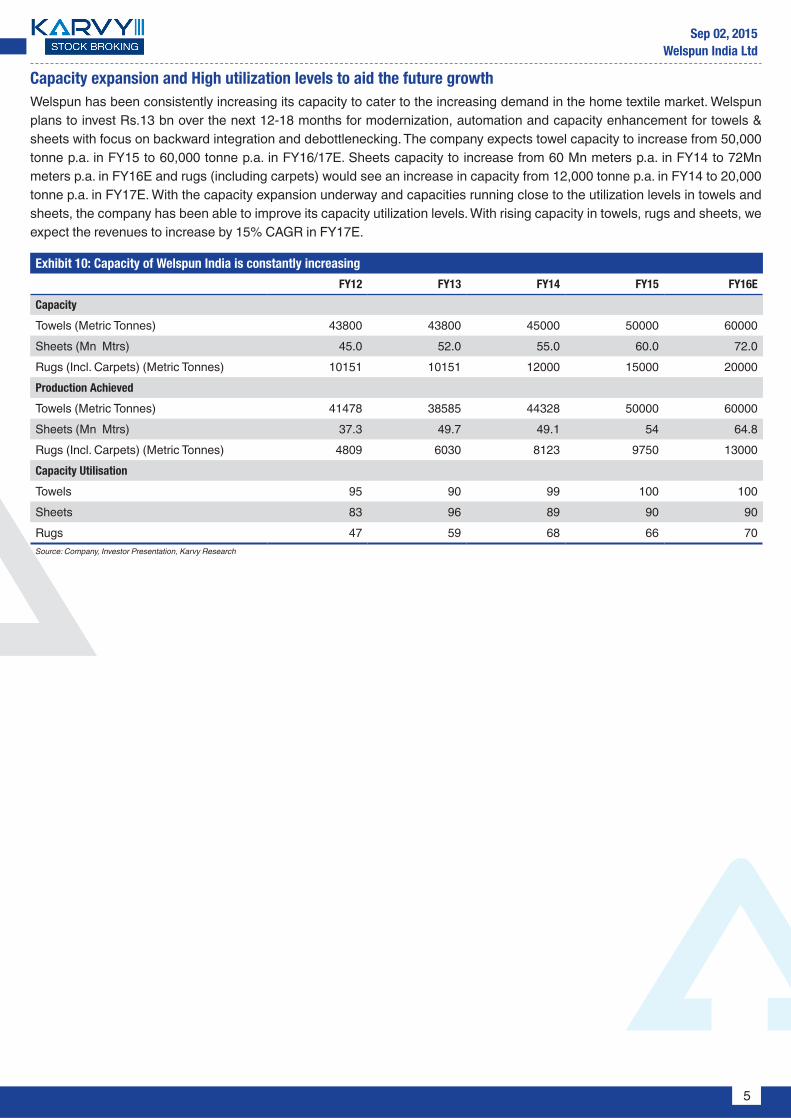
Capacity expansion and High utilization levels to aid the future growthWelspun has been consistently increasing its capacity to cater to the increasing demand in the home textile market. Welspun plans to invest Rs.13 bn over the next 12-18 months for modernization, automation and capacity enhancement for towels & sheets with focus on backward integration and debottlenecking. The company expects towel capacity to increase from 50,000 tonne p.a. in FY15 to 60,000 tonne p.a. in FY16/17E. Sheets capacity to increase from 60 Mn meters p.a. in FY14 to 72Mn meters p.a. in FY16E and rugs (including carpets) would see an increase in capacity from 12,000 tonne p.a. in FY14 to 20,000 tonne p.a. in FY17E. With the capacity expansion underway and capacities running close to the utilization levels in towels and sheets, the company has been able to improve its capacity utilization levels. With rising capacity in towels, rugs and sheets, we expect the revenues to increase by 15% CAGR in FY17E.
Exhibit 10: Capacity of Welspun India is constantly increasing
FY12 FY13 FY14 FY15 FY16E
Capacity
Towels (Metric Tonnes) 43800 43800 45000 50000 60000Sheets (Mn Mtrs) 45.0 52.0 55.0 60.0 72.0Rugs (Incl. Carpets) (Metric Tonnes) 10151 10151 12000 15000 20000Production Achieved
Towels (Metric Tonnes) 41478 38585 44328 50000 60000Sheets (Mn Mtrs) 37.3 49.7 49.1 54 64.8Rugs (Incl. Carpets) (Metric Tonnes) 4809 6030 8123 9750 13000Capacity Utilisation
Towels 95 90 99 100 100Sheets 83 96 89 90 90Rugs 47 59 68 66 70Source: Company, Investor Presentation, Karvy Research

6
Sep 02, 2015Welspun India Ltd
Increasing sales of innovative products and brands to drive growth in coming yearA key differentiator for Welspun has been its focus on innovation and new product development. The company has twelve patents (including granted as well as pending) to its credit. Currently, ~30% of FY15 sales comes from innovative technologies developed/owned by the company. It usually takes nine months to launch an innovative product. Innovative products accounted for 31.0% of overall revenue in FY15, surging from 19.6% in FY11. Some of these innovations include ‘Hygro® Cotton’ (ultrasoft, ultra absorbent, quick drying etc.) and ‘Flexifit’ sheets (fits a range of mattress sizes).The Hygro cotton yarn is a new proprietary spinning technology for the yarn and has been patented internationally. This breakthrough Hygro comfort yarn technology by Welspun India will not only prove to be an innovation in the world of home textiles but will also lead to a range of products that are driven by performance and superior quality. Apart from product innovation, the company continuously works on process innovation and launching nation-wide campaign in US to introduce patented Hygro® Cotton technology to consumers; first ever such campaign in textiles in the past 15 years.
India’s market share in global home textile exports ($45 Bn) currently stands at 11% as it is benefitting from the increasing competitiveness of the different manufacturers in India. In India, Welspun is the largest terry towel producer having a capacity of 45,000 tonne p.a. and is the second largest bed sheet producer with a capacity of 55 Mn metres p.a. in FY14. Welspun India also maintained its position as the No:1 Home textile supplier to the US for the third consecutive year, based on the rankings published by Home Textiles Today (HTT) in January 2015. Welspun has grown over a CAGR of 26% from FY11 to FY15 on the back of the company’s size, focus on quality products and long standing relationships with key clients globally.
Towels � Hygro® Cotton � Nanospun™ Towels � SpotStop™ Ecolite � Loftdry® � Neosoft® � Denim & Lycra
Sheets � Hygro® Cotton � Best Ever Sheet™ � Eversmooth™ � StayWhite™ � Flexifit® � Cotton Naturals
Rugs � Hygro®Cotton � Drylon® Microfiber � Kushlon™ Rugs � Resilon® Rugs � Permaback™ � Reopet™
Top of Bed � Hygro® Cotton � SoftShield™ � WelLoft � MaxGrip™ � Good Night � Sleep®
Properties of Hygro® Cotton: Hygro® Cotton is patented spinning technology that uses a hollow core cotton yarn. The fabric made from Hygro cotton is ultra soft, ultra absorpent and plumps up after every wash, thus maintaining its soft and plush feel. It ensures that your bed linen naturally calibrates air flow to maintain even temperature and consistency.
Exhibit 11: Products
Bath Bedding Flooring
Towels Beddings CarpetsBath Robes Top of Bed Rugs
Basic and Fashion Bedding
Source: Company, Investor Presentation, Karvy Research
Exhibit 12: Global Clientele
USA Europe UK
Wal Mart Ikea ASDABed Bath & Beyond Carrefour TescoMacy’s JYSK Marks & SpencerJ C Penney El Corte Ingles DebenhamsTarget Vincenzo Zucchi S.p.A House of FrazerKohl’s Bassetti ChristyK Mart-Sears Auchan Sainsburry Source: Company, Investor Presentation, Karvy Research
7
Sep 02, 2015Welspun India Ltd
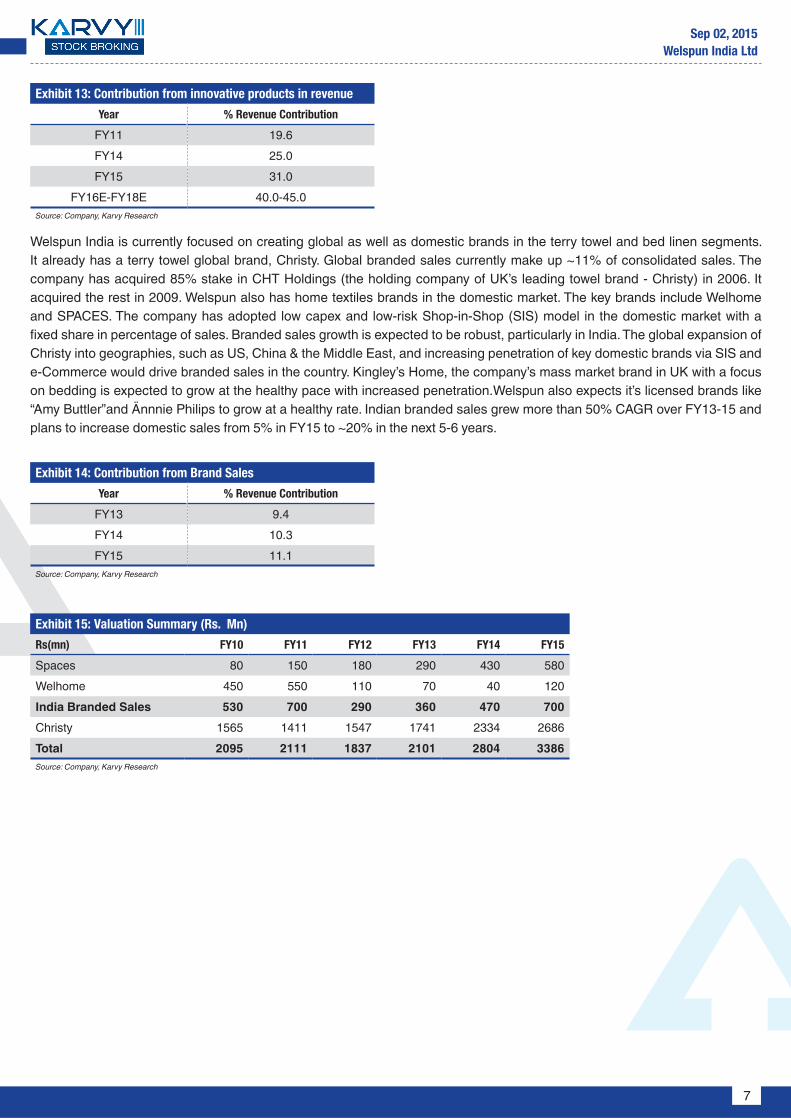
Exhibit 13: Contribution from innovative products in revenue
Year % Revenue Contribution
FY11 19.6FY14 25.0FY15 31.0
FY16E-FY18E 40.0-45.0Source: Company, Karvy Research
Exhibit 14: Contribution from Brand Sales
Year % Revenue Contribution
FY13 9.4FY14 10.3FY15 11.1
Source: Company, Karvy Research
Welspun India is currently focused on creating global as well as domestic brands in the terry towel and bed linen segments. It already has a terry towel global brand, Christy. Global branded sales currently make up ~11% of consolidated sales. The company has acquired 85% stake in CHT Holdings (the holding company of UK’s leading towel brand - Christy) in 2006. It acquired the rest in 2009. Welspun also has home textiles brands in the domestic market. The key brands include Welhome and SPACES. The company has adopted low capex and low-risk Shop-in-Shop (SIS) model in the domestic market with a fixed share in percentage of sales. Branded sales growth is expected to be robust, particularly in India. The global expansion of Christy into geographies, such as US, China & the Middle East, and increasing penetration of key domestic brands via SIS and e-Commerce would drive branded sales in the country. Kingley’s Home, the company’s mass market brand in UK with a focus on bedding is expected to grow at the healthy pace with increased penetration.Welspun also expects it’s licensed brands like “Amy Buttler”and Ännnie Philips to grow at a healthy rate. Indian branded sales grew more than 50% CAGR over FY13-15 and plans to increase domestic sales from 5% in FY15 to ~20% in the next 5-6 years.
Exhibit 15: Valuation Summary (Rs. Mn)
Rs(mn) FY10 FY11 FY12 FY13 FY14 FY15
Spaces 80 150 180 290 430 580Welhome 450 550 110 70 40 120India Branded Sales 530 700 290 360 470 700Christy 1565 1411 1547 1741 2334 2686Total 2095 2111 1837 2101 2804 3386Source: Company, Karvy Research

8
Sep 02, 2015Welspun India Ltd
Mass premium brand with presence in India and Middle East
Footprint of over 200 shop-in-shop outlets and distribution
Suppliers of the Wimbledon towels
A souvenir that even the star tennis players covet
Largest terry towel brand in the UK with growing presence in China and the Middle East
Present in over 40 retailers within UK
Also present in USA and seeing aggressive growth in e-commerce
Licensed the Amy Butler range of home products for US business with a special focus on e-commerce
Mass brand in UK with a focus on bedding
Growing aggressively in affordable fashion
Launched own brand of luxury linen in US via e-commerce partners
Licensed the Annie Phillip brand for floor coverings in US, UK and India
Mass brand presence via mass retailers; also growing via distributor network
License holder of the Rugby World Cup 2015 towels
Value through Brands
On the international front, in 2006, Welspun acquired 85% stake in CHT Holdings Ltd., holding company of Britain’s leading towel brand Christy. In 2009, it acquired the remaining 15% stake making it a 100% subsidiary. Through this, the company gained access to the premium brand and retail stores in UK and European markets. Christy is an exclusive licensee to the Wimbledon Championships.
On the domestic front, Welspun has presence through brands like Welhome and SPACES Home & Beyond. The company has adopted a shop-in-shop model for its domestic business with an aim to variabalise costs and enhance profitability. Over FY12-14, Welspun’s branded sales grew at a CAGR of 24%.
The company, being a market leader, has constantly focused on quality product offerings, ready supply and on-time delivery which has enabled it to maintain long standing relationships with key retailers like Wal-Mart, JC Penney, Target and Macy’s. Welspun covers the entire spectrum from super premium to value with brands like Christy, Kingsley, Welhome and Spaces within India and overseas.

9
Sep 02, 2015Welspun India Ltd
With an aim to gain market share, the company is now emphasizing on innovative products (30% of FY15 revenues). Going forward, the company may look to penetrate aggressively into the e-commerce segment which could further help to gain market share in the domestic and international markets. Welspun plans to increase its share of revenue from the domestic market to 15% eventually. The company has exited many of its non-profitable ventures which helped it to enhance its EBITDA margins from 11.4% in FY12 to 23.2% in FY14 and expect it to improve to 24.8% in FY17E. We believe the company’s focus on branded sales and innovative products will drive the next phase of growth.
Exploring new markets, launching new channels and expanding its product range US market contributes to about 60% revenue of Welspun in FY15, which came down from around 75% in FY10 while the Rest-of-the-World (RoW)’s share increased from 27% in FY10 to 41% in FY15.The revenue from other geographies is scattered and small. Welspun India is gradually lowering its dependency on the US by diversifying into newer geographies. The company is aggressively looking to penetrate markets like Asia Pacific, Latin America, Europe and India to enhance the reach of its products. Welspun’s management believes that these markets have huge potential for growth and they have made the initial in-roads in these markets which will help them to increase their market share globally.
Out of the total US$45 Bn home textiles market, US market is around 30% where WLSI has dominant position in bed and bath products. Welspun management belives that the EU-FTA (European Union Free Trade Aggreement) can significantly improve the comptitiveness of Indian players and give access to the European home textile markets. The recent FTA with Japan and Korea will lead to improved trade in the coming years.
E-retailing channel: Welspun has launched its own brand of luxury bed and bath linen ‘’Crowning Touch’’ in the US market through third party online market leaders like Amazon, Overstock, Wayfair etc. Welspun India is also having its own site welspunbathandbedstore.com. Welspun India also sells its own brands like Christy and Spaces through e-commerce channel.
Under-penetrated geographies, product segments, sales channel, improving global environment, increasing competitiveness of Indian manufacturers and wider access to European market will aid the growth ahead in coming years.
10
Sep 02, 2015Welspun India Ltd
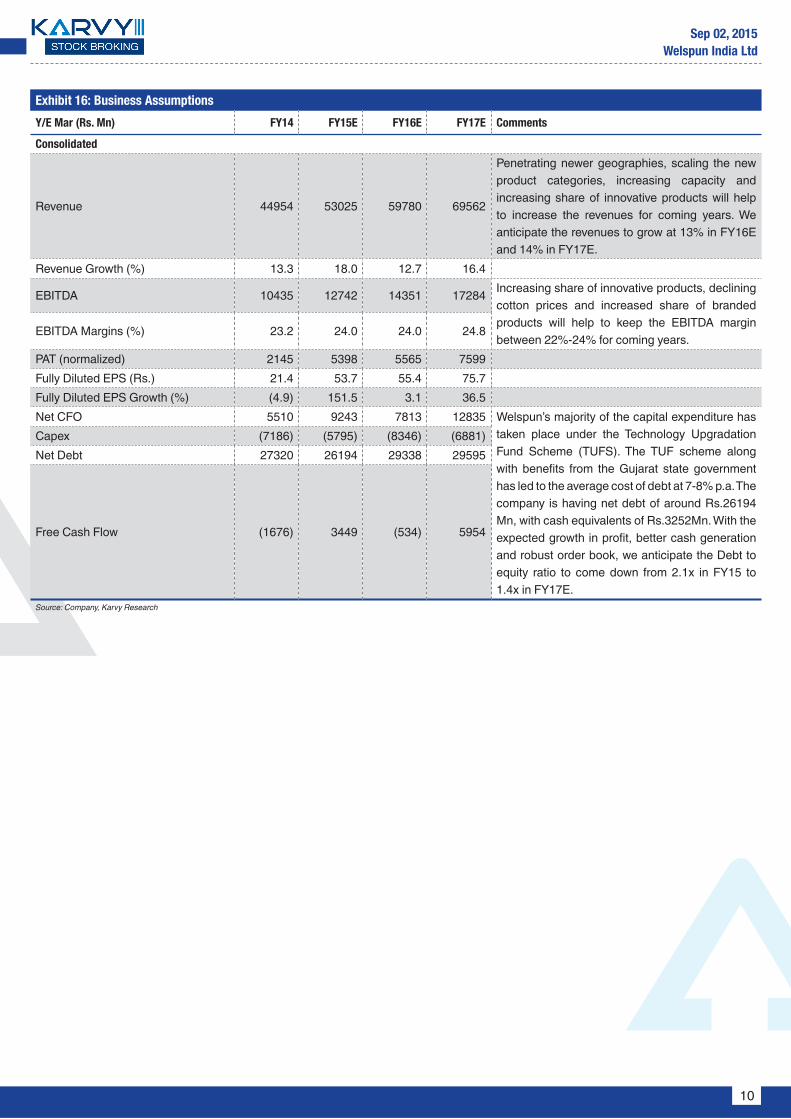
Exhibit 16: Business Assumptions
Y/E Mar (Rs. Mn) FY14 FY15E FY16E FY17E Comments
Consolidated
Revenue 44954 53025 59780 69562
Penetrating newer geographies, scaling the new product categories, increasing capacity and increasing share of innovative products will help to increase the revenues for coming years. We anticipate the revenues to grow at 13% in FY16E and 14% in FY17E.
Revenue Growth (%) 13.3 18.0 12.7 16.4
EBITDA 10435 12742 14351 17284 Increasing share of innovative products, declining cotton prices and increased share of branded products will help to keep the EBITDA margin between 22%-24% for coming years.
EBITDA Margins (%) 23.2 24.0 24.0 24.8
PAT (normalized) 2145 5398 5565 7599 Fully Diluted EPS (Rs.) 21.4 53.7 55.4 75.7 Fully Diluted EPS Growth (%) (4.9) 151.5 3.1 36.5Net CFO 5510 9243 7813 12835 Welspun’s majority of the capital expenditure has
taken place under the Technology Upgradation Fund Scheme (TUFS). The TUF scheme along with benefits from the Gujarat state government has led to the average cost of debt at 7-8% p.a. The company is having net debt of around Rs.26194 Mn, with cash equivalents of Rs.3252Mn. With the expected growth in profit, better cash generation and robust order book, we anticipate the Debt to equity ratio to come down from 2.1x in FY15 to 1.4x in FY17E.
Capex (7186) (5795) (8346) (6881)Net Debt 27320 26194 29338 29595
Free Cash Flow (1676) 3449 (534) 5954
Source: Company, Karvy Research
11
Sep 02, 2015Welspun India Ltd
Exhibit 17: Strong Revenue Growth
Source: Company, Karvy Research
Exhibit 19: Healthy Return Ratios
Source: Company, Karvy Research
Exhibit 18: EBITDA & EBITDA margins
Source: Company, Karvy Research
Exhibit 20: Net Debt/Equity, Net Debt/ EBITDA
Source: Company, Karvy Research
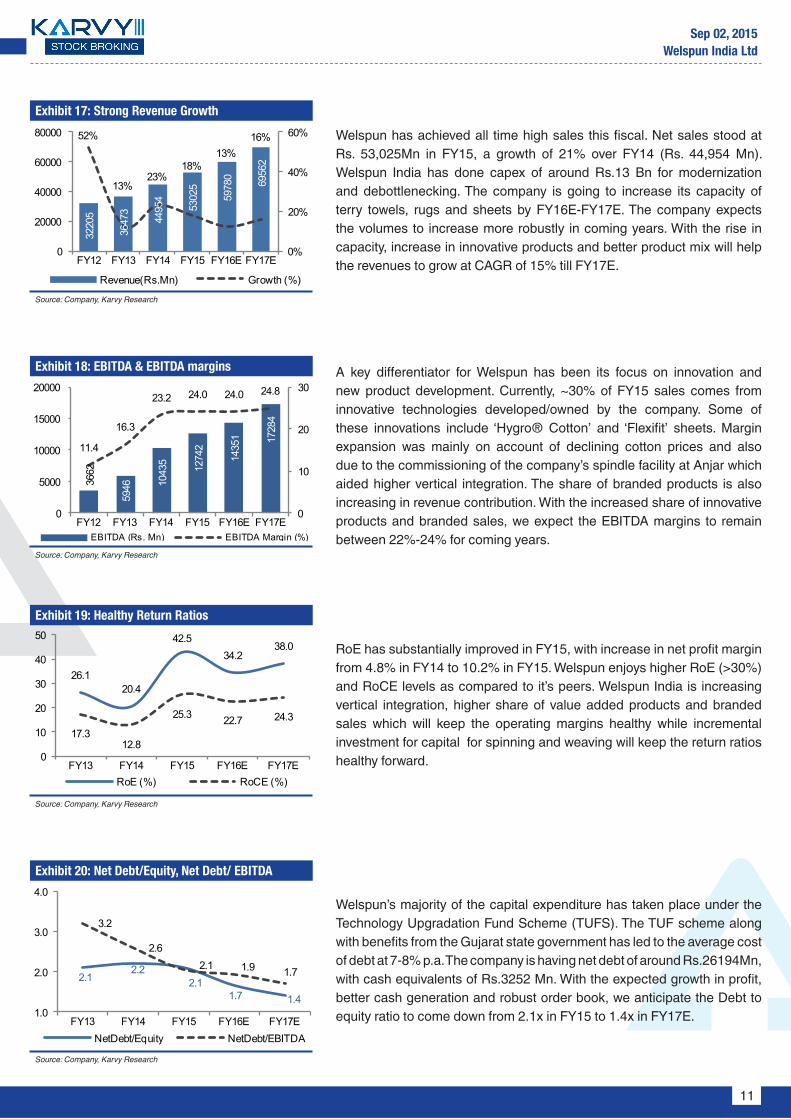
Welspun has achieved all time high sales this fiscal. Net sales stood at Rs. 53,025Mn in FY15, a growth of 21% over FY14 (Rs. 44,954 Mn). Welspun India has done capex of around Rs.13 Bn for modernization and debottlenecking. The company is going to increase its capacity of terry towels, rugs and sheets by FY16E-FY17E. The company expects the volumes to increase more robustly in coming years. With the rise in capacity, increase in innovative products and better product mix will help the revenues to grow at CAGR of 15% till FY17E.
RoE has substantially improved in FY15, with increase in net profit margin from 4.8% in FY14 to 10.2% in FY15. Welspun enjoys higher RoE (>30%)and RoCE levels as compared to it’s peers. Welspun India is increasing vertical integration, higher share of value added products and branded sales which will keep the operating margins healthy while incremental investment for capital for spinning and weaving will keep the return ratios healthy forward.
A key differentiator for Welspun has been its focus on innovation and new product development. Currently, ~30% of FY15 sales comes from innovative technologies developed/owned by the company. Some of these innovations include ‘Hygro® Cotton’ and ‘Flexifit’ sheets. Margin expansion was mainly on account of declining cotton prices and also due to the commissioning of the company’s spindle facility at Anjar which aided higher vertical integration. The share of branded products is also increasing in revenue contribution. With the increased share of innovative products and branded sales, we expect the EBITDA margins to remain between 22%-24% for coming years.
Welspun’s majority of the capital expenditure has taken place under the Technology Upgradation Fund Scheme (TUFS). The TUF scheme along with benefits from the Gujarat state government has led to the average cost of debt at 7-8% p.a. The company is having net debt of around Rs.26194Mn, with cash equivalents of Rs.3252 Mn. With the expected growth in profit, better cash generation and robust order book, we anticipate the Debt to equity ratio to come down from 2.1x in FY15 to 1.4x in FY17E.
3220
5
3647
3
4495
4
5302
5
5978
0 6956
2
52%
13%23%
18%13%
16%
0%
20%
40%
60%
0
20000
40000
60000
80000
FY12 FY13 FY14 FY15 FY16E FY17E
Revenue(Rs.Mn) Growth (%)
26.120.4
42.534.2
38.0
17.312.8
25.3 22.7 24.3
0
10
20
30
40
50
FY13 FY14 FY15 FY16E FY17ERoE (%) RoCE (%)
2.12.2
2.11.7 1.4
3.2
2.62.1 1.9 1.7
1.0
2.0
3.0
4.0
FY13 FY14 FY15 FY16E FY17ENetDebt/Equity NetDebt/EBITDA
3662
5946 10
435 1274
2
1435
1 1728
4
11.4
16.3
23.2 24.0 24.0 24.8
0
10
20
30
0
5000
10000
15000
20000
FY12 FY13 FY14 FY15 FY16E FY17EEBITDA (Rs. Mn) EBITDA Margin (%)
12
Sep 02, 2015Welspun India Ltd
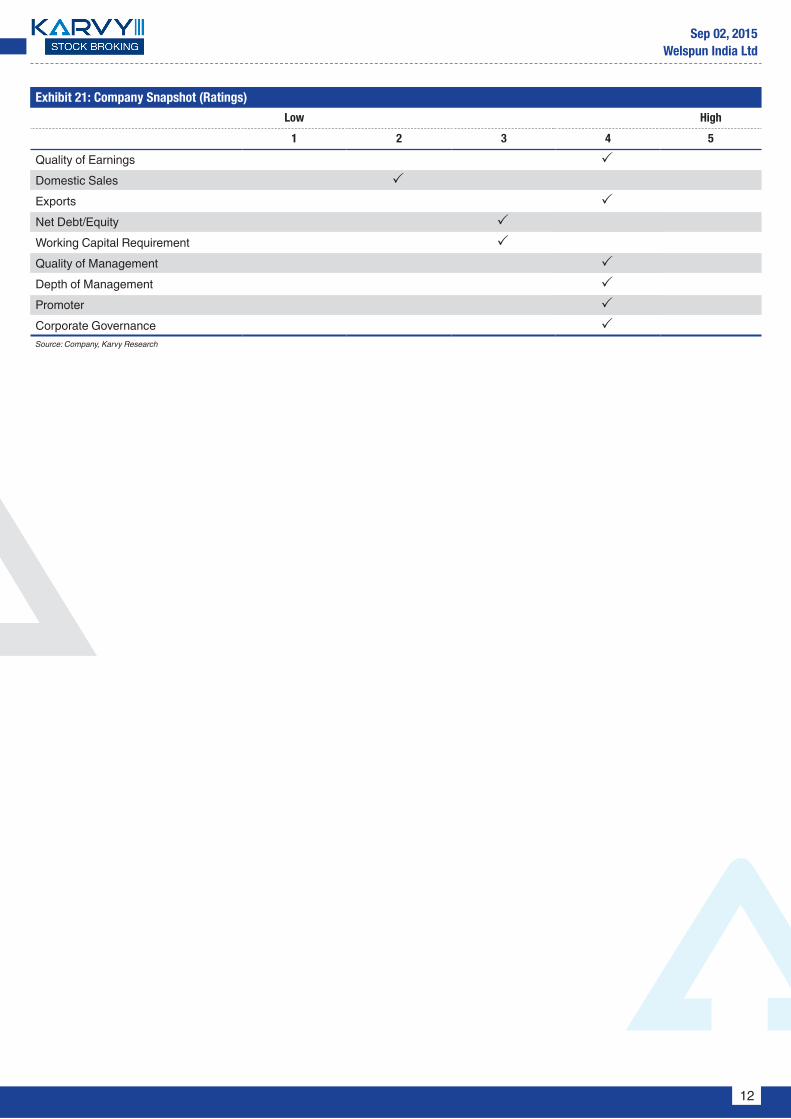
Exhibit 21: Company Snapshot (Ratings)
Low High
1 2 3 4 5
Quality of Earnings 3 Domestic Sales 3 Exports 3 Net Debt/Equity 3 Working Capital Requirement 3 Quality of Management 3 Depth of Management 3 Promoter 3 Corporate Governance 3 Source: Company, Karvy Research
13
Sep 02, 2015Welspun India Ltd
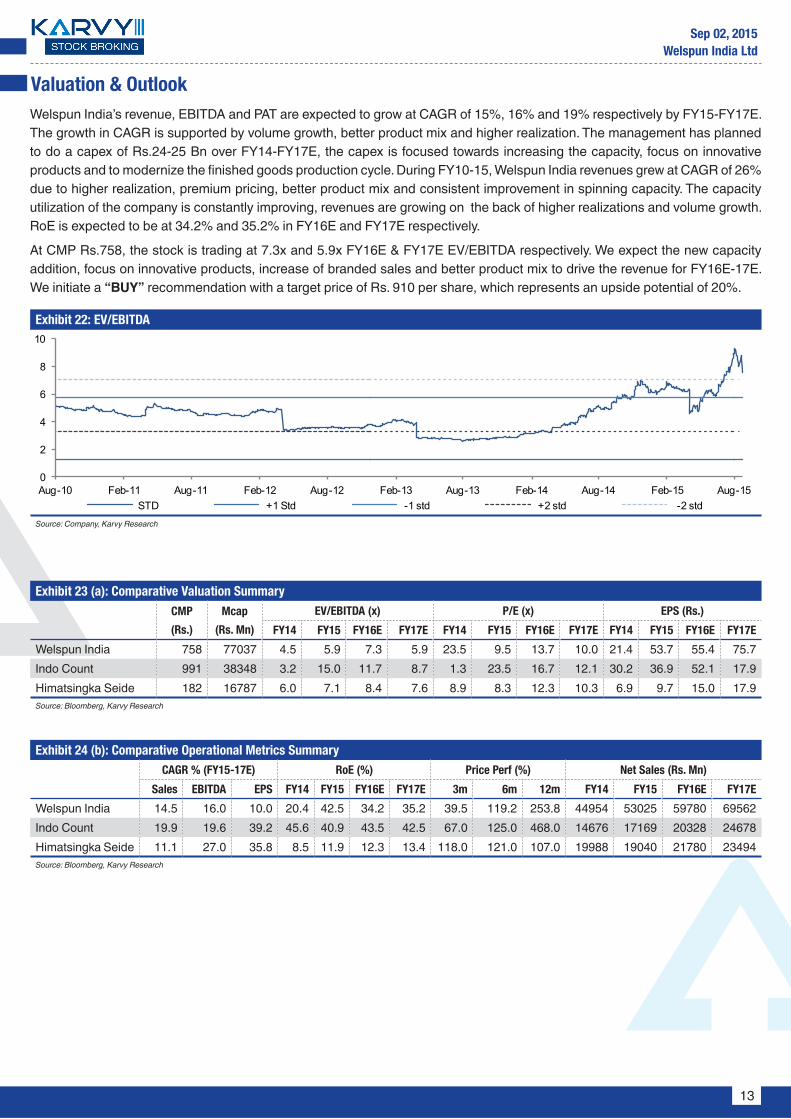
Valuation & OutlookWelspun India’s revenue, EBITDA and PAT are expected to grow at CAGR of 15%, 16% and 19% respectively by FY15-FY17E. The growth in CAGR is supported by volume growth, better product mix and higher realization. The management has planned to do a capex of Rs.24-25 Bn over FY14-FY17E, the capex is focused towards increasing the capacity, focus on innovative products and to modernize the finished goods production cycle. During FY10-15, Welspun India revenues grew at CAGR of 26% due to higher realization, premium pricing, better product mix and consistent improvement in spinning capacity. The capacity utilization of the company is constantly improving, revenues are growing on the back of higher realizations and volume growth. RoE is expected to be at 34.2% and 35.2% in FY16E and FY17E respectively.
At CMP Rs.758, the stock is trading at 7.3x and 5.9x FY16E & FY17E EV/EBITDA respectively. We expect the new capacity addition, focus on innovative products, increase of branded sales and better product mix to drive the revenue for FY16E-17E. We initiate a “BUY” recommendation with a target price of Rs. 910 per share, which represents an upside potential of 20%.
Exhibit 22: EV/EBITDA
Source: Company, Karvy Research
Exhibit 23 (a): Comparative Valuation SummaryCMP
(Rs.)
Mcap
(Rs. Mn)
EV/EBITDA (x) P/E (x) EPS (Rs.)
FY14 FY15 FY16E FY17E FY14 FY15 FY16E FY17E FY14 FY15 FY16E FY17E
Welspun India 758 77037 4.5 5.9 7.3 5.9 23.5 9.5 13.7 10.0 21.4 53.7 55.4 75.7Indo Count 991 38348 3.2 15.0 11.7 8.7 1.3 23.5 16.7 12.1 30.2 36.9 52.1 17.9Himatsingka Seide 182 16787 6.0 7.1 8.4 7.6 8.9 8.3 12.3 10.3 6.9 9.7 15.0 17.9Source: Bloomberg, Karvy Research
Exhibit 24 (b): Comparative Operational Metrics SummaryCAGR % (FY15-17E) RoE (%) Price Perf (%) Net Sales (Rs. Mn)
Sales EBITDA EPS FY14 FY15 FY16E FY17E 3m 6m 12m FY14 FY15 FY16E FY17E
Welspun India 14.5 16.0 10.0 20.4 42.5 34.2 35.2 39.5 119.2 253.8 44954 53025 59780 69562 Indo Count 19.9 19.6 39.2 45.6 40.9 43.5 42.5 67.0 125.0 468.0 14676 17169 20328 24678Himatsingka Seide 11.1 27.0 35.8 8.5 11.9 12.3 13.4 118.0 121.0 107.0 19988 19040 21780 23494Source: Bloomberg, Karvy Research
0
2
4
6
8
10
Aug-10 Feb-11 Aug-11 Feb-12 Aug-12 Feb-13 Aug-13 Feb-14 Aug-14 Feb-15 Aug-15STD +1 Std -1 std +2 std -2 std
14
Sep 02, 2015Welspun India Ltd
Key RisksGlobal slowdown may impact demand conditionsyy WLSI is spread across the globe with larger concentration of its revenue from US/Europe markets, hence any adverse
impact on the global economy may affect the demand.Increase in competition rivalry yy Increasing competition may hamper the demand of Welspun India.
Foreign Exchange Riskyy WLSI’s major reveues are from exports. Extreme volatile movements in forex may impact the company’s competitiveness as
well as margins.
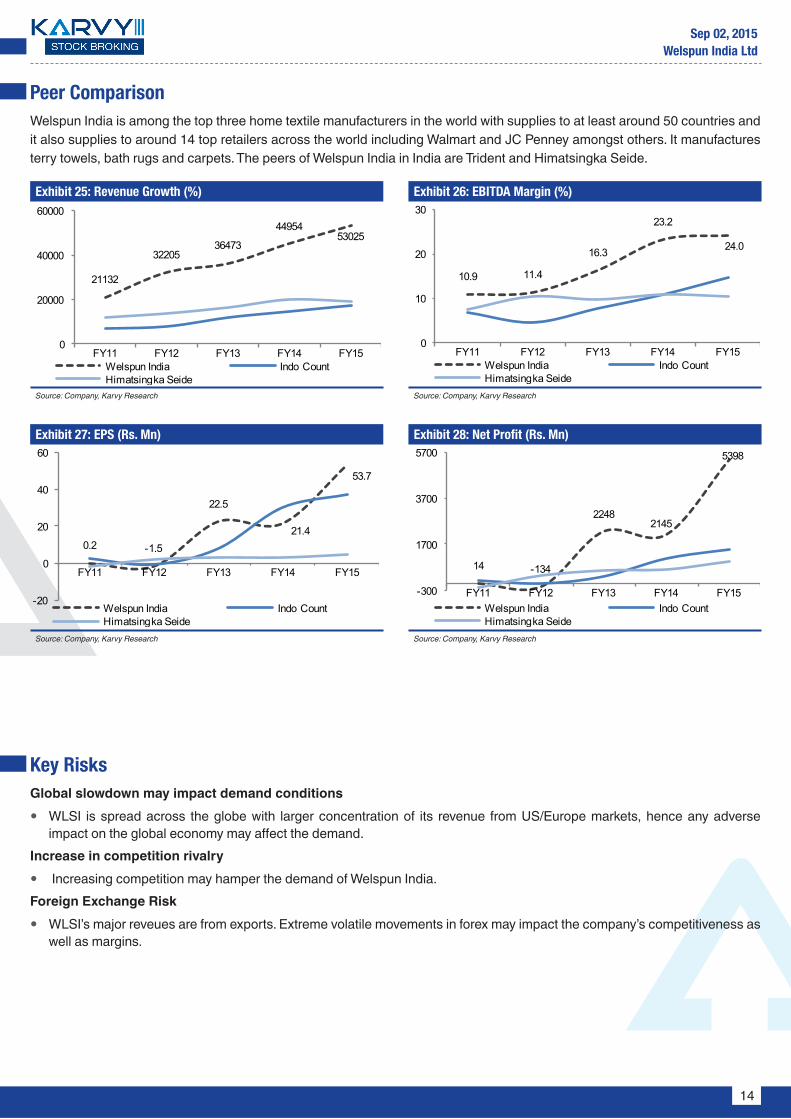
Peer ComparisonWelspun India is among the top three home textile manufacturers in the world with supplies to at least around 50 countries and it also supplies to around 14 top retailers across the world including Walmart and JC Penney amongst others. It manufactures terry towels, bath rugs and carpets. The peers of Welspun India in India are Trident and Himatsingka Seide.
Exhibit 25: Revenue Growth (%)
Source: Company, Karvy Research
Exhibit 27: EPS (Rs. Mn)
Source: Company, Karvy Research
Exhibit 26: EBITDA Margin (%)
Source: Company, Karvy Research
Exhibit 28: Net Profit (Rs. Mn)
Source: Company, Karvy Research
10.9 11.4
16.3
23.2
24.0
0
10
20
30
FY11 FY12 FY13 FY14 FY15Welspun India Indo CountHimatsingka Seide
14 -134
22482145
5398
-300
1700
3700
5700
FY11 FY12 FY13 FY14 FY15Welspun India Indo CountHimatsingka Seide
21132
3220536473
4495453025
0
20000
40000
60000
FY11 FY12 FY13 FY14 FY15Welspun India Indo CountHimatsingka Seide
0.2 -1.5
22.5
21.4
53.7
-20
0
20
40
60
FY11 FY12 FY13 FY14 FY15
Welspun India Indo CountHimatsingka Seide
15
Sep 02, 2015Welspun India Ltd
Financials
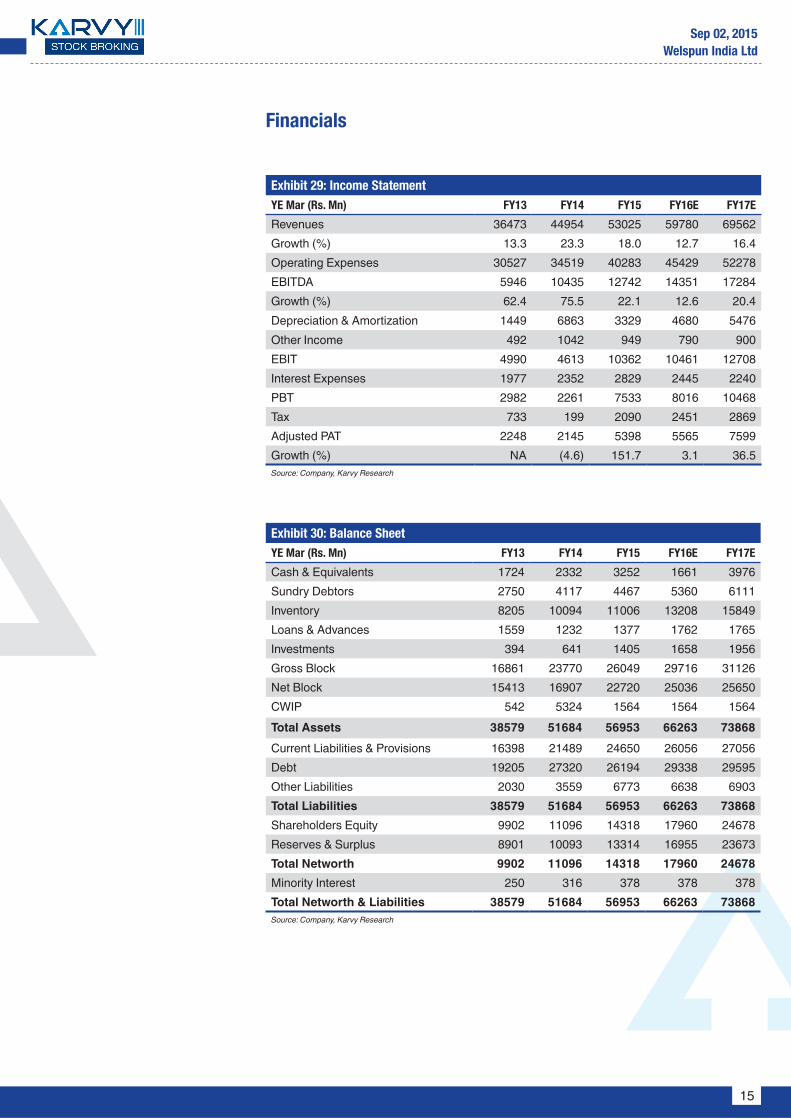
Exhibit 29: Income StatementYE Mar (Rs. Mn) FY13 FY14 FY15 FY16E FY17E
Revenues 36473 44954 53025 59780 69562 Growth (%) 13.3 23.3 18.0 12.7 16.4Operating Expenses 30527 34519 40283 45429 52278 EBITDA 5946 10435 12742 14351 17284 Growth (%) 62.4 75.5 22.1 12.6 20.4Depreciation & Amortization 1449 6863 3329 4680 5476 Other Income 492 1042 949 790 900 EBIT 4990 4613 10362 10461 12708 Interest Expenses 1977 2352 2829 2445 2240 PBT 2982 2261 7533 8016 10468 Tax 733 199 2090 2451 2869 Adjusted PAT 2248 2145 5398 5565 7599 Growth (%) NA (4.6) 151.7 3.1 36.5Source: Company, Karvy Research
Exhibit 30: Balance SheetYE Mar (Rs. Mn) FY13 FY14 FY15 FY16E FY17E
Cash & Equivalents 1724 2332 3252 1661 3976Sundry Debtors 2750 4117 4467 5360 6111Inventory 8205 10094 11006 13208 15849Loans & Advances 1559 1232 1377 1762 1765Investments 394 641 1405 1658 1956Gross Block 16861 23770 26049 29716 31126Net Block 15413 16907 22720 25036 25650CWIP 542 5324 1564 1564 1564Total Assets 38579 51684 56953 66263 73868Current Liabilities & Provisions 16398 21489 24650 26056 27056Debt 19205 27320 26194 29338 29595Other Liabilities 2030 3559 6773 6638 6903Total Liabilities 38579 51684 56953 66263 73868Shareholders Equity 9902 11096 14318 17960 24678Reserves & Surplus 8901 10093 13314 16955 23673Total Networth 9902 11096 14318 17960 24678Minority Interest 250 316 378 378 378Total Networth & Liabilities 38579 51684 56953 66263 73868Source: Company, Karvy Research
16
Sep 02, 2015Welspun India Ltd
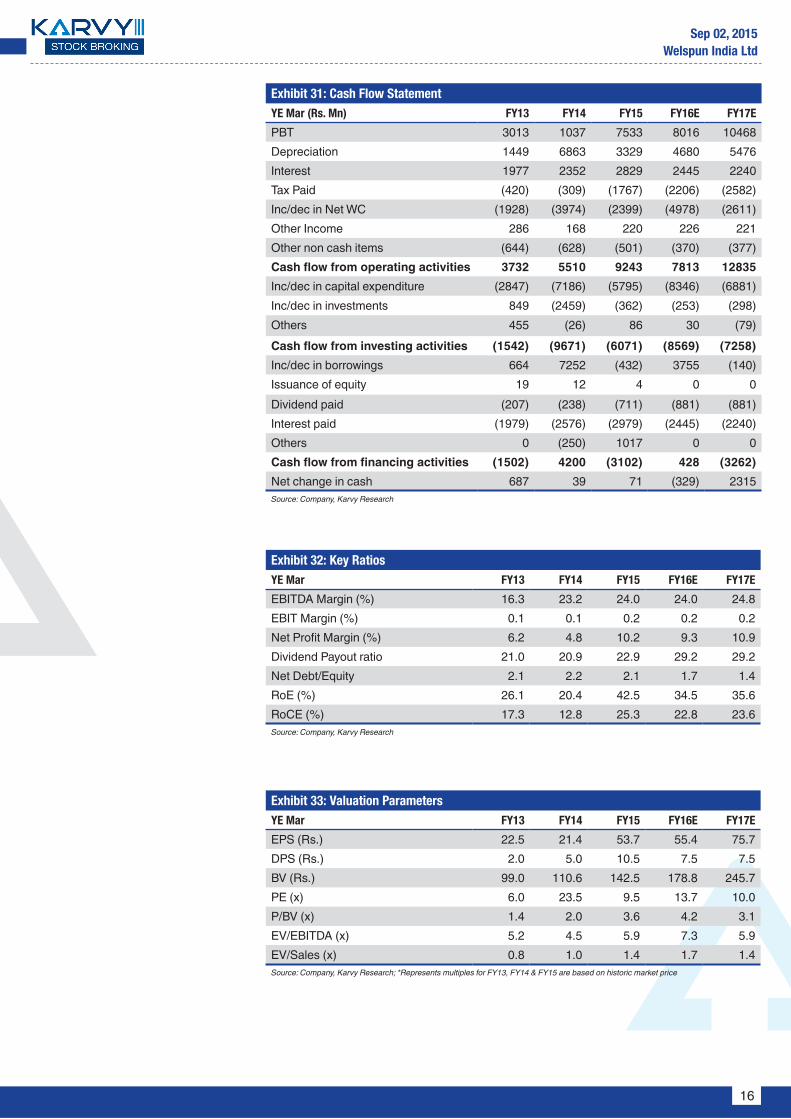
Exhibit 31: Cash Flow StatementYE Mar (Rs. Mn) FY13 FY14 FY15 FY16E FY17E
PBT 3013 1037 7533 8016 10468 Depreciation 1449 6863 3329 4680 5476 Interest 1977 2352 2829 2445 2240 Tax Paid (420) (309) (1767) (2206) (2582)Inc/dec in Net WC (1928) (3974) (2399) (4978) (2611)Other Income 286 168 220 226 221 Other non cash items (644) (628) (501) (370) (377)Cash flow from operating activities 3732 5510 9243 7813 12835 Inc/dec in capital expenditure (2847) (7186) (5795) (8346) (6881)Inc/dec in investments 849 (2459) (362) (253) (298)Others 455 (26) 86 30 (79)Cash flow from investing activities (1542) (9671) (6071) (8569) (7258)Inc/dec in borrowings 664 7252 (432) 3755 (140)Issuance of equity 19 12 4 0 0 Dividend paid (207) (238) (711) (881) (881)Interest paid (1979) (2576) (2979) (2445) (2240)Others 0 (250) 1017 0 0 Cash flow from financing activities (1502) 4200 (3102) 428 (3262)Net change in cash 687 39 71 (329) 2315 Source: Company, Karvy Research
Exhibit 32: Key RatiosYE Mar FY13 FY14 FY15 FY16E FY17E
EBITDA Margin (%) 16.3 23.2 24.0 24.0 24.8EBIT Margin (%) 0.1 0.1 0.2 0.2 0.2Net Profit Margin (%) 6.2 4.8 10.2 9.3 10.9Dividend Payout ratio 21.0 20.9 22.9 29.2 29.2Net Debt/Equity 2.1 2.2 2.1 1.7 1.4RoE (%) 26.1 20.4 42.5 34.5 35.6RoCE (%) 17.3 12.8 25.3 22.8 23.6Source: Company, Karvy Research
Exhibit 33: Valuation ParametersYE Mar FY13 FY14 FY15 FY16E FY17E
EPS (Rs.) 22.5 21.4 53.7 55.4 75.7DPS (Rs.) 2.0 5.0 10.5 7.5 7.5BV (Rs.) 99.0 110.6 142.5 178.8 245.7PE (x) 6.0 23.5 9.5 13.7 10.0P/BV (x) 1.4 2.0 3.6 4.2 3.1EV/EBITDA (x) 5.2 4.5 5.9 7.3 5.9EV/Sales (x) 0.8 1.0 1.4 1.7 1.4Source: Company, Karvy Research; *Represents multiples for FY13, FY14 & FY15 are based on historic market price
17
Sep 02, 2015Welspun India Ltd
Stock Ratings Absolute ReturnsBuy : > 15%Hold : 5-15%Sell : <5%
Connect & Discuss More at
1800 425 8283 (Toll Free) [email protected] Live Chat f in YouTube
DisclaimerAnalyst certification: The following analyst(s), Aniket Pande, who is (are) primarily responsible for this report and whose name(s) is/are mentioned therein, certify (ies) that the views expressed herein accurately reflect his (their) personal view(s) about the subject security (ies) and issuer(s) and that no part of his (their) compensation was, is or will be directly or indirectly related to the specific recommendation(s) or views contained in this research report.Disclaimer: Karvy Stock Broking Limited [KSBL] is a SEBI registered Stock Broker, Depository Participant, Portfolio Manager and also distributes financial products. The subsidiaries and group companies including associates of KSBL provide services as Registrars and Share Transfer Agents, Commodity Broker, Currency and forex broker, merchant banker and underwriter, Investment Advisory services, insurance repository services, financial consultancy and advisory services, realty services, data management, data analytics, market research, solar power, film distribution and production, profiling and related services. Therefore associates of KSBL are likely to have business relations with most of the companies whose securities are traded on the exchange platform. The information and views presented in this report are prepared by Karvy Stock Broking Limited and are subject to change without any notice. This report is based on information obtained from public sources , the respective corporate under coverage and sources believed to be reliable, but no independent verification has been made nor is its accuracy or completeness guaranteed. The report and information contained herein is strictly confidential and meant solely for the selected recipient and may not be altered in any way, transmitted to, copied or distributed, in part or in whole, to any other person or to the media or reproduced in any form, without prior written consent of KSBL. While we would endeavor to update the information herein on a reasonable basis, KSBL is under no obligation to update or keep the information current. Also, there may be regulatory, compliance or other reasons that may prevent KSBL from doing so. The value and return on investment may vary because of changes in interest rates, foreign exchange rates or any other reason. This report and information herein is solely for informational purpose and shall not be used or considered as an offer document or solicitation of offer to buy or sell or subscribe for securities or other financial instruments. Though disseminated to all the customers simultaneously, not all customers may receive this report at the same time. KSBL will not treat recipients as customers by virtue of their receiving this report. Nothing in this report constitutes investment, legal, accounting and tax advice or a representation that any investment or strategy is suitable or appropriate to your specific circumstances. This material is for personal information and we are not responsible for any loss incurred based upon it. The investments discussed or recommended in this report may not be suitable for all investors. Investors must make their own investment decisions based on their specific investment objectives and financial position and using such independent advice, as they believe necessary. While acting upon any information or analysis mentioned in this report, investors may please note that neither KSBL nor any associate companies of KSBL accepts any liability arising from the use of information and views mentioned in this report. Investors are advised to see Risk Disclosure Document to understand the risks associated before investing in the securities markets. Past performance is not necessarily a guide to future performance. Forward-looking statements are not predictions and may be subject to change without notice. Actual results may differ materially from those set forth in projections.
y Associates of KSBL might have managed or co-managed public offering of securities for the subject company or might have been mandated by the subject company for any other assignment in the past twelve months.
y Associates of KSBL might have received compensation from the subject company mentioned in the report during the period preceding twelve months from the date of this report for investment banking or merchant banking or brokerage services from the subject company in the past twelve months or for services rendered as Registrar and Share Transfer Agent, Commodity Broker, Currency and forex broker, merchant banker and underwriter, Investment Advisory services, insurance repository services, consultancy and advisory services, realty services, data processing, profiling and related services or in any other capacity.
y KSBL encourages independence in research report preparation and strives to minimize conflict in preparation of research report. y Compensation of KSBL’s Research Analyst(s) is not based on any specific merchant banking, investment banking or brokerage service transactions. y KSBL generally prohibits its analysts, persons reporting to analysts and their relatives from maintaining a financial interest in the securities or derivatives of
any companies that the analysts cover. y KSBL or its associates collectively or Research Analysts do not own 1% or more of the equity securities of the Company mentioned in the report as of the
last day of the month preceding the publication of the research report. y KSBL or its analysts did not receive any compensation or other benefits from the companies mentioned in the report or third party in connection with
preparation of the research report and have no financial interest in the subject company mentioned in this report. y Accordingly, neither KSBL nor Research Analysts have any material conflict of interest at the time of publication of this report. y It is confirmed that KSBL and Research Analysts, primarily responsible for this report and whose name(s) is/ are mentioned therein of this report have not
received any compensation from the subject company mentioned in the report in the preceding twelve months. y It is confirmed that Aniket Pande, Research Analyst did not serve as an officer, director or employee of the companies mentioned in the report. y KSBL may have issued other reports that are inconsistent with and reach different conclusion from the information presented in this report. y Neither the Research Analysts nor KSBL have been engaged in market making activity for the companies mentioned in the report. y We submit that no material disciplinary action has been taken on KSBL by any Regulatory Authority impacting Equity Research Analyst activities.
Karvy Stock Broking LimitedPlot No.31, 6th Floor, Karvy Millennium Towers, Financial District, Nanakramguda, Hyderabad, 500 032, India
Tel: 91-40-2331 2454; Fax: 91-40-2331 1968For More updates & Stock Research, visit www.karvyonline.com