Seong-Ho Seo Drag Reduction of a Bluff Bodyphoenics/EM974/PROJETOS/Temas...e-mail:...
10
Seong-Ho Seo Division of Information Analysis, Korea Institute of Science and Technology Information, 76-2 Geoje-dong, Yeonje-gu, Busan 611-702, South Korea Chung-Do Nam Division of Marine Engineering, Korea Maritime University, 727 Taejong-ro, Yeongdo-gu, Busan 606-791, South Korea Jung-Young Han Cheol-Hyun Hong 1 e-mail: [email protected] Pusan Educational Center for Computer Aided Machine Design, Pusan National University, San 30, Jangjeon-dong, Geumjeong-gu, Busan 609-735, South Korea Drag Reduction of a Bluff Body by Grooves Laid Out by Design of Experiment In this study, we used the Taguchi method to derive the optimal design parameters for the grooves formed on the upper surface of a circular cylinder. Using the derived values of the optimal design parameters, we created grooves on diphycercal the surfaces of a circular cyl- inder and analyzed the wake flow and the boundary-layer flow of the circular cylinder. The streamwise time mean velocity and turbulence intensity of the wake flow field were used as the characteristics. Based on these characteristics, the optimal design parameter values were selected: n ¼ 3, k ¼ 1.0 mm (k/d ¼ 2.5%), and h ¼ 60 deg. When the grooved cylinder was used, the streamwise time mean velocity in the wake of the cylinder showed 12.3% recovery, the wake width was reduced by 18.4% compared to the results from the smooth cylinder and we had 28.2% drag reduction from that of smooth cylinder. Also, the flow on the smooth cylinder separated at around 82 deg but the flow separation on a grooved cylin- der appeared beyond 90 deg, that reducing the drag. [DOI: 10.1115/1.4024934] Keywords: bluff body, circular cylinder, blade, groove, drag reduction, energy saving, design of experiment (DOE), the Taguchi method, PIV 1 Introduction 1.1 Flow Control Method. As the environment became a paramount issue in recent years, forms of transportation, such as automobiles and airplanes, started being considered as major causes of environmental pollution. This created rising demand for the reduction of carbon dioxide emissions and for the improve- ment of fuel efficiency. Regarding automobile fuel, in particular, many studies on drag reduction are being carried out, since drag accounts for 50% of all automobile fuel consumption [1]. The drag reduction achievable by controlling airflow over the surface of a structure not only prevents structural destruction, but also enhances the performance of the vehicle, considerably reduc- ing energy consumption. Therefore, the application of flow field controls around the structure is very important topic of study in engineering [2]. Flow control is a technique that can be used to improve the efficiency of moving objects by changing the airflow over the boundary surface of the structure’s wall, or the free shear flow. There are two types of flow control: passive control and active control [3]. Active control is achieved by applying addi- tional external energy such as suction, blowing, acoustic excita- tion, and cylinder rotation. Passive control uses the modification of surface geometry or attachments such as control cylinders, trip wires, riblets, spiral strakes, and grooves. Passive control methods can be applied directly to address the problems of flow or to improve performance in industrial sites. As a means of passive control, Lim et al. [4] found U-type lon- gitudinal grooved surface reduced the drag coefficient compared with the smooth cylinder, and Igarashi [5] reported drag reduction mechanisms of circular cylinders relative to the optimal position of trip wires. Price [6] found that porous covers on a circular cyl- inder reduce the vibration caused by a vortex. According to other studies, however, spiral wire increases drag, and porous covers are not significantly effective beyond the transition region. In general, the drag coefficient is lower with a sphere with sandy surface than one with a smooth surface in the lower range of the transition region (Re 3 10 5 ). This is known because a sand-grained surface transforms the layered-flow boundary layer into a turbulent-flow boundary layer, delaying the separation of the flow. However, in the upper range of the transition region, the drag coefficient of the sand-grained sphere increases rapidly. On the contrary, unlike sand-grained spheres, dimpled spheres such as golf balls maintain consistent drag coefficients even above the transition range. This is because the width of the dimples is larger than that of sand grains and the flow over the dimple does not change much due to the cavity flow inside the dimple, disturbing the surface boundary layer and introducing kinetic energy, thereby delaying the separation of the flow. 1.2 Flow Control by Indented Surface. Nature-inspired en- gineering recently became a focus of study in which researchers analyze the external morphology of organisms in nature to achieve optimal flow control effects. For example, a saguaro cac- tus that can survive harsh condition in windy environments, gave us a clue that grooves on the surface considerably reduce drag from the wind. Grooves are created on the surface of cable to reduce the wind drag. The Kansai Electric Power Corporation (KEPCO) designed a new power line structure by creating grooves on the exterior of power cables to reduce aerodynamic drag and air resistance, and save on construction costs. For exam- ples of a grooved body, see Fig. 1. Bearman et al. [7] created dimples on the surface of a circular cylinder and measured the drag coefficient and Strouhal number within the range of the Reynolds number 2 10 4 Re 3 10 5 to derive optimal alignment conditions, and found that the change in drag coefficients showed similar trends as in spheres. Jack et al. [8] investigated the flow field past a cylindrical model with a cactus-shaped cross section in a wind tunnel using particle image velocimetry at a Reynolds number of 2 10 5 and found the mean streamwise flow healed faster in its immediate wake, the wake turbulent velocity level was lower. 1.3 Groove Applications. Studies of flow control using grooves focus on finding the optimal geometry, position, and size 1 Corresponding author. Contributed by the Fluids Engineering Division of ASME for publication in the JOURNAL OF FLUIDS ENGINEERING. Manuscript received September 29, 2012; final manuscript received June 27, 2013; published online August 19, 2013. Assoc. Editor: Zhongquan Charlie Zheng. Journal of Fluids Engineering NOVEMBER 2013, Vol. 135 / 111202-1 Copyright V C 2013 by ASME Downloaded From: http://fluidsengineering.asmedigitalcollection.asme.org/ on 02/06/2014 Terms of Use: http://asme.org/terms
Transcript of Seong-Ho Seo Drag Reduction of a Bluff Bodyphoenics/EM974/PROJETOS/Temas...e-mail:...

Seong-Ho SeoDivision of Information Analysis,
Korea Institute of Science and
Technology Information,
76-2 Geoje-dong,
Yeonje-gu, Busan 611-702, South Korea
Chung-Do NamDivision of Marine Engineering,
Korea Maritime University,
727 Taejong-ro,
Yeongdo-gu, Busan 606-791, South Korea
Jung-Young Han
Cheol-Hyun Hong1
e-mail: [email protected]
Pusan Educational Center for Computer
Aided Machine Design,
Pusan National University,
San 30, Jangjeon-dong,
Geumjeong-gu, Busan 609-735, South Korea
Drag Reduction of a Bluff Bodyby Grooves Laid Out by Designof ExperimentIn this study, we used the Taguchi method to derive the optimal design parameters for thegrooves formed on the upper surface of a circular cylinder. Using the derived values of theoptimal design parameters, we created grooves on diphycercal the surfaces of a circular cyl-inder and analyzed the wake flow and the boundary-layer flow of the circular cylinder. Thestreamwise time mean velocity and turbulence intensity of the wake flow field were used asthe characteristics. Based on these characteristics, the optimal design parameter valueswere selected: n¼ 3, k¼ 1.0 mm (k/d¼ 2.5%), and h¼ 60 deg. When the grooved cylinderwas used, the streamwise time mean velocity in the wake of the cylinder showed 12.3%recovery, the wake width was reduced by 18.4% compared to the results from the smoothcylinder and we had 28.2% drag reduction from that of smooth cylinder. Also, the flow onthe smooth cylinder separated at around 82 deg but the flow separation on a grooved cylin-der appeared beyond 90 deg, that reducing the drag. [DOI: 10.1115/1.4024934]
Keywords: bluff body, circular cylinder, blade, groove, drag reduction, energy saving,design of experiment (DOE), the Taguchi method, PIV
1 Introduction
1.1 Flow Control Method. As the environment became aparamount issue in recent years, forms of transportation, such asautomobiles and airplanes, started being considered as majorcauses of environmental pollution. This created rising demand forthe reduction of carbon dioxide emissions and for the improve-ment of fuel efficiency. Regarding automobile fuel, in particular,many studies on drag reduction are being carried out, since dragaccounts for 50% of all automobile fuel consumption [1].
The drag reduction achievable by controlling airflow over thesurface of a structure not only prevents structural destruction, butalso enhances the performance of the vehicle, considerably reduc-ing energy consumption. Therefore, the application of flow fieldcontrols around the structure is very important topic of study inengineering [2]. Flow control is a technique that can be used toimprove the efficiency of moving objects by changing the airflowover the boundary surface of the structure’s wall, or the free shearflow. There are two types of flow control: passive control andactive control [3]. Active control is achieved by applying addi-tional external energy such as suction, blowing, acoustic excita-tion, and cylinder rotation. Passive control uses the modificationof surface geometry or attachments such as control cylinders, tripwires, riblets, spiral strakes, and grooves. Passive control methodscan be applied directly to address the problems of flow or toimprove performance in industrial sites.
As a means of passive control, Lim et al. [4] found U-type lon-gitudinal grooved surface reduced the drag coefficient comparedwith the smooth cylinder, and Igarashi [5] reported drag reductionmechanisms of circular cylinders relative to the optimal positionof trip wires. Price [6] found that porous covers on a circular cyl-inder reduce the vibration caused by a vortex. According to otherstudies, however, spiral wire increases drag, and porous coversare not significantly effective beyond the transition region.
In general, the drag coefficient is lower with a sphere withsandy surface than one with a smooth surface in the lower rangeof the transition region (Re� 3� 105). This is known because asand-grained surface transforms the layered-flow boundary layerinto a turbulent-flow boundary layer, delaying the separation ofthe flow. However, in the upper range of the transition region, thedrag coefficient of the sand-grained sphere increases rapidly. Onthe contrary, unlike sand-grained spheres, dimpled spheres suchas golf balls maintain consistent drag coefficients even above thetransition range. This is because the width of the dimples is largerthan that of sand grains and the flow over the dimple does notchange much due to the cavity flow inside the dimple, disturbingthe surface boundary layer and introducing kinetic energy, therebydelaying the separation of the flow.
1.2 Flow Control by Indented Surface. Nature-inspired en-gineering recently became a focus of study in which researchersanalyze the external morphology of organisms in nature toachieve optimal flow control effects. For example, a saguaro cac-tus that can survive harsh condition in windy environments, gaveus a clue that grooves on the surface considerably reduce dragfrom the wind. Grooves are created on the surface of cable toreduce the wind drag. The Kansai Electric Power Corporation(KEPCO) designed a new power line structure by creatinggrooves on the exterior of power cables to reduce aerodynamicdrag and air resistance, and save on construction costs. For exam-ples of a grooved body, see Fig. 1.
Bearman et al. [7] created dimples on the surface of a circularcylinder and measured the drag coefficient and Strouhal numberwithin the range of the Reynolds number 2� 104�Re� 3� 105
to derive optimal alignment conditions, and found that the changein drag coefficients showed similar trends as in spheres. Jack et al.[8] investigated the flow field past a cylindrical model with acactus-shaped cross section in a wind tunnel using particle imagevelocimetry at a Reynolds number of �2� 105 and found themean streamwise flow healed faster in its immediate wake, thewake turbulent velocity level was lower.
1.3 Groove Applications. Studies of flow control usinggrooves focus on finding the optimal geometry, position, and size
1Corresponding author.Contributed by the Fluids Engineering Division of ASME for publication in the
JOURNAL OF FLUIDS ENGINEERING. Manuscript received September 29, 2012; finalmanuscript received June 27, 2013; published online August 19, 2013. Assoc.Editor: Zhongquan Charlie Zheng.
Journal of Fluids Engineering NOVEMBER 2013, Vol. 135 / 111202-1Copyright VC 2013 by ASME
Downloaded From: http://fluidsengineering.asmedigitalcollection.asme.org/ on 02/06/2014 Terms of Use: http://asme.org/terms

of the grooves. Takeyoshi et al. [9] reported that a circular grooveon the surface of a circular cylinder had maximum drag reductioneffect when the position of the groove was at 80 deg. Shinichiet al. [10] examined the effect of the depth of grooves on the dragof circular cylinders and the change of flow field. See Table 1 fordesign parameters of grooves suggested in previous experiments.
Robarge et al. [11] experimented by creating a circular grooveon NACA 0015, and found that the optimal depth of the groove isin the range of 0.6–1.0 times the thickness of the boundary layer,and that its optimal ratio against the width of the groove is0.1–0.15.
These studies, however, have limitations in that they used onlyone groove, or covered the entire surface of the structure withmany grooves, failing to consider the optimal number of grooves,sometimes creating too many grooves and requiring a higher costof preparation, and lacking in esthetic value. Therefore, weattempted to study optimal conditions in terms of the number, thedepth, and the angle of grooves to develop an optimal designmethod, as well as to achieve cost savings.
For these purposes, we applied the Taguchi method [12], amethod of experiment design that statistically considers the effectsof a variety of qualitative design parameters, as a method of deriv-ing optimal design conditions for grooves. The application of theTaguchi method to the optimization would not only allow us toavoid the convergence problem of repetitive interpretation thatmay arise from the numeric optimization process of direct search,and the problem of excessive time required for interpretation, butalso to make in-depth interpretations of flow under the optimalconditions, as well.
Preceding studies concerned about the conditions for flow con-trol focused only on the investigation of the flow performanceunder certain conditions, and there were no studies that attemptedto find the optimal flow control condition. Ha et al. [13] used two-way factorial design methods and analysis of variance (ANOVA)
to find the most influential factors for the measurement errors indetermining the optimal position of grooves in their search for theStrouhal number of the wake of rectangular cylinders. In thisstudy, we applied the Taguchi method to derive optimal values forthe design parameters, such as the number, depth, and angle of thegrooves. As evaluation characteristics, we considered average ve-locity on the downstream central line of the wake flow field, tur-bulence intensity and Reynolds stress that are directly related tothe change in the wake flow field. We then performed measure-ments of the change of time mean velocity of the wake and wallplane flow near the surface of circular cylinder under the derivedoptimal conditions.
2 Experiment
2.1 Application of Taguchi Method. In this section, we willdefine the problems of optimal geometric design using the Tagu-chi method, with regard to the conditions for the creation ofgrooves on the surface of a circular cylinder. The Taguchi methodis a method of statistical experiment design for the optimizationof technology development and product design. Using this methodin design production allows us to optimize the design parametersthat can produce high performance, considering environmentalvariables. In order to apply the Taguchi method, characteristicproperties that can be used as the product performance criteriashould be selected as evaluation characteristics.
Designs of experiment (DOE) are generally classified into con-ventional DOE and design & analysis of computer experimentlike space-filling DOE. Orthogonal array method used in this pa-per is a conventional one which has been applied to many otherexperiments. Though same design variables are used in realexperiments, unsettled causes (noise factors) lead to differentexperiment results every time, producing random errors. Espe-cially, the application of Optimal Design Technique to the flowproblem accompanied by turbulence is likely to cause errors dueto nonlinearity. Therefore, the design point was located close tothe boundary to reduce the random error effect. The TaguchiMethod in which Orthogonal Array Method was employed wasused in this paper to draw effective results from real experiments.And a model was built to get optimal solution from real experi-ments. Wu et al. [14] attempted to obtain optimum parametric lev-els for robust design of the microbubble drag reduction in aturbulent channel flow. Considering the mean flow speed as an in-dicative factor, several controllable factors that influence theeffect of microbubble drag reduction were investigated by using
Fig. 1 Examples of a grooved body. (a) Saguaro cactus and (b) low wind-pressure power cable.
Table 1 Design parameters of grooves suggested in previousexperiments
Author d (mm) w/d k/d p (deg)
Yakeyoshi et al. 100 0.08 0.017 —Shinichi et al. 42 0.0857 0.0119 11.25Talley et al. [19] 99.8 0.01305 0.0351 15.00Yamagishi et al. [20] 48 0.075 0.0104 11.25
111202-2 / Vol. 135, NOVEMBER 2013 Transactions of the ASME
Downloaded From: http://fluidsengineering.asmedigitalcollection.asme.org/ on 02/06/2014 Terms of Use: http://asme.org/terms
the Taguchi method and for the condition of optimum parametriclevels, the effect of drag reduced could reach up to 21.6%.
The drag coefficient (Cd) is commonly used as a characterizingproperty of flow, and the velocity distribution of the wake flowfield is also considered for detailed understanding of flow controleffects. Following the suggestion made by Landahl [15] that thedrag of bluff body is related to the velocity of wake. Greiner [16]calculated the drag value by using the speed measured at wakethrough wind tunnel test and found that the value was in accord-ance with the direct drag value measured. Recently, Lim et al. [4]measured the speed at near-wake (x/d¼ 4) after placing riblets onthe surface of circumference and calculated the drag with momen-tum deficit by using streamwise mean velocity confirming that thevalue are square with total drag value directly measured. In thispaper, the drag was evaluated not by directly measuring the dragof circumference, but by using the velocity distribution of near-wake flow field. The optimal design in this study was that ofgrooves for the reduction of structural resistance caused by drag(D) on the bluff body which is known to be proportional to thewidth of the structure and the difference of velocity [17].
D ¼ bqð1�1
uðUo� uÞdy
Here, b is the height of the cylinder, q is the density of air flow,u is flow velocity at the measurement point, and Uo is free-streamvelocity. As calculated from Eq. (1), the smaller the velocity atthe measurement point and the deficit of velocity (Uo� u), inother words, the larger the Du(u/Uo), the greater the recovery ofvelocity in the wake and the smaller the drag that caused onto theobject.
Also, the turbulence intensity in the wake flow field is related tothe structure of the vortex which affects the vibration of the struc-ture. In general, downstream turbulence intensity caused by thevortex shedding in the wake of the circular cylinder initiallyshows dual-peak distribution, which gradually diminishes down-stream until it appears as a single-peak. It is the result of theinfluences from the intensity of the introduced vortex and thevortex-forming region, and can be interpreted as the process ofthe transition from large vortex structure to smaller turbulencestructure by the loss of energy, which also appears in the decreas-ing process of turbulence intensity. In addition, turbulence inten-sity is one of important factors to be used in analyzing the flowcontrol effect because it has influence on the structure stability.
Next, design parameters such as the dimension and shape of theproduct should be selected. A number of ranges of each design pa-rameter are defined as a number of levels. After defining thedesign parameters and their levels, experiments are then per-formed to identify the characteristics of the design. Experimentsshould be performed only when appropriate orthogonal arrayshave been selected, based on the design parameters and the num-ber of levels, and when distribution on the orthogonal array hasbeen completed. From these characteristics, average values ofdesign parameters for each level could be calculated, and the sen-sitivity and influence of the characteristics on each design parame-ter can be considered for the determination of optimal designparameter values [18].
In this study, we chose time mean velocity (Uc), turbulence in-tensity (u0c, v0c) on the vertical central line (Y¼ 0) of the wakeflow field of the circular cylinder and the maximum Reynoldsstresses (uvmax) versus free-stream velocity (Uo) as characteristics(Table 2).
As design parameters, we selected free-stream velocity (Uo,),groove depth (k), number of grooves (n), and groove angle (h).When a certain design parameter level needed subdivision for theselection of optimal levels, the Taguchi method was again appliedto that design parameter. For the circular cylinder, we used alumi-num cylinders with diameter (d) 40 mm, and grooves were createdusing a 5-axial precision metal-working machine. The shape of
the circumference on which grooves were made is like Fig. 2. Thedepths of grooves were set out at 0.5%, 1.25%, and 2.5%. A fixedgroove width (w) value of 3.2 mm (w/d¼ 8%) was applied, and afixed groove pitch (p) of 11 deg was applied, following the exam-ple of other studies [9,10,19,20] in which more or less than 1% ofdepth, 8% of width, and 11 deg of pitch were used. The angles (h)of grooves were measured clockwise from the line X.
In order to draw an optimal value of design factor, near-wakeflow field was measured at different angles after making grooveson a part of the circumference. An optimal design angle wasdetermined by the optimal analysis of Taguchi method on velocitydata (Uc, u0c, v0c, uvmax) measured at wake flow field. Finally,grooves were symmetrically created on the surface of a circularcylinder at the optimal angle and we measure wake flow field andboundary layer flow field of a circular cylinder, which are com-pared with that of a circular cylinder with smooth surface. Wakeflow was measured using PIV (0.5d�X� 3d) and X-type hot-wire (X¼ 5d), and boundary layer flow was measured by I-typehot-wire.
In this study, we used four design parameters {Uo, k, n, h} forthe application of the Taguchi method without a groove width (w)or groove pitch (p). For each design parameter, three levels weredefined as shown in Table 3.
L27(36) was used for the orthogonal array, which is commonlyused at three levels.
2.2 Experimental Setup. The values of the characteristicswere measured during a wind tunnel experiment. The wind tunnelcreated in this study was an open loop, suction-type, subsonicwind tunnel with a measurement zone of 305 mm� 305 mm(width� height). The measurement points were selected on thecentral line of the circular cylinder at 8 mm intervals from X¼ 5d,within the range of Y¼þ3d��3d, and the velocity was measuredusing X-type hot wire. Data acquisition and the movement of hotwire were controlled online through a PC, and all the acquireddata was processed using an offline program. Figure 3 shows thediagram of the measuring system.
The near wake of circular cylinder was measured using PIV.PIV system used in this study consists of laser system, high reso-lution CCD camera, synchronizer (TSI 610,032) and a computerto drive the system. The laser used as light source is Nd:Yag laserin double pulse way, and the power is 250 mJ. The resolution ofthe CCD camera is 1 K� 1 K, and the space between frames is
Table 2 Definition of characteristics
Characteristics Definition
DU Uc/Uo
Du0 u0c/Uo
Dv0 v0c/Uo
Duv uvmax/Uo2
Fig. 2 Shape of the circular cylinder with grooves
Journal of Fluids Engineering NOVEMBER 2013, Vol. 135 / 111202-3
Downloaded From: http://fluidsengineering.asmedigitalcollection.asme.org/ on 02/06/2014 Terms of Use: http://asme.org/terms

less than 35 ls. Lens is NIKON 50 mm standard lens, and f2.8 dia-phragm value was used in image acquisition. The particle usedhere is olive oil aerosol using Raskin nozzle and the average di-ameter of the particle is 2 lm.
3 Results of the Experiments
3.1 Selection of Optimal Design Parameters. The values ofthe characteristics of the object equation measured in the experi-ment are shown in Table 5.
Figure 4 shows the factorial effect graphs of DU, Du0, Dv0, Duv.From these graphs, four design parameter levels for optimaldesign were selected. The free-stream velocity factor, Uo, is notan important factor but was used as a reference factor for the eval-uation of the performance of design parameters. Since the respec-tive maximum and minimum values of Uo is different among thefour characteristics, we chose the median value at level 2.
When determining the optimal level of the depth of a groove(k) for the reduction of drag, it was observed that the value of DUincreased as the value of k became greater. This means that dragdecreased as the value of k became greater, and Du0, Dv0, and Duv,which are related to the intensity and energy of the vortex sheddedto the wake, were not influenced much by the change of k value,indicating that the vortex shedding in the wake did not influencethe structure significantly. Only the value of Du0 decreased a littlebit proportional to the value of k. Therefore, we selected level 3 ofthe depth of groove (k) based on these findings.
DU was greatest when the number of grooves (n) was four andDu0, Dv0, and Duv are at maximum suggesting that level 3 (n¼ 4)was the optimal level. Since the difference of its value from thevalue when n¼ 3 was small, level 2 (n¼ 3) was also consideredin view of the cost of metal-working and economy.
Since DU increased until the angle of the groove (h) increasedup to 70 deg and decreased thereafter, the optimal angle should bemore or less 70 deg. In view of the turbulence intensity of wake
Table 3 Levels of design parameters in 1st DOE
Level
Design parameters 1 2 3
Uo (m/s) 5 10 15k (mm) 0.2 0.5 1.0n 2 3 4h (deg) 50 70 90
Fig. 3 Diagram of measuring and data processing
Table 4 Layout of the L27(36) orthogonal array
No Uo (m/s) k (mm) n h (deg)
1 5 0.2 2 502 5 0.2 2 503 5 0.2 2 504 5 0.5 3 705 5 0.5 3 706 5 0.5 3 707 5 1 4 908 5 1 4 909 5 1 4 9010 10 0.2 3 9011 10 0.2 3 9012 10 0.2 3 9013 10 0.5 4 5014 10 0.5 4 5015 10 0.5 4 5016 10 1 2 7017 10 1 2 7018 10 1 2 7019 15 0.2 4 7020 15 0.2 4 7021 15 0.2 4 7022 15 0.5 2 9023 15 0.5 2 9024 15 0.5 2 9025 15 1 3 5026 15 1 3 5027 15 1 3 50
Table 5 Results of L27(36) orthogonal array
No DU Du0 Dv0 Duv
1 0.755 0.174 0.295 0.0252 0.767 0.178 0.297 0.0333 0.689 0.177 0.308 0.0354 0.775 0.179 0.292 0.0445 0.778 0.168 0.271 0.0446 0.771 0.182 0.289 0.0417 0.768 0.164 0.253 0.1978 0.781 0.149 0.235 0.159 0.743 0.168 0.25 0.19810 0.773 0.163 0.278 0.04211 0.778 0.182 0.292 0.06112 0.836 0.146 0.245 0.0513 0.749 0.152 0.214 0.13914 0.749 0.167 0.251 0.15115 0.767 0.159 0.23 0.12916 0.813 0.181 0.292 0.02317 0.774 0.189 0.307 0.02318 0.732 0.182 0.302 0.02719 0.76 0.155 0.26 0.1920 0.778 0.143 0.24 0.1321 0.809 0.128 0.211 0.12722 0.734 0.188 0.294 0.02823 0.772 0.191 0.311 0.02924 0.804 0.188 0.314 0.03625 0.712 0.17 0.283 0.0526 0.744 0.178 0.289 0.0627 0.773 0.185 0.28 0.064
Fig. 4 Schematic of PIV experimental setup
111202-4 / Vol. 135, NOVEMBER 2013 Transactions of the ASME
Downloaded From: http://fluidsengineering.asmedigitalcollection.asme.org/ on 02/06/2014 Terms of Use: http://asme.org/terms

flow field as well, the optimal angle h was more or less 70 degsince Du0 and Dv0 increased as h was greater and Duv was at mini-mum when the angle was 70 deg.
As described above, the levels of the angle h needed to be sub-divided to determine the optimal level. h¼ 90 deg was disre-garded, since this angle did not have much effect on the values ofcharacteristics. The optimal angle level was selected by furtherdividing the range into six levels and applying the Taguchimethod again. The parameters, {n, h}, were used while maintain-ing Uo at level 2 (10 m/s) and k at level 3 (1.0 mm). The level wasdefined as the combined levels of n¼ level 3 and h¼ level 5, asshown in Table 6. Their factorial graphs are shown in Fig. 5.
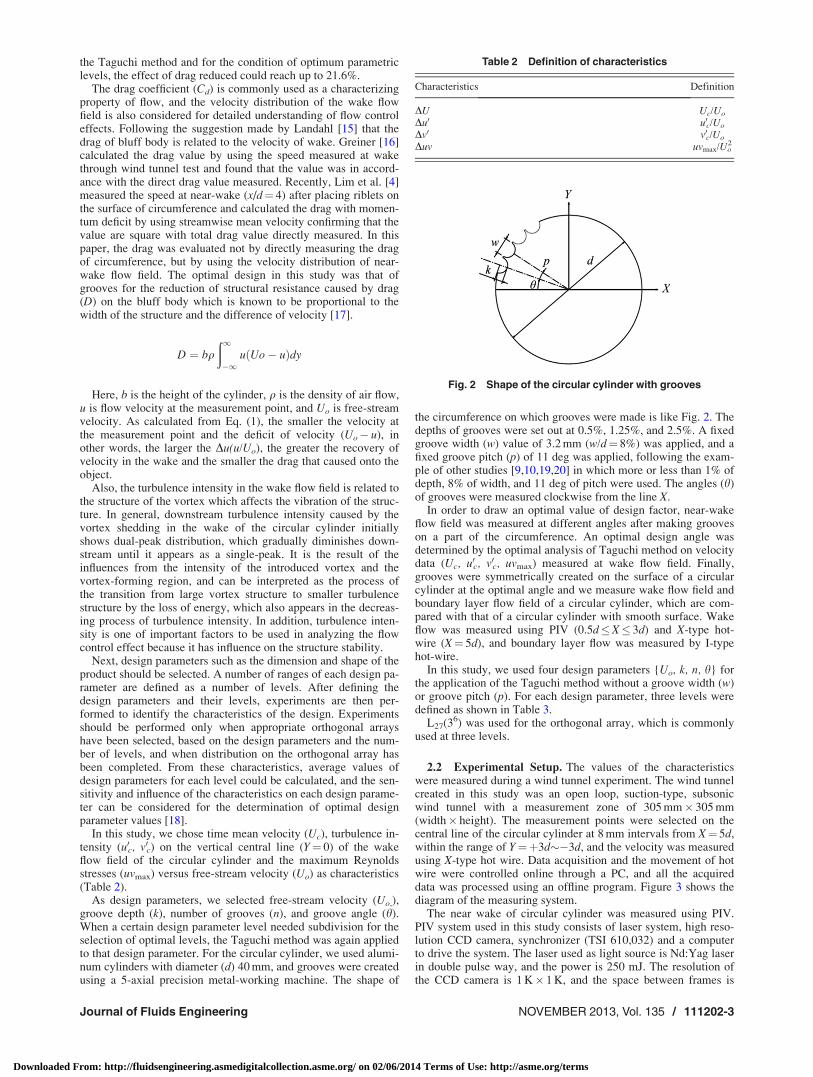
h¼ 60 deg was selected as the optimal angle since DU is atmaximum and Du0 and Dv0 are at minimum when h¼ 60 deg, asshown in Fig. 5. In conclusion, the values of design parametersfor optimal design were {k, n, h}¼ {1.0 mm, 3 or 4, 60 deg}. Ananalysis was performed of the flow structure of the wake and thewall plane flow near the surface of the circular cylinder for theoptimal geometry that was determined above. See Fig. 6 for aver-age values of parameter h in 2nd DOE.
3.2 Wake and Surface Flow Analysis. Creating the groovesdiphycercally on the surface of the circular cylinder according tothe selected optimal design conditions, the flow structure of thewake and the boundary-layer flow of the circular cylinder wereanalyzed compare to a smooth cylinder. The free-stream velocity(Uo) was set at 10 m/s.
An analysis of U/Uo as the flow structure of the wake showedthat the velocity loss was recovered by 12.3% and the wake widthbetween 6y at 0.95U/Uo was reduced by 18.4%. Momentum defi-cit, drag, calculated by momentum integral theory reduced by
28.2/%. In the analysis of u0/Uo and v0/Uo, turbulence intensitywith a grooved cylinder decreased compared with a smooth cylin-der. See Fig. 7 for comparison of wake flow characteristics.
The near-wake velocity field of circular cylinder was measuredby PIV. As shown in Fig. 8, which illustrates the instantaneouswake flow field of circular cylinder, wake width was narrowed inthe circular cylinder with the grooves, as flow separation is
Table 6 Layout and results of 2nd DOE
Parameters Characteristics
No h (deg) n DU Du0 Dv0
1 30 2 0.7786 0.1886 0.3312 30 3 0.7865 0.1684 0.30583 30 4 0.8247 0.1531 0.29164 40 2 0.7776 0.1788 0.30855 40 3 0.7898 0.1533 0.28336 40 4 0.8311 0.1454 0.28317 50 2 0.7691 0.1662 0.27868 50 3 0.8373 0.1442 0.2879 50 4 0.8406 0.1427 0.286710 60 2 0.791 0.1535 0.275111 60 3 0.8179 0.1475 0.283512 60 4 0.8385 0.1465 0.292613 70 2 0.802 0.1685 0.295514 70 3 0.7844 0.1688 0.295715 70 4 0.7951 0.165 0.299316 80 2 0.7648 0.1825 0.319717 80 3 0.7745 0.1827 0.323218 80 4 0.7774 0.183 0.3222
Fig. 5 Average values of design parameters in 1st DOE. (a) Factorial effect graph of DU; (b) factorial effect graph of DU0; (c) fac-torial effect graph of DU0; (d) factorial effect graph of Duv.
Journal of Fluids Engineering NOVEMBER 2013, Vol. 135 / 111202-5
Downloaded From: http://fluidsengineering.asmedigitalcollection.asme.org/ on 02/06/2014 Terms of Use: http://asme.org/terms
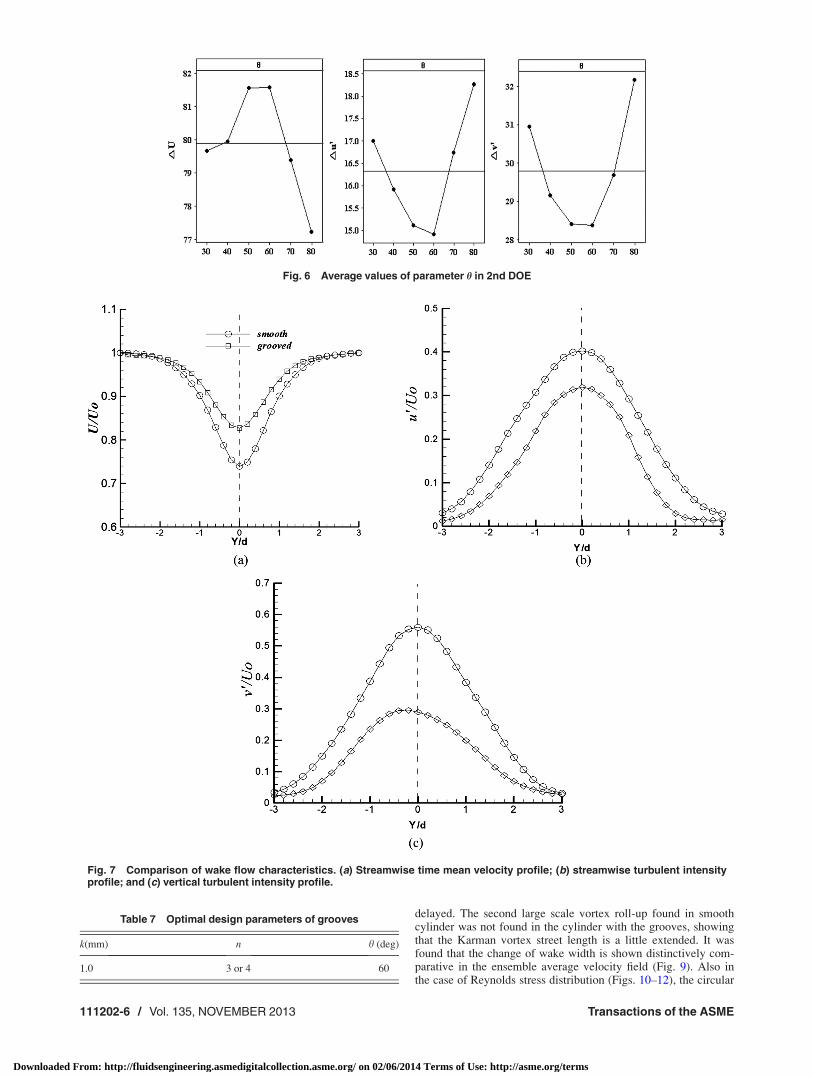
delayed. The second large scale vortex roll-up found in smoothcylinder was not found in the cylinder with the grooves, showingthat the Karman vortex street length is a little extended. It wasfound that the change of wake width is shown distinctively com-parative in the ensemble average velocity field (Fig. 9). Also inthe case of Reynolds stress distribution (Figs. 10–12), the circular
Fig. 6 Average values of parameter h in 2nd DOE
Fig. 7 Comparison of wake flow characteristics. (a) Streamwise time mean velocity profile; (b) streamwise turbulent intensityprofile; and (c) vertical turbulent intensity profile.
Table 7 Optimal design parameters of grooves
k(mm) n h (deg)
1.0 3 or 4 60
111202-6 / Vol. 135, NOVEMBER 2013 Transactions of the ASME
Downloaded From: http://fluidsengineering.asmedigitalcollection.asme.org/ on 02/06/2014 Terms of Use: http://asme.org/terms
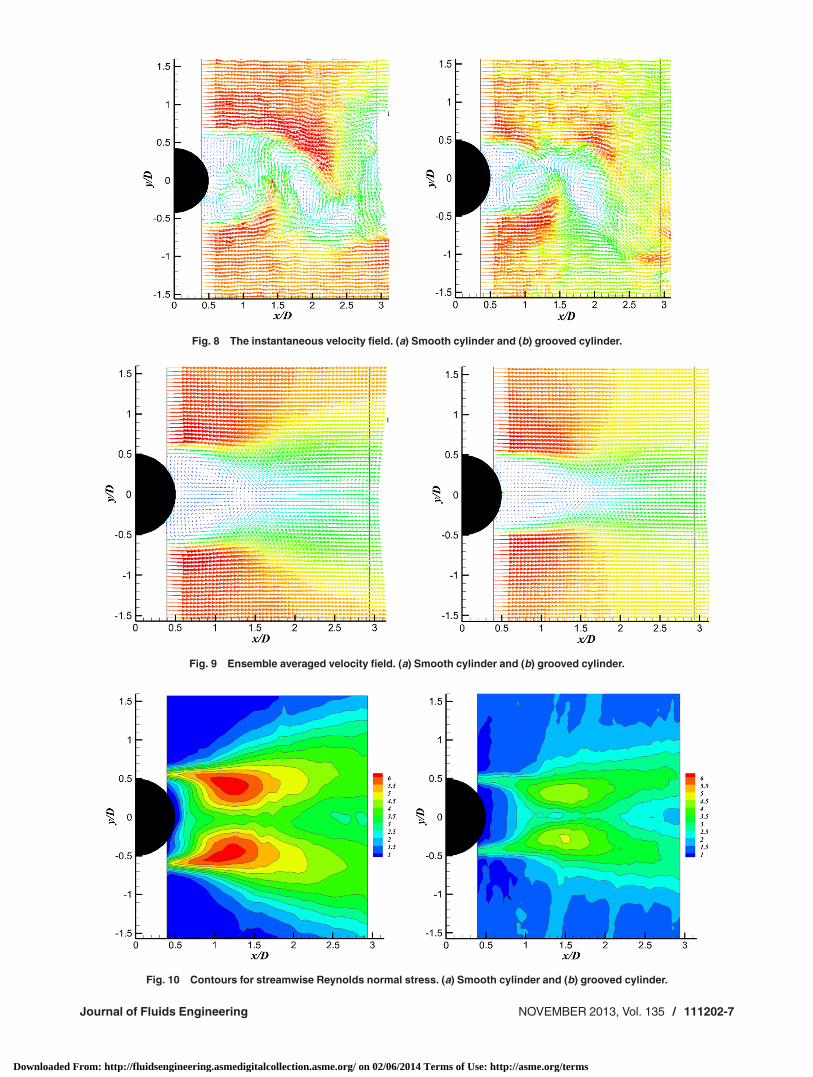
Fig. 8 The instantaneous velocity field. (a) Smooth cylinder and (b) grooved cylinder.
Fig. 9 Ensemble averaged velocity field. (a) Smooth cylinder and (b) grooved cylinder.
Fig. 10 Contours for streamwise Reynolds normal stress. (a) Smooth cylinder and (b) grooved cylinder.
Journal of Fluids Engineering NOVEMBER 2013, Vol. 135 / 111202-7
Downloaded From: http://fluidsengineering.asmedigitalcollection.asme.org/ on 02/06/2014 Terms of Use: http://asme.org/terms

cylinder with grooves showed narrower stress distribution areacompared to the smooth circular cylinder and stress intensity wasalso reduced.
The streamwise time mean velocity and turbulence intensitynear the surface of the smooth cylinder and the grooved circularcylinder were measured using an I-type hot wire. Eight locationsat the downstream angle (U) of 65 deg, 71 deg, 76 deg, 82 deg, 87deg, 93 deg, 100 deg, and 110 deg were selected for measurement.At the central locations (65 deg, 76 deg, 87 deg), velocity wasmeasured at 32 points at 0.1 mm intervals by moving from thecrossing point of the radial directional line of the angle and theimaginary extension of the circular cylinder surface. At the actualcircular cylinder surface in between the grooves (71 deg, 82 deg)and beyond the last groove (93 deg, 100 deg, 110 deg), flow ve-locity was measured at 31 points at 0.1 mm intervals by movingfrom 0.1 mm from the surface of the circular cylinder in the radialdirection (Fig. 13).
The streamwise time mean velocity for each measurementangle is shown in Fig. 14. A little effect of the grooves appears at,
Fig. 11 Contours for vertical Reynolds normal stress. (a) Smooth cylinder and (b) grooved cylinder.
Fig. 12 Contours for shear stress. (a) Smooth cylinder and (b) grooved cylinder.
Fig. 13 Measuring points of flow near the surface of cylinder
111202-8 / Vol. 135, NOVEMBER 2013 Transactions of the ASME
Downloaded From: http://fluidsengineering.asmedigitalcollection.asme.org/ on 02/06/2014 Terms of Use: http://asme.org/terms

U¼ 65 deg but a greater recovery of surface velocity on the circu-lar cylinder compared with the smooth cylinder appeared ataround 71 deg. This is because momentum was supplied to theflow near the surface by separation bubbles inside the grooves andthe turbulence generated by shear layer instability [21]. The sepa-ration phenomena appeared clearly at 82 deg on the surface ofsmooth cylinder while it appeared at around 100 deg on the circu-lar cylinder. Such separation delay results in the decrease of wakewidth and drag.
The streamwise turbulence intensity for each measurementangle is shown in Fig. 15. As shown in the Fig. 15, flow separationbegan to appear at U¼ 76 deg on the surface of the smooth cylin-der and the center of the turbulence shear layer at the maximumturbulence intensity appeared at around U¼ 82 deg. On the con-trary, formation of turbulence shear layer was delayed and its sizedecreased considerably due to the grooves when a grooved circu-lar cylinder was used.
4 Conclusions
By using the Taguchi method, optimal design parameter valueswere determined for the grooves on a circular cylinder andgrooves were created on the surface of a circular cylinder basedon the optimal design values. We were able to comparatively ana-lyze the wake flow of the circular cylinder with diphycercalgrooves, and of the smooth cylinder. The boundary flow on thesurface of the circular cylinder was also included in the analysis.
Using the time mean velocity and turbulence intensity as evalu-ation characteristics of wake flow, optimal design parameter val-ues were selected: n¼ 3, k¼ 1.0 mm (k/d¼ 2.5%), and h¼ 60deg. Optimal number of grooves was either three or four, but threewas selected considering the cost of mechanical preparation ofgrooves and since the flow structure in the wake flow field wassimilar in both cases. The time mean velocity of the wake of thegrooved circular cylinder recovered by 12.3% compared with thesmooth cylinder and the wake width decreased by 18.4%. Accord-
ing to the result calculated by momentum integral theory, dragreduced by 28.2%.
Also, in near-wake flow field of the circular cylinder measuredby PIV, change of wake flow field was shown due to delayed flowseparation by the grooves.
Measurement of the flow near the surface of the cylinder indi-cated an appearance of flow separation on the smooth cylinder ataround 82 deg but it appeared beyond 90 deg on a grooved circu-lar cylinder, reducing the drag.
Acknowledgment
This work supported by Ministry of Education, Science andTechnology of Korea (Grant No. 2012R1A1A2007814).
References[1] Richard, M. W., 2004, “Impact of Advanced Aerodynamic Technology on
Transportation Energy Consumption,” SAE Paper No. 2004-01-1306.[2] Bearman, P. W., and Trueman, D. M., 1972, “An Investigation of the Flow
Around Rectangular Cylinders,” Aeronaut. Q, 23, pp. 229–237.[3] Gad-el-Hak, M., 1989, “Flow Control,” Appl. Mech. Rev., 42, pp. 261–293.[4] Lim, H. C., and Lee, S. J., 2002, “Flow Control of Circular Cylinders With
Longitudinal Grooved Surfaces,” AIAA J., 40(10), pp. 2027–2036.[5] Igarashi, T., 1986, “Effect of Tripping Wires on the Flow Around a Circular
Cylinder Normal to Airstream,” Bull. JSME, 29(255), pp. 2917–2924.[6] Price, P., 1956, “Suppression of the Fluid-Induced Vibration of Circular Cylin-
ders,” J. Engrg. Mech. Div., pp. 1030-1–1030-21.[7] Bearman, P. W., and Harvey, J. K., 1993, “Control of Circular Cylinder Flow
by the Use of Dimples,” AIAA J., 31(10), pp. 1753–1756.[8] Abboud, J. E., Karaki, W. S., and Oweis, G. F., 2011, “Particle Image Velocim-
etry Measurements in the Wake of a Cactus-Shaped Cylinder,” ASME J. FluidsEng., 133(9), p. 094502.
[9] Takeyoshi, K., and Michihisa, T., 1991, “Fluid Dynamic Effects of Grooves onCircular Cylinder Surface,” AIAA J., 29, pp. 2062–2068.
[10] Shinichi, T., Takuya, S., and Katsumi, A., 2004, “Drag Reduction Mechanismof a Circular Cylinder by Arc Grooves,” Trans. JSME B, 70(697), pp.2363–2370.
[11] Robarge, T. W., and Stark, A. M., 2004, “Design Considerations for UsingIndented Surface Treatments to Control Boundary Layer Separation,” 42ndAIAA Aerospace Sciences Meeting and Exhibit, Paper No. AIAA 2004-425.
[12] Taguchi, K., and Konish, S., 1992, Taguchi Methods, ASI Press, Dearborn, MI.
Fig. 14 Streamwise flow velocity distribution near the cylinder surface
Fig. 15 Streamwise turbulent intensity distribution near the cylinder wall
Journal of Fluids Engineering NOVEMBER 2013, Vol. 135 / 111202-9
Downloaded From: http://fluidsengineering.asmedigitalcollection.asme.org/ on 02/06/2014 Terms of Use: http://asme.org/terms

[13] Ha, J., Kim, T. Y., and Lee, D. H., 2003, “Design of Experiments for the FlowField Around Cylinder,” Paper No. KSAS03-2238.
[14] Wu, S., Ouyang, K., and Shiah, S., 2008, “Robust Design of Microbubble DragReduction in a Channel Flow Using the Taguchi Method,” Ocean Eng.,35(8–9), pp. 856–863.
[15] Landahl, M., “Drag on a Ground Vehicle in Separated Turbulent Flow,” Massa-chusetts Institute of Technology (unpublished).
[16] Greiner, C. M., 1990, “Unsteady Hot-Wire and Hot-Film Wake Measurementsof Automobile-Like Bluff Bodies,” Ph.D. thesis, Massachusetts Institute ofTechnology, Cambridge, MA.
[17] Schlichting, H., 1979, Boundary Layer Theory, 7th ed., McGraw-Hill, New York.[18] Lee, B. Y., and Lee, H. W., 2007, “Shape Optimal Design of an Automotive
Pedal Arm Using the Taguchi Method,” J. KSPE, 24(3), pp. 76–83.[19] Talley, S., and Mungal, G., 2002, “Flow Around Cactus-Shaped Cylinders,”
Center for Turbulence Research, Annual Research Briefs 2002, pp. 363–376.[20] Yamagishi, Y., and Oki, M., 2005, “Effect of Grooves Shape on Drag Coeffi-
cient of a Circular Cylinder With Grooves,” J. Jpn. Soc. Des. Eng., 40(10), pp.527–533.
[21] Choi, J., Jeon, W. P., and Choi, H. C., 2006, “Mechanism of Drag Reductionby Dimple on a Sphere,” Phys. Fluid, 18, p. 041702.
111202-10 / Vol. 135, NOVEMBER 2013 Transactions of the ASME
Downloaded From: http://fluidsengineering.asmedigitalcollection.asme.org/ on 02/06/2014 Terms of Use: http://asme.org/terms