
Sentinel Stroke National Audit Programme (SSNAP) – RCP Public Organisational... · Superseded...
27
Sentinel Stroke National Audit Programme (SSNAP) Acute organisational audit report Supplementary report for Wales Maps of hospital results December 2012
Transcript of Sentinel Stroke National Audit Programme (SSNAP) – RCP Public Organisational... · Superseded...
Sentinel Stroke National Audit Programme (SSNAP)
Acute organisational audit report Supplementary report for Wales
Maps of hospital results
December 2012

Sentinel Stroke National Audit Programme (SSNAP) Acute Organisational Audit 2012
Supplementary regional maps 2
Document Purpose
To disseminate the results of the SSNAP acute organisational audit 2012 at regional level.
Title SSNAP Acute Organisational Audit Report 2012 – Maps of results for hospitals in Wales
Author On behalf of the Intercollegiate Stroke Working Party
Publication December 2012
Audience General public, stroke survivors and their carers, health and social care professionals
Description This document has been compiled for commissioners, medical directors, stroke clinical teams, stroke survivors and their carers, and the general public and should be read in conjunction with the SSNAP acute organisational audit public report available on the RCP website. Section 1 contains colour coded point maps to graphically depict the audit results for how stroke services are organised in Wales based on 8 domains and an overall total score. The 8 domains cover important aspects of the organisation of stroke services, in particular acute care organisation, specialist roles, staffing, TIA (mini stroke) services, communication between staff groups and with patients and carers, and pathway at discharge. Section 2 of the report gives more detailed named hospital results in tabular form. The results reflect the organisation of stroke services as of 2 July 2012.
Superseded National Sentinel Stroke Audit – Organisational Report (2010, 2009, 2008, 2006, 2004)
Related publications
SSNAP Acute Organisational Audit Public Report (Royal College of Physicians, 2012) www.rcplondon.ac.uk/ssnap SSNAP Acute Organisational Audit Generic (Full) Report (Royal College of Physicians, 2012) www.rcplondon.ac.uk/ssnap National clinical guideline for stroke 4th edition (Royal College of Physicians, 2012) http://www.rcplondon.ac.uk/resources/stroke-guidelines SINAP 6th Quarterly Public Report – July – September 2012 admissions (for hospitals participating in SINAP) www.rcplondon.ac.uk/sinap National clinical guidelines for diagnosis and initial management of acute stroke and transient ischaemic attack (NICE, 2008) www.nice.org.uk/CG68 NICE Quality Standard for Stroke 2010 http://www.nice.org.uk/guidance/qualitystandards/stroke/strokequalitystandard.jsp National Stroke Strategy (Department of Health, 2007) http://www.dh.gov.uk/en/Publicationsandstatistics/Publications/PublicationsPolicyAndGuidance/DH_081062 Department of Health: Progress in improving stroke care (National Audit Office, 2010) http://www.nao.org.uk/publications/0910/stroke.aspx
Contact [email protected]

Sentinel Stroke National Audit Programme (SSNAP) Acute Organisational Audit 2012
Supplementary regional maps 3
Table of Contents
Organisation of stroke care in Wales 4
Section 1: Maps of national and regional performance 5
Total organisational score 6
Domain 1 – Acute care organisation 8
Domain 2 – Organisation of care 10
Domain 3 – Specialist Roles 12
Domain 4 – Inter disciplinary services (for hospitals with a stroke unit) 14
Domain 5 – TIA/neurovascular service 16
Domain 6 – Quality improvement, training and research 18
Domain 7 – Team working 20
Domain 8 – Communication with patients and carers 22
Section 2: Named hospital results in more detail 24

Sentinel Stroke National Audit Programme (SSNAP) Acute Organisational Audit 2012
Supplementary regional maps 4
Organisation of stroke care in Wales
This document gives an overview of the organisation of stroke services in Wales. It is based on data submitted for the Sentinel Stroke National Audit Programme (SSNAP) Acute Organisational Audit by 190 participating hospitals (100% of eligible trusts). This audit measured the organisation of stroke services as on 2 July 2012. The audit results are divided into 8 domains covering key aspects of the organisation of stroke care. A domain comprises several elements that relate to the topic. A scoring system was developed to enable hospitals to compare their organisation of stroke care with other hospitals. The scores for each domain range from 0 to 100 with 100 being the optimal score. In section 1 of this report, results are graphically presented through colour-coded point maps. Each hospital in the region is denoted a symbol the colour of which displays whether it has achieved a low, intermediate or high score for each domain. This will be based on their score in that domain, relative to all other hospitals nationally. A total organisational score is obtained by calculating the average of the 8 domain scores. There is a brief overview of the aspects of stroke service organisation included in each domain, followed by the national level results, including information about the spread of results across all participating hospitals and the national median. A national colour coded map is also given. This will help to benchmark the results for hospitals within this region against the national picture. In section 2 of the report, more detailed named hospital results for hospitals within Wales for some key measures including the 8 domains are presented in tabular form. These contain further measures of stroke service organisation in addition to domain scores and total scores. It is important that this supplementary document is read alongside the full acute organisational audit public report for context and further information. This can be found at www.rcplondon.ac.uk/ssnap. Note Data from SSNAP is submitted on the basis of a discrete service, referred to as a ‘site’. There are 190 participating ‘sites’ in the audit. However, in 23 ‘sites’ the stroke care pathway covers more than one hospital. In these cases we used the postcode supplied by the lead clinician at registration to generate the maps. For example the postcode used to represent Imperial College NHS Foundation Trust is St Mary’s Hospital. If a hospital position appears to be incorrect please refer to Appendix 2 of the full public report on our website. For simplicity and ease of reading ‘sites’ are referred to as hospitals in this report.

Sentinel Stroke National Audit Programme (SSNAP) Acute Organisational Audit 2012
Supplementary regional maps 5
Section 1: National and Regional Maps
This is the only map in the report in which the names of the hospitals will be given. It should be referred to when looking at all other maps to identify hospitals.

Sentinel Stroke National Audit Programme (SSNAP) Acute Organisational Audit 2012
Supplementary regional maps 6
Total organisational score
A total organisational score is obtained by calculating the average of the 8 domain scores. The map below shows the overall organisational position performance of hospitals nationally. Each symbol represents a hospital, colour coded by whether it is in the top 25% of hospitals (upper quartile), the bottom 25% of hospitals (lower quartile), or the middle half. The table below shows the range of scores for all 190 hospitals in the audit.
Lower scores Intermediate
scores Higher scores
48 hospitals (25%) Scored 11.5-66.6
95 hospitals (50%) Scored 66.6-80.4
47 hospitals (25%) Scored 80.4-97.5
The median organisational score nationally is 73.3

Sentinel Stroke National Audit Programme (SSNAP) Acute Organisational Audit 2012
Supplementary regional maps 7
The map below shows the overall organisational position performance of hospitals in Wales. It gives the actual score achieved by each hospital in addition to its colour coded position relative to all sites nationally.
Sentinel Stroke National Audit Programme (SSNAP) Acute Organisational Audit 2012
Supplementary regional maps 8
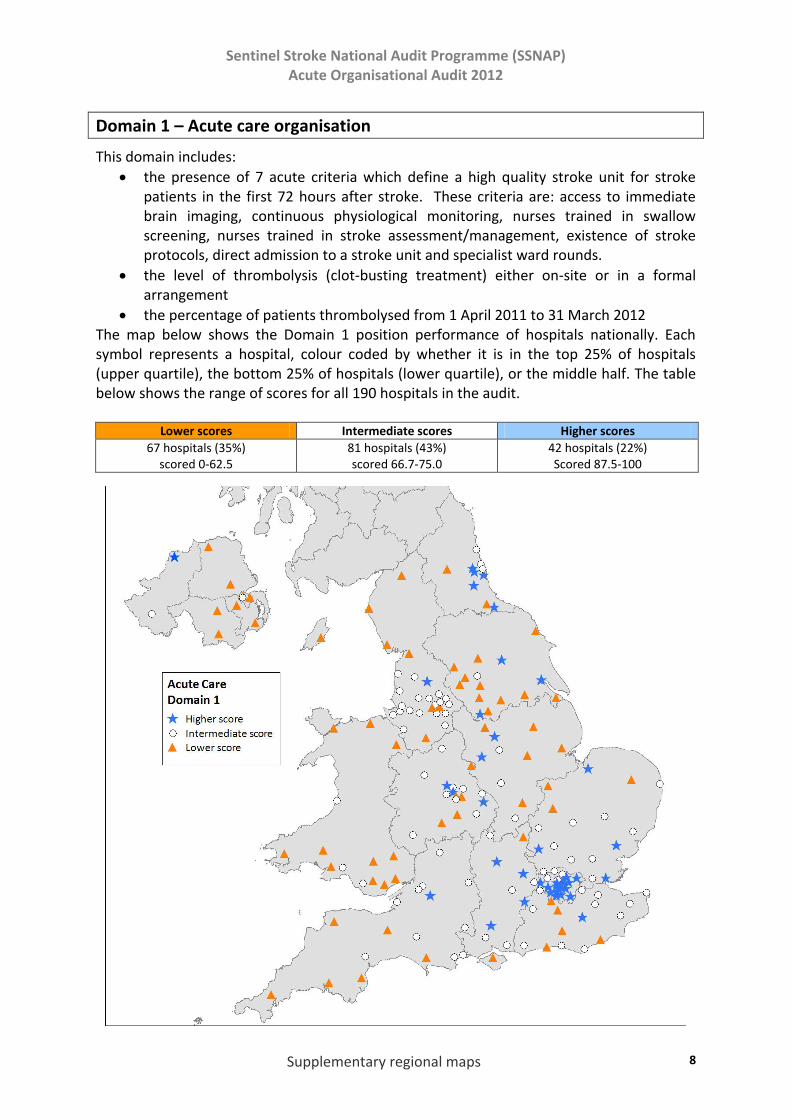
Domain 1 – Acute care organisation
This domain includes:
the presence of 7 acute criteria which define a high quality stroke unit for stroke patients in the first 72 hours after stroke. These criteria are: access to immediate brain imaging, continuous physiological monitoring, nurses trained in swallow screening, nurses trained in stroke assessment/management, existence of stroke protocols, direct admission to a stroke unit and specialist ward rounds.
the level of thrombolysis (clot-busting treatment) either on-site or in a formal arrangement
the percentage of patients thrombolysed from 1 April 2011 to 31 March 2012 The map below shows the Domain 1 position performance of hospitals nationally. Each symbol represents a hospital, colour coded by whether it is in the top 25% of hospitals (upper quartile), the bottom 25% of hospitals (lower quartile), or the middle half. The table below shows the range of scores for all 190 hospitals in the audit.
Lower scores Intermediate scores Higher scores
67 hospitals (35%) scored 0-62.5
81 hospitals (43%) scored 66.7-75.0
42 hospitals (22%) Scored 87.5-100

Sentinel Stroke National Audit Programme (SSNAP) Acute Organisational Audit 2012
Supplementary regional maps 9
The map below shows the Domain 1 position performance of hospitals in Wales. It gives the actual score achieved by each hospital in addition to its colour coded position relative to all sites nationally.

Sentinel Stroke National Audit Programme (SSNAP) Acute Organisational Audit 2012
Supplementary regional maps 10
Domain 2 – Organisation of care
This domain includes
the location of stroke patients on the day of the audit
ratio of stroke unit beds to the number of inpatients with stroke
presence and composition of a stroke/neurology specialist early supported discharge (ESD) multidisciplinary team
presence and composition of a stroke/neurology specialist community team for longer term management
access to physiotherapist, occupational therapist or speech and language therapist in specialist ESD team within 48 hours
The map below shows the Domain 2 position performance of hospitals nationally. Each symbol represents a hospital, colour coded by whether it is in the top 25% of hospitals (upper quartile), the bottom 25% of hospitals (lower quartile), or the middle half. The table below shows the range of scores for all 190 hospitals in the audit.
Lower scores Intermediate scores Higher scores
56 hospitals (29%) Scored 0-45.0
89 hospitals (47%) Scored 50.0-80.0
45 hospitals (24%) Scored 85.0-100

Sentinel Stroke National Audit Programme (SSNAP) Acute Organisational Audit 2012
Supplementary regional maps 11
The map below shows the Domain 2 position performance of hospitals in Wales. It gives the actual score achieved by each hospital in addition to its colour coded position relative to all sites nationally.

Sentinel Stroke National Audit Programme (SSNAP) Acute Organisational Audit 2012
Supplementary regional maps 12
Domain 3 – Specialist Roles
This domain describes and quantifies the specialist medical care available for participating hospitals. It includes
the number of consultant ward rounds per week for stroke units
the seniority of nurses and therapists
access to social work expertise, orthoptics, orthotics and podiatry (foot health) within 5 days
treatment of palliative care patients on the stroke unit.
access to clinical psychologists and aspects of psychological care provided
provision of educational and vocational training
whether or not patients stay in bed until assessed by physiotherapist The map below shows the Domain 3 position performance of hospitals nationally. Each symbol represents a hospital, colour coded by whether it is in the top 25% of hospitals (upper quartile), the bottom 25% of hospitals (lower quartile), or the middle half. The table below shows the range of scores for all 190 hospitals in the audit.
Lower scores Intermediate scores Higher scores
66 hospitals (35%) Scored 0-60.0
78 hospitals (41%) Scored 62.5-80.0
46 hospitals (24%) Scored 81.3-100
Sentinel Stroke National Audit Programme (SSNAP) Acute Organisational Audit 2012
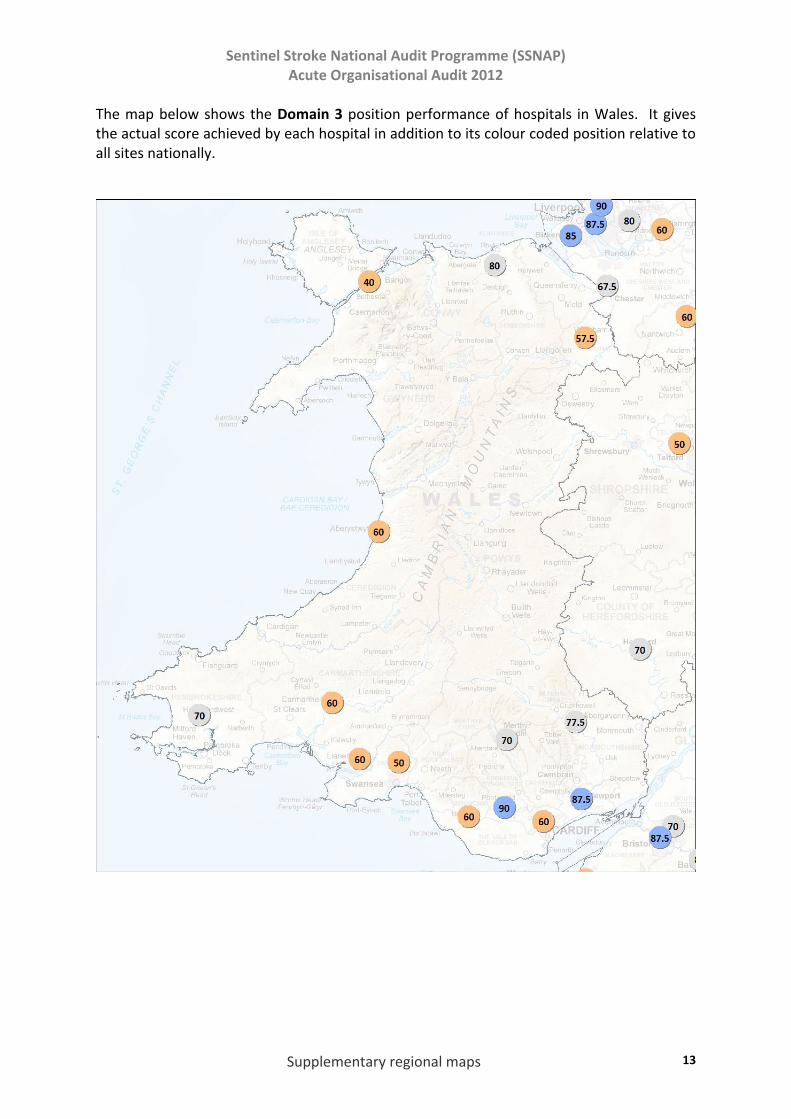
Supplementary regional maps 13
The map below shows the Domain 3 position performance of hospitals in Wales. It gives the actual score achieved by each hospital in addition to its colour coded position relative to all sites nationally.

Sentinel Stroke National Audit Programme (SSNAP) Acute Organisational Audit 2012
Supplementary regional maps 14
Domain 4 – Inter disciplinary services (for hospitals with a stroke unit)
The composition of the multidisciplinary team and staffing of different professions in the stroke units are described and the ratio of staff to stroke unit beds quantified. Research shows patients with acute stroke should be offered organised inpatient care, which is typically provided by a co-ordinated multidisciplinary team operating within a discrete stroke ward. This domain includes
Qualified nurses on duty at 10 am weekdays per 10 SU beds
Care assistants on duty at 10 am weekdays per 10 SU beds
Qualified therapy staff availability in WTE (Whole Time Equivalents) per 10 stroke unit beds: Clinical psychology/Dietetics/Occupational Therapy/Physiotherapy/Speech & Language Therapy/Pharmacy
6 or 7 day working for occupational therapy, physiotherapy, speech and language therapy
The map below shows the Domain 4 position performance of hospitals nationally. Each symbol represents a hospital, colour coded by whether it is in the top 25% of hospitals (upper quartile), the bottom 25% of hospitals (lower quartile), or the middle half. The table below shows the range of scores for all 190 hospitals in the audit.
Lower scores Intermediate scores Higher scores
54 hospitals (29%) Scored 0-42.5
96 hospitals (51%) Scored 45.0-65.0
40 (21%) Scored 67.5-87.5

Sentinel Stroke National Audit Programme (SSNAP) Acute Organisational Audit 2012
Supplementary regional maps 15
The map below shows the Domain 4 position performance of hospitals in Wales. It gives the actual score achieved by each hospital in addition to its colour coded position relative to all sites nationally.
Sentinel Stroke National Audit Programme (SSNAP) Acute Organisational Audit 2012
Supplementary regional maps 16
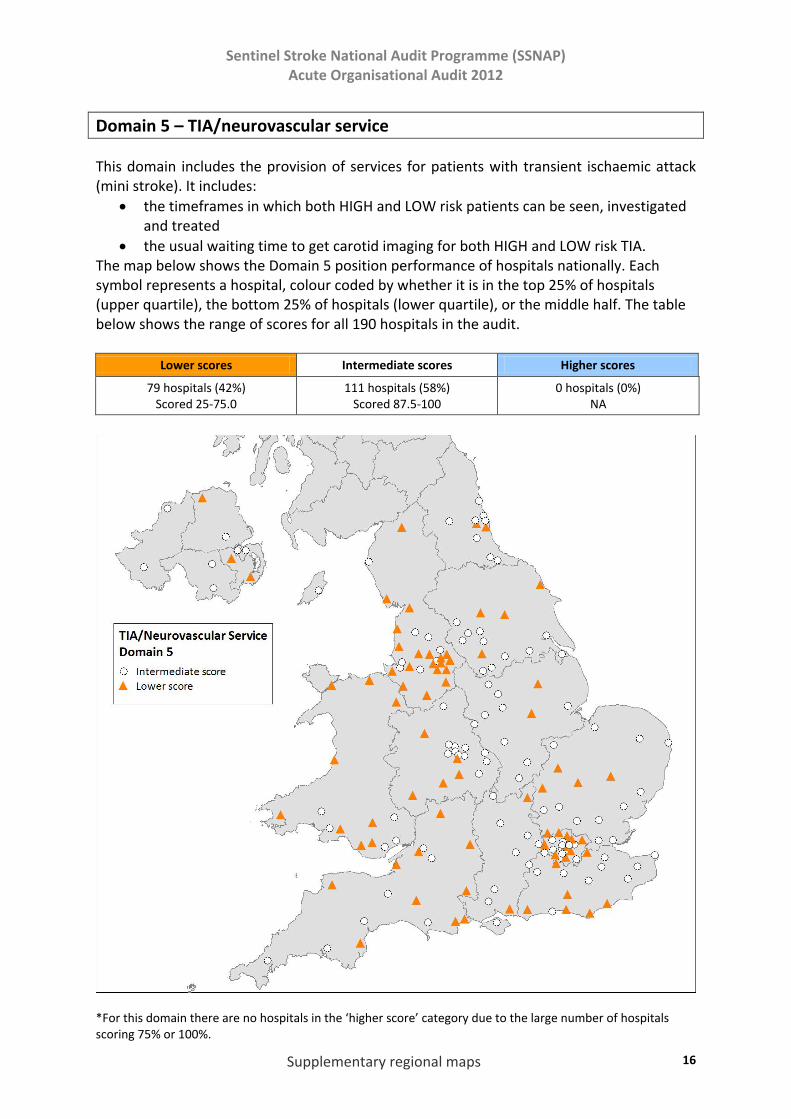
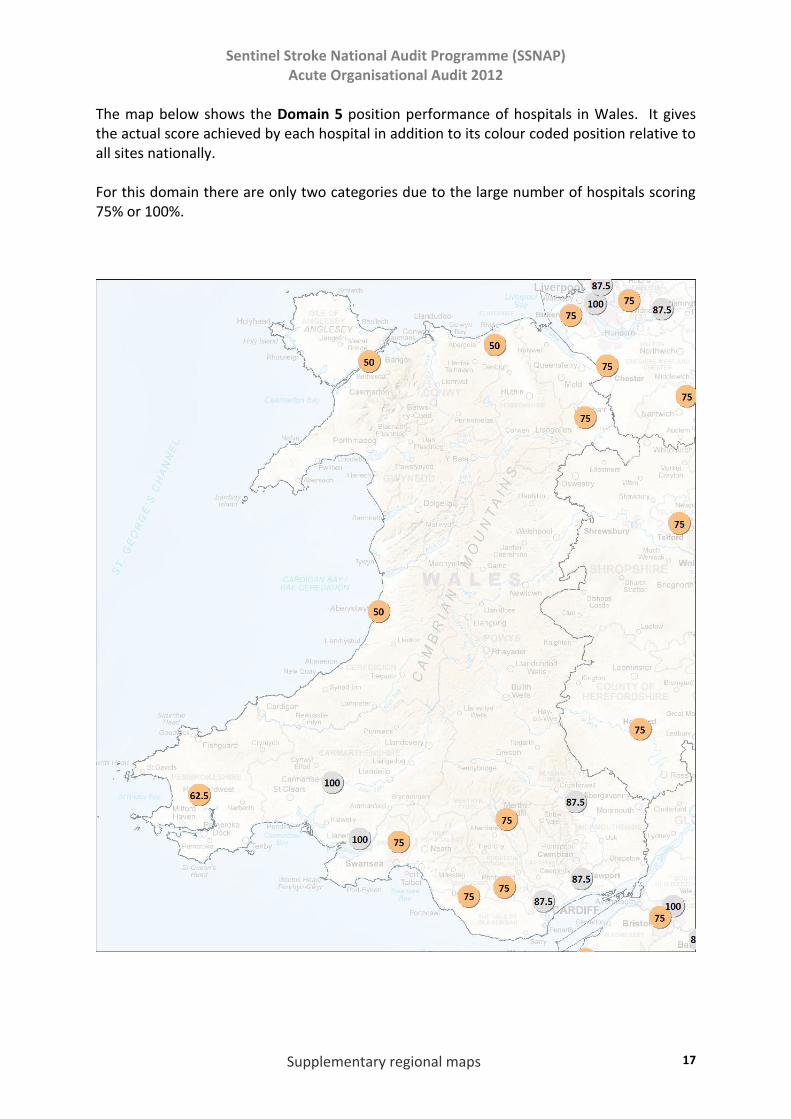
Domain 5 – TIA/neurovascular service
This domain includes the provision of services for patients with transient ischaemic attack (mini stroke). It includes:
the timeframes in which both HIGH and LOW risk patients can be seen, investigated and treated
the usual waiting time to get carotid imaging for both HIGH and LOW risk TIA. The map below shows the Domain 5 position performance of hospitals nationally. Each symbol represents a hospital, colour coded by whether it is in the top 25% of hospitals (upper quartile), the bottom 25% of hospitals (lower quartile), or the middle half. The table below shows the range of scores for all 190 hospitals in the audit.
Lower scores Intermediate scores Higher scores
79 hospitals (42%) Scored 25-75.0
111 hospitals (58%) Scored 87.5-100
0 hospitals (0%) NA
*For this domain there are no hospitals in the ‘higher score’ category due to the large number of hospitals scoring 75% or 100%.
Sentinel Stroke National Audit Programme (SSNAP) Acute Organisational Audit 2012
Supplementary regional maps 17
The map below shows the Domain 5 position performance of hospitals in Wales. It gives the actual score achieved by each hospital in addition to its colour coded position relative to all sites nationally. For this domain there are only two categories due to the large number of hospitals scoring 75% or 100%.
Sentinel Stroke National Audit Programme (SSNAP) Acute Organisational Audit 2012
Supplementary regional maps 18
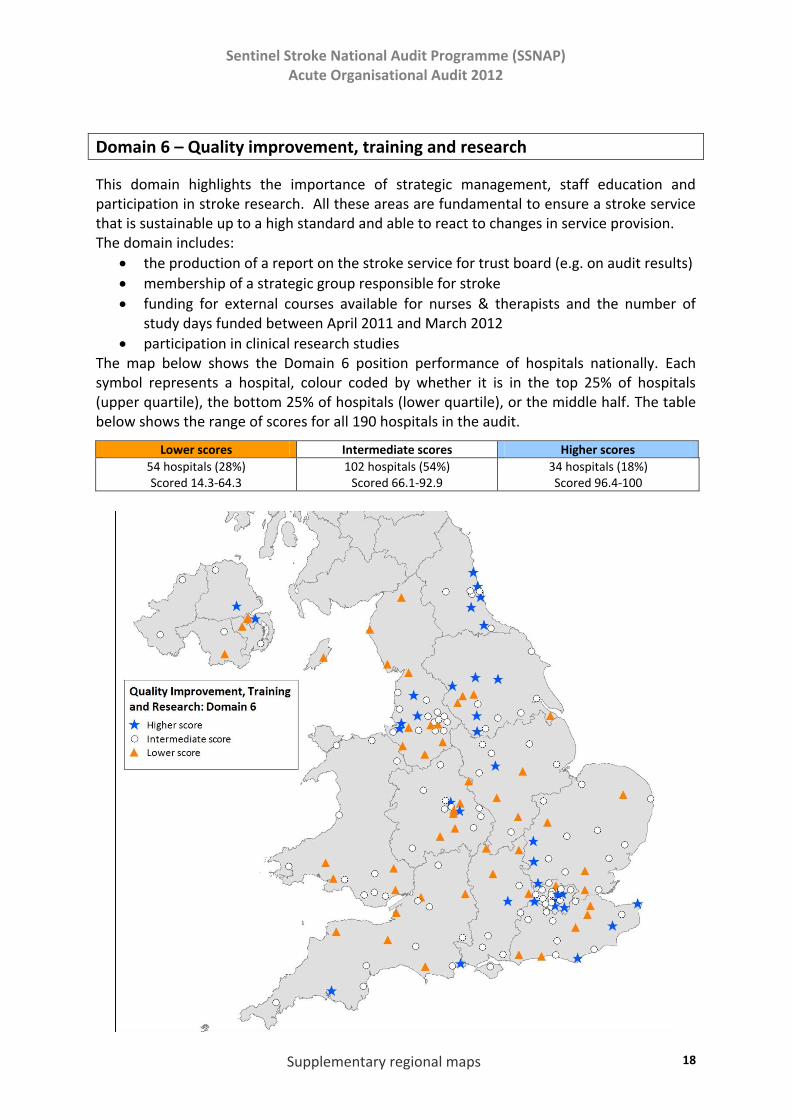
Domain 6 – Quality improvement, training and research
This domain highlights the importance of strategic management, staff education and participation in stroke research. All these areas are fundamental to ensure a stroke service that is sustainable up to a high standard and able to react to changes in service provision. The domain includes:
the production of a report on the stroke service for trust board (e.g. on audit results)
membership of a strategic group responsible for stroke
funding for external courses available for nurses & therapists and the number of study days funded between April 2011 and March 2012
participation in clinical research studies The map below shows the Domain 6 position performance of hospitals nationally. Each symbol represents a hospital, colour coded by whether it is in the top 25% of hospitals (upper quartile), the bottom 25% of hospitals (lower quartile), or the middle half. The table below shows the range of scores for all 190 hospitals in the audit.
Lower scores Intermediate scores Higher scores
54 hospitals (28%) Scored 14.3-64.3
102 hospitals (54%) Scored 66.1-92.9
34 hospitals (18%) Scored 96.4-100

Sentinel Stroke National Audit Programme (SSNAP) Acute Organisational Audit 2012
Supplementary regional maps 19
The map below shows the Domain 6 position performance of hospitals in Wales. It gives the actual score achieved by each hospital in addition to its colour coded position relative to all sites nationally.
Sentinel Stroke National Audit Programme (SSNAP) Acute Organisational Audit 2012
Supplementary regional maps 20
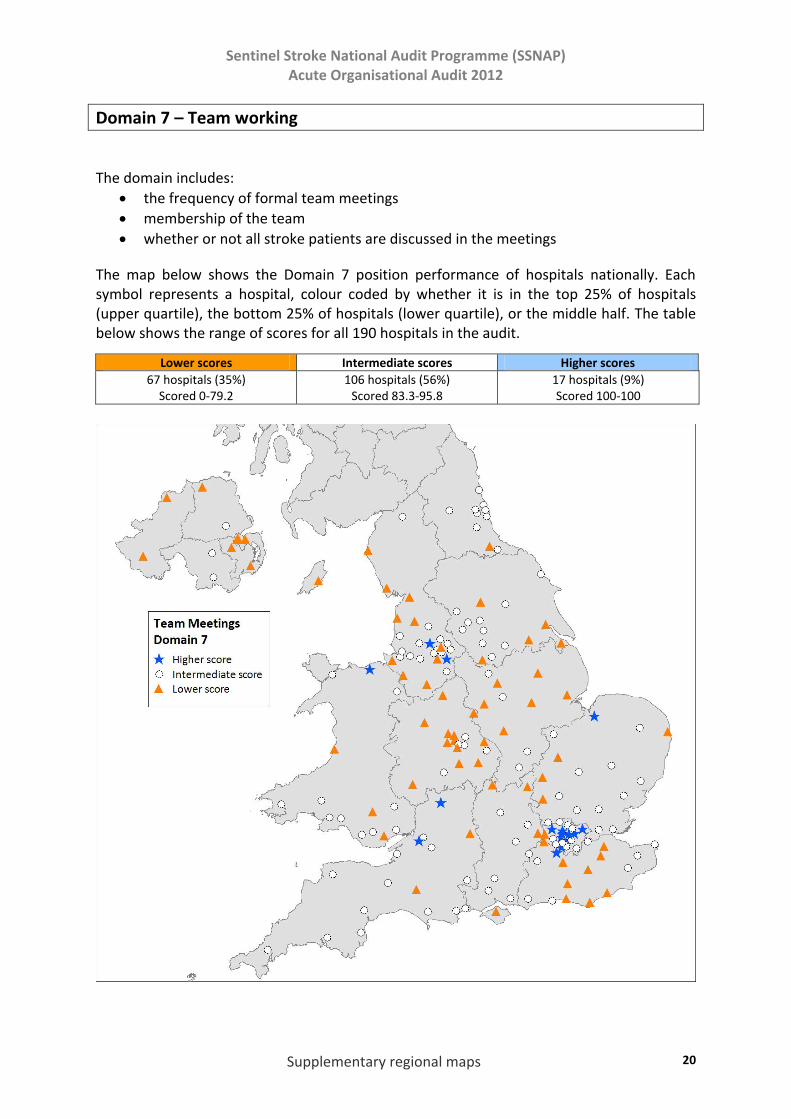
Domain 7 – Team working
The domain includes:
the frequency of formal team meetings
membership of the team
whether or not all stroke patients are discussed in the meetings
The map below shows the Domain 7 position performance of hospitals nationally. Each symbol represents a hospital, colour coded by whether it is in the top 25% of hospitals (upper quartile), the bottom 25% of hospitals (lower quartile), or the middle half. The table below shows the range of scores for all 190 hospitals in the audit.
Lower scores Intermediate scores Higher scores
67 hospitals (35%) Scored 0-79.2
106 hospitals (56%) Scored 83.3-95.8
17 hospitals (9%) Scored 100-100

Sentinel Stroke National Audit Programme (SSNAP) Acute Organisational Audit 2012
Supplementary regional maps 21
The map below shows the Domain 7 position performance of hospitals in Wales. It gives the actual score achieved by each hospital in addition to its colour coded position relative to all sites nationally.

Sentinel Stroke National Audit Programme (SSNAP) Acute Organisational Audit 2012
Supplementary regional maps 22
Domain 8 – Communication with patients and carers
The domain includes:
whether patients have access to their management plan
availability of patient information on each of the following topics for stroke units & outpatients: Patient version of national or local guidelines/standards/Social services/Benefits agencies/Secondary prevention advice
whether patients are given a personalised rehabilitation discharge plan
formal links with patients and carers organisations on ALL of the following: services provision, audit, and service reviews and future plans
community user group for stroke
policy to give patients a named contact on transfer from hospital to the community
patient/carer views sought on stroke services
report produced within past 12 months which analysed views of patients The map below shows the Domain 8 position performance of hospitals nationally. Each symbol represents a hospital, colour coded by whether it is in the top 25% of hospitals (upper quartile), the bottom 25% of hospitals (lower quartile), or the middle half. The table below shows the range of scores for all 190 hospitals in the audit.
Lower scores Intermediate scores Higher scores
48 hospitals (25%) Scored 12.5-62.5
112 hospitals (59%) Scored 64.1-93.8
30 hospitals (16%) Scored 95.3-100

Sentinel Stroke National Audit Programme (SSNAP) Acute Organisational Audit 2012
Supplementary regional maps 23
The map below shows the Domain 8 position performance of hospitals in Wales. It gives the actual score achieved by each hospital in addition to its colour coded position relative to all sites nationally.

Sentinel Stroke National Audit Programme (SSNAP) Acute Organisational Audit 2012
Supplementary regional maps 24
Section 2: Regional Public Tables
The tables in this chapter give named hospital results in alphabetical order of trust name for hospitals in Wales. Please note this describes the self-reported status on 2 July 2012. These tables should be read in context as part of the full SSNAP Acute Organisational Audit Report 2012 and the full audit questions (appendix 2 of the report).
The tables describe the performance for some selected indicators for each site in Wales. Each hospital’s results are spread across three tables on consecutive pages. These measures each represent an important aspect of good stroke care organisation. The national median for each measure is given in the top row of the table to enable benchmarking.
A scoring system was developed to enable sites to compare their organisation of stroke care with other sites. The scores for 8 separate components of organisation each range from 0 to 100 with 100 being the optimal score. A total organisational score is obtained by calculating the average of the 8 domain scores. The 25% of hospitals with the best stroke care organisation are in the upper quartile, the least well organised 25% of hospitals are in the lower quartile. The middle half lie between the two.
It should be noted that the scoring system has changed from the 2010 National Sentinel Stroke Audit. There are now more stringent criteria to achieve maximum points for several domain elements including proportion of patients thrombolysed, composition of early supported discharge (ESD) and community rehabilitation teams, and 6 or 7 day therapy working. Also, questions which were asked for the first time in 2010 are included in the scoring this time e.g. access to clinical psychology.
The three tables are colour coded to facilitate ease of use. Table 1 gives information about the type and number of stroke unit within each hospital, the quality of these beds according to the number of acute criteria (max 7), stroke unit features (max. 5) as a marker for quality of all stroke units, the level of thrombolysis provision on-site or with local arrangements, and staffing levels.
Table 2 includes information about the availability of a specialist early supported discharge team and a specialist community rehabilitation team, the availability of a neurovascular/TIA clinic and waiting times to be seen and investigated, quality improvement measures, research and patient involvement. The total organisational score is an aggregated score across all domains.
Table 3 includes information about leadership, participation in SINAP (the acute stroke audit), individual domain scores and overall score.
Please see the key to the tables in the full report, available from www.rcplondon.ac.uk/ssnap

Sentinel Stroke National Audit Programme (SSNAP)Acute Organisational Audit Report 2012
Stroke unit features
Thrombolysis provision
Site Name 2012Type 1 beds
Type 2 beds
Type 3 beds
Type 1 beds
Type 3 beds
Number of 5 SUTC criteria achieved
Availability and 24/7 provision offered onsite or in
collaboration
Qualified Nurses ‐ WTEs per 10 SU beds
Physiotherapy ‐ WTEs per 10
beds
Occupational Therapy ‐ WTEs per 10 beds
Speech and Language
Therapy ‐ WTEs per 10 beds
6 or 7 day working for at least 2 of PT, OT and
SALT
Number of programmed activities for
stroke consultant physicians
Junior doctor time per week for all SU beds
Access to clinical psychologist(s)
NATIONAL 0 0 16 6 6 4 90% 8.00 1.31 1.09 0.47 23% 20 26 52%WalesAbertawe Bro Morgannwg University Health Board (Morriston Hospital and Singleton Hospital) 0 26 17 NA 5 5 24/7 on‐site Below median Below median Below median Below median No Equals median Above median No
Abertawe Bro Morgannwg University Health Board (Princess of Wales Hospital)
0 0 23 NA 5 5 24/7 on‐site Below median Below median Below median Below median No Equals median Above median No
Aneurin Bevan Health Board (Nevill Hall Hospital)0 0 22 NA 4 4
<24/7 on‐site, 24/7 through local arrangements
Below median Above median Below median Below median No Below median Below median Yes
Aneurin Bevan Health Board (St Woolos Hospital, Royal Gwent and Caerphilly District Miner's Hospital)
0 0 23 NA 4 4 24/7 on‐site Below median Above median Below median Below median No Below median Above median Yes
Betsi Cadwaladr University Health Board (Glan Clwyd District General Hospital)
0 0 29 NA 5 5 24/7 on‐site Below median Below median Below median Below median No Below median Below median Yes
Betsi Cadwaladr University Health Board (Wrexham Maelor Hospital)
0 0 21 NA 5 5 24/7 on‐site Below median Below median Below median Below median No Below median Below median Yes
Betsi Cadwaladr University Health Board (Ysbyty Gwynedd)
0 0 13 NA 5 4 24/7 on‐site Above median Below median Below median Below median No Below median Below median No
Cardiff and Vale University Health Board (University Hospital Wales)
4 14 0 4 NA 4 24/7 on‐site Above median Below median Below median Above median No Above median Above median Yes
Cwm Taf Health Board (Prince Charles Hospital)0 0 6 NA 5 5 24/7 on‐site Below median Above median Below median Above median No Below median Below median No
Cwm Taf Health Board (Royal Glamorgan Hospital)
0 0 12 NA 5 5 24/7 on‐site Below median Below median Below median Above median No Below median Below median Yes
Hywel Dda Health Board (Bronglais General Hospital)
4 4 0 6 NA 4 24/7 on‐site Below median Above median Above median Above median No Below median Below median No
Hywel Dda Health Board (Prince Philip Hospital)5 5 0 4 NA 5 24/7 on‐site Below median Below median Below median Above median No Below median Below median No
Hywel Dda Health Board (West Wales General Hospital)
5 5 10 4 5 5 24/7 on‐site Below median Below median Below median Below median No Below median Below median No
Hywel Dda Health Board (Withybush General Hospital)
8 8 0 4 NA 5 24/7 on‐site Above median Above median Below median Above median No Below median Below median No
Number of stroke beds onsite
Number of acute criteria achieved
Staffing levels

Sentinel Stroke National Audit Programme (SSNAP)Acute Organisational Audit Report 2012
Site Name 2012
NATIONALWalesAbertawe Bro Morgannwg University Health Board (Morriston Hospital and Singleton Hospital)
Abertawe Bro Morgannwg University Health Board (Princess of Wales Hospital)Aneurin Bevan Health Board (Nevill Hall Hospital)
Aneurin Bevan Health Board (St Woolos Hospital, Royal Gwent and Caerphilly District Miner's Hospital)Betsi Cadwaladr University Health Board (Glan Clwyd District General Hospital)Betsi Cadwaladr University Health Board (Wrexham Maelor Hospital)Betsi Cadwaladr University Health Board (Ysbyty Gwynedd)Cardiff and Vale University Health Board (University Hospital Wales)Cwm Taf Health Board (Prince Charles Hospital)
Cwm Taf Health Board (Royal Glamorgan Hospital)Hywel Dda Health Board (Bronglais General Hospital)Hywel Dda Health Board (Prince Philip Hospital)
Hywel Dda Health Board (West Wales General Hospital)Hywel Dda Health Board (Withybush General Hospital)
Research
Stroke specialist ESD team
Specialist ESD team with 4 or more members including PT, OT
and SALT
Access to PT, OT or SALT in specialist ESD team less than
48 hours
Stroke specialist community rehab team
Specialist CRT with 4 or more
members including PT, OT
and SALT
Number of days to wait
for appointment in TIA clinic
TIA patients seen, investigated and
treated on same or next day (7 days a week) for HIGH RISK
patients
TIA patients seen, investigated and treated within a week for LOW RISK patients
Report on stroke services produced for trust board in past year
Number of members of
strategic group responsible for
stroke
Number of clinical research studies
Frequency of formal survey of patient/carers
views
Report produced in
past 12 months which analysed
views of patients
Formal links with patient/carers organisations on service provision, audit, AND service reviews and future
plans 66% 89% 90% 57% 81% 2 63% 95% 93% 5 4 47% 68% 53%
No No Team No Team No No Team 2 No Yes Yes 6 3 Continuous Yes Yes
No No Team No Team No No Team 1 No Yes Yes 7 1 Continuous Yes Yes
No No Team No Team No No Team 2 Yes Yes Yes 7 2 Continuous Yes Yes
No No Team No Team No No Team 1 Yes Yes Yes 7 1 Continuous Yes Yes
No No Team No Team No No Team 5 No No Yes 5 3 Continuous Yes Yes
Yes No Yes No No Team 1 No Yes Yes 5 2 Continuous Yes Yes
No No Team No Team No No Team 2 Yes Yes Yes 5 1 Continuous Yes No
No No Team No Team No No Team 7 Yes Yes Yes 7 4 Continuous Yes Yes
No No Team No Team No No Team 4 No Yes Yes 7 2 Continuous Yes Yes
No No Team No Team Yes Yes 1 No Yes Yes 7 2 Continuous Yes Yes
No No Team No Team No No Team 3 Yes Yes Yes 5 1 Continuous Yes No
No No Team No Team No No Team 1 Yes Yes Yes 6 0 Continuous Yes Yes
No No Team No Team No No Team 1 Yes Yes Yes 6 0 Continuous Yes Yes
No No Team No Team No No Team 7 No Yes Yes 6 0 Continuous Yes Yes
Patient involvementQuality improvementTIA/Neurovascular serviceCommunity rehabilitation Early supported discharge

Sentinel Stroke National Audit Programme (SSNAP)Acute Organisational Audit Report 2012
Site Name 2012
NATIONALWalesAbertawe Bro Morgannwg University Health Board (Morriston Hospital and Singleton Hospital)
Abertawe Bro Morgannwg University Health Board (Princess of Wales Hospital)Aneurin Bevan Health Board (Nevill Hall Hospital)
Aneurin Bevan Health Board (St Woolos Hospital, Royal Gwent and Caerphilly District Miner's Hospital)Betsi Cadwaladr University Health Board (Glan Clwyd District General Hospital)Betsi Cadwaladr University Health Board (Wrexham Maelor Hospital)Betsi Cadwaladr University Health Board (Ysbyty Gwynedd)Cardiff and Vale University Health Board (University Hospital Wales)Cwm Taf Health Board (Prince Charles Hospital)
Cwm Taf Health Board (Royal Glamorgan Hospital)Hywel Dda Health Board (Bronglais General Hospital)Hywel Dda Health Board (Prince Philip Hospital)
Hywel Dda Health Board (West Wales General Hospital)Hywel Dda Health Board (Withybush General Hospital)
Leadership SINAP
Stroke clinician recognised as having principle responsibility for
stroke
Participating in SINAP (England
only)
Domain 1 Acute Care Organisation
Domain 2 Organisation
of care
Domain 3 Specialist Roles
Domain 4 Inter
Disciplinary Services
Domain 5 TIA/ Neurovascular
service
Domain 6 QI, Training and
Research
Domain 7 Team
Meetings
Domain 8 Communication with Patients and
Carers
Total organisational score 2012
Overall position 2010
Overall position 2012
100% 56% 68.8 65.0 70.0 52.5 87.5 80.4 87.5 81.3 73.3
Yes No 75 30 50 30 75 83.9 91.7 87.5 65.4 Lower quartile Lower quartile
Yes No 68.8 40 60 25 75 87.5 87.5 81.3 65.6 Lower quartile Lower quartile
Yes No 33.3 40 77.5 50 87.5 62.5 83.3 100 66.8 Middle half Middle half
Yes No 37.5 40 87.5 45 87.5 62.5 83.3 87.5 66.4 Lower quartile Lower quartile
Yes No 62.5 40 80 30 50 80.4 100 100 67.9 Middle half Middle half
Yes No 56.3 65 57.5 37.5 75 80.4 91.7 100 70.4 Lower quartile Middle half
Yes No 56.3 40 40 37.5 50 67.9 91.7 93.8 59.6 Lower quartile Lower quartile
Yes No 50 10 60 55 87.5 75 79.2 93.8 63.8 Middle half Lower quartile
Yes No 62.5 20 70 55 75 75 75 100 66.6 Middle half Lower quartile
Yes No 62.5 60 90 55 75 87.5 95.8 100 78.2 Middle half Middle half
Yes No 75 40 60 52.5 50 80.4 75 93.8 65.8 Lower quartile Lower quartile
Yes No 37.5 5 60 40 100 58.9 91.7 100 61.6 Lower quartile Lower quartile
Yes No 43.8 40 60 27.5 100 58.9 91.7 100 65.2 Lower quartile Lower quartile
Yes No 37.5 40 70 55 62.5 71.4 95.8 100 66.5 Lower quartile Lower quartile
Acute organisational audit domain scores 2012


![[ST][20121218][updatedBrS] Nexor Sentinel 3E Filtering ... · The TOE is used to prevent unintentional mistakes from users that violate organisational ... 19” rack computer HP ProLiant](https://static.fdocuments.in/doc/165x107/5f0fe4867e708231d4466826/st20121218updatedbrs-nexor-sentinel-3e-filtering-the-toe-is-used-to-prevent.jpg)
