Sentinel CY-2014 (4.83 MB)
104
Federal Trade Commission February 2015 for January – December 2014
-
Upload
vuongtuong -
Category
Documents
-
view
220 -
download
0
Transcript of Sentinel CY-2014 (4.83 MB)

Federal Trade CommissionFebruary 2015
for January – December 2014
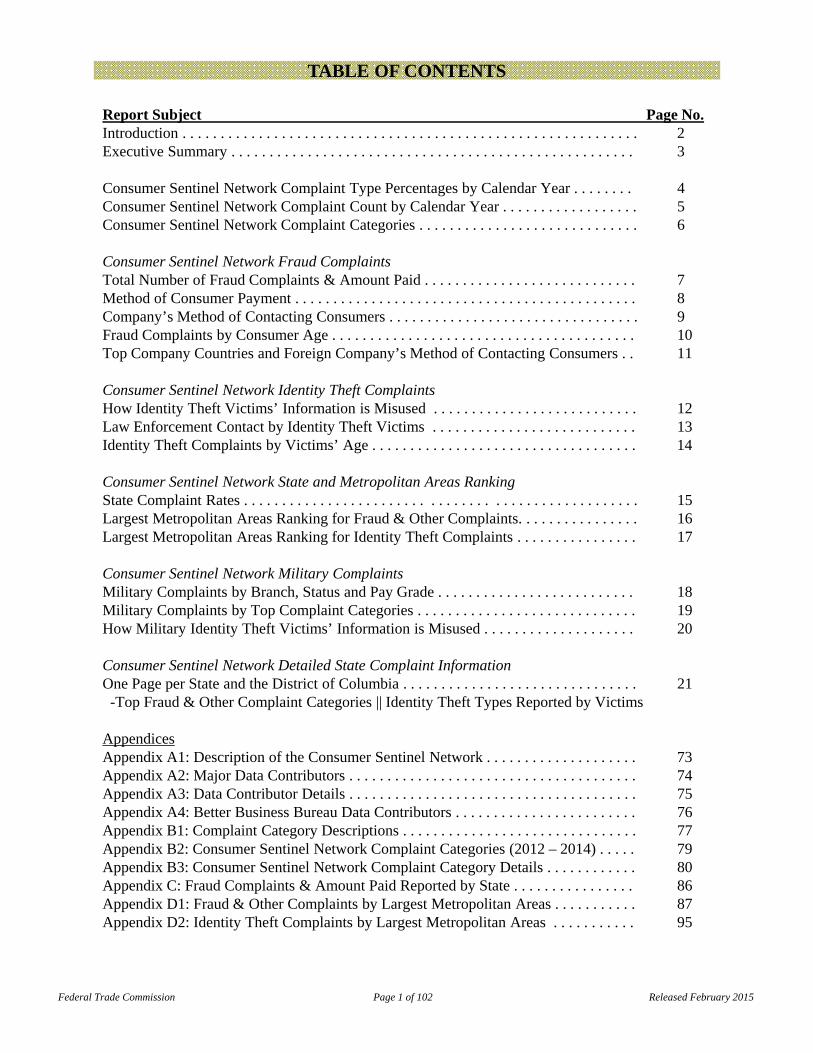
TABLE OF CONTENTS
Federal Trade Commission Page 1 of 102 Released February 2015
Report Subject Page No. Introduction . . . . . . . . . . . . . . . . . . . . . . . . . . . . . . . . . . . . . . . . . . . . . . . . . . . . . . . . . . . . 2Executive Summary . . . . . . . . . . . . . . . . . . . . . . . . . . . . . . . . . . . . . . . . . . . . . . . . . . . . . 3
Consumer Sentinel Network Complaint Type Percentages by Calendar Year . . . . . . . . 4Consumer Sentinel Network Complaint Count by Calendar Year . . . . . . . . . . . . . . . . . . 5Consumer Sentinel Network Complaint Categories . . . . . . . . . . . . . . . . . . . . . . . . . . . . . 6
Consumer Sentinel Network Fraud ComplaintsTotal Number of Fraud Complaints & Amount Paid . . . . . . . . . . . . . . . . . . . . . . . . . . . . 7Method of Consumer Payment . . . . . . . . . . . . . . . . . . . . . . . . . . . . . . . . . . . . . . . . . . . . . 8Company’s Method of Contacting Consumers . . . . . . . . . . . . . . . . . . . . . . . . . . . . . . . . . 9Fraud Complaints by Consumer Age . . . . . . . . . . . . . . . . . . . . . . . . . . . . . . . . . . . . . . . . 10Top Company Countries and Foreign Company’s Method of Contacting Consumers . . 11
Consumer Sentinel Network Identity Theft Complaints How Identity Theft Victims’ Information is Misused . . . . . . . . . . . . . . . . . . . . . . . . . . . 12Law Enforcement Contact by Identity Theft Victims . . . . . . . . . . . . . . . . . . . . . . . . . . . 13Identity Theft Complaints by Victims’ Age . . . . . . . . . . . . . . . . . . . . . . . . . . . . . . . . . . . 14
Consumer Sentinel Network State and Metropolitan Areas RankingState Complaint Rates . . . . . . . . . . . . . . . . . . . . . . . . . . . . . . . . . . . . . . . . . . . . . . . . . . . 15Largest Metropolitan Areas Ranking for Fraud & Other Complaints. . . . . . . . . . . . . . . . 16Largest Metropolitan Areas Ranking for Identity Theft Complaints . . . . . . . . . . . . . . . . 17
Consumer Sentinel Network Military Complaints Military Complaints by Branch, Status and Pay Grade . . . . . . . . . . . . . . . . . . . . . . . . . . 18Military Complaints by Top Complaint Categories . . . . . . . . . . . . . . . . . . . . . . . . . . . . . 19How Military Identity Theft Victims’ Information is Misused . . . . . . . . . . . . . . . . . . . . 20
Consumer Sentinel Network Detailed State Complaint InformationOne Page per State and the District of Columbia . . . . . . . . . . . . . . . . . . . . . . . . . . . . . . . 21
-Top Fraud & Other Complaint Categories || Identity Theft Types Reported by Victims
AppendicesAppendix A1: Description of the Consumer Sentinel Network . . . . . . . . . . . . . . . . . . . . 73Appendix A2: Major Data Contributors . . . . . . . . . . . . . . . . . . . . . . . . . . . . . . . . . . . . . . 74Appendix A3: Data Contributor Details . . . . . . . . . . . . . . . . . . . . . . . . . . . . . . . . . . . . . . 75Appendix A4: Better Business Bureau Data Contributors . . . . . . . . . . . . . . . . . . . . . . . . 76Appendix B1: Complaint Category Descriptions . . . . . . . . . . . . . . . . . . . . . . . . . . . . . . . 77Appendix B2: Consumer Sentinel Network Complaint Categories (2012 – 2014) . . . . . 79Appendix B3: Consumer Sentinel Network Complaint Category Details . . . . . . . . . . . . 80Appendix C: Fraud Complaints & Amount Paid Reported by State . . . . . . . . . . . . . . . . 86Appendix D1: Fraud & Other Complaints by Largest Metropolitan Areas . . . . . . . . . . . 87Appendix D2: Identity Theft Complaints by Largest Metropolitan Areas . . . . . . . . . . . 95
Better Business BureausInternet Crime
Complaint Center
Consumer Financial Protection Bureau PrivacyStar
Green DotPublishers Clearing
House
Canadian Anti-Fraud Centre
Ohio Attorney General
Washington Attorney General
California Attorney General
North Carolina Department of Justice
Massachusetts Attorney General
Maine Attorney General
Indiana Attorney General
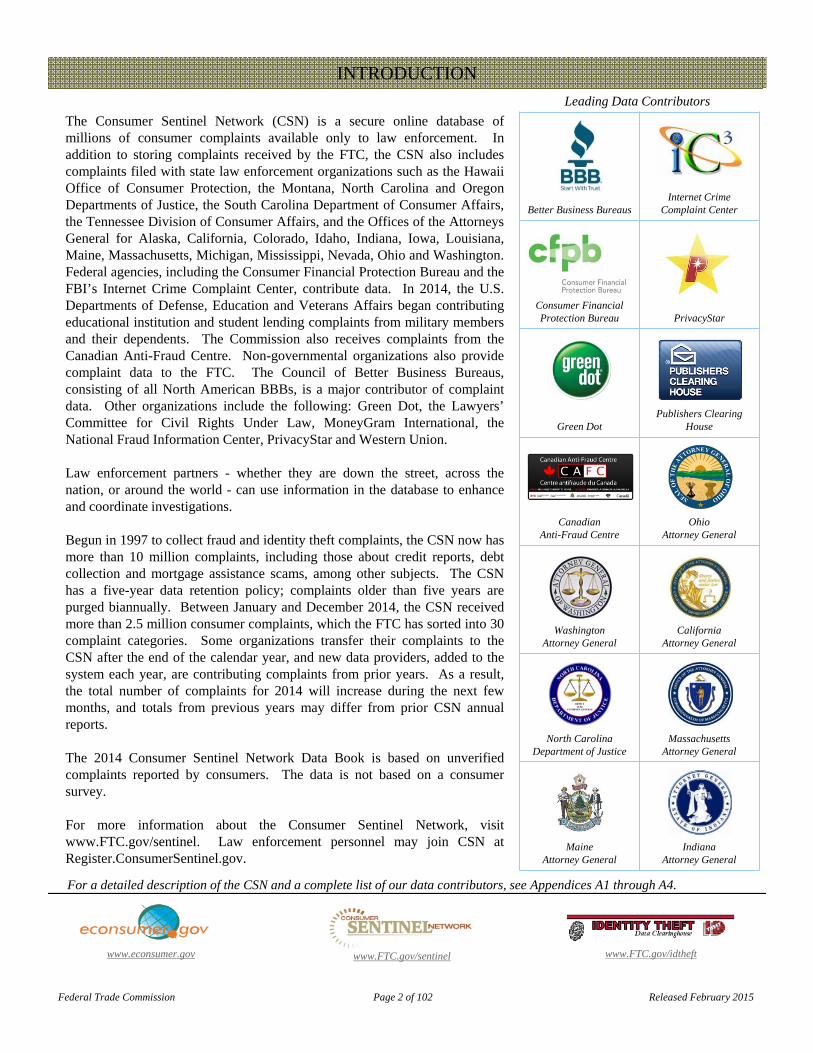
The Consumer Sentinel Network (CSN) is a secure online database ofmillions of consumer complaints available only to law enforcement. Inaddition to storing complaints received by the FTC, the CSN also includescomplaints filed with state law enforcement organizations such as the HawaiiOffice of Consumer Protection, the Montana, North Carolina and OregonDepartments of Justice, the South Carolina Department of Consumer Affairs,the Tennessee Division of Consumer Affairs, and the Offices of the AttorneysGeneral for Alaska, California, Colorado, Idaho, Indiana, Iowa, Louisiana,Maine, Massachusetts, Michigan, Mississippi, Nevada, Ohio and Washington.Federal agencies, including the Consumer Financial Protection Bureau and theFBI’s Internet Crime Complaint Center, contribute data. In 2014, the U.S.Departments of Defense, Education and Veterans Affairs began contributingeducational institution and student lending complaints from military membersand their dependents. The Commission also receives complaints from theCanadian Anti-Fraud Centre. Non-governmental organizations also providecomplaint data to the FTC. The Council of Better Business Bureaus,consisting of all North American BBBs, is a major contributor of complaintdata. Other organizations include the following: Green Dot, the Lawyers’Committee for Civil Rights Under Law, MoneyGram International, theNational Fraud Information Center, PrivacyStar and Western Union.
Law enforcement partners - whether they are down the street, across thenation, or around the world - can use information in the database to enhanceand coordinate investigations.
Begun in 1997 to collect fraud and identity theft complaints, the CSN now hasmore than 10 million complaints, including those about credit reports, debtcollection and mortgage assistance scams, among other subjects. The CSNhas a five-year data retention policy; complaints older than five years arepurged biannually. Between January and December 2014, the CSN receivedmore than 2.5 million consumer complaints, which the FTC has sorted into 30complaint categories. Some organizations transfer their complaints to theCSN after the end of the calendar year, and new data providers, added to thesystem each year, are contributing complaints from prior years. As a result,the total number of complaints for 2014 will increase during the next fewmonths, and totals from previous years may differ from prior CSN annualreports.
The 2014 Consumer Sentinel Network Data Book is based on unverifiedcomplaints reported by consumers. The data is not based on a consumersurvey.
For more information about the Consumer Sentinel Network, visitwww.FTC.gov/sentinel. Law enforcement personnel may join CSN atRegister.ConsumerSentinel.gov.
INTRODUCTION
Leading Data Contributors
www.econsumer.gov www.FTC.gov/sentinel
For a detailed description of the CSN and a complete list of our data contributors, see Appendices A1 through A4.
www.FTC.gov/idtheft
Federal Trade Commission Page 2 of 102 Released February 2015

Federal Trade Commission Page 3 of 102 Released February 2015
Executive Summary Consumer Sentinel Network Data Book
January – December 2014
The Consumer Sentinel Network (CSN) contains over 10 million complaints dating from calendar year 2010 through calendar year 2014. (In addition, the CSN contains over 15 million do-not-call complaints from this same time period. We report on do-not-call complaints after the end of each fiscal year. See http://www.ftc.gov/system/files/documents/reports/national-do-not-call-registry-data-book-fiscal-year-2014/dncdatabookfy2014.pdf for the 2014 National Do Not Call Registry Data Book.)
The CSN received over 2.5 million complaints (excluding do-not-call) during calendar year 2014: 60% fraud complaints; 13% identity theft complaints; and 27% other types of complaints.
Identity Theft was the number one complaint category in the CSN for calendar year 2014 with 13% of the overall complaints, followed by Debt Collection (11%); Impostor Scams (11%); Telephone and Mobile Services (7%); Banks and Lenders (5%); Prizes, Sweepstakes and Lotteries (4%); Auto-Related Complaints (3%); Shop-at-Home and Catalog Sales (3%); Television and Electronic Media (2%); and Internet Services (2%). The complete ranking of all 30 complaint categories is listed on page six of this report.
For military consumers, Identity Theft was the number one complaint category in the CSN, followed by Impostor Scams at number two. Education complaints ranked as the seventh highest category for military members, in contrast to twenty-seventh highest for the population as a whole.
Fraud
Over 1.5 million complaints were fraud-related. Consumers reported paying over $1.7 billion in those fraud complaints; the median amount paid was $498. Fifty-five percent of the consumers who reported a fraud-related complaint also reported an amount paid.
Forty-six percent of all fraud-related complaints reported the method of initial contact. Of those complaints, 54% said the telephone, while another 23% said e-mail. Only 4% of those consumers reported mail as the initial point of contact.
Florida is the state with the highest per capita rate of reported fraud and other types of complaints, followed by Georgia and Nevada.
Identity Theft
Government documents\benefits fraud (39%) was the most common form of reported identity theft, followed by credit card fraud (17%), phone or utilities fraud (13%), and bank fraud (8%). Other significant categories of identity theft reported by victims were employment-related fraud (5%) and loan fraud (4%).
Thirty-two percent of identity theft complainants reported they contacted law enforcement. Of those victims, 88% indicated a report was taken.
Florida is the state with the highest per capita rate of reported identity theft complaints, followed by Washington and Oregon.
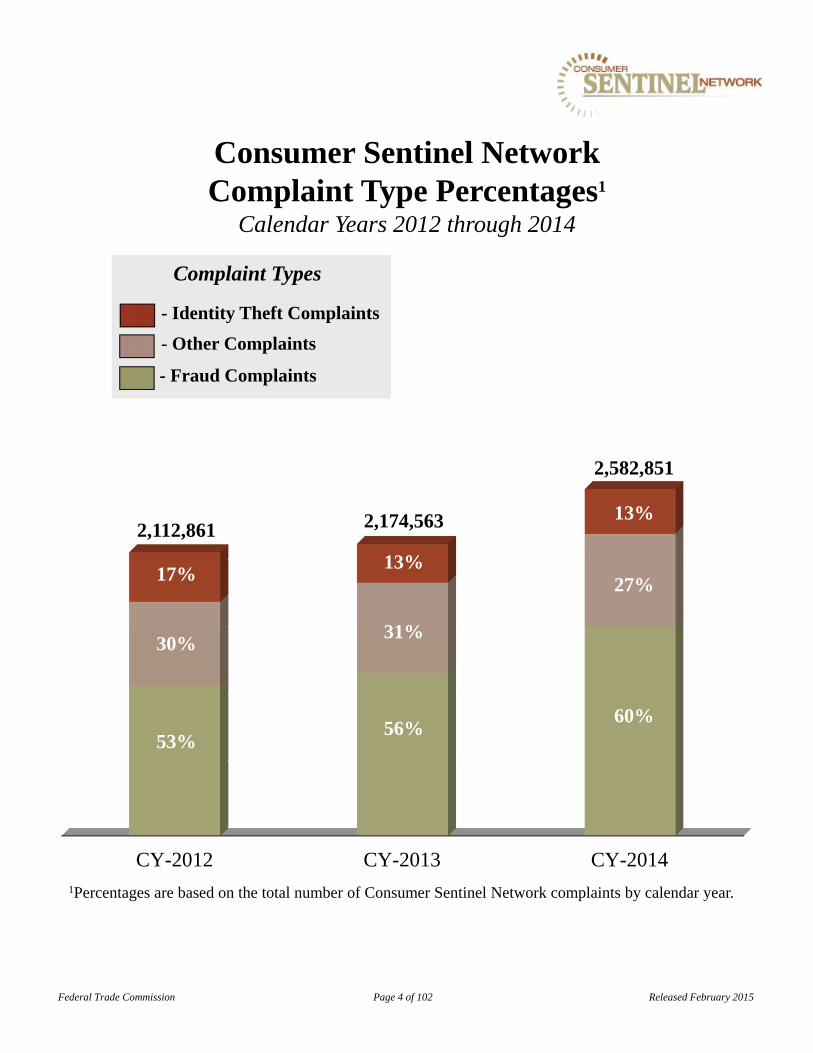
CY-2012 CY-2013 CY-2014
Consumer Sentinel Network Complaint Type Percentages1
Calendar Years 2012 through 2014
1Percentages are based on the total number of Consumer Sentinel Network complaints by calendar year.
2,582,851
60%
27%
13%2,174,563
56%
31%
13%
2,112,861
30%
53%
17%
Federal Trade Commission Page 4 of 102 Released February 2015
- Identity Theft Complaints
- Fraud Complaints
- Other Complaints
Complaint Types

325,519
551,622713,657
860,383909,314 906,129
1,070,447
1,261,1241,428,977
1,470,306
1,898,225
2,112,8612,174,563
2,582,851
0
500,000
1,000,000
1,500,000
2,000,000
2,500,000
3,000,000
Consumer Sentinel Network Complaint Count1
Calendar Years 2001 through 2014
Federal Trade Commission Page 5 of 102 Released February 2015
Consumer Sentinel Network Complaint Type Count1
Calendar Years 2001 through 2014
Purged Data1
1 Complaint counts from CY-2001 to CY-2009 represent historical figures as per the Consumer Sentinel Network’s five-year data retention policy. These complaint figures exclude National Do Not Call Registry complaints.
Fraud Identity Theft Other 2001 137,306 86,250 101,963 325,5192002 242,783 161,977 146,862 551,6222003 331,366 215,240 167,051 713,6572004 410,298 246,909 203,176 860,3832005 437,585 255,687 216,042 909,3142006 423,672 246,214 236,243 906,1292007 505,563 259,314 305,570 1,070,4472008 620,832 314,587 325,705 1,261,1242009 708,781 278,360 441,836 1,428,9772010 820,072 251,074 399,160 1,470,3062011 1,041,228 279,193 577,804 1,898,2252012 1,113,298 369,143 630,420 2,112,8612013 1,215,503 290,099 668,961 2,174,5632014 1,554,860 332,646 695,345 2,582,851
Calendar YearConsumer Sentinel Network Complaint Count
Total Complaints
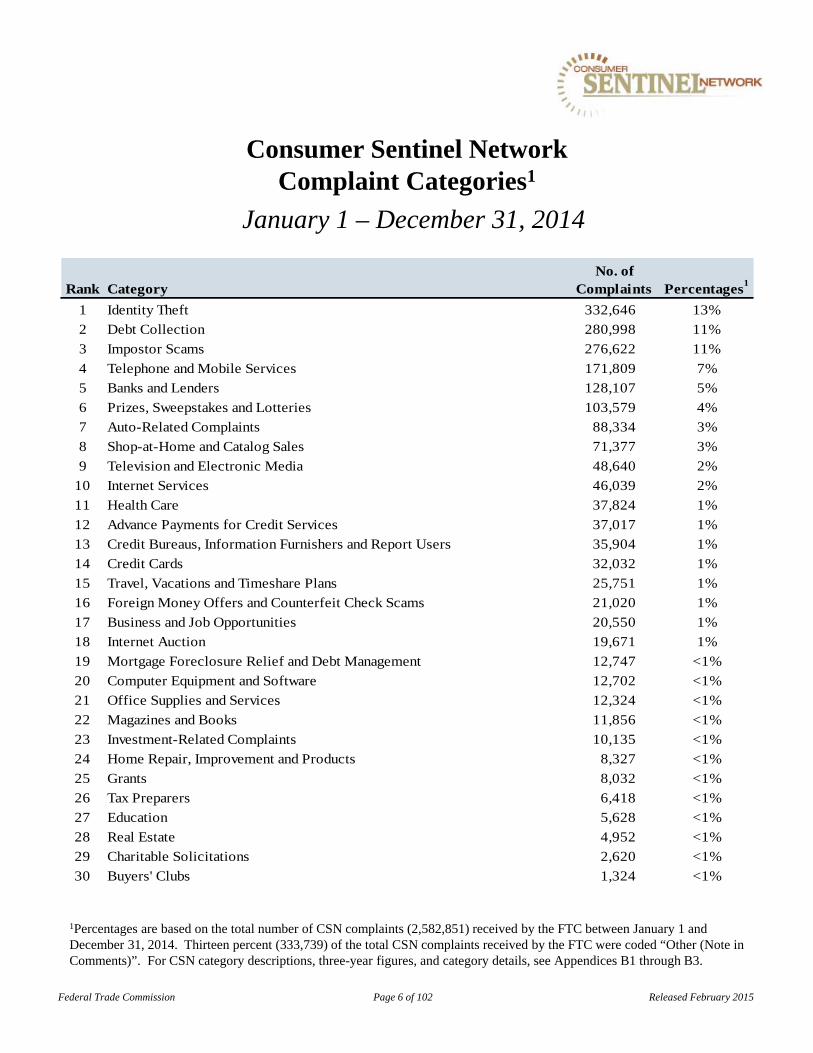
1Percentages are based on the total number of CSN complaints (2,582,851) received by the FTC between January 1 and December 31, 2014. Thirteen percent (333,739) of the total CSN complaints received by the FTC were coded “Other (Note in Comments)”. For CSN category descriptions, three-year figures, and category details, see Appendices B1 through B3.
Consumer Sentinel Network Complaint Categories1
January 1 – December 31, 2014
Federal Trade Commission Page 6 of 102 Released February 2015
Rank CategoryNo. of
Complaints Percentages1
1 Identity Theft 332,646 13%
2 Debt Collection 280,998 11%
3 Impostor Scams 276,622 11%
4 Telephone and Mobile Services 171,809 7%
5 Banks and Lenders 128,107 5%
6 Prizes, Sweepstakes and Lotteries 103,579 4%
7 Auto-Related Complaints 88,334 3%
8 Shop-at-Home and Catalog Sales 71,377 3%
9 Television and Electronic Media 48,640 2%
10 Internet Services 46,039 2%
11 Health Care 37,824 1%
12 Advance Payments for Credit Services 37,017 1%
13 Credit Bureaus, Information Furnishers and Report Users 35,904 1%
14 Credit Cards 32,032 1%
15 Travel, Vacations and Timeshare Plans 25,751 1%
16 Foreign Money Offers and Counterfeit Check Scams 21,020 1%
17 Business and Job Opportunities 20,550 1%
18 Internet Auction 19,671 1%
19 Mortgage Foreclosure Relief and Debt Management 12,747 <1%
20 Computer Equipment and Software 12,702 <1%
21 Office Supplies and Services 12,324 <1%
22 Magazines and Books 11,856 <1%
23 Investment-Related Complaints 10,135 <1%
24 Home Repair, Improvement and Products 8,327 <1%
25 Grants 8,032 <1%
26 Tax Preparers 6,418 <1%
27 Education 5,628 <1%
28 Real Estate 4,952 <1%
29 Charitable Solicitations 2,620 <1%
30 Buyers' Clubs 1,324 <1%

Consumer Sentinel Network Total Number of Fraud Complaints & Amount Paid
Calendar Years 2012 through 2014
1Average is based on the total number of consumers who reported an amount paid for each calendar year: CY-2012 = 658,910; CY-2013 = 731,433; and CY-2014 = 852,117. The amount paid is based on complaints with reported values from $0 to $999,999.
2Median is the middle number in a set of numbers so that half the numbers have values that are greater than the median and half have values that are less. Calculation of the median excludes complaints with amount paid reported as $0.
Note: See Appendix C for fraud complaints and amount paid figures by State and the District of Columbia.
Consumer Sentinel Network Distribution of Fraud Complaints by Amount Paid
Calendar Years 2012 through 2014
3Percentages are based on the total number of consumers who reported amount paid for each calendar year: CY-2012 = 658,910; CY-2013 = 731,433; and CY-2014 = 852,117.
Federal Trade Commission Page 7 of 102 Released February 2015
Total Reporting
Amount Paid Reported Average1
Median2
2012 1,113,298 658,910 59% $1,416,382,713 $2,150 $5002013 1,215,503 731,433 60% $1,651,217,429 $2,258 $3882014 1,554,860 852,117 55% $1,708,127,329 $2,005 $498
CY
Complaint Count Percentage Reporting Amount
Paid
Amount Paid
Amount Paid
$0 344,714 52% 314,747 43% 420,387 49%
$1 - 25 15,559 2% 15,488 2% 14,622 2%
$26 - 50 17,640 3% 21,254 3% 19,652 2%
$51 - 75 10,865 2% 13,970 2% 13,245 2%
$76 - 100 15,311 2% 24,442 3% 22,921 3%
$101 - 250 53,377 8% 86,141 12% 80,979 10%
$251 - 500 48,760 7% 91,224 12% 117,489 14%
$501 - 1,000 42,758 6% 53,230 7% 53,836 6%
$1,001 - 5,000 82,500 13% 81,920 11% 79,613 9%
More than $5,000 27,426 4% 29,017 4% 29,373 3%
CY - 2012 CY - 2013 CY - 2014
Complaints Percentages3
Complaints Percentages3
Complaints Percentages3

0%
10%
20%
30%
40%
BankAccount
Debit
Cash\CashAdvance
Check CreditCards
Internet\MobilePaymentServices
MoneyOrder
PrepaidCards
TelephoneBill
WireTransfer
11%
5% 4%
13%
2% 2%
33%
<1%
30%
Consumer Sentinel Network Fraud Complaints by Method of Consumer Payment1
January 1 – December 31, 2014
Consumer Sentinel Network Fraud Complaints by Method of Consumer Payment Calendar Years 2012 through 2014
Federal Trade Commission Page 8 of 102 Released February 2015
1Percentages are based on the total number of CSN fraud complaints for each calendar year where consumers reported the method of payment: CY-2012 = 243,069; CY-2013 = 323,069; and CY-2014 = 356,553. Of the total, 23% reported this information during CY-2014, 27% in CY-2013 and 22% in CY-2012.
2Prepaid Cards includes a significant number of complaints from data contributor Green Dot and Wire Transfer includes a significant number of complaints from data contributors MoneyGram International and Western Union Money Transfer. This may affect the distribution of the reported methods of payment.
3The amount paid is based on complaints reporting values from $0 to $999,999.
22
Complaints Percentages1 Amount Paid3 Complaints Percentages1 Amount Paid3 Complaints Percentages1 Amount Paid3
Bank Account Debit 31,274 13% $80,711,174 35,377 11% $94,673,728 38,527 11% $85,433,040Cash\Cash Advance 15,928 7% $124,582,680 16,388 5% $170,591,441 17,332 5% $168,972,138Check 17,153 7% $92,246,113 12,904 4% $73,092,617 12,917 4% $88,603,695Credit Cards 36,868 15% $95,908,250 38,418 12% $89,843,322 46,736 13% $96,440,695Internet\Mobile 939 <1% $777,494 4,506 1% $4,110,480 5,734 2% $9,651,081Money Order 13,316 5% $56,959,005 9,307 3% $57,989,810 8,707 2% $55,898,113
Prepaid Cards2
16,925 7% $6,951,318 98,212 30% $47,184,062 119,100 33% $80,860,327
Telephone Bill 1,512 1% $903,210 733 <1% $342,137 1,028 <1% $870,511
Wire Transfer2
109,154 45% $457,110,936 107,224 33% $510,831,705 106,472 30% $500,705,082
Total Reporting Payment Method
243,069 $916,150,180 323,069 $1,048,659,302 356,553 $1,087,434,682
Payment Method
CY - 2012 CY - 2013 CY - 2014

Contact Method Complaints Percentages1 Complaints Percentages1 Complaints Percentages1
E-mail 229,423 37% 184,468 32% 166,537 23%
Mail 52,879 9% 29,088 5% 29,103 4%
Internet - Web Site\Others 76,185 12% 82,757 15% 79,872 11%
Phone 208,377 34% 230,443 41% 386,706 54%
Other 45,096 7% 41,875 7% 48,148 7%Total Reporting Contact Method
611,960 568,631 710,366
CY - 2012 CY - 2013 CY - 2014
Consumer Sentinel Network Fraud Complaints by Company’s Method of Contacting Consumers
Calendar Years 2012 through 2014
Federal Trade Commission Page 9 of 102 Released February 2015
23%
4%
11%
54%
7%
Internet - WebSite\Others
Phone
Other
Consumer Sentinel Network Fraud Complaints by Company’s Method of Contacting Consumers1
January 1 – December 31, 2014
1Percentages are based on the total number of CSN fraud complaints for each calendar year where consumers reported the company’s method of initial contact: CY-2012 = 611,960; CY-2013 = 568,631; and CY-2014 = 710,366. Of the total, 46% reported this information during CY-2014, 47% in CY-2013 and 55% for CY-2012.
2%
14%
17%
18%
21%
18%
10%
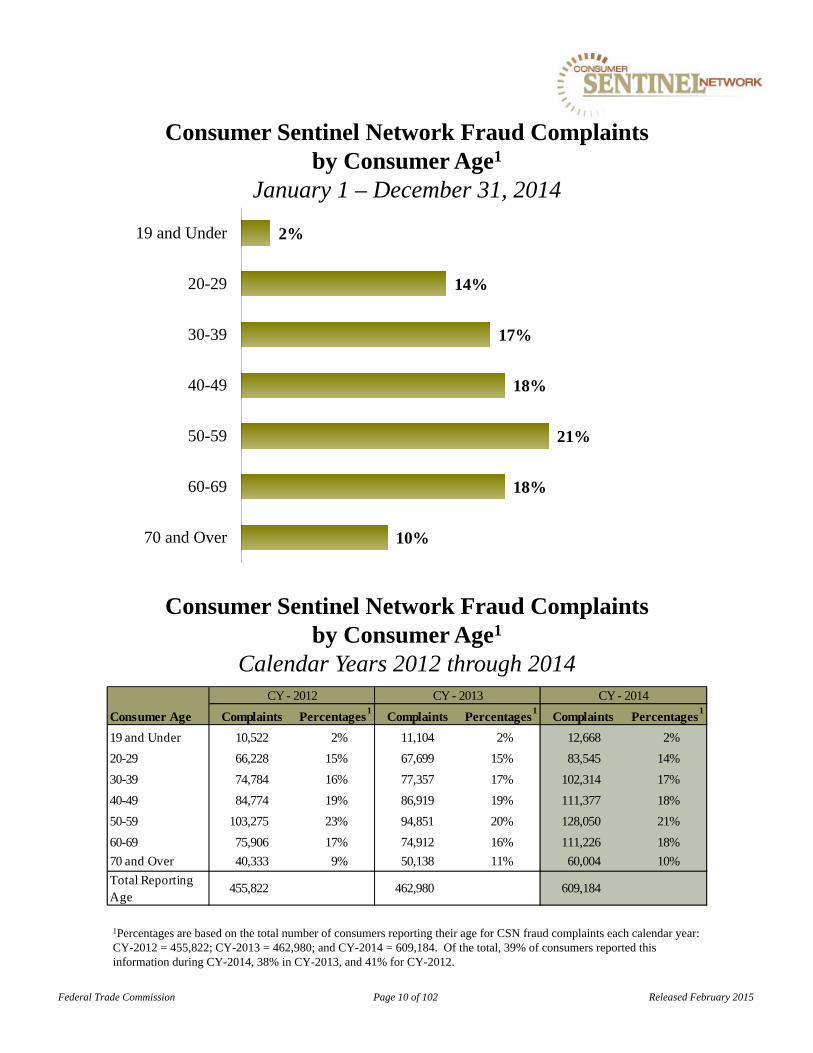
19 and Under
20-29
30-39
40-49
50-59
60-69
70 and Over
1Percentages are based on the total number of consumers reporting their age for CSN fraud complaints each calendar year: CY-2012 = 455,822; CY-2013 = 462,980; and CY-2014 = 609,184. Of the total, 39% of consumers reported this information during CY-2014, 38% in CY-2013, and 41% for CY-2012.
Consumer Sentinel Network Fraud Complaintsby Consumer Age1
Calendar Years 2012 through 2014
Consumer Sentinel Network Fraud Complaints by Consumer Age1
January 1 – December 31, 2014
Federal Trade Commission Page 10 of 102 Released February 2015
Complaints Percentages1
Complaints Percentages1
Complaints Percentages1
19 and Under 10,522 2% 11,104 2% 12,668 2%
20-29 66,228 15% 67,699 15% 83,545 14%
30-39 74,784 16% 77,357 17% 102,314 17%
40-49 84,774 19% 86,919 19% 111,377 18%
50-59 103,275 23% 94,851 20% 128,050 21%
60-69 75,906 17% 74,912 16% 111,226 18%
70 and Over 40,333 9% 50,138 11% 60,004 10%
462,980 609,184
Consumer Age
CY - 2012 CY - 2013 CY - 2014
Total Reporting Age
455,822
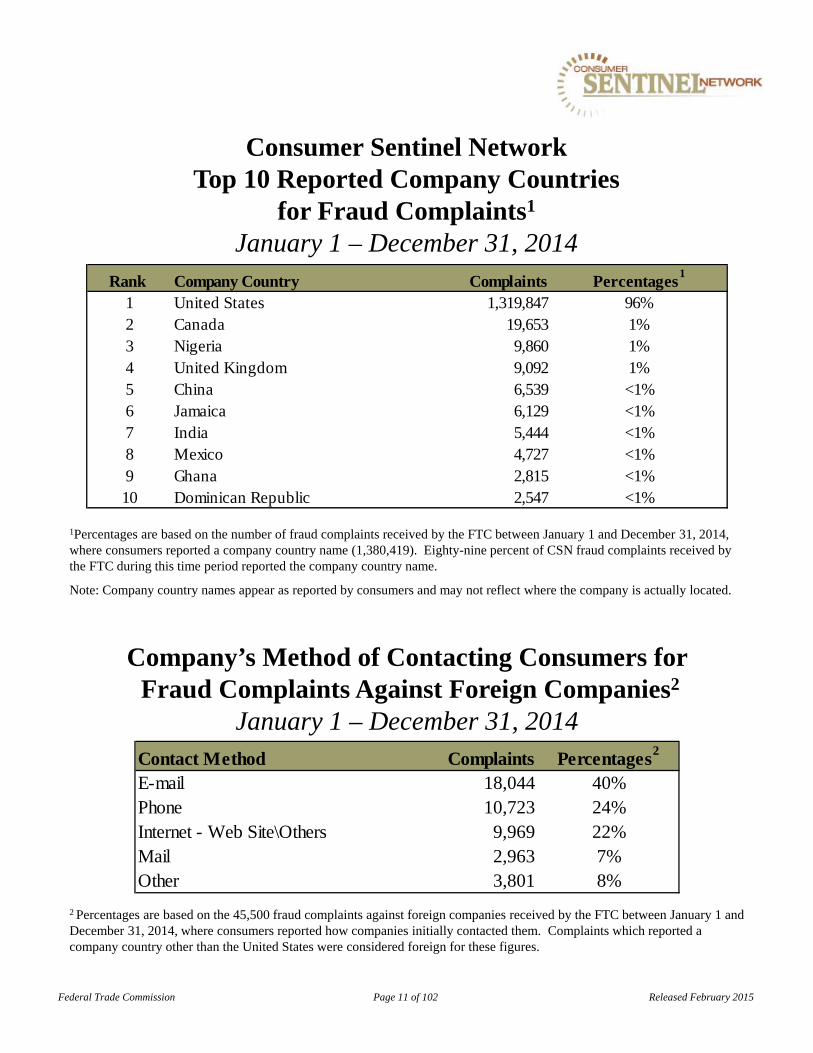
Contact Method Complaints Percentages2
E-mail 18,044 40%Phone 10,723 24%Internet - Web Site\Others 9,969 22%Mail 2,963 7%Other 3,801 8%
Rank Company Country Complaints Percentages1
1 United States 1,319,847 96%2 Canada 19,653 1%3 Nigeria 9,860 1%4 United Kingdom 9,092 1%5 China 6,539 <1%6 Jamaica 6,129 <1%7 India 5,444 <1%8 Mexico 4,727 <1%9 Ghana 2,815 <1%10 Dominican Republic 2,547 <1%
Consumer Sentinel NetworkTop 10 Reported Company Countries
for Fraud Complaints1
January 1 – December 31, 2014
Federal Trade Commission Page 11 of 102 Released February 2015
Company’s Method of Contacting Consumers for Fraud Complaints Against Foreign Companies2
January 1 – December 31, 2014
2 Percentages are based on the 45,500 fraud complaints against foreign companies received by the FTC between January 1 and December 31, 2014, where consumers reported how companies initially contacted them. Complaints which reported a company country other than the United States were considered foreign for these figures.
1Percentages are based on the number of fraud complaints received by the FTC between January 1 and December 31, 2014, where consumers reported a company country name (1,380,419). Eighty-nine percent of CSN fraud complaints received by the FTC during this time period reported the company country name.
Note: Company country names appear as reported by consumers and may not reflect where the company is actually located.
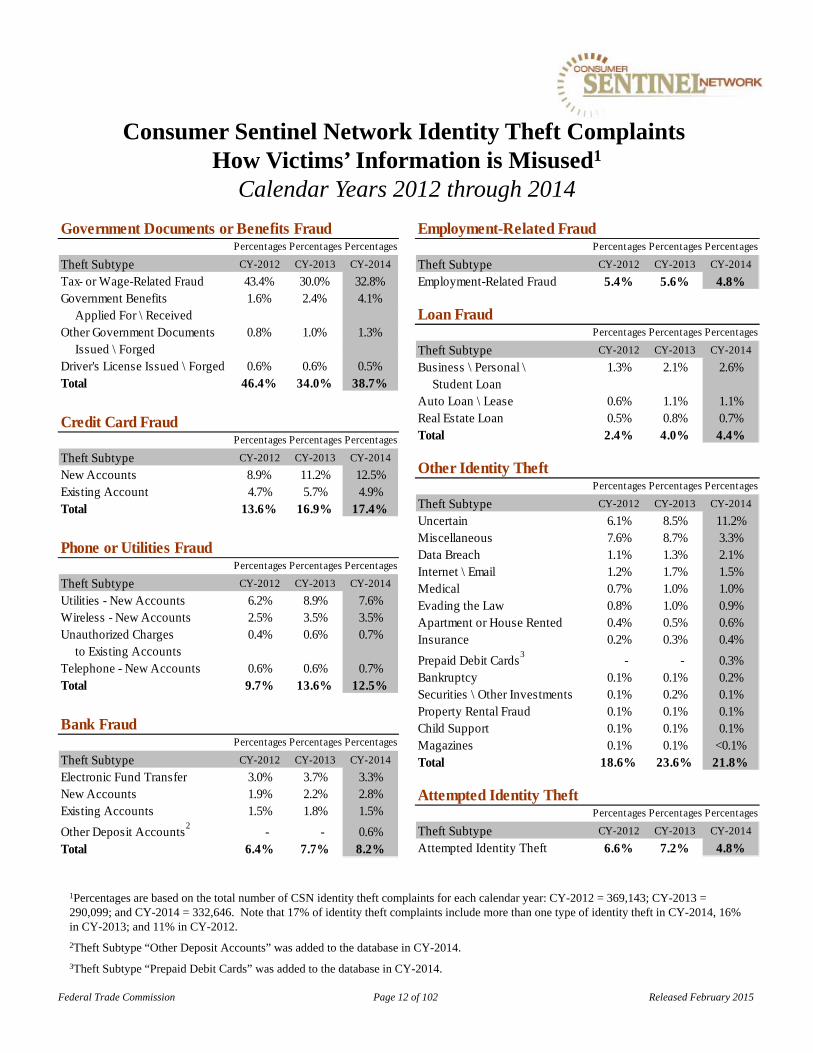
Employment-Related FraudPercentages Percentages Percentages
Theft Subtype CY-2012 CY-2013 CY-2014
Employment-Related Fraud 5.4% 5.6% 4.8%
Loan FraudPercentages Percentages Percentages
Theft Subtype CY-2012 CY-2013 CY-2014
Business \ Personal \ 1.3% 2.1% 2.6% Student LoanAuto Loan \ Lease 0.6% 1.1% 1.1%Real Estate Loan 0.5% 0.8% 0.7%Total 2.4% 4.0% 4.4%
Other Identity TheftPercentages Percentages Percentages
Theft Subtype CY-2012 CY-2013 CY-2014
Uncertain 6.1% 8.5% 11.2%Miscellaneous 7.6% 8.7% 3.3%Data Breach 1.1% 1.3% 2.1%Internet \ Email 1.2% 1.7% 1.5%Medical 0.7% 1.0% 1.0%Evading the Law 0.8% 1.0% 0.9%Apartment or House Rented 0.4% 0.5% 0.6%Insurance 0.2% 0.3% 0.4%
Prepaid Debit Cards3
- - 0.3%Bankruptcy 0.1% 0.1% 0.2%Securities \ Other Investments 0.1% 0.2% 0.1%Property Rental Fraud 0.1% 0.1% 0.1%Child Support 0.1% 0.1% 0.1%Magazines 0.1% 0.1% <0.1%Total 18.6% 23.6% 21.8%
Attempted Identity TheftPercentages Percentages Percentages
Theft Subtype CY-2012 CY-2013 CY-2014
Attempted Identity Theft 6.6% 7.2% 4.8%
Government Documents or Benefits FraudPercentages Percentages Percentages
Theft Subtype CY-2012 CY-2013 CY-2014
Tax- or Wage-Related Fraud 43.4% 30.0% 32.8%Government Benefits 1.6% 2.4% 4.1% Applied For \ ReceivedOther Government Documents 0.8% 1.0% 1.3% Issued \ ForgedDriver's License Issued \ Forged 0.6% 0.6% 0.5%Total 46.4% 34.0% 38.7%
Credit Card FraudPercentages Percentages Percentages
Theft Subtype CY-2012 CY-2013 CY-2014
New Accounts 8.9% 11.2% 12.5%Existing Account 4.7% 5.7% 4.9%Total 13.6% 16.9% 17.4%
Phone or Utilities FraudPercentages Percentages Percentages
Theft Subtype CY-2012 CY-2013 CY-2014
Utilities - New Accounts 6.2% 8.9% 7.6%Wireless - New Accounts 2.5% 3.5% 3.5%Unauthorized Charges 0.4% 0.6% 0.7% to Existing AccountsTelephone - New Accounts 0.6% 0.6% 0.7%Total 9.7% 13.6% 12.5%
Bank FraudPercentages Percentages Percentages
Theft Subtype CY-2012 CY-2013 CY-2014
Electronic Fund Transfer 3.0% 3.7% 3.3%New Accounts 1.9% 2.2% 2.8%Existing Accounts 1.5% 1.8% 1.5%
Other Deposit Accounts2
- - 0.6%Total 6.4% 7.7% 8.2%
Consumer Sentinel Network Identity Theft Complaints How Victims’ Information is Misused1
Calendar Years 2012 through 2014
1Percentages are based on the total number of CSN identity theft complaints for each calendar year: CY-2012 = 369,143; CY-2013 = 290,099; and CY-2014 = 332,646. Note that 17% of identity theft complaints include more than one type of identity theft in CY-2014, 16% in CY-2013; and 11% in CY-2012.
2Theft Subtype “Other Deposit Accounts” was added to the database in CY-2014.
3Theft Subtype “Prepaid Debit Cards” was added to the database in CY-2014.
Federal Trade Commission Page 12 of 102 Released February 2015
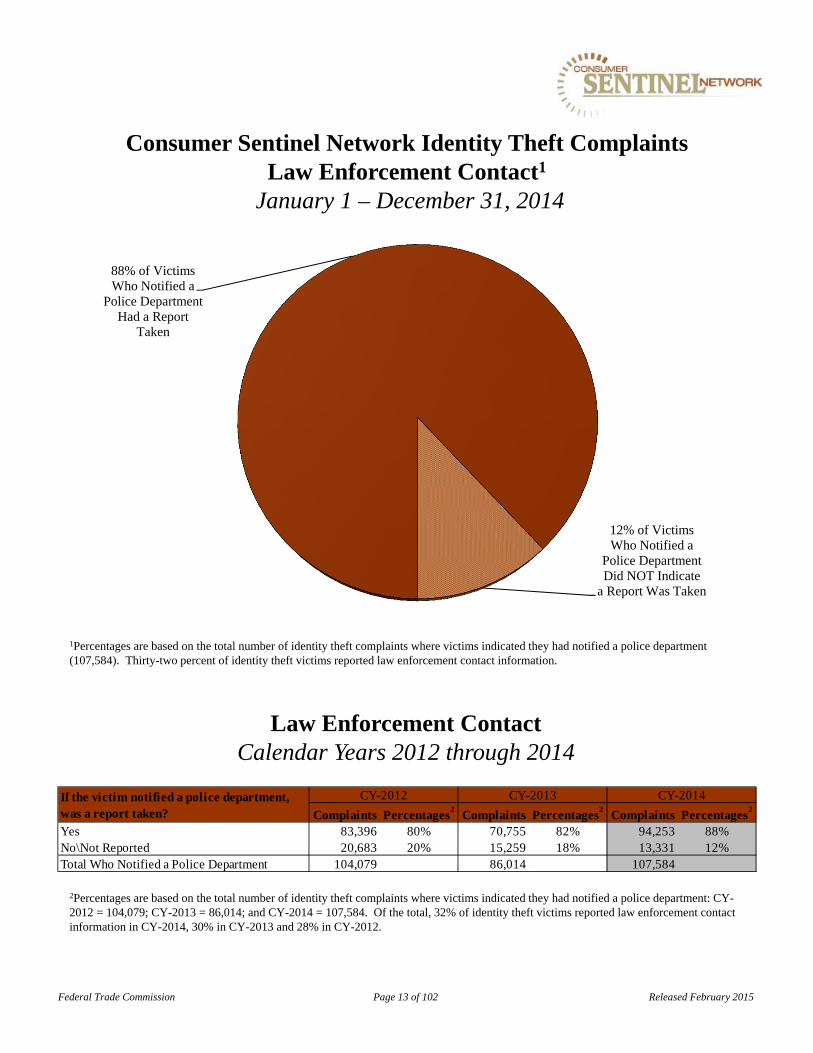
2Percentages are based on the total number of identity theft complaints where victims indicated they had notified a police department: CY-2012 = 104,079; CY-2013 = 86,014; and CY-2014 = 107,584. Of the total, 32% of identity theft victims reported law enforcement contact information in CY-2014, 30% in CY-2013 and 28% in CY-2012.
88% of Victims Who Notified a
Police Department Had a Report
Taken
12% of Victims Who Notified a
Police Department Did NOT Indicate
a Report Was Taken
Consumer Sentinel Network Identity Theft Complaints Law Enforcement Contact1
January 1 – December 31, 2014
1Percentages are based on the total number of identity theft complaints where victims indicated they had notified a police department (107,584). Thirty-two percent of identity theft victims reported law enforcement contact information.
Law Enforcement ContactCalendar Years 2012 through 2014
Federal Trade Commission Page 13 of 102 Released February 2015
Complaints Percentages2
Complaints Percentages2
Complaints Percentages2
Yes 83,396 80% 70,755 82% 94,253 88%No\Not Reported 20,683 20% 15,259 18% 13,331 12%Total Who Notified a Police Department 104,079 86,014 107,584
If the victim notified a police department, was a report taken?
CY-2012 CY-2013 CY-2014

1Percentages are based on the total number of victims reporting their age in CSN identity theft complaints for each calendar year: CY-2012 = 271,818; CY-2013 = 198,799; and CY-2014 = 212,698. Of the consumers who contacted the FTC, 64% reported their age in CY-2014, 69% in CY-2013 and 74% in CY-2012.
Consumer Sentinel Network Identity Theft Complaints by Victims’ Age1
January 1 – December 31, 2014
Consumer Sentinel Network Identity Theft Complaintsby Victims’ Age
Calendar Years 2012 through 2014
Federal Trade Commission Page 14 of 102 Released February 2015
6%
18%
18%
19%
19%
13%
7%
19 and Under
20-29
30-39
40-49
50-59
60-69
70 and Over
Complaints Percentages1
Complaints Percentages1
Complaints Percentages1
19 and Under 16,045 6% 11,875 6% 12,062 6%
20-29 57,178 21% 39,058 20% 37,568 18%
30-39 52,312 19% 37,777 19% 38,714 18%
40-49 49,002 18% 35,241 18% 39,649 19%
50-59 45,121 17% 33,823 17% 41,020 19%
60-69 30,287 11% 24,156 12% 27,799 13%
70 and Over 21,873 8% 16,869 8% 15,886 7%
Consumer Age
CY - 2012 CY - 2013 CY - 2014
Total Reporting Age
271,818 198,799 212,698
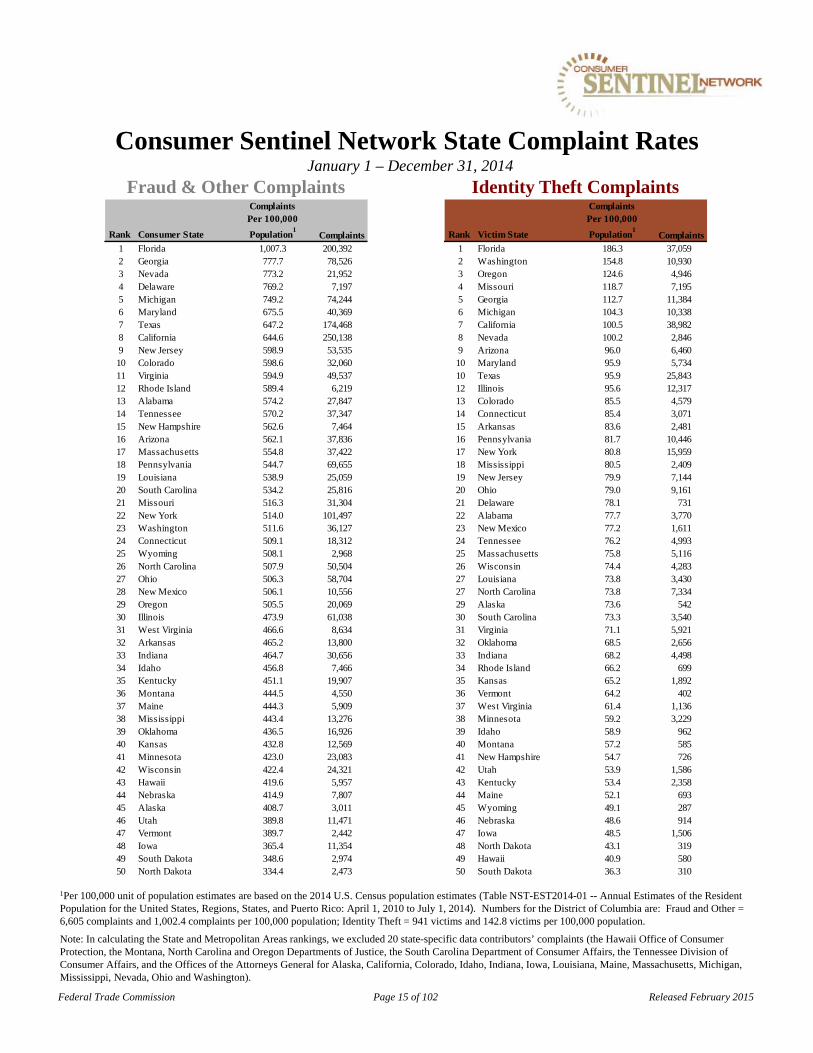
1Per 100,000 unit of population estimates are based on the 2014 U.S. Census population estimates (Table NST-EST2014-01 -- Annual Estimates of the Resident Population for the United States, Regions, States, and Puerto Rico: April 1, 2010 to July 1, 2014). Numbers for the District of Columbia are: Fraud and Other = 6,605 complaints and 1,002.4 complaints per 100,000 population; Identity Theft = 941 victims and 142.8 victims per 100,000 population.
Consumer Sentinel Network State Complaint RatesJanuary 1 – December 31, 2014
Fraud & Other Complaints Identity Theft Complaints
Federal Trade Commission Page 15 of 102 Released February 2015
Note: In calculating the State and Metropolitan Areas rankings, we excluded 20 state-specific data contributors’ complaints (the Hawaii Office of Consumer Protection, the Montana, North Carolina and Oregon Departments of Justice, the South Carolina Department of Consumer Affairs, the Tennessee Division of Consumer Affairs, and the Offices of the Attorneys General for Alaska, California, Colorado, Idaho, Indiana, Iowa, Louisiana, Maine, Massachusetts, Michigan, Mississippi, Nevada, Ohio and Washington).
Rank Consumer State
Complaints Per 100,000
Population1
1 Florida 1,007.3 200,3922 Georgia 777.7 78,5263 Nevada 773.2 21,9524 Delaware 769.2 7,1975 Michigan 749.2 74,2446 Maryland 675.5 40,3697 Texas 647.2 174,4688 California 644.6 250,1389 New Jersey 598.9 53,53510 Colorado 598.6 32,06011 Virginia 594.9 49,53712 Rhode Island 589.4 6,21913 Alabama 574.2 27,84714 Tennessee 570.2 37,34715 New Hampshire 562.6 7,46416 Arizona 562.1 37,83617 Massachusetts 554.8 37,42218 Pennsylvania 544.7 69,65519 Louisiana 538.9 25,05920 South Carolina 534.2 25,81621 Missouri 516.3 31,30422 New York 514.0 101,49723 Washington 511.6 36,12724 Connecticut 509.1 18,31225 Wyoming 508.1 2,96826 North Carolina 507.9 50,50427 Ohio 506.3 58,70428 New Mexico 506.1 10,55629 Oregon 505.5 20,06930 Illinois 473.9 61,03831 West Virginia 466.6 8,63432 Arkansas 465.2 13,80033 Indiana 464.7 30,65634 Idaho 456.8 7,46635 Kentucky 451.1 19,90736 Montana 444.5 4,55037 Maine 444.3 5,90938 Mississippi 443.4 13,27639 Oklahoma 436.5 16,92640 Kansas 432.8 12,56941 Minnesota 423.0 23,08342 Wisconsin 422.4 24,32143 Hawaii 419.6 5,95744 Nebraska 414.9 7,80745 Alaska 408.7 3,01146 Utah 389.8 11,47147 Vermont 389.7 2,44248 Iowa 365.4 11,35449 South Dakota 348.6 2,97450 North Dakota 334.4 2,473
Complaints Rank Victim State
Complaints Per 100,000
Population1
1 Florida 186.3 37,0592 Washington 154.8 10,9303 Oregon 124.6 4,9464 Missouri 118.7 7,1955 Georgia 112.7 11,3846 Michigan 104.3 10,3387 California 100.5 38,9828 Nevada 100.2 2,8469 Arizona 96.0 6,46010 Maryland 95.9 5,73410 Texas 95.9 25,84312 Illinois 95.6 12,31713 Colorado 85.5 4,57914 Connecticut 85.4 3,07115 Arkansas 83.6 2,48116 Pennsylvania 81.7 10,44617 New York 80.8 15,95918 Mississippi 80.5 2,40919 New Jersey 79.9 7,14420 Ohio 79.0 9,16121 Delaware 78.1 73122 Alabama 77.7 3,77023 New Mexico 77.2 1,61124 Tennessee 76.2 4,99325 Massachusetts 75.8 5,11626 Wisconsin 74.4 4,28327 Louisiana 73.8 3,43027 North Carolina 73.8 7,33429 Alaska 73.6 54230 South Carolina 73.3 3,54031 Virginia 71.1 5,92132 Oklahoma 68.5 2,65633 Indiana 68.2 4,49834 Rhode Island 66.2 69935 Kansas 65.2 1,89236 Vermont 64.2 40237 West Virginia 61.4 1,13638 Minnesota 59.2 3,22939 Idaho 58.9 96240 Montana 57.2 58541 New Hampshire 54.7 72642 Utah 53.9 1,58643 Kentucky 53.4 2,35844 Maine 52.1 69345 Wyoming 49.1 28746 Nebraska 48.6 91447 Iowa 48.5 1,50648 North Dakota 43.1 31949 Hawaii 40.9 58050 South Dakota 36.3 310
Complaints
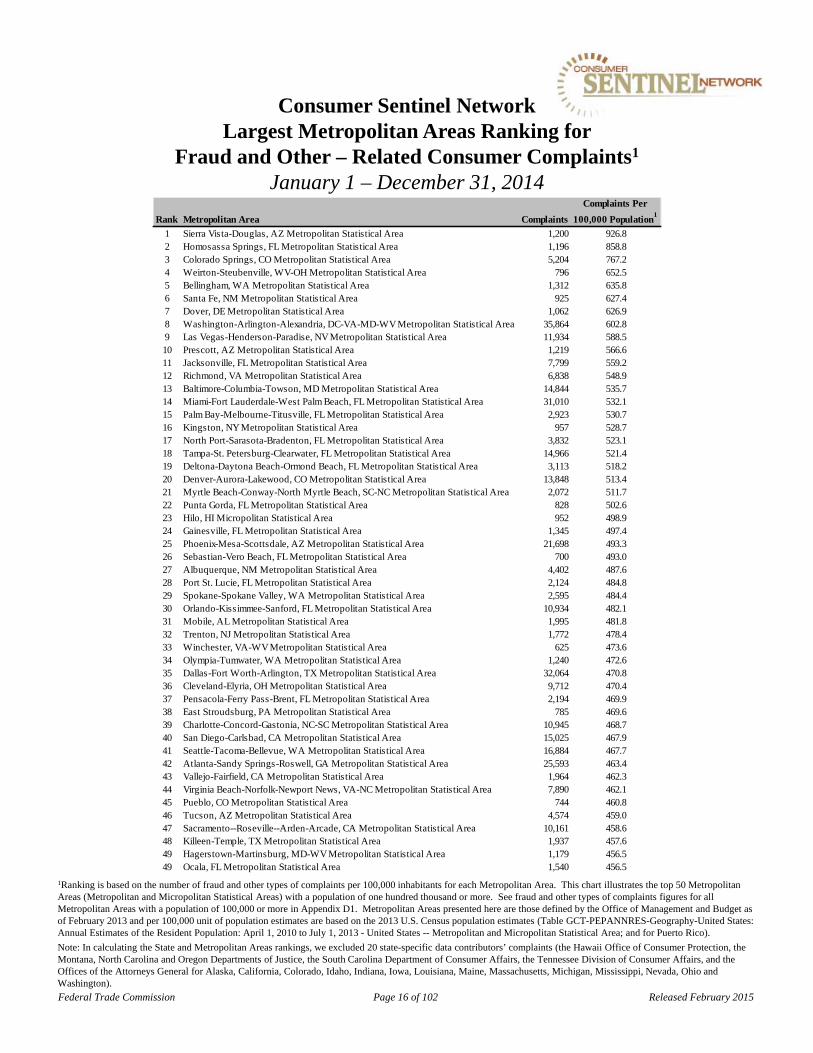
Rank Metropolitan Area Complaints
Complaints Per
100,000 Population1
1 Sierra Vista-Douglas, AZ Metropolitan Statistical Area 1,200 926.82 Homosassa Springs, FL Metropolitan Statistical Area 1,196 858.83 Colorado Springs, CO Metropolitan Statistical Area 5,204 767.24 Weirton-Steubenville, WV-OH Metropolitan Statistical Area 796 652.55 Bellingham, WA Metropolitan Statistical Area 1,312 635.86 Santa Fe, NM Metropolitan Statistical Area 925 627.47 Dover, DE Metropolitan Statistical Area 1,062 626.98 Washington-Arlington-Alexandria, DC-VA-MD-WV Metropolitan Statistical Area 35,864 602.89 Las Vegas-Henderson-Paradise, NV Metropolitan Statistical Area 11,934 588.510 Prescott, AZ Metropolitan Statistical Area 1,219 566.611 Jacksonville, FL Metropolitan Statistical Area 7,799 559.212 Richmond, VA Metropolitan Statistical Area 6,838 548.913 Baltimore-Columbia-Towson, MD Metropolitan Statistical Area 14,844 535.714 Miami-Fort Lauderdale-West Palm Beach, FL Metropolitan Statistical Area 31,010 532.115 Palm Bay-Melbourne-Titusville, FL Metropolitan Statistical Area 2,923 530.716 Kingston, NY Metropolitan Statistical Area 957 528.717 North Port-Sarasota-Bradenton, FL Metropolitan Statistical Area 3,832 523.118 Tampa-St. Petersburg-Clearwater, FL Metropolitan Statistical Area 14,966 521.419 Deltona-Daytona Beach-Ormond Beach, FL Metropolitan Statistical Area 3,113 518.220 Denver-Aurora-Lakewood, CO Metropolitan Statistical Area 13,848 513.421 Myrtle Beach-Conway-North Myrtle Beach, SC-NC Metropolitan Statistical Area 2,072 511.722 Punta Gorda, FL Metropolitan Statistical Area 828 502.623 Hilo, HI Micropolitan Statistical Area 952 498.924 Gainesville, FL Metropolitan Statistical Area 1,345 497.425 Phoenix-Mesa-Scottsdale, AZ Metropolitan Statistical Area 21,698 493.326 Sebastian-Vero Beach, FL Metropolitan Statistical Area 700 493.027 Albuquerque, NM Metropolitan Statistical Area 4,402 487.628 Port St. Lucie, FL Metropolitan Statistical Area 2,124 484.829 Spokane-Spokane Valley, WA Metropolitan Statistical Area 2,595 484.430 Orlando-Kissimmee-Sanford, FL Metropolitan Statistical Area 10,934 482.131 Mobile, AL Metropolitan Statistical Area 1,995 481.832 Trenton, NJ Metropolitan Statistical Area 1,772 478.433 Winchester, VA-WV Metropolitan Statistical Area 625 473.634 Olympia-Tumwater, WA Metropolitan Statistical Area 1,240 472.635 Dallas-Fort Worth-Arlington, TX Metropolitan Statistical Area 32,064 470.836 Cleveland-Elyria, OH Metropolitan Statistical Area 9,712 470.437 Pensacola-Ferry Pass-Brent, FL Metropolitan Statistical Area 2,194 469.938 East Stroudsburg, PA Metropolitan Statistical Area 785 469.639 Charlotte-Concord-Gastonia, NC-SC Metropolitan Statistical Area 10,945 468.740 San Diego-Carlsbad, CA Metropolitan Statistical Area 15,025 467.941 Seattle-Tacoma-Bellevue, WA Metropolitan Statistical Area 16,884 467.742 Atlanta-Sandy Springs-Roswell, GA Metropolitan Statistical Area 25,593 463.443 Vallejo-Fairfield, CA Metropolitan Statistical Area 1,964 462.344 Virginia Beach-Norfolk-Newport News, VA-NC Metropolitan Statistical Area 7,890 462.145 Pueblo, CO Metropolitan Statistical Area 744 460.846 Tucson, AZ Metropolitan Statistical Area 4,574 459.047 Sacramento--Roseville--Arden-Arcade, CA Metropolitan Statistical Area 10,161 458.648 Killeen-Temple, TX Metropolitan Statistical Area 1,937 457.649 Hagerstown-Martinsburg, MD-WV Metropolitan Statistical Area 1,179 456.549 Ocala, FL Metropolitan Statistical Area 1,540 456.5
Consumer Sentinel Network Largest Metropolitan Areas Ranking for
Fraud and Other – Related Consumer Complaints1
January 1 – December 31, 2014
Federal Trade Commission Page 16 of 102 Released February 2015
1Ranking is based on the number of fraud and other types of complaints per 100,000 inhabitants for each Metropolitan Area. This chart illustrates the top 50 Metropolitan Areas (Metropolitan and Micropolitan Statistical Areas) with a population of one hundred thousand or more. See fraud and other types of complaints figures for all Metropolitan Areas with a population of 100,000 or more in Appendix D1. Metropolitan Areas presented here are those defined by the Office of Management and Budget as of February 2013 and per 100,000 unit of population estimates are based on the 2013 U.S. Census population estimates (Table GCT-PEPANNRES-Geography-United States: Annual Estimates of the Resident Population: April 1, 2010 to July 1, 2013 - United States -- Metropolitan and Micropolitan Statistical Area; and for Puerto Rico).
Note: In calculating the State and Metropolitan Areas rankings, we excluded 20 state-specific data contributors’ complaints (the Hawaii Office of Consumer Protection, the Montana, North Carolina and Oregon Departments of Justice, the South Carolina Department of Consumer Affairs, the Tennessee Division of Consumer Affairs, and the Offices of the Attorneys General for Alaska, California, Colorado, Idaho, Indiana, Iowa, Louisiana, Maine, Massachusetts, Michigan, Mississippi, Nevada, Ohio and Washington).
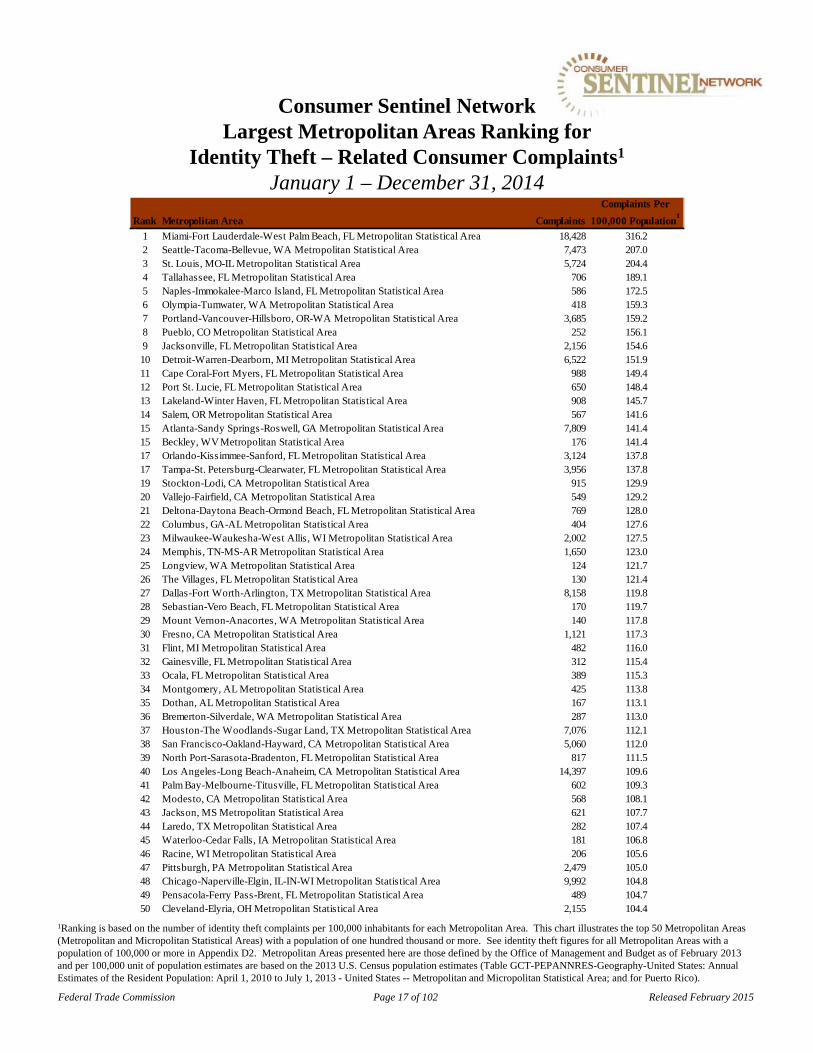
Rank Metropolitan Area Complaints
Complaints Per
100,000 Population1
1 Miami-Fort Lauderdale-West Palm Beach, FL Metropolitan Statistical Area 18,428 316.22 Seattle-Tacoma-Bellevue, WA Metropolitan Statistical Area 7,473 207.03 St. Louis, MO-IL Metropolitan Statistical Area 5,724 204.44 Tallahassee, FL Metropolitan Statistical Area 706 189.15 Naples-Immokalee-Marco Island, FL Metropolitan Statistical Area 586 172.56 Olympia-Tumwater, WA Metropolitan Statistical Area 418 159.37 Portland-Vancouver-Hillsboro, OR-WA Metropolitan Statistical Area 3,685 159.28 Pueblo, CO Metropolitan Statistical Area 252 156.19 Jacksonville, FL Metropolitan Statistical Area 2,156 154.610 Detroit-Warren-Dearborn, MI Metropolitan Statistical Area 6,522 151.911 Cape Coral-Fort Myers, FL Metropolitan Statistical Area 988 149.412 Port St. Lucie, FL Metropolitan Statistical Area 650 148.413 Lakeland-Winter Haven, FL Metropolitan Statistical Area 908 145.714 Salem, OR Metropolitan Statistical Area 567 141.615 Atlanta-Sandy Springs-Roswell, GA Metropolitan Statistical Area 7,809 141.415 Beckley, WV Metropolitan Statistical Area 176 141.417 Orlando-Kissimmee-Sanford, FL Metropolitan Statistical Area 3,124 137.817 Tampa-St. Petersburg-Clearwater, FL Metropolitan Statistical Area 3,956 137.819 Stockton-Lodi, CA Metropolitan Statistical Area 915 129.920 Vallejo-Fairfield, CA Metropolitan Statistical Area 549 129.221 Deltona-Daytona Beach-Ormond Beach, FL Metropolitan Statistical Area 769 128.022 Columbus, GA-AL Metropolitan Statistical Area 404 127.623 Milwaukee-Waukesha-West Allis, WI Metropolitan Statistical Area 2,002 127.524 Memphis, TN-MS-AR Metropolitan Statistical Area 1,650 123.025 Longview, WA Metropolitan Statistical Area 124 121.726 The Villages, FL Metropolitan Statistical Area 130 121.427 Dallas-Fort Worth-Arlington, TX Metropolitan Statistical Area 8,158 119.828 Sebastian-Vero Beach, FL Metropolitan Statistical Area 170 119.729 Mount Vernon-Anacortes, WA Metropolitan Statistical Area 140 117.830 Fresno, CA Metropolitan Statistical Area 1,121 117.331 Flint, MI Metropolitan Statistical Area 482 116.032 Gainesville, FL Metropolitan Statistical Area 312 115.433 Ocala, FL Metropolitan Statistical Area 389 115.334 Montgomery, AL Metropolitan Statistical Area 425 113.835 Dothan, AL Metropolitan Statistical Area 167 113.136 Bremerton-Silverdale, WA Metropolitan Statistical Area 287 113.037 Houston-The Woodlands-Sugar Land, TX Metropolitan Statistical Area 7,076 112.138 San Francisco-Oakland-Hayward, CA Metropolitan Statistical Area 5,060 112.039 North Port-Sarasota-Bradenton, FL Metropolitan Statistical Area 817 111.540 Los Angeles-Long Beach-Anaheim, CA Metropolitan Statistical Area 14,397 109.641 Palm Bay-Melbourne-Titusville, FL Metropolitan Statistical Area 602 109.342 Modesto, CA Metropolitan Statistical Area 568 108.143 Jackson, MS Metropolitan Statistical Area 621 107.744 Laredo, TX Metropolitan Statistical Area 282 107.445 Waterloo-Cedar Falls, IA Metropolitan Statistical Area 181 106.846 Racine, WI Metropolitan Statistical Area 206 105.647 Pittsburgh, PA Metropolitan Statistical Area 2,479 105.048 Chicago-Naperville-Elgin, IL-IN-WI Metropolitan Statistical Area 9,992 104.849 Pensacola-Ferry Pass-Brent, FL Metropolitan Statistical Area 489 104.750 Cleveland-Elyria, OH Metropolitan Statistical Area 2,155 104.4
Consumer Sentinel NetworkLargest Metropolitan Areas Ranking for
Identity Theft – Related Consumer Complaints1
January 1 – December 31, 2014
1Ranking is based on the number of identity theft complaints per 100,000 inhabitants for each Metropolitan Area. This chart illustrates the top 50 Metropolitan Areas (Metropolitan and Micropolitan Statistical Areas) with a population of one hundred thousand or more. See identity theft figures for all Metropolitan Areas with a population of 100,000 or more in Appendix D2. Metropolitan Areas presented here are those defined by the Office of Management and Budget as of February 2013 and per 100,000 unit of population estimates are based on the 2013 U.S. Census population estimates (Table GCT-PEPANNRES-Geography-United States: Annual Estimates of the Resident Population: April 1, 2010 to July 1, 2013 - United States -- Metropolitan and Micropolitan Statistical Area; and for Puerto Rico).
Federal Trade Commission Page 17 of 102 Released February 2015

Military Pay Grade Complaints Percentages3
DoD Civilian 508 2%E1-E3 7,610 28%E4 3,361 12%E5-E6 8,702 32%E7-E9 2,830 10%O1-O3 1,571 6%O4-O6 2,240 8%O7 and Above 150 1%W1-W5 378 1%Total 27,350
Military Status Complaints Percentages2
Active Duty Service Member 6,221 7%Dependent Child\Other - DoD Civilian 1,390 2%Dependent Child\Other - Service Member 3,096 3%Dependent Spouse - DoD Civilian 3,132 4%Dependent Spouse - Service Member 11,528 13%DoD Civilian 541 1%Inactive Reserve\National Guard 4,439 5%Military Retiree\Veteran 58,175 66%Total 88,522
Military Branch Complaints Percentages1
U.S. Army 42,315 48%U.S. Navy 18,268 21%U.S. Air Force 16,691 19%U.S. Marines 8,568 10%U.S. Coast Guard 1,558 2%Total 87,400
Consumer Sentinel Network Military Complaints by Consumer Military Branch January 1 – December 31, 2014
Consumer Sentinel Network Military Complaints
by Consumer Military Pay GradeJanuary 1 – December 31, 2014
1Percentages are based on the total number of CSN complaints from military consumers reporting their branch of service (87,400) between January 1 and December 31, 2014. Of the 98,087 military consumers, 89% reported this information during CY-2014.
3Percentages are based on the total number of CSN complaints from military consumers reporting their pay grade (27,350) between January 1 and December 31, 2014. Of the 98,087 military consumers, 28% reported this information during CY-2014.
Federal Trade Commission Page 18 of 102 Released February 2015
Consumer Sentinel Network Military Complaints
by Consumer Military StatusJanuary 1 – December 31, 2014
2Percentages are based on the total number of CSN complaints from military consumers reporting their military status (88,522) between January 1 and December 31, 2014. Of the 98,087 military consumers, 90% reported this information during CY-2014.

Rank Category DescriptionComplaint
Count Percentages2
1 Debt Collection 5,231 23%
2 Identity Theft 5,127 23%
3 Impostor Scams 2,680 12%
4 Banks and Lenders 2,591 12%5 Credit Bureaus, Information
Furnishers and Report Users785 3%
6 Auto-Related Complaints 584 3%7 Shop-at-Home and Catalog Sales 557 2%
8 Credit Cards 455 2%
8 Telephone and Mobile Services 455 2%10 Internet Services 298 1%
Rank Category DescriptionComplaint
Count Percentages3
1 Identity Theft 1,186 27%
2 Impostor Scams 742 17%
3 Debt Collection 513 12%
4 Banks and Lenders 401 9%5 Shop-at-Home and Catalog Sales 147 3%6 Telephone and Mobile Services 144 3%7 Credit Bureaus, Information
Furnishers and Report Users142 3%
8 Internet Services 94 2%
9 Credit Cards 90 2%10 Auto-Related Complaints 72 2%
Rank Category Description Complaint Count Percentages1
1 Identity Theft 26,349 27%2 Impostor Scams 25,292 26%3 Debt Collection 8,273 8%4 Banks and Lenders 5,321 5%5 Prizes, Sweepstakes and Lotteries 2,460 3%6 Shop-at-Home and Catalog Sales 1,943 2%7 Education 1,926 2%8 Telephone and Mobile Services 1,855 2%9 Auto-Related Complaints 1,788 2%10 Credit Bureaus, Information Furnishers and Report Users 1,384 1%11 Foreign Money Offers and Counterfeit Check Scams 1,240 1%12 Internet Services 1,048 1%13 Credit Cards 943 1%14 Health Care 851 1%15 Grants 741 1%16 Computer Equipment and Software 731 1%17 Mortgage Foreclosure Relief and Debt Management 571 1%18 Business and Job Opportunities 565 1%19 Television and Electronic Media 514 1%20 Advance Payments for Credit Services 474 <1%
Consumer Sentinel Network MilitaryComplaints by Top Category
January 1 – December 31, 2014
1Percentages are based on the total number of CSN Military complaints (98,087) received between January 1 and December 31, 2014. Fourteen percent of these complaints were coded in the Other category.
Top Categories for Complaints from Enlisted Military Consumers
January 1 – December 31, 2014
Top Categories for Complaints from Officer Military Consumers January 1 – December 31, 2014
Federal Trade Commission Page 19 of 102 Released February 2015
2Percentages are based on the total number of CSN complaints (22,503) from military consumers reporting an enlisted rank received between January 1 and December 31, 2014. Nine percent of these complaints were coded in the Other category.
3Percentages are based on the total number of CSN complaints (4,339) from military consumers reporting an officer rank received between January 1 and December 31, 2014. Eleven percent of these complaints were coded in the Other category.
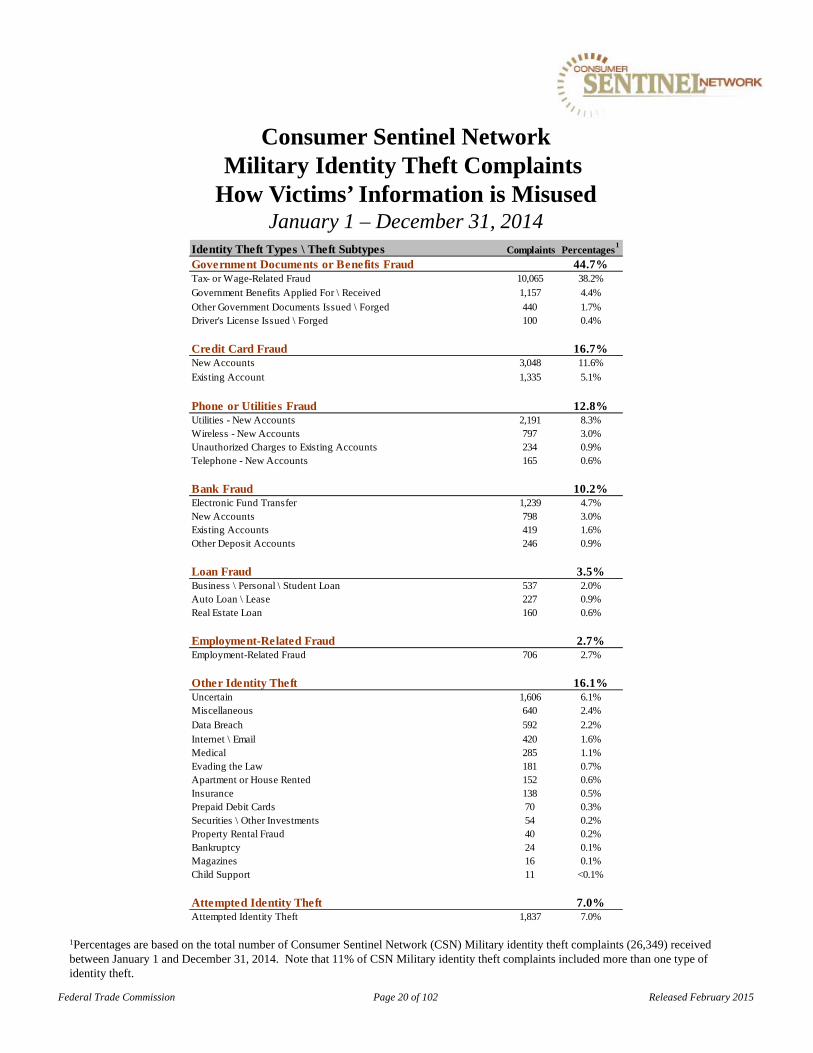
Identity Theft Types \ Theft Subtypes Complaints Percentages1
Government Documents or Benefits Fraud 44.7%Tax- or Wage-Related Fraud 10,065 38.2%Government Benefits Applied For \ Received 1,157 4.4%
Other Government Documents Issued \ Forged 440 1.7%Driver's License Issued \ Forged 100 0.4%
Credit Card Fraud 16.7%New Accounts 3,048 11.6%
Existing Account 1,335 5.1%
Phone or Utilities Fraud 12.8%Utilities - New Accounts 2,191 8.3%Wireless - New Accounts 797 3.0%Unauthorized Charges to Existing Accounts 234 0.9%Telephone - New Accounts 165 0.6%
Bank Fraud 10.2%Electronic Fund Transfer 1,239 4.7%New Accounts 798 3.0%Existing Accounts 419 1.6%Other Deposit Accounts 246 0.9%
Loan Fraud 3.5%Business \ Personal \ Student Loan 537 2.0%Auto Loan \ Lease 227 0.9%Real Estate Loan 160 0.6%
Employment-Related Fraud 2.7%Employment-Related Fraud 706 2.7%
Other Identity Theft 16.1%Uncertain 1,606 6.1%Miscellaneous 640 2.4%
Data Breach 592 2.2%Internet \ Email 420 1.6%Medical 285 1.1%Evading the Law 181 0.7%Apartment or House Rented 152 0.6%Insurance 138 0.5%Prepaid Debit Cards 70 0.3%Securities \ Other Investments 54 0.2%Property Rental Fraud 40 0.2%Bankruptcy 24 0.1%Magazines 16 0.1%Child Support 11 <0.1%
Attempted Identity Theft 7.0%Attempted Identity Theft 1,837 7.0%
Consumer Sentinel NetworkMilitary Identity Theft Complaints
How Victims’ Information is MisusedJanuary 1 – December 31, 2014
1Percentages are based on the total number of Consumer Sentinel Network (CSN) Military identity theft complaints (26,349) received between January 1 and December 31, 2014. Note that 11% of CSN Military identity theft complaints included more than one type of identity theft.
Federal Trade Commission Page 20 of 102 Released February 2015
Consumer Sentinel NetworkDetailed State Complaint Information
(One Page per State and the District of Columbia)
Fraud & Other Complaints
Identity Theft Complaints
Top Fraud & Other Complaint Categories
Identity Theft Types Reported by Victims
Federal Trade Commission Page 21 of 102 Released February 2015
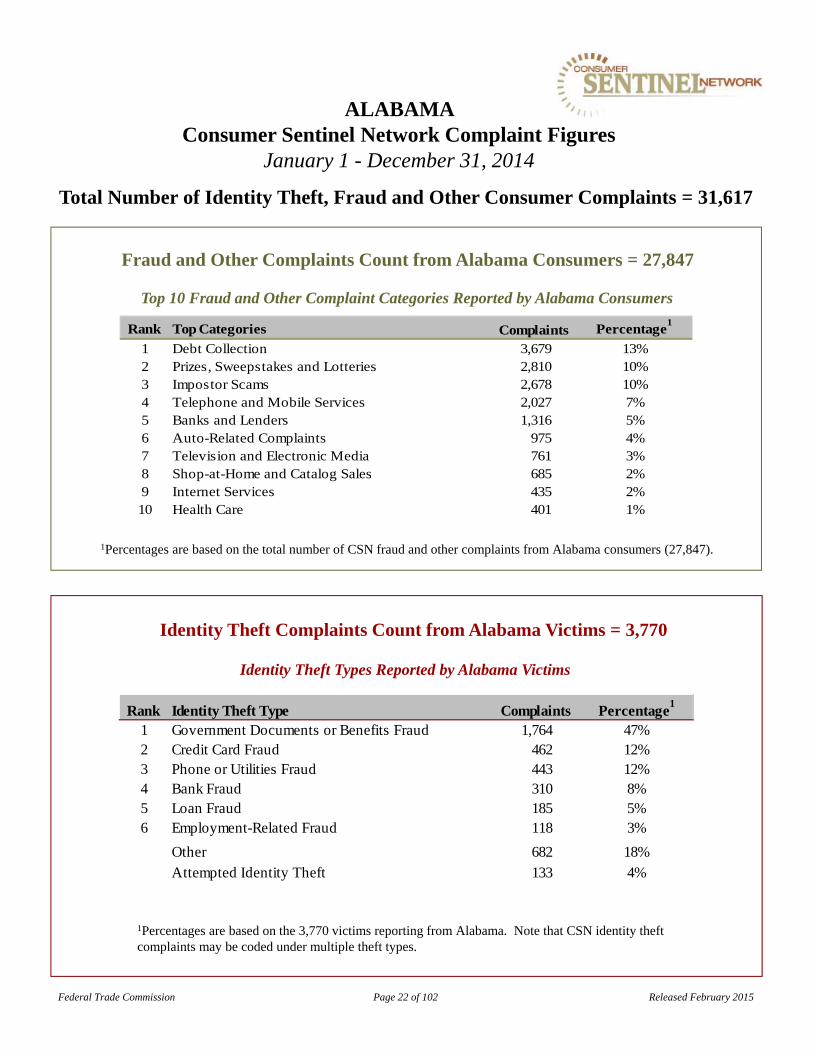
Fraud and Other Complaints Count from Alabama Consumers = 27,847
1Percentages are based on the total number of CSN fraud and other complaints from Alabama consumers (27,847).
ALABAMA Consumer Sentinel Network Complaint Figures
January 1 - December 31, 2014
Total Number of Identity Theft, Fraud and Other Consumer Complaints = 31,617
Identity Theft Types Reported by Alabama Victims
Identity Theft Complaints Count from Alabama Victims = 3,770
1Percentages are based on the 3,770 victims reporting from Alabama. Note that CSN identity theft complaints may be coded under multiple theft types.
Top 10 Fraud and Other Complaint Categories Reported by Alabama Consumers
Federal Trade Commission Page 22 of 102 Released February 2015
Rank Identity Theft Type Percentage1
1 Government Documents or Benefits Fraud 1,764 47%2 Credit Card Fraud 462 12%3 Phone or Utilities Fraud 443 12%4 Bank Fraud 310 8%5 Loan Fraud 185 5%6 Employment-Related Fraud 118 3%
Other 682 18%Attempted Identity Theft 133 4%
Complaints
Rank Top Categories Percentage1
1 Debt Collection 3,679 13%2 Prizes, Sweepstakes and Lotteries 2,810 10%3 Impostor Scams 2,678 10%4 Telephone and Mobile Services 2,027 7%5 Banks and Lenders 1,316 5%6 Auto-Related Complaints 975 4%7 Television and Electronic Media 761 3%8 Shop-at-Home and Catalog Sales 685 2%9 Internet Services 435 2%10 Health Care 401 1%
Complaints
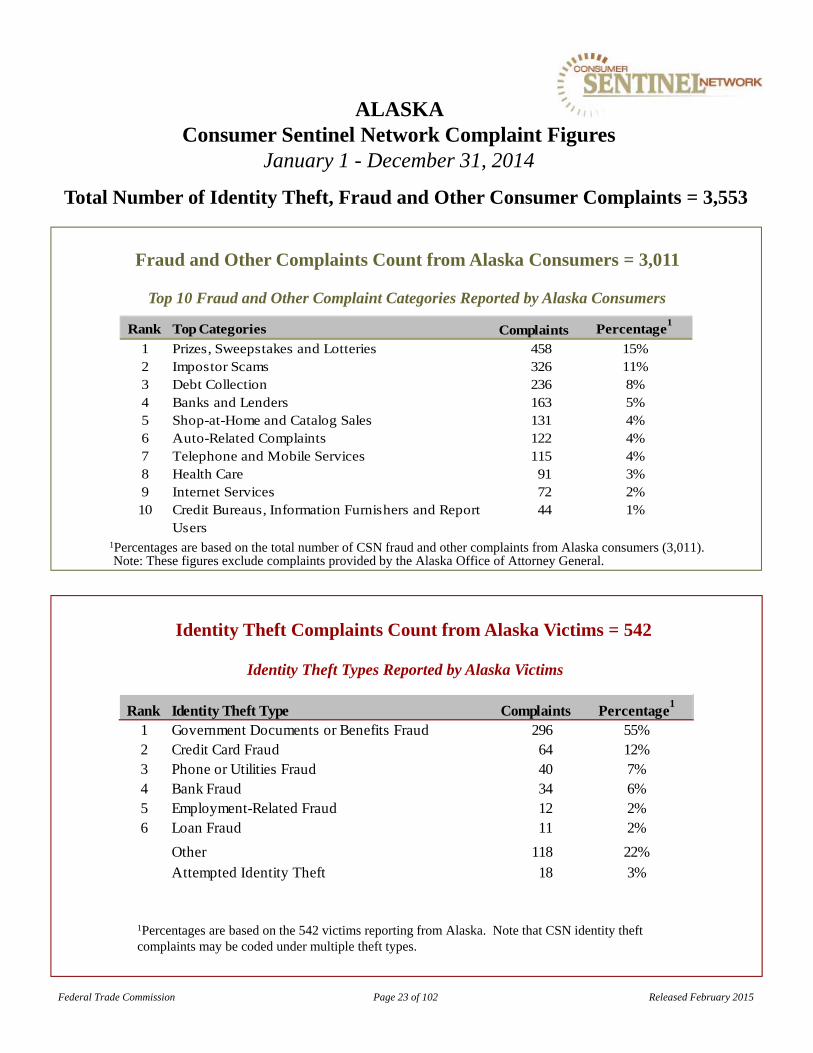
Fraud and Other Complaints Count from Alaska Consumers = 3,011
1Percentages are based on the total number of CSN fraud and other complaints from Alaska consumers (3,011).
ALASKA Consumer Sentinel Network Complaint Figures
January 1 - December 31, 2014
Total Number of Identity Theft, Fraud and Other Consumer Complaints = 3,553
Identity Theft Types Reported by Alaska Victims
Identity Theft Complaints Count from Alaska Victims = 542
1Percentages are based on the 542 victims reporting from Alaska. Note that CSN identity theft complaints may be coded under multiple theft types.
Top 10 Fraud and Other Complaint Categories Reported by Alaska Consumers
Federal Trade Commission Page 23 of 102 Released February 2015
Rank Identity Theft Type Percentage1
1 Government Documents or Benefits Fraud 296 55%2 Credit Card Fraud 64 12%3 Phone or Utilities Fraud 40 7%4 Bank Fraud 34 6%5 Employment-Related Fraud 12 2%6 Loan Fraud 11 2%
Other 118 22%Attempted Identity Theft 18 3%
Complaints
Rank Top Categories Percentage1
1 Prizes, Sweepstakes and Lotteries 458 15%2 Impostor Scams 326 11%3 Debt Collection 236 8%4 Banks and Lenders 163 5%5 Shop-at-Home and Catalog Sales 131 4%6 Auto-Related Complaints 122 4%7 Telephone and Mobile Services 115 4%8 Health Care 91 3%9 Internet Services 72 2%10 Credit Bureaus, Information Furnishers and Report
Users44 1%
Complaints
Note: These figures exclude complaints provided by the Alaska Office of Attorney General.

Fraud and Other Complaints Count from Arizona Consumers = 37,836
1Percentages are based on the total number of CSN fraud and other complaints from Arizona consumers (37,836).
ARIZONA Consumer Sentinel Network Complaint Figures
January 1 - December 31, 2014
Total Number of Identity Theft, Fraud and Other Consumer Complaints = 44,296
Identity Theft Types Reported by Arizona Victims
Identity Theft Complaints Count from Arizona Victims = 6,460
1Percentages are based on the 6,460 victims reporting from Arizona. Note that CSN identity theft complaints may be coded under multiple theft types.
Top 10 Fraud and Other Complaint Categories Reported by Arizona Consumers
Federal Trade Commission Page 24 of 102 Released February 2015
Rank Identity Theft Type Percentage1
1 Government Documents or Benefits Fraud 2,011 31%2 Credit Card Fraud 927 14%3 Employment-Related Fraud 855 13%4 Phone or Utilities Fraud 679 11%5 Bank Fraud 497 8%6 Loan Fraud 236 4%
Other 1,674 26%Attempted Identity Theft 236 4%
Complaints
Rank Top Categories Percentage1
1 Impostor Scams 5,613 15%2 Debt Collection 3,744 10%3 Banks and Lenders 2,656 7%4 Telephone and Mobile Services 2,249 6%5 Auto-Related Complaints 1,866 5%6 Prizes, Sweepstakes and Lotteries 1,862 5%7 Shop-at-Home and Catalog Sales 1,115 3%8 Television and Electronic Media 1,104 3%9 Internet Services 886 2%10 Health Care 842 2%
Complaints

Fraud and Other Complaints Count from Arkansas Consumers = 13,800
1Percentages are based on the total number of CSN fraud and other complaints from Arkansas consumers (13,800).
ARKANSAS Consumer Sentinel Network Complaint Figures
January 1 - December 31, 2014
Total Number of Identity Theft, Fraud and Other Consumer Complaints = 16,281
Identity Theft Types Reported by Arkansas Victims
Identity Theft Complaints Count from Arkansas Victims = 2,481
1Percentages are based on the 2,481 victims reporting from Arkansas. Note that CSN identity theft complaints may be coded under multiple theft types.
Top 10 Fraud and Other Complaint Categories Reported by Arkansas Consumers
Federal Trade Commission Page 25 of 102 Released February 2015
Rank Identity Theft Type Percentage1
1 Government Documents or Benefits Fraud 663 27%2 Phone or Utilities Fraud 373 15%3 Credit Card Fraud 275 11%4 Bank Fraud 147 6%5 Employment-Related Fraud 93 4%6 Loan Fraud 67 3%
Other 992 40%Attempted Identity Theft 71 3%
Complaints
Rank Top Categories Percentage1
1 Debt Collection 1,481 11%2 Prizes, Sweepstakes and Lotteries 1,377 10%3 Impostor Scams 1,195 9%4 Telephone and Mobile Services 748 5%5 Banks and Lenders 531 4%6 Auto-Related Complaints 523 4%7 Television and Electronic Media 336 2%8 Shop-at-Home and Catalog Sales 330 2%9 Internet Services 251 2%10 Health Care 209 2%
Complaints
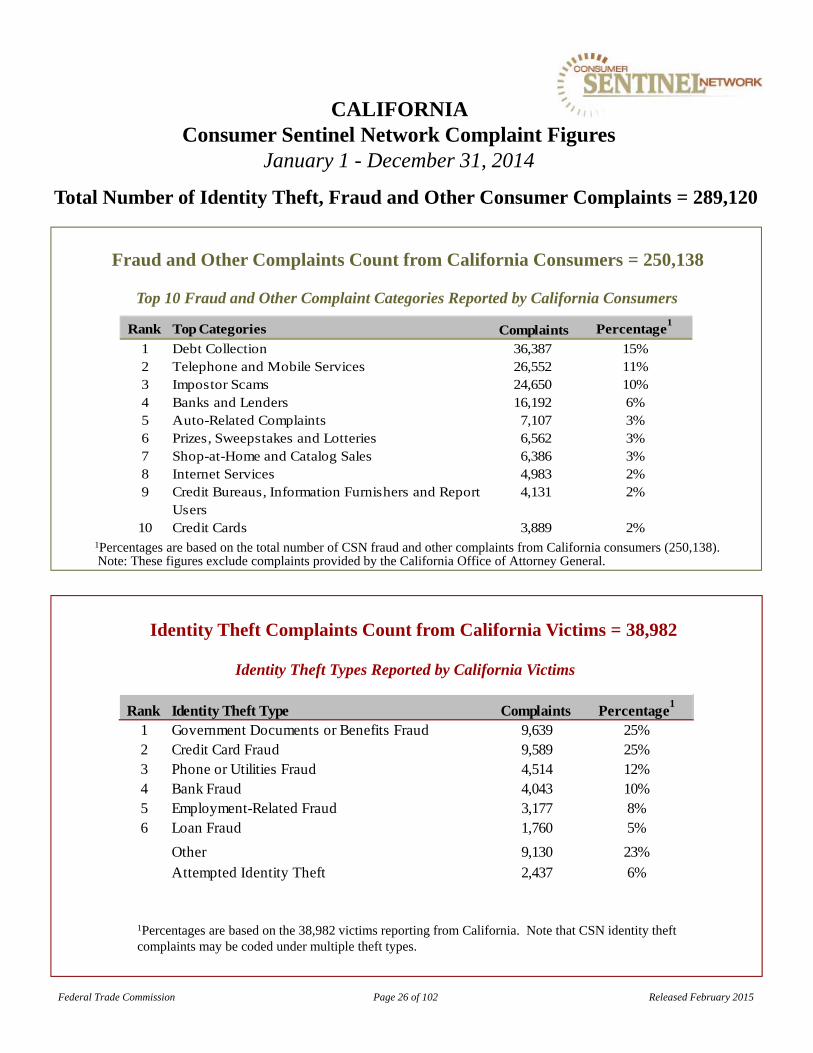
Fraud and Other Complaints Count from California Consumers = 250,138
CALIFORNIA Consumer Sentinel Network Complaint Figures
January 1 - December 31, 2014
Total Number of Identity Theft, Fraud and Other Consumer Complaints = 289,120
Identity Theft Types Reported by California Victims
Identity Theft Complaints Count from California Victims = 38,982
1Percentages are based on the 38,982 victims reporting from California. Note that CSN identity theft complaints may be coded under multiple theft types.
Top 10 Fraud and Other Complaint Categories Reported by California Consumers
Federal Trade Commission Page 26 of 102 Released February 2015
1Percentages are based on the total number of CSN fraud and other complaints from California consumers (250,138).Note: These figures exclude complaints provided by the California Office of Attorney General.
Rank Identity Theft Type Percentage1
1 Government Documents or Benefits Fraud 9,639 25%2 Credit Card Fraud 9,589 25%3 Phone or Utilities Fraud 4,514 12%4 Bank Fraud 4,043 10%5 Employment-Related Fraud 3,177 8%6 Loan Fraud 1,760 5%
Other 9,130 23%Attempted Identity Theft 2,437 6%
Complaints
Rank Top Categories Percentage1
1 Debt Collection 36,387 15%2 Telephone and Mobile Services 26,552 11%3 Impostor Scams 24,650 10%4 Banks and Lenders 16,192 6%5 Auto-Related Complaints 7,107 3%6 Prizes, Sweepstakes and Lotteries 6,562 3%7 Shop-at-Home and Catalog Sales 6,386 3%8 Internet Services 4,983 2%9 Credit Bureaus, Information Furnishers and Report
Users4,131 2%
10 Credit Cards 3,889 2%
Complaints
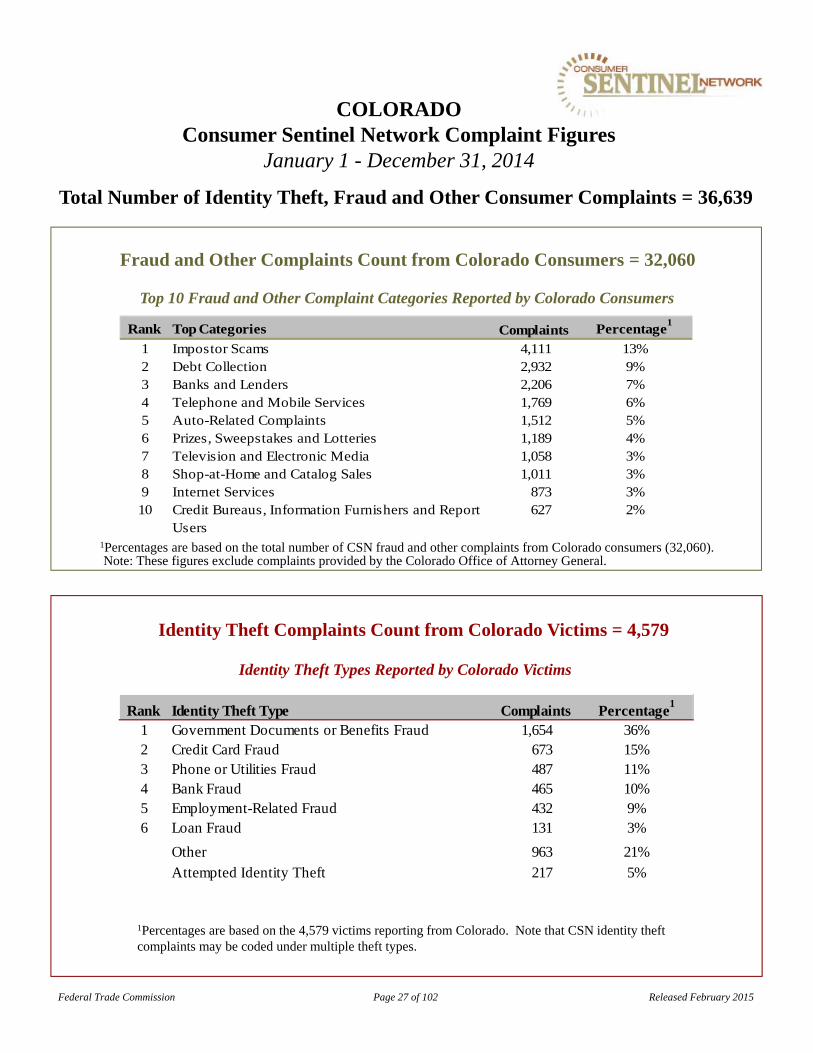
Fraud and Other Complaints Count from Colorado Consumers = 32,060
COLORADO Consumer Sentinel Network Complaint Figures
January 1 - December 31, 2014
Total Number of Identity Theft, Fraud and Other Consumer Complaints = 36,639
Identity Theft Types Reported by Colorado Victims
Identity Theft Complaints Count from Colorado Victims = 4,579
1Percentages are based on the 4,579 victims reporting from Colorado. Note that CSN identity theft complaints may be coded under multiple theft types.
Top 10 Fraud and Other Complaint Categories Reported by Colorado Consumers
Federal Trade Commission Page 27 of 102 Released February 2015
1Percentages are based on the total number of CSN fraud and other complaints from Colorado consumers (32,060).Note: These figures exclude complaints provided by the Colorado Office of Attorney General.
Rank Identity Theft Type Percentage1
1 Government Documents or Benefits Fraud 1,654 36%2 Credit Card Fraud 673 15%3 Phone or Utilities Fraud 487 11%4 Bank Fraud 465 10%5 Employment-Related Fraud 432 9%6 Loan Fraud 131 3%
Other 963 21%Attempted Identity Theft 217 5%
Complaints
Rank Top Categories Percentage1
1 Impostor Scams 4,111 13%2 Debt Collection 2,932 9%3 Banks and Lenders 2,206 7%4 Telephone and Mobile Services 1,769 6%5 Auto-Related Complaints 1,512 5%6 Prizes, Sweepstakes and Lotteries 1,189 4%7 Television and Electronic Media 1,058 3%8 Shop-at-Home and Catalog Sales 1,011 3%9 Internet Services 873 3%10 Credit Bureaus, Information Furnishers and Report
Users627 2%
Complaints
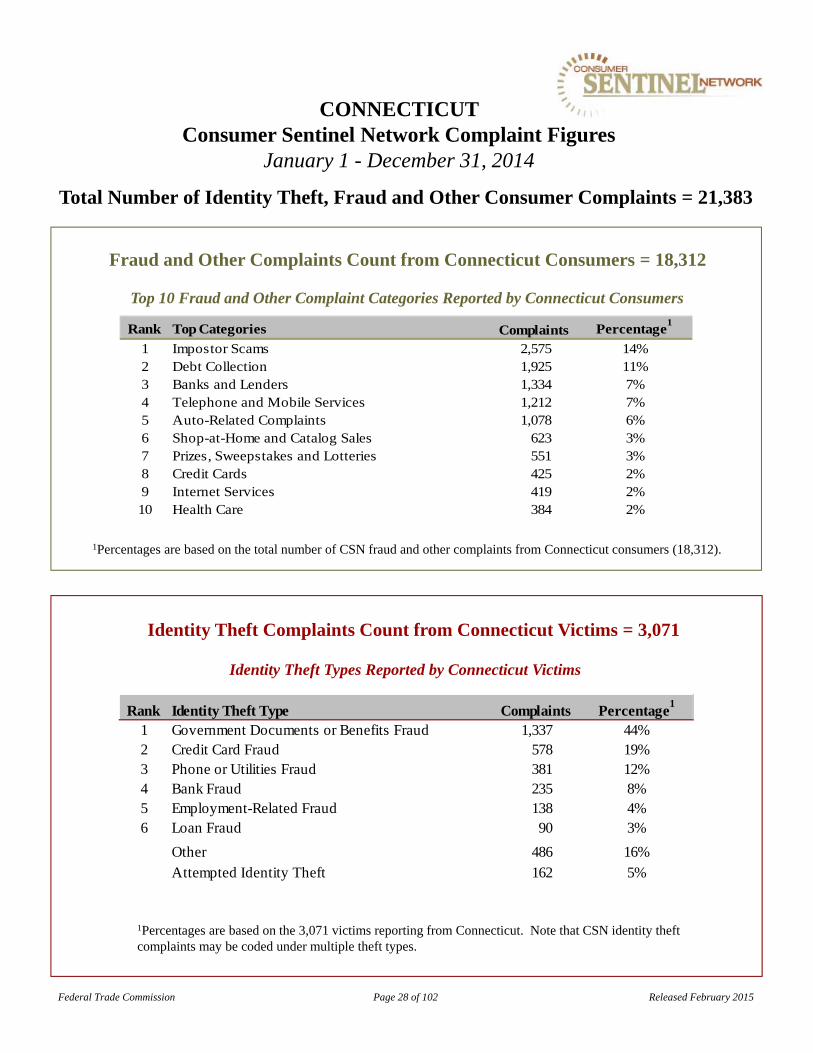
Fraud and Other Complaints Count from Connecticut Consumers = 18,312
1Percentages are based on the total number of CSN fraud and other complaints from Connecticut consumers (18,312).
CONNECTICUT Consumer Sentinel Network Complaint Figures
January 1 - December 31, 2014
Total Number of Identity Theft, Fraud and Other Consumer Complaints = 21,383
Identity Theft Types Reported by Connecticut Victims
Identity Theft Complaints Count from Connecticut Victims = 3,071
1Percentages are based on the 3,071 victims reporting from Connecticut. Note that CSN identity theft complaints may be coded under multiple theft types.
Top 10 Fraud and Other Complaint Categories Reported by Connecticut Consumers
Federal Trade Commission Page 28 of 102 Released February 2015
Rank Identity Theft Type Percentage1
1 Government Documents or Benefits Fraud 1,337 44%2 Credit Card Fraud 578 19%3 Phone or Utilities Fraud 381 12%4 Bank Fraud 235 8%5 Employment-Related Fraud 138 4%6 Loan Fraud 90 3%
Other 486 16%Attempted Identity Theft 162 5%
Complaints
Rank Top Categories Percentage1
1 Impostor Scams 2,575 14%2 Debt Collection 1,925 11%3 Banks and Lenders 1,334 7%4 Telephone and Mobile Services 1,212 7%5 Auto-Related Complaints 1,078 6%6 Shop-at-Home and Catalog Sales 623 3%7 Prizes, Sweepstakes and Lotteries 551 3%8 Credit Cards 425 2%9 Internet Services 419 2%10 Health Care 384 2%
Complaints

Fraud and Other Complaints Count from Delaware Consumers = 7,197
1Percentages are based on the total number of CSN fraud and other complaints from Delaware consumers (7,197).
DELAWARE Consumer Sentinel Network Complaint Figures
January 1 - December 31, 2014
Total Number of Identity Theft, Fraud and Other Consumer Complaints = 7,928
Identity Theft Types Reported by Delaware Victims
Identity Theft Complaints Count from Delaware Victims = 731
1Percentages are based on the 731 victims reporting from Delaware. Note that CSN identity theft complaints may be coded under multiple theft types.
Top 10 Fraud and Other Complaint Categories Reported by Delaware Consumers
Federal Trade Commission Page 29 of 102 Released February 2015
Rank Identity Theft Type Percentage1
1 Government Documents or Benefits Fraud 270 37%2 Credit Card Fraud 120 16%3 Phone or Utilities Fraud 108 15%4 Bank Fraud 70 10%5 Loan Fraud 33 5%6 Employment-Related Fraud 25 3%
Other 155 21%Attempted Identity Theft 25 3%
Complaints
Rank Top Categories Percentage1
1 Impostor Scams 992 14%2 Debt Collection 899 12%3 Banks and Lenders 602 8%4 Telephone and Mobile Services 442 6%5 Prizes, Sweepstakes and Lotteries 337 5%6 Auto-Related Complaints 317 4%7 Shop-at-Home and Catalog Sales 203 3%8 Credit Cards 168 2%9 Credit Bureaus, Information Furnishers and Report
Users158 2%
10 Television and Electronic Media 154 2%
Complaints
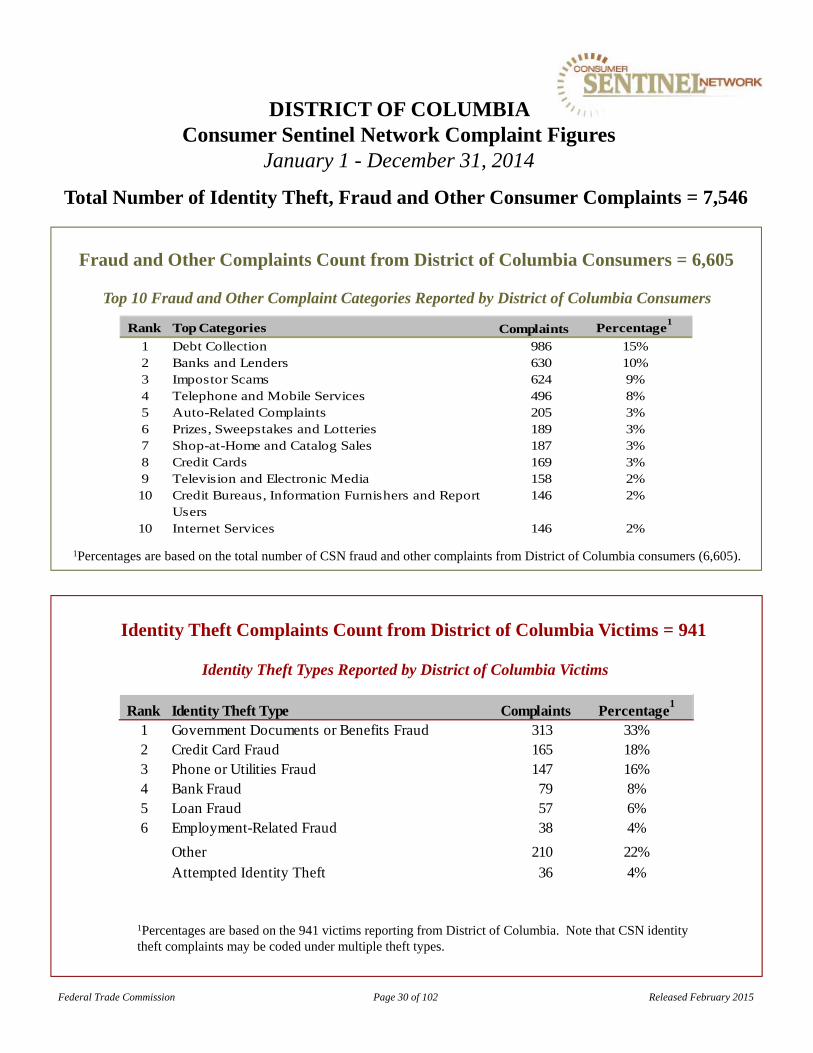
Fraud and Other Complaints Count from District of Columbia Consumers = 6,605
1Percentages are based on the total number of CSN fraud and other complaints from District of Columbia consumers (6,605).
DISTRICT OF COLUMBIA Consumer Sentinel Network Complaint Figures
January 1 - December 31, 2014
Total Number of Identity Theft, Fraud and Other Consumer Complaints = 7,546
Identity Theft Types Reported by District of Columbia Victims
Identity Theft Complaints Count from District of Columbia Victims = 941
1Percentages are based on the 941 victims reporting from District of Columbia. Note that CSN identity theft complaints may be coded under multiple theft types.
Top 10 Fraud and Other Complaint Categories Reported by District of Columbia Consumers
Federal Trade Commission Page 30 of 102 Released February 2015
Rank Identity Theft Type Percentage1
1 Government Documents or Benefits Fraud 313 33%2 Credit Card Fraud 165 18%3 Phone or Utilities Fraud 147 16%4 Bank Fraud 79 8%5 Loan Fraud 57 6%6 Employment-Related Fraud 38 4%
Other 210 22%Attempted Identity Theft 36 4%
Complaints
Rank Top Categories Percentage1
1 Debt Collection 986 15%2 Banks and Lenders 630 10%3 Impostor Scams 624 9%4 Telephone and Mobile Services 496 8%5 Auto-Related Complaints 205 3%6 Prizes, Sweepstakes and Lotteries 189 3%7 Shop-at-Home and Catalog Sales 187 3%8 Credit Cards 169 3%9 Television and Electronic Media 158 2%10 Credit Bureaus, Information Furnishers and Report
Users146 2%
10 Internet Services 146 2%
Complaints
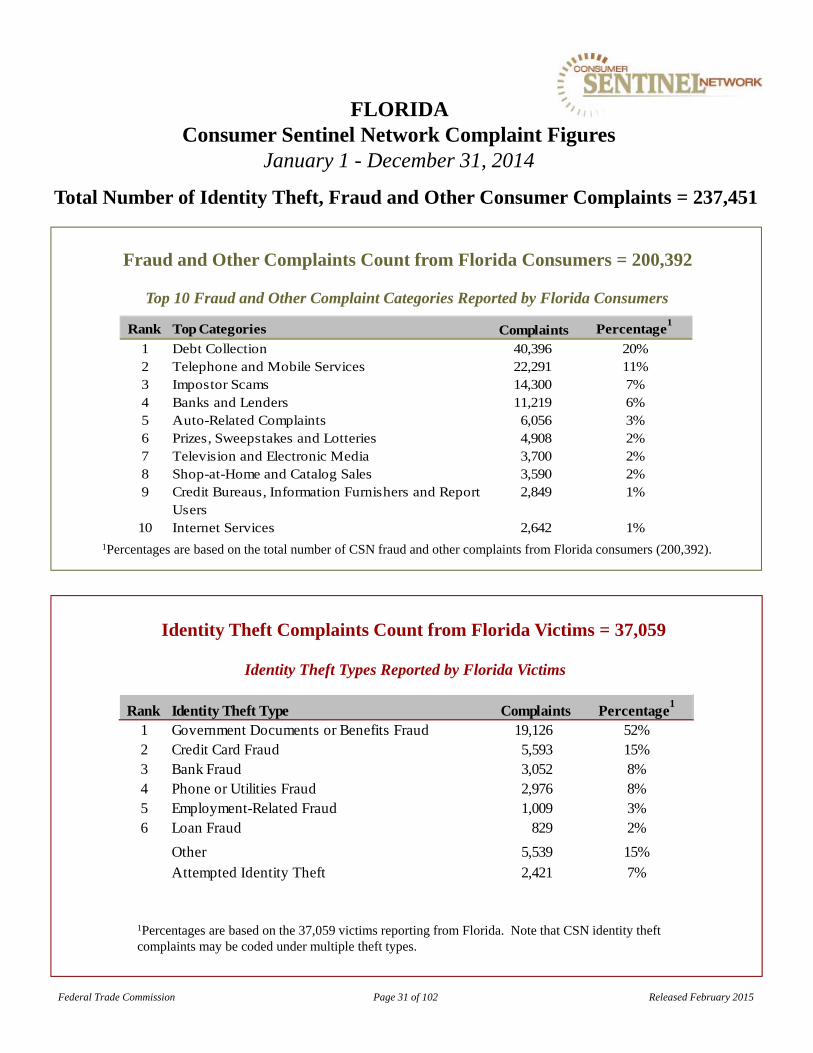
Fraud and Other Complaints Count from Florida Consumers = 200,392
1Percentages are based on the total number of CSN fraud and other complaints from Florida consumers (200,392).
FLORIDA Consumer Sentinel Network Complaint Figures
January 1 - December 31, 2014
Total Number of Identity Theft, Fraud and Other Consumer Complaints = 237,451
Identity Theft Types Reported by Florida Victims
Identity Theft Complaints Count from Florida Victims = 37,059
1Percentages are based on the 37,059 victims reporting from Florida. Note that CSN identity theft complaints may be coded under multiple theft types.
Top 10 Fraud and Other Complaint Categories Reported by Florida Consumers
Federal Trade Commission Page 31 of 102 Released February 2015
Rank Identity Theft Type Percentage1
1 Government Documents or Benefits Fraud 19,126 52%2 Credit Card Fraud 5,593 15%3 Bank Fraud 3,052 8%4 Phone or Utilities Fraud 2,976 8%5 Employment-Related Fraud 1,009 3%6 Loan Fraud 829 2%
Other 5,539 15%Attempted Identity Theft 2,421 7%
Complaints
Rank Top Categories Percentage1
1 Debt Collection 40,396 20%2 Telephone and Mobile Services 22,291 11%3 Impostor Scams 14,300 7%4 Banks and Lenders 11,219 6%5 Auto-Related Complaints 6,056 3%6 Prizes, Sweepstakes and Lotteries 4,908 2%7 Television and Electronic Media 3,700 2%8 Shop-at-Home and Catalog Sales 3,590 2%9 Credit Bureaus, Information Furnishers and Report
Users2,849 1%
10 Internet Services 2,642 1%
Complaints

Fraud and Other Complaints Count from Georgia Consumers = 78,526
1Percentages are based on the total number of CSN fraud and other complaints from Georgia consumers (78,526).
GEORGIA Consumer Sentinel Network Complaint Figures
January 1 - December 31, 2014
Total Number of Identity Theft, Fraud and Other Consumer Complaints = 89,910
Identity Theft Types Reported by Georgia Victims
Identity Theft Complaints Count from Georgia Victims = 11,384
1Percentages are based on the 11,384 victims reporting from Georgia. Note that CSN identity theft complaints may be coded under multiple theft types.
Top 10 Fraud and Other Complaint Categories Reported by Georgia Consumers
Federal Trade Commission Page 32 of 102 Released February 2015
Rank Identity Theft Type Percentage1
1 Government Documents or Benefits Fraud 4,635 41%2 Credit Card Fraud 1,723 15%3 Phone or Utilities Fraud 1,630 14%4 Bank Fraud 922 8%5 Loan Fraud 607 5%6 Employment-Related Fraud 346 3%
Other 2,459 22%Attempted Identity Theft 444 4%
Complaints
Rank Top Categories Percentage1
1 Debt Collection 13,816 18%2 Telephone and Mobile Services 8,848 11%3 Impostor Scams 5,172 7%4 Banks and Lenders 4,981 6%5 Auto-Related Complaints 3,217 4%6 Prizes, Sweepstakes and Lotteries 2,549 3%7 Television and Electronic Media 2,406 3%8 Shop-at-Home and Catalog Sales 1,646 2%9 Credit Bureaus, Information Furnishers and Report
Users1,386 2%
10 Health Care 1,201 2%
Complaints
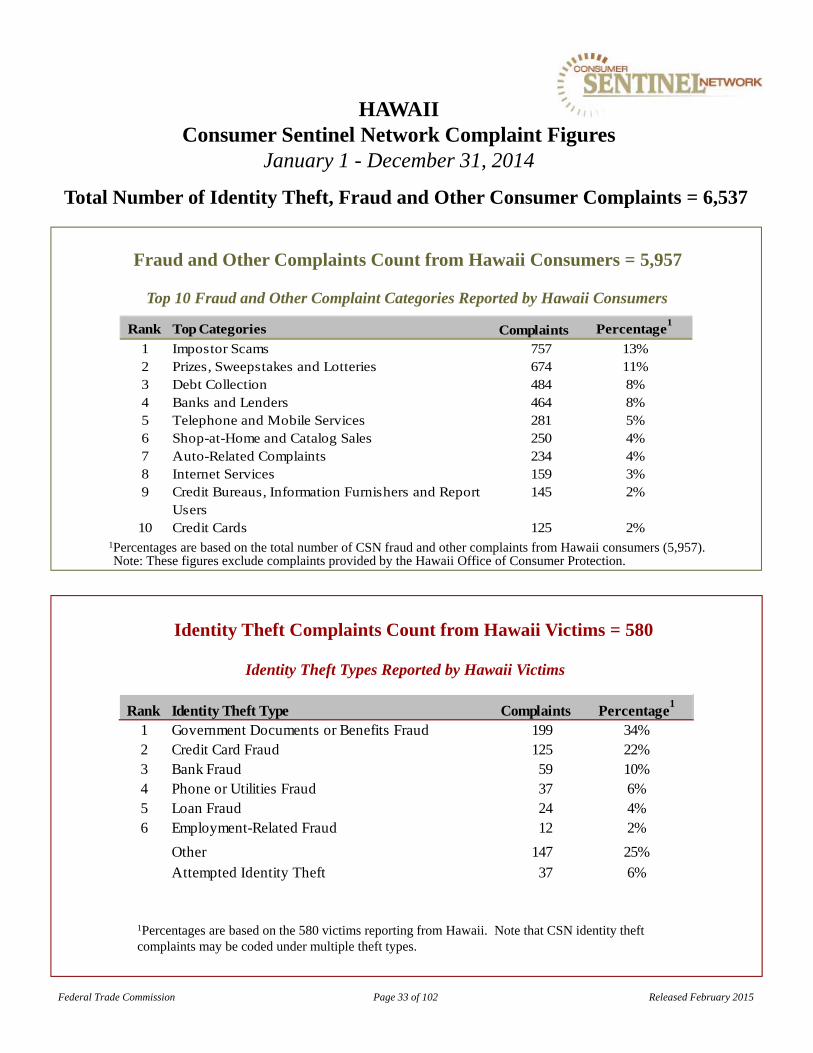
Fraud and Other Complaints Count from Hawaii Consumers = 5,957
1Percentages are based on the total number of CSN fraud and other complaints from Hawaii consumers (5,957).
HAWAII Consumer Sentinel Network Complaint Figures
January 1 - December 31, 2014
Total Number of Identity Theft, Fraud and Other Consumer Complaints = 6,537
Identity Theft Types Reported by Hawaii Victims
Identity Theft Complaints Count from Hawaii Victims = 580
1Percentages are based on the 580 victims reporting from Hawaii. Note that CSN identity theft complaints may be coded under multiple theft types.
Top 10 Fraud and Other Complaint Categories Reported by Hawaii Consumers
Federal Trade Commission Page 33 of 102 Released February 2015
Rank Identity Theft Type Percentage1
1 Government Documents or Benefits Fraud 199 34%2 Credit Card Fraud 125 22%3 Bank Fraud 59 10%4 Phone or Utilities Fraud 37 6%5 Loan Fraud 24 4%6 Employment-Related Fraud 12 2%
Other 147 25%Attempted Identity Theft 37 6%
Complaints
Rank Top Categories Percentage1
1 Impostor Scams 757 13%2 Prizes, Sweepstakes and Lotteries 674 11%3 Debt Collection 484 8%4 Banks and Lenders 464 8%5 Telephone and Mobile Services 281 5%6 Shop-at-Home and Catalog Sales 250 4%7 Auto-Related Complaints 234 4%8 Internet Services 159 3%9 Credit Bureaus, Information Furnishers and Report
Users145 2%
10 Credit Cards 125 2%
Complaints
Note: These figures exclude complaints provided by the Hawaii Office of Consumer Protection.

Fraud and Other Complaints Count from Idaho Consumers = 7,466
IDAHO Consumer Sentinel Network Complaint Figures
January 1 - December 31, 2014
Total Number of Identity Theft, Fraud and Other Consumer Complaints = 8,428
Identity Theft Types Reported by Idaho Victims
Identity Theft Complaints Count from Idaho Victims = 962
1Percentages are based on the 962 victims reporting from Idaho. Note that CSN identity theft complaints may be coded under multiple theft types.
Top 10 Fraud and Other Complaint Categories Reported by Idaho Consumers
Federal Trade Commission Page 34 of 102 Released February 2015
1Percentages are based on the total number of CSN fraud and other complaints from Idaho consumers (7,466).
Note: These figures exclude complaints provided by the Idaho Office of Attorney General.
Rank Identity Theft Type Percentage1
1 Government Documents or Benefits Fraud 361 38%2 Credit Card Fraud 153 16%3 Phone or Utilities Fraud 113 12%4 Bank Fraud 72 7%5 Loan Fraud 70 7%6 Employment-Related Fraud 30 3%
Other 192 20%Attempted Identity Theft 57 6%
Complaints
Rank Top Categories Percentage1
1 Impostor Scams 983 13%2 Debt Collection 907 12%3 Banks and Lenders 448 6%4 Telephone and Mobile Services 406 5%5 Prizes, Sweepstakes and Lotteries 391 5%6 Auto-Related Complaints 349 5%7 Health Care 239 3%8 Internet Services 232 3%9 Shop-at-Home and Catalog Sales 218 3%10 Television and Electronic Media 176 2%
Complaints

Fraud and Other Complaints Count from Illinois Consumers = 61,038
1Percentages are based on the total number of CSN fraud and other complaints from Illinois consumers (61,038).
ILLINOIS Consumer Sentinel Network Complaint Figures
January 1 - December 31, 2014
Total Number of Identity Theft, Fraud and Other Consumer Complaints = 73,355
Identity Theft Types Reported by Illinois Victims
Identity Theft Complaints Count from Illinois Victims = 12,317
1Percentages are based on the 12,317 victims reporting from Illinois. Note that CSN identity theft complaints may be coded under multiple theft types.
Top 10 Fraud and Other Complaint Categories Reported by Illinois Consumers
Federal Trade Commission Page 35 of 102 Released February 2015
Rank Identity Theft Type Percentage1
1 Government Documents or Benefits Fraud 4,549 37%2 Phone or Utilities Fraud 2,174 18%3 Credit Card Fraud 1,918 16%4 Bank Fraud 893 7%5 Employment-Related Fraud 570 5%6 Loan Fraud 480 4%
Other 2,353 19%Attempted Identity Theft 590 5%
Complaints
Rank Top Categories Percentage1
1 Impostor Scams 7,359 12%2 Debt Collection 6,617 11%3 Banks and Lenders 4,763 8%4 Telephone and Mobile Services 3,741 6%5 Auto-Related Complaints 2,812 5%6 Television and Electronic Media 2,483 4%7 Prizes, Sweepstakes and Lotteries 2,481 4%8 Shop-at-Home and Catalog Sales 2,042 3%9 Internet Services 1,594 3%10 Health Care 1,318 2%
Complaints
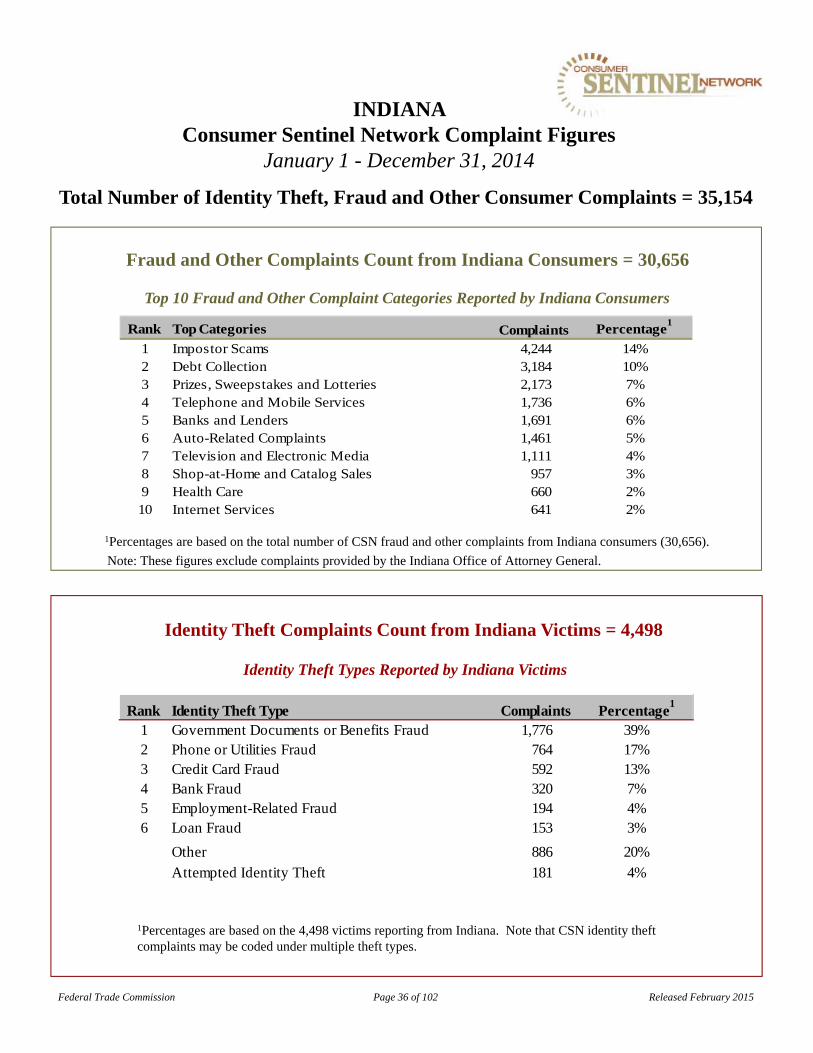
Fraud and Other Complaints Count from Indiana Consumers = 30,656
INDIANA Consumer Sentinel Network Complaint Figures
January 1 - December 31, 2014
Total Number of Identity Theft, Fraud and Other Consumer Complaints = 35,154
Identity Theft Types Reported by Indiana Victims
Identity Theft Complaints Count from Indiana Victims = 4,498
1Percentages are based on the 4,498 victims reporting from Indiana. Note that CSN identity theft complaints may be coded under multiple theft types.
Top 10 Fraud and Other Complaint Categories Reported by Indiana Consumers
Federal Trade Commission Page 36 of 102 Released February 2015
1Percentages are based on the total number of CSN fraud and other complaints from Indiana consumers (30,656).
Note: These figures exclude complaints provided by the Indiana Office of Attorney General.
Rank Identity Theft Type Percentage1
1 Government Documents or Benefits Fraud 1,776 39%2 Phone or Utilities Fraud 764 17%3 Credit Card Fraud 592 13%4 Bank Fraud 320 7%5 Employment-Related Fraud 194 4%6 Loan Fraud 153 3%
Other 886 20%Attempted Identity Theft 181 4%
Complaints
Rank Top Categories Percentage1
1 Impostor Scams 4,244 14%2 Debt Collection 3,184 10%3 Prizes, Sweepstakes and Lotteries 2,173 7%4 Telephone and Mobile Services 1,736 6%5 Banks and Lenders 1,691 6%6 Auto-Related Complaints 1,461 5%7 Television and Electronic Media 1,111 4%8 Shop-at-Home and Catalog Sales 957 3%9 Health Care 660 2%10 Internet Services 641 2%
Complaints
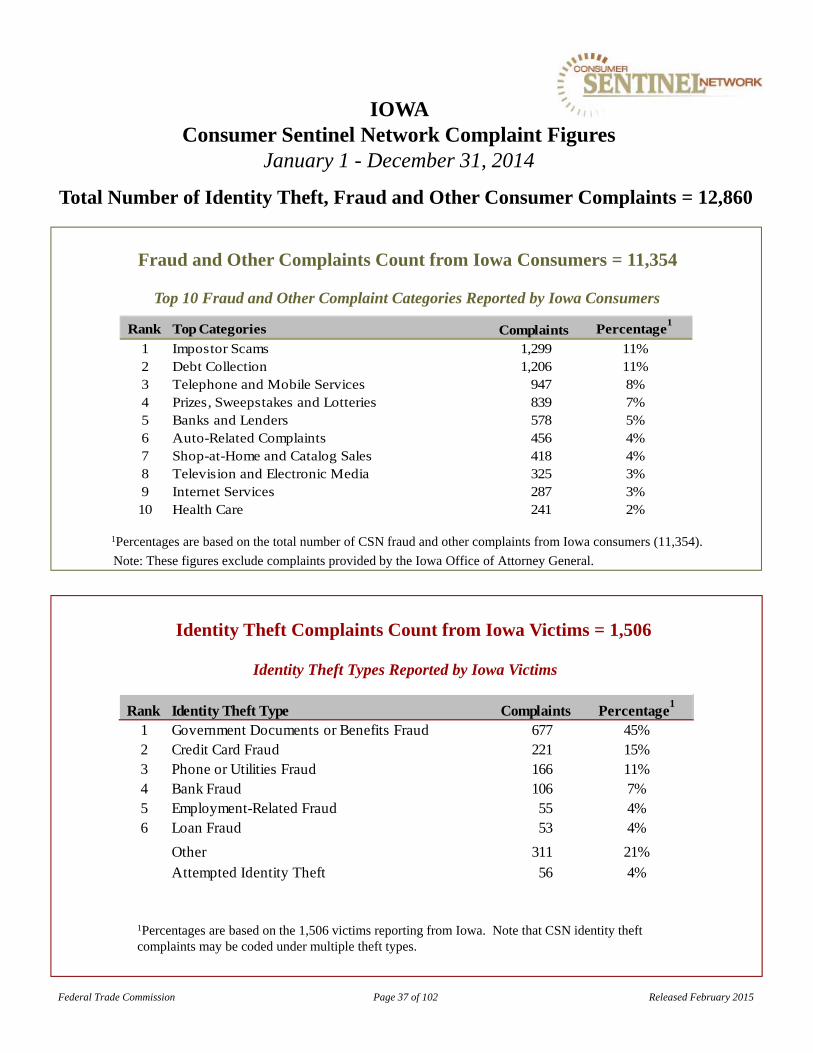
Fraud and Other Complaints Count from Iowa Consumers = 11,354
IOWA Consumer Sentinel Network Complaint Figures
January 1 - December 31, 2014
Total Number of Identity Theft, Fraud and Other Consumer Complaints = 12,860
Identity Theft Types Reported by Iowa Victims
Identity Theft Complaints Count from Iowa Victims = 1,506
1Percentages are based on the 1,506 victims reporting from Iowa. Note that CSN identity theft complaints may be coded under multiple theft types.
Top 10 Fraud and Other Complaint Categories Reported by Iowa Consumers
Federal Trade Commission Page 37 of 102 Released February 2015
1Percentages are based on the total number of CSN fraud and other complaints from Iowa consumers (11,354).
Note: These figures exclude complaints provided by the Iowa Office of Attorney General.
Rank Identity Theft Type Percentage1
1 Government Documents or Benefits Fraud 677 45%2 Credit Card Fraud 221 15%3 Phone or Utilities Fraud 166 11%4 Bank Fraud 106 7%5 Employment-Related Fraud 55 4%6 Loan Fraud 53 4%
Other 311 21%Attempted Identity Theft 56 4%
Complaints
Rank Top Categories Percentage1
1 Impostor Scams 1,299 11%2 Debt Collection 1,206 11%3 Telephone and Mobile Services 947 8%4 Prizes, Sweepstakes and Lotteries 839 7%5 Banks and Lenders 578 5%6 Auto-Related Complaints 456 4%7 Shop-at-Home and Catalog Sales 418 4%8 Television and Electronic Media 325 3%9 Internet Services 287 3%10 Health Care 241 2%
Complaints

Fraud and Other Complaints Count from Kansas Consumers = 12,569
1Percentages are based on the total number of CSN fraud and other complaints from Kansas consumers (12,569).
KANSAS Consumer Sentinel Network Complaint Figures
January 1 - December 31, 2014
Total Number of Identity Theft, Fraud and Other Consumer Complaints = 14,461
Identity Theft Types Reported by Kansas Victims
Identity Theft Complaints Count from Kansas Victims = 1,892
1Percentages are based on the 1,892 victims reporting from Kansas. Note that CSN identity theft complaints may be coded under multiple theft types.
Top 10 Fraud and Other Complaint Categories Reported by Kansas Consumers
Federal Trade Commission Page 38 of 102 Released February 2015
Rank Identity Theft Type Percentage1
1 Government Documents or Benefits Fraud 647 34%2 Credit Card Fraud 325 17%3 Bank Fraud 211 11%4 Phone or Utilities Fraud 191 10%5 Loan Fraud 131 7%6 Employment-Related Fraud 81 4%
Other 378 20%Attempted Identity Theft 109 6%
Complaints
Rank Top Categories Percentage1
1 Debt Collection 1,594 13%2 Impostor Scams 1,456 12%3 Prizes, Sweepstakes and Lotteries 780 6%4 Telephone and Mobile Services 649 5%5 Banks and Lenders 632 5%6 Auto-Related Complaints 509 4%7 Shop-at-Home and Catalog Sales 398 3%8 Internet Services 303 2%9 Television and Electronic Media 266 2%10 Health Care 220 2%
Complaints
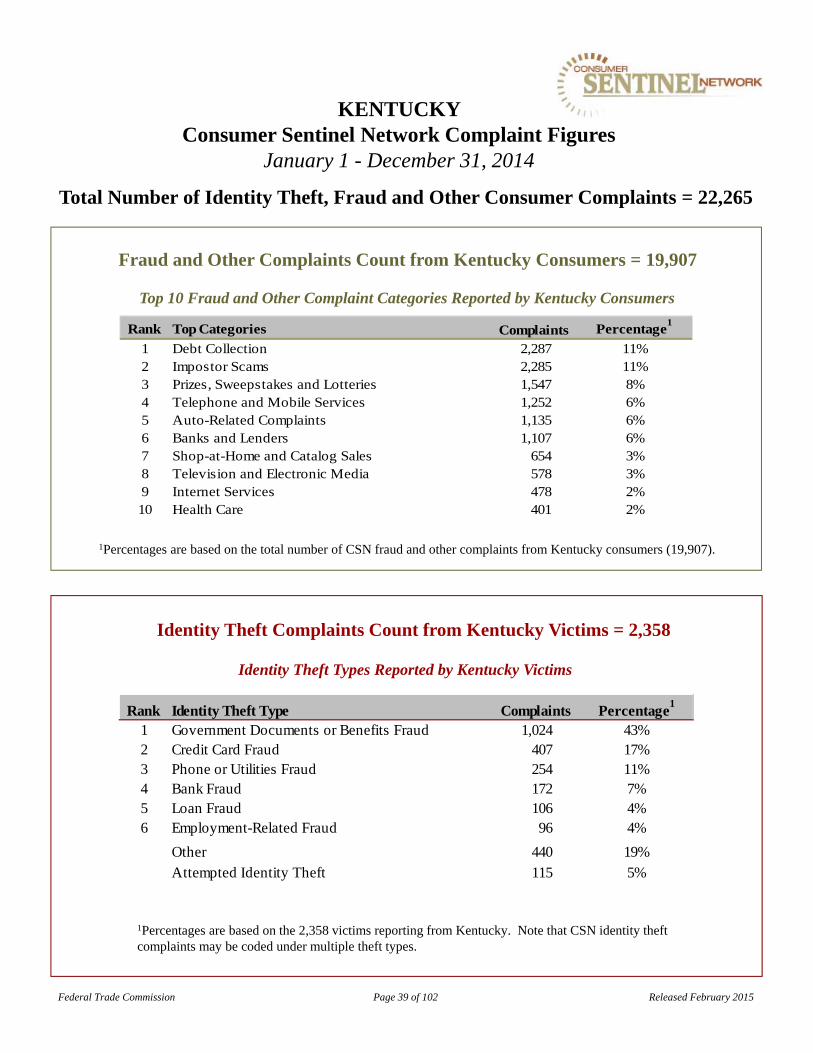
Fraud and Other Complaints Count from Kentucky Consumers = 19,907
1Percentages are based on the total number of CSN fraud and other complaints from Kentucky consumers (19,907).
KENTUCKY Consumer Sentinel Network Complaint Figures
January 1 - December 31, 2014
Total Number of Identity Theft, Fraud and Other Consumer Complaints = 22,265
Identity Theft Types Reported by Kentucky Victims
Identity Theft Complaints Count from Kentucky Victims = 2,358
1Percentages are based on the 2,358 victims reporting from Kentucky. Note that CSN identity theft complaints may be coded under multiple theft types.
Top 10 Fraud and Other Complaint Categories Reported by Kentucky Consumers
Federal Trade Commission Page 39 of 102 Released February 2015
Rank Identity Theft Type Percentage1
1 Government Documents or Benefits Fraud 1,024 43%2 Credit Card Fraud 407 17%3 Phone or Utilities Fraud 254 11%4 Bank Fraud 172 7%5 Loan Fraud 106 4%6 Employment-Related Fraud 96 4%
Other 440 19%Attempted Identity Theft 115 5%
Complaints
Rank Top Categories Percentage1
1 Debt Collection 2,287 11%2 Impostor Scams 2,285 11%3 Prizes, Sweepstakes and Lotteries 1,547 8%4 Telephone and Mobile Services 1,252 6%5 Auto-Related Complaints 1,135 6%6 Banks and Lenders 1,107 6%7 Shop-at-Home and Catalog Sales 654 3%8 Television and Electronic Media 578 3%9 Internet Services 478 2%10 Health Care 401 2%
Complaints

Fraud and Other Complaints Count from Louisiana Consumers = 25,059
LOUISIANA Consumer Sentinel Network Complaint Figures
January 1 - December 31, 2014
Total Number of Identity Theft, Fraud and Other Consumer Complaints = 28,489
Identity Theft Types Reported by Louisiana Victims
Identity Theft Complaints Count from Louisiana Victims = 3,430
1Percentages are based on the 3,430 victims reporting from Louisiana. Note that CSN identity theft complaints may be coded under multiple theft types.
Top 10 Fraud and Other Complaint Categories Reported by Louisiana Consumers
Federal Trade Commission Page 40 of 102 Released February 2015
Rank Identity Theft Type Percentage1
1 Government Documents or Benefits Fraud 1,558 45%2 Credit Card Fraud 465 14%3 Phone or Utilities Fraud 401 12%4 Loan Fraud 293 9%5 Bank Fraud 250 7%6 Employment-Related Fraud 89 3%
Other 559 16%Attempted Identity Theft 135 4%
Complaints
Rank Top Categories Percentage1
1 Debt Collection 3,741 15%2 Impostor Scams 2,322 9%3 Telephone and Mobile Services 2,195 9%4 Prizes, Sweepstakes and Lotteries 1,915 8%5 Banks and Lenders 1,345 5%6 Auto-Related Complaints 949 4%7 Shop-at-Home and Catalog Sales 660 3%8 Television and Electronic Media 498 2%9 Credit Bureaus, Information Furnishers and Report
Users457 2%
10 Internet Auction 363 1%
Complaints
1Percentages are based on the total number of CSN fraud and other complaints from Louisiana consumers (25,059).Note: These figures exclude complaints provided by the Louisiana Office of Attorney General.

Fraud and Other Complaints Count from Maine Consumers = 5,909
1Percentages are based on the total number of CSN fraud and other complaints from Maine consumers (5,909).
MAINE Consumer Sentinel Network Complaint Figures
January 1 - December 31, 2014
Total Number of Identity Theft, Fraud and Other Consumer Complaints = 6,602
Identity Theft Types Reported by Maine Victims
Identity Theft Complaints Count from Maine Victims = 693
1Percentages are based on the 693 victims reporting from Maine. Note that CSN identity theft complaints may be coded under multiple theft types.
Top 10 Fraud and Other Complaint Categories Reported by Maine Consumers
Federal Trade Commission Page 41 of 102 Released February 2015
Note: These figures exclude complaints provided by the Maine Office of Attorney General.
Rank Identity Theft Type Percentage1
1 Government Documents or Benefits Fraud 393 57%2 Credit Card Fraud 100 14%3 Phone or Utilities Fraud 56 8%4 Bank Fraud 50 7%5 Loan Fraud 16 2%6 Employment-Related Fraud 6 1%
Other 102 15%Attempted Identity Theft 32 5%
Complaints
Rank Top Categories Percentage1
1 Impostor Scams 814 14%2 Debt Collection 568 10%3 Telephone and Mobile Services 443 7%4 Banks and Lenders 401 7%5 Prizes, Sweepstakes and Lotteries 311 5%6 Auto-Related Complaints 250 4%7 Shop-at-Home and Catalog Sales 216 4%8 Internet Services 191 3%9 Television and Electronic Media 184 3%10 Credit Cards 126 2%
Complaints

Fraud and Other Complaints Count from Maryland Consumers = 40,369
1Percentages are based on the total number of CSN fraud and other complaints from Maryland consumers (40,369).
MARYLAND Consumer Sentinel Network Complaint Figures
January 1 - December 31, 2014
Total Number of Identity Theft, Fraud and Other Consumer Complaints = 46,103
Identity Theft Types Reported by Maryland Victims
Identity Theft Complaints Count from Maryland Victims = 5,734
1Percentages are based on the 5,734 victims reporting from Maryland. Note that CSN identity theft complaints may be coded under multiple theft types.
Top 10 Fraud and Other Complaint Categories Reported by Maryland Consumers
Federal Trade Commission Page 42 of 102 Released February 2015
Rank Identity Theft Type Percentage1
1 Government Documents or Benefits Fraud 2,026 35%2 Credit Card Fraud 1,035 18%3 Phone or Utilities Fraud 798 14%4 Bank Fraud 508 9%5 Loan Fraud 248 4%6 Employment-Related Fraud 204 4%
Other 1,295 23%Attempted Identity Theft 297 5%
Complaints
Rank Top Categories Percentage1
1 Impostor Scams 4,906 12%2 Debt Collection 4,335 11%3 Banks and Lenders 4,043 10%4 Telephone and Mobile Services 2,576 6%5 Auto-Related Complaints 1,925 5%6 Prizes, Sweepstakes and Lotteries 1,625 4%7 Shop-at-Home and Catalog Sales 1,287 3%8 Television and Electronic Media 979 2%9 Internet Services 918 2%10 Credit Bureaus, Information Furnishers and Report
Users849 2%
Complaints

1Percentages are based on the total number of CSN fraud and other complaints from Massachusetts consumers (37,422).
MASSACHUSETTS Consumer Sentinel Network Complaint Figures
January 1 - December 31, 2014
Total Number of Identity Theft, Fraud and Other Consumer Complaints = 42,538
Identity Theft Types Reported by Massachusetts Victims
Identity Theft Complaints Count from Massachusetts Victims = 5,116
1Percentages are based on the 5,116 victims reporting from Massachusetts. Note that CSN identity theft complaints may be coded under multiple theft types.
Top 10 Fraud and Other Complaint Categories Reported by Massachusetts Consumers
Fraud and Other Complaints Count from Massachusetts Consumers = 37,422
Federal Trade Commission Page 43 of 102 Released February 2015
Rank Identity Theft Type Percentage1
1 Government Documents or Benefits Fraud 2,199 43%2 Credit Card Fraud 797 16%3 Phone or Utilities Fraud 651 13%4 Bank Fraud 348 7%5 Employment-Related Fraud 266 5%6 Loan Fraud 129 3%
Other 947 19%Attempted Identity Theft 289 6%
Complaints
Rank Top Categories Percentage1
1 Impostor Scams 5,250 14%2 Telephone and Mobile Services 3,390 9%3 Debt Collection 3,359 9%4 Banks and Lenders 2,409 6%5 Auto-Related Complaints 1,512 4%6 Prizes, Sweepstakes and Lotteries 1,171 3%7 Shop-at-Home and Catalog Sales 1,142 3%8 Internet Services 841 2%9 Television and Electronic Media 739 2%10 Credit Cards 711 2%
Complaints
Note: These figures exclude complaints provided by the Massachusetts Office of Attorney General.

Fraud and Other Complaints Count from Michigan Consumers = 74,244
MICHIGAN Consumer Sentinel Network Complaint Figures
January 1 - December 31, 2014
Total Number of Identity Theft, Fraud and Other Consumer Complaints = 84,582
Identity Theft Types Reported by Michigan Victims
Identity Theft Complaints Count from Michigan Victims = 10,338
1Percentages are based on the 10,338 victims reporting from Michigan. Note that CSN identity theft complaints may be coded under multiple theft types.
Top 10 Fraud and Other Complaint Categories Reported by Michigan Consumers
Federal Trade Commission Page 44 of 102 Released February 2015
1Percentages are based on the total number of CSN fraud and other complaints from Michigan consumers (74,244).
Note: These figures exclude complaints provided by the Michigan Office of Attorney General.
Rank Identity Theft Type Percentage1
1 Government Documents or Benefits Fraud 4,362 42%2 Phone or Utilities Fraud 2,301 22%3 Credit Card Fraud 1,420 14%4 Bank Fraud 582 6%5 Loan Fraud 352 3%6 Employment-Related Fraud 331 3%
Other 1,496 14%Attempted Identity Theft 488 5%
Complaints
Rank Top Categories Percentage1
1 Debt Collection 14,284 19%2 Telephone and Mobile Services 10,357 14%3 Impostor Scams 5,538 7%4 Banks and Lenders 3,566 5%5 Prizes, Sweepstakes and Lotteries 2,510 3%6 Auto-Related Complaints 1,637 2%7 Shop-at-Home and Catalog Sales 1,612 2%8 Television and Electronic Media 1,547 2%9 Internet Services 1,056 1%10 Health Care 971 1%
Complaints

Fraud and Other Complaints Count from Minnesota Consumers = 23,083
1Percentages are based on the total number of CSN fraud and other complaints from Minnesota consumers (23,083).
MINNESOTA Consumer Sentinel Network Complaint Figures
January 1 - December 31, 2014
Total Number of Identity Theft, Fraud and Other Consumer Complaints = 26,312
Identity Theft Types Reported by Minnesota Victims
Identity Theft Complaints Count from Minnesota Victims = 3,229
1Percentages are based on the 3,229 victims reporting from Minnesota. Note that CSN identity theft complaints may be coded under multiple theft types.
Top 10 Fraud and Other Complaint Categories Reported by Minnesota Consumers
Federal Trade Commission Page 45 of 102 Released February 2015
Rank Identity Theft Type Percentage1
1 Government Documents or Benefits Fraud 1,170 36%2 Credit Card Fraud 595 18%3 Phone or Utilities Fraud 364 11%4 Bank Fraud 285 9%5 Employment-Related Fraud 106 3%6 Loan Fraud 80 2%
Other 764 24%Attempted Identity Theft 183 6%
Complaints
Rank Top Categories Percentage1
1 Impostor Scams 3,309 14%2 Debt Collection 1,874 8%3 Banks and Lenders 1,744 8%4 Telephone and Mobile Services 1,310 6%5 Prizes, Sweepstakes and Lotteries 964 4%6 Auto-Related Complaints 894 4%7 Television and Electronic Media 872 4%8 Shop-at-Home and Catalog Sales 823 4%9 Internet Services 684 3%10 Health Care 659 3%
Complaints

Fraud and Other Complaints Count from Mississippi Consumers = 13,276
MISSISSIPPI Consumer Sentinel Network Complaint Figures
January 1 - December 31, 2014
Total Number of Identity Theft, Fraud and Other Consumer Complaints = 15,685
Identity Theft Types Reported by Mississippi Victims
Identity Theft Complaints Count from Mississippi Victims = 2,409
1Percentages are based on the 2,409 victims reporting from Mississippi. Note that CSN identity theft complaints may be coded under multiple theft types.
Top 10 Fraud and Other Complaint Categories Reported by Mississippi Consumers
Federal Trade Commission Page 46 of 102 Released February 2015
1Percentages are based on the total number of CSN fraud and other complaints from Mississippi consumers (13,276).
Note: These figures exclude complaints provided by the Mississippi Office of Attorney General.
Rank Identity Theft Type Percentage1
1 Government Documents or Benefits Fraud 1,122 47%2 Phone or Utilities Fraud 363 15%3 Credit Card Fraud 222 9%4 Bank Fraud 166 7%5 Loan Fraud 123 5%6 Employment-Related Fraud 82 3%
Other 435 18%Attempted Identity Theft 102 4%
Complaints
Rank Top Categories Percentage1
1 Prizes, Sweepstakes and Lotteries 1,778 13%2 Impostor Scams 1,515 11%3 Debt Collection 1,513 11%4 Telephone and Mobile Services 797 6%5 Banks and Lenders 721 5%6 Auto-Related Complaints 457 3%7 Shop-at-Home and Catalog Sales 385 3%8 Television and Electronic Media 367 3%9 Internet Services 219 2%10 Internet Auction 200 2%
Complaints
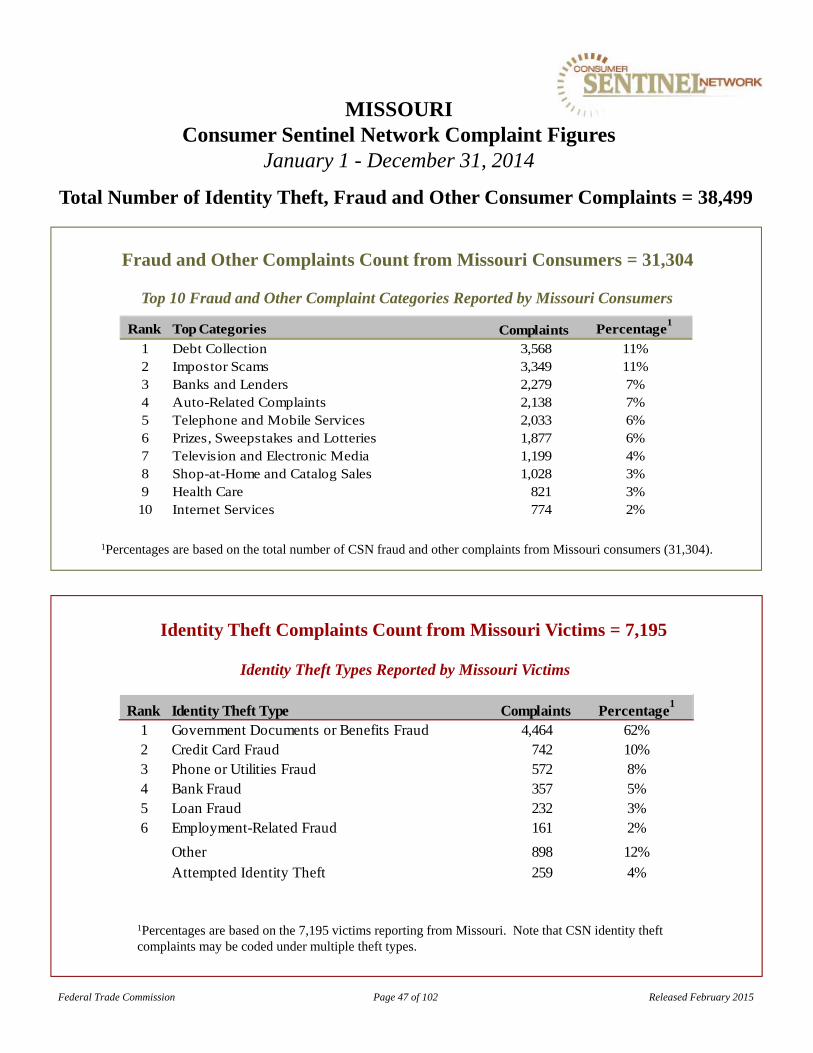
Fraud and Other Complaints Count from Missouri Consumers = 31,304
1Percentages are based on the total number of CSN fraud and other complaints from Missouri consumers (31,304).
MISSOURI Consumer Sentinel Network Complaint Figures
January 1 - December 31, 2014
Total Number of Identity Theft, Fraud and Other Consumer Complaints = 38,499
Identity Theft Types Reported by Missouri Victims
Identity Theft Complaints Count from Missouri Victims = 7,195
1Percentages are based on the 7,195 victims reporting from Missouri. Note that CSN identity theft complaints may be coded under multiple theft types.
Top 10 Fraud and Other Complaint Categories Reported by Missouri Consumers
Federal Trade Commission Page 47 of 102 Released February 2015
Rank Identity Theft Type Percentage1
1 Government Documents or Benefits Fraud 4,464 62%2 Credit Card Fraud 742 10%3 Phone or Utilities Fraud 572 8%4 Bank Fraud 357 5%5 Loan Fraud 232 3%6 Employment-Related Fraud 161 2%
Other 898 12%Attempted Identity Theft 259 4%
Complaints
Rank Top Categories Percentage1
1 Debt Collection 3,568 11%2 Impostor Scams 3,349 11%3 Banks and Lenders 2,279 7%4 Auto-Related Complaints 2,138 7%5 Telephone and Mobile Services 2,033 6%6 Prizes, Sweepstakes and Lotteries 1,877 6%7 Television and Electronic Media 1,199 4%8 Shop-at-Home and Catalog Sales 1,028 3%9 Health Care 821 3%10 Internet Services 774 2%
Complaints

Fraud and Other Complaints Count from Montana Consumers = 4,550
MONTANA Consumer Sentinel Network Complaint Figures
January 1 - December 31, 2014
Total Number of Identity Theft, Fraud and Other Consumer Complaints = 5,135
Identity Theft Types Reported by Montana Victims
Identity Theft Complaints Count from Montana Victims = 585
1Percentages are based on the 585 victims reporting from Montana. Note that CSN identity theft complaints may be coded under multiple theft types.
Top 10 Fraud and Other Complaint Categories Reported by Montana Consumers
Federal Trade Commission Page 48 of 102 Released February 2015
1Percentages are based on the total number of CSN fraud and other complaints from Montana consumers (4,550).
Note: These figures exclude complaints provided by the Montana Department of Justice.
Rank Identity Theft Type Percentage1
1 Government Documents or Benefits Fraud 230 39%2 Credit Card Fraud 85 15%3 Phone or Utilities Fraud 42 7%4 Bank Fraud 40 7%5 Loan Fraud 23 4%6 Employment-Related Fraud 21 4%
Other 158 27%Attempted Identity Theft 32 5%
Complaints
Rank Top Categories Percentage1
1 Impostor Scams 589 13%2 Debt Collection 431 9%3 Prizes, Sweepstakes and Lotteries 362 8%4 Telephone and Mobile Services 234 5%5 Banks and Lenders 182 4%6 Shop-at-Home and Catalog Sales 164 4%7 Internet Services 135 3%8 Television and Electronic Media 127 3%9 Auto-Related Complaints 124 3%10 Foreign Money Offers and Counterfeit Check Scams 81 2%
Complaints

Fraud and Other Complaints Count from Nebraska Consumers = 7,807
1Percentages are based on the total number of CSN fraud and other complaints from Nebraska consumers (7,807).
NEBRASKA Consumer Sentinel Network Complaint Figures
January 1 - December 31, 2014
Total Number of Identity Theft, Fraud and Other Consumer Complaints = 8,721
Identity Theft Types Reported by Nebraska Victims
Identity Theft Complaints Count from Nebraska Victims = 914
1Percentages are based on the 914 victims reporting from Nebraska. Note that CSN identity theft complaints may be coded under multiple theft types.
Top 10 Fraud and Other Complaint Categories Reported by Nebraska Consumers
Federal Trade Commission Page 49 of 102 Released February 2015
Rank Identity Theft Type Percentage1
1 Government Documents or Benefits Fraud 316 35%2 Credit Card Fraud 140 15%3 Phone or Utilities Fraud 116 13%4 Bank Fraud 70 8%5 Employment-Related Fraud 64 7%6 Loan Fraud 49 5%
Other 196 21%Attempted Identity Theft 53 6%
Complaints
Rank Top Categories Percentage1
1 Impostor Scams 989 13%2 Debt Collection 882 11%3 Telephone and Mobile Services 451 6%4 Banks and Lenders 413 5%5 Prizes, Sweepstakes and Lotteries 354 5%6 Auto-Related Complaints 341 4%7 Shop-at-Home and Catalog Sales 287 4%8 Television and Electronic Media 239 3%9 Health Care 206 3%10 Internet Services 195 2%
Complaints

Fraud and Other Complaints Count from Nevada Consumers = 21,952
1Percentages are based on the total number of CSN fraud and other complaints from Nevada consumers (21,952).
NEVADA Consumer Sentinel Network Complaint Figures
January 1 - December 31, 2014
Total Number of Identity Theft, Fraud and Other Consumer Complaints = 24,798
Identity Theft Types Reported by Nevada Victims
Identity Theft Complaints Count from Nevada Victims = 2,846
1Percentages are based on the 2,846 victims reporting from Nevada. Note that CSN identity theft complaints may be coded under multiple theft types.
Top 10 Fraud and Other Complaint Categories Reported by Nevada Consumers
Federal Trade Commission Page 50 of 102 Released February 2015
Rank Identity Theft Type Percentage1
1 Government Documents or Benefits Fraud 795 28%2 Credit Card Fraud 634 22%3 Phone or Utilities Fraud 308 11%4 Bank Fraud 292 10%5 Employment-Related Fraud 170 6%6 Loan Fraud 160 6%
Other 750 26%Attempted Identity Theft 154 5%
Complaints
Rank Top Categories Percentage1
1 Impostor Scams 2,834 13%2 Debt Collection 2,716 12%3 Telephone and Mobile Services 1,611 7%4 Banks and Lenders 1,338 6%5 Auto-Related Complaints 835 4%6 Prizes, Sweepstakes and Lotteries 790 4%7 Shop-at-Home and Catalog Sales 571 3%8 Internet Services 489 2%9 Credit Bureaus, Information Furnishers and Report
Users450 2%
10 Credit Cards 389 2%
Complaints
Note: These figures exclude complaints provided by the Nevada Office of Attorney General.
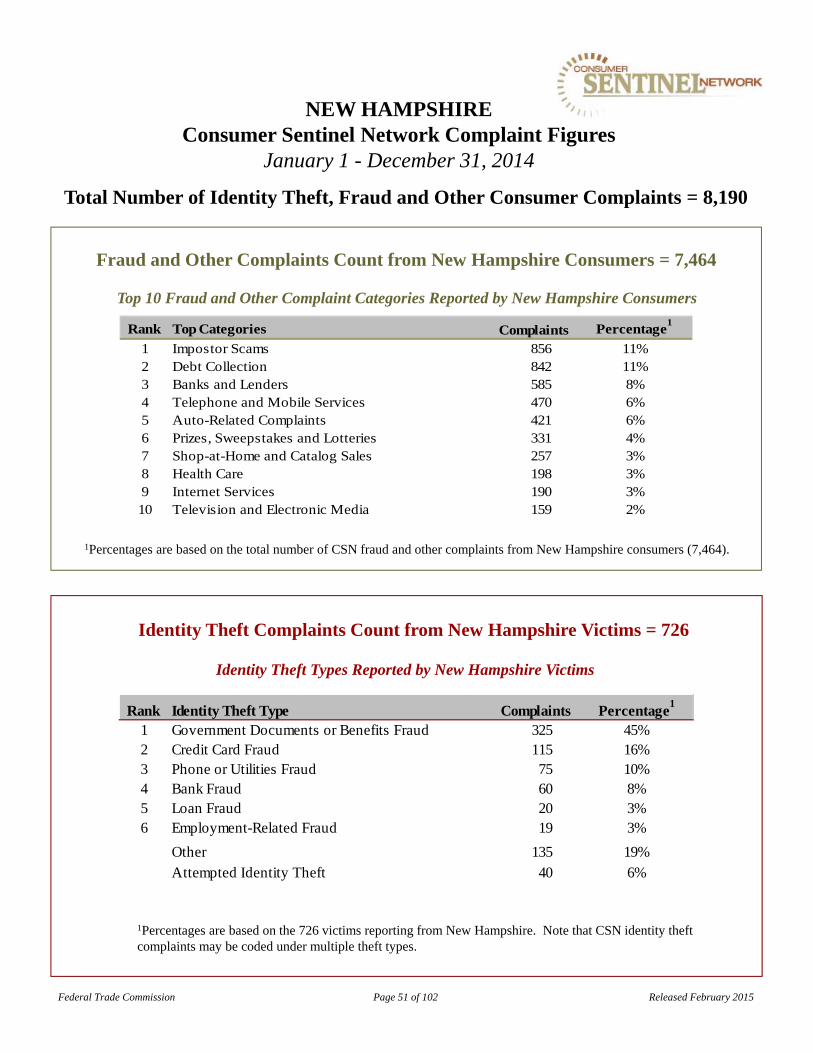
Fraud and Other Complaints Count from New Hampshire Consumers = 7,464
1Percentages are based on the total number of CSN fraud and other complaints from New Hampshire consumers (7,464).
NEW HAMPSHIRE Consumer Sentinel Network Complaint Figures
January 1 - December 31, 2014
Total Number of Identity Theft, Fraud and Other Consumer Complaints = 8,190
Identity Theft Types Reported by New Hampshire Victims
Identity Theft Complaints Count from New Hampshire Victims = 726
1Percentages are based on the 726 victims reporting from New Hampshire. Note that CSN identity theft complaints may be coded under multiple theft types.
Top 10 Fraud and Other Complaint Categories Reported by New Hampshire Consumers
Federal Trade Commission Page 51 of 102 Released February 2015
Rank Identity Theft Type Percentage1
1 Government Documents or Benefits Fraud 325 45%2 Credit Card Fraud 115 16%3 Phone or Utilities Fraud 75 10%4 Bank Fraud 60 8%5 Loan Fraud 20 3%6 Employment-Related Fraud 19 3%
Other 135 19%Attempted Identity Theft 40 6%
Complaints
Rank Top Categories Percentage1
1 Impostor Scams 856 11%2 Debt Collection 842 11%3 Banks and Lenders 585 8%4 Telephone and Mobile Services 470 6%5 Auto-Related Complaints 421 6%6 Prizes, Sweepstakes and Lotteries 331 4%7 Shop-at-Home and Catalog Sales 257 3%8 Health Care 198 3%9 Internet Services 190 3%10 Television and Electronic Media 159 2%
Complaints

Fraud and Other Complaints Count from New Jersey Consumers = 53,535
1Percentages are based on the total number of CSN fraud and other complaints from New Jersey consumers (53,535).
NEW JERSEY Consumer Sentinel Network Complaint Figures
January 1 - December 31, 2014
Total Number of Identity Theft, Fraud and Other Consumer Complaints = 60,679
Identity Theft Types Reported by New Jersey Victims
Identity Theft Complaints Count from New Jersey Victims = 7,144
1Percentages are based on the 7,144 victims reporting from New Jersey. Note that CSN identity theft complaints may be coded under multiple theft types.
Top 10 Fraud and Other Complaint Categories Reported by New Jersey Consumers
Federal Trade Commission Page 52 of 102 Released February 2015
Rank Identity Theft Type Percentage1
1 Government Documents or Benefits Fraud 2,042 29%2 Credit Card Fraud 1,522 21%3 Phone or Utilities Fraud 956 13%4 Bank Fraud 815 11%5 Employment-Related Fraud 346 5%6 Loan Fraud 287 4%
Other 1,635 23%Attempted Identity Theft 440 6%
Complaints
Rank Top Categories Percentage1
1 Debt Collection 6,305 12%2 Impostor Scams 6,128 11%3 Banks and Lenders 4,809 9%4 Telephone and Mobile Services 4,133 8%5 Auto-Related Complaints 2,335 4%6 Prizes, Sweepstakes and Lotteries 1,687 3%7 Shop-at-Home and Catalog Sales 1,618 3%8 Credit Cards 1,235 2%9 Health Care 1,107 2%10 Internet Services 1,101 2%
Complaints

Fraud and Other Complaints Count from New Mexico Consumers = 10,556
1Percentages are based on the total number of CSN fraud and other complaints from New Mexico consumers (10,556).
NEW MEXICO Consumer Sentinel Network Complaint Figures
January 1 - December 31, 2014
Total Number of Identity Theft, Fraud and Other Consumer Complaints = 12,167
Identity Theft Types Reported by New Mexico Victims
Identity Theft Complaints Count from New Mexico Victims = 1,611
1Percentages are based on the 1,611 victims reporting from New Mexico. Note that CSN identity theft complaints may be coded under multiple theft types.
Top 10 Fraud and Other Complaint Categories Reported by New Mexico Consumers
Federal Trade Commission Page 53 of 102 Released February 2015
Rank Identity Theft Type Percentage1
1 Government Documents or Benefits Fraud 548 34%2 Credit Card Fraud 222 14%3 Phone or Utilities Fraud 187 12%4 Employment-Related Fraud 159 10%5 Bank Fraud 129 8%6 Loan Fraud 67 4%
Other 398 25%Attempted Identity Theft 78 5%
Complaints
Rank Top Categories Percentage1
1 Impostor Scams 1,536 15%2 Debt Collection 1,097 10%3 Prizes, Sweepstakes and Lotteries 838 8%4 Banks and Lenders 647 6%5 Telephone and Mobile Services 596 6%6 Auto-Related Complaints 435 4%7 Shop-at-Home and Catalog Sales 338 3%8 Television and Electronic Media 261 2%9 Internet Services 233 2%10 Credit Bureaus, Information Furnishers and Report
Users218 2%
Complaints

Fraud and Other Complaints Count from New York Consumers = 101,497
1Percentages are based on the total number of CSN fraud and other complaints from New York consumers (101,497).
NEW YORK Consumer Sentinel Network Complaint Figures
January 1 - December 31, 2014
Total Number of Identity Theft, Fraud and Other Consumer Complaints = 117,456
Identity Theft Types Reported by New York Victims
Identity Theft Complaints Count from New York Victims = 15,959
1Percentages are based on the 15,959 victims reporting from New York. Note that CSN identity theft complaints may be coded under multiple theft types.
Top 10 Fraud and Other Complaint Categories Reported by New York Consumers
Federal Trade Commission Page 54 of 102 Released February 2015
Rank Identity Theft Type Percentage1
1 Government Documents or Benefits Fraud 5,023 31%2 Credit Card Fraud 3,875 24%3 Phone or Utilities Fraud 2,091 13%4 Bank Fraud 1,565 10%5 Employment-Related Fraud 684 4%6 Loan Fraud 629 4%
Other 3,155 20%Attempted Identity Theft 1,011 6%
Complaints
Rank Top Categories Percentage1
1 Impostor Scams 10,781 11%2 Debt Collection 10,332 10%3 Telephone and Mobile Services 8,746 9%4 Banks and Lenders 7,168 7%5 Auto-Related Complaints 4,211 4%6 Shop-at-Home and Catalog Sales 3,626 4%7 Prizes, Sweepstakes and Lotteries 3,538 3%8 Health Care 2,303 2%9 Internet Services 2,252 2%10 Credit Cards 2,242 2%
Complaints
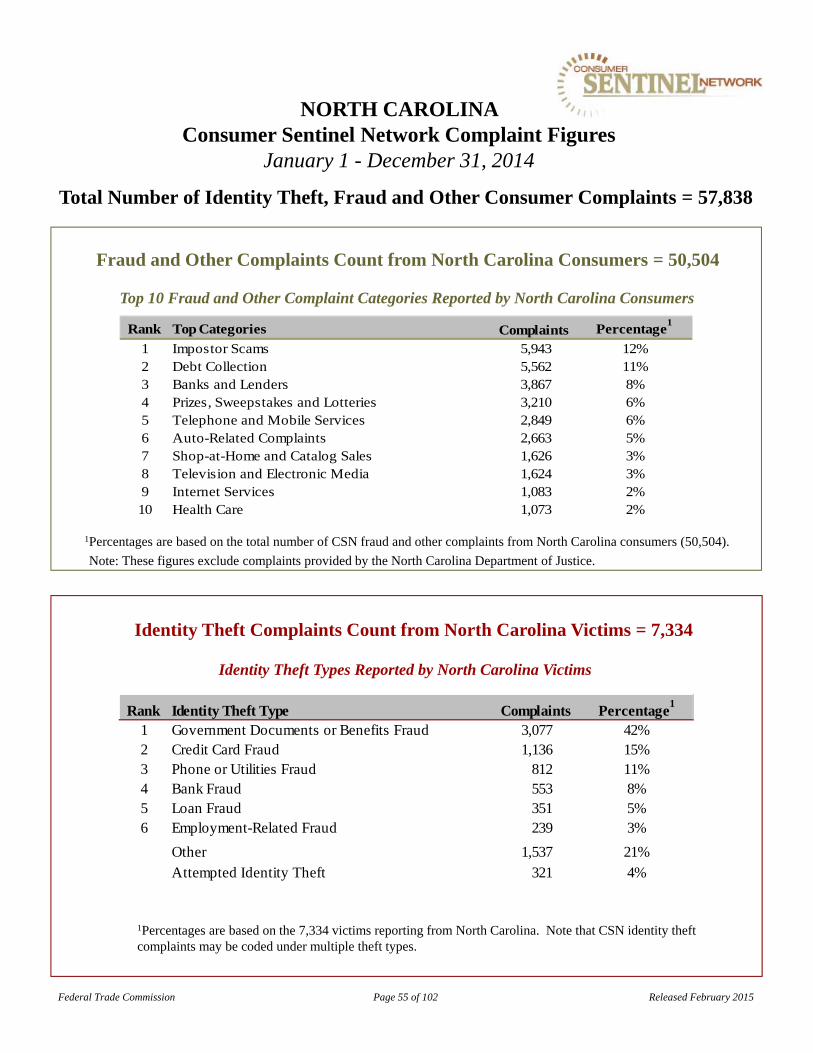
Fraud and Other Complaints Count from North Carolina Consumers = 50,504
NORTH CAROLINA Consumer Sentinel Network Complaint Figures
January 1 - December 31, 2014
Total Number of Identity Theft, Fraud and Other Consumer Complaints = 57,838
Identity Theft Types Reported by North Carolina Victims
Identity Theft Complaints Count from North Carolina Victims = 7,334
1Percentages are based on the 7,334 victims reporting from North Carolina. Note that CSN identity theft complaints may be coded under multiple theft types.
Top 10 Fraud and Other Complaint Categories Reported by North Carolina Consumers
Federal Trade Commission Page 55 of 102 Released February 2015
1Percentages are based on the total number of CSN fraud and other complaints from North Carolina consumers (50,504).
Note: These figures exclude complaints provided by the North Carolina Department of Justice.
Rank Identity Theft Type Percentage1
1 Government Documents or Benefits Fraud 3,077 42%2 Credit Card Fraud 1,136 15%3 Phone or Utilities Fraud 812 11%4 Bank Fraud 553 8%5 Loan Fraud 351 5%6 Employment-Related Fraud 239 3%
Other 1,537 21%Attempted Identity Theft 321 4%
Complaints
Rank Top Categories Percentage1
1 Impostor Scams 5,943 12%2 Debt Collection 5,562 11%3 Banks and Lenders 3,867 8%4 Prizes, Sweepstakes and Lotteries 3,210 6%5 Telephone and Mobile Services 2,849 6%6 Auto-Related Complaints 2,663 5%7 Shop-at-Home and Catalog Sales 1,626 3%8 Television and Electronic Media 1,624 3%9 Internet Services 1,083 2%10 Health Care 1,073 2%
Complaints

Fraud and Other Complaints Count from North Dakota Consumers = 2,473
1Percentages are based on the total number of CSN fraud and other complaints from North Dakota consumers (2,473).
NORTH DAKOTA Consumer Sentinel Network Complaint Figures
January 1 - December 31, 2014
Total Number of Identity Theft, Fraud and Other Consumer Complaints = 2,792
Identity Theft Types Reported by North Dakota Victims
Identity Theft Complaints Count from North Dakota Victims = 319
1Percentages are based on the 319 victims reporting from North Dakota. Note that CSN identity theft complaints may be coded under multiple theft types.
Top 10 Fraud and Other Complaint Categories Reported by North Dakota Consumers
Federal Trade Commission Page 56 of 102 Released February 2015
Rank Identity Theft Type Percentage1
1 Government Documents or Benefits Fraud 145 45%2 Credit Card Fraud 44 14%3 Phone or Utilities Fraud 33 10%4 Bank Fraud 24 8%5 Loan Fraud 17 5%6 Employment-Related Fraud 8 3%
Other 57 18%Attempted Identity Theft 13 4%
Complaints
Rank Top Categories Percentage1
1 Impostor Scams 357 14%2 Debt Collection 224 9%3 Telephone and Mobile Services 160 6%4 Prizes, Sweepstakes and Lotteries 142 6%5 Shop-at-Home and Catalog Sales 111 4%6 Banks and Lenders 94 4%7 Auto-Related Complaints 77 3%8 Internet Services 60 2%9 Credit Bureaus, Information Furnishers and Report
Users48 2%
10 Television and Electronic Media 46 2%
Complaints

Fraud and Other Complaints Count from Ohio Consumers = 58,704
OHIO Consumer Sentinel Network Complaint Figures
January 1 - December 31, 2014
Total Number of Identity Theft, Fraud and Other Consumer Complaints = 67,865
Identity Theft Types Reported by Ohio Victims
Identity Theft Complaints Count from Ohio Victims = 9,161
1Percentages are based on the 9,161 victims reporting from Ohio. Note that CSN identity theft complaints may be coded under multiple theft types.
Top 10 Fraud and Other Complaint Categories Reported by Ohio Consumers
Federal Trade Commission Page 57 of 102 Released February 2015
1Percentages are based on the total number of CSN fraud and other complaints from Ohio consumers (58,704).
Note: These figures exclude complaints provided by the Ohio Office of Attorney General.
Rank Identity Theft Type Percentage1
1 Government Documents or Benefits Fraud 4,652 51%2 Credit Card Fraud 1,204 13%3 Phone or Utilities Fraud 1,110 12%4 Bank Fraud 582 6%5 Loan Fraud 375 4%6 Employment-Related Fraud 207 2%
Other 1,400 15%Attempted Identity Theft 398 4%
Complaints
Rank Top Categories Percentage1
1 Debt Collection 7,773 13%2 Impostor Scams 6,049 10%3 Telephone and Mobile Services 4,649 8%4 Banks and Lenders 4,290 7%5 Auto-Related Complaints 3,444 6%6 Prizes, Sweepstakes and Lotteries 2,752 5%7 Television and Electronic Media 2,091 4%8 Shop-at-Home and Catalog Sales 1,850 3%9 Health Care 1,426 2%10 Internet Services 1,327 2%
Complaints

Fraud and Other Complaints Count from Oklahoma Consumers = 16,926
1Percentages are based on the total number of CSN fraud and other complaints from Oklahoma consumers (16,926).
OKLAHOMA Consumer Sentinel Network Complaint Figures
January 1 - December 31, 2014
Total Number of Identity Theft, Fraud and Other Consumer Complaints = 19,582
Identity Theft Types Reported by Oklahoma Victims
Identity Theft Complaints Count from Oklahoma Victims = 2,656
1Percentages are based on the 2,656 victims reporting from Oklahoma. Note that CSN identity theft complaints may be coded under multiple theft types.
Top 10 Fraud and Other Complaint Categories Reported by Oklahoma Consumers
Federal Trade Commission Page 58 of 102 Released February 2015
Rank Identity Theft Type Percentage1
1 Government Documents or Benefits Fraud 1,051 40%2 Credit Card Fraud 359 14%3 Phone or Utilities Fraud 290 11%4 Bank Fraud 209 8%5 Loan Fraud 140 5%6 Employment-Related Fraud 131 5%
Other 634 24%Attempted Identity Theft 127 5%
Complaints
Rank Top Categories Percentage1
1 Debt Collection 2,112 12%2 Prizes, Sweepstakes and Lotteries 1,938 11%3 Impostor Scams 1,739 10%4 Telephone and Mobile Services 1,056 6%5 Banks and Lenders 917 5%6 Auto-Related Complaints 808 5%7 Shop-at-Home and Catalog Sales 475 3%8 Television and Electronic Media 349 2%9 Health Care 321 2%10 Internet Services 320 2%
Complaints

Fraud and Other Complaints Count from Oregon Consumers = 20,069
OREGON Consumer Sentinel Network Complaint Figures
January 1 - December 31, 2014
Total Number of Identity Theft, Fraud and Other Consumer Complaints = 25,015
Identity Theft Types Reported by Oregon Victims
Identity Theft Complaints Count from Oregon Victims = 4,946
1Percentages are based on the 4,946 victims reporting from Oregon. Note that CSN identity theft complaints may be coded under multiple theft types.
Top 10 Fraud and Other Complaint Categories Reported by Oregon Consumers
Federal Trade Commission Page 59 of 102 Released February 2015
1Percentages are based on the total number of CSN fraud and other complaints from Oregon consumers (20,069).
Note: These figures exclude complaints provided by the Oregon Department of Justice.
Rank Identity Theft Type Percentage1
1 Government Documents or Benefits Fraud 3,041 61%2 Credit Card Fraud 518 10%3 Bank Fraud 263 5%4 Phone or Utilities Fraud 256 5%5 Employment-Related Fraud 100 2%6 Loan Fraud 68 1%
Other 952 19%Attempted Identity Theft 154 3%
Complaints
Rank Top Categories Percentage1
1 Impostor Scams 3,510 17%2 Debt Collection 1,905 9%3 Banks and Lenders 1,387 7%4 Telephone and Mobile Services 1,142 6%5 Prizes, Sweepstakes and Lotteries 928 5%6 Shop-at-Home and Catalog Sales 730 4%7 Auto-Related Complaints 725 4%8 Internet Services 656 3%9 Television and Electronic Media 546 3%10 Health Care 429 2%
Complaints

Fraud and Other Complaints Count from Pennsylvania Consumers = 69,655
1Percentages are based on the total number of CSN fraud and other complaints from Pennsylvania consumers (69,655).
PENNSYLVANIA Consumer Sentinel Network Complaint Figures
January 1 - December 31, 2014
Total Number of Identity Theft, Fraud and Other Consumer Complaints = 80,101
Identity Theft Types Reported by Pennsylvania Victims
Identity Theft Complaints Count from Pennsylvania Victims = 10,446
1Percentages are based on the 10,446 victims reporting from Pennsylvania. Note that CSN identity theft complaints may be coded under multiple theft types.
Top 10 Fraud and Other Complaint Categories Reported by Pennsylvania Consumers
Federal Trade Commission Page 60 of 102 Released February 2015
Rank Identity Theft Type Percentage1
1 Government Documents or Benefits Fraud 3,613 35%2 Credit Card Fraud 1,713 16%3 Phone or Utilities Fraud 1,385 13%4 Bank Fraud 863 8%5 Employment-Related Fraud 422 4%6 Loan Fraud 308 3%
Other 2,734 26%Attempted Identity Theft 483 5%
Complaints
Rank Top Categories Percentage1
1 Debt Collection 8,348 12%2 Impostor Scams 8,173 12%3 Telephone and Mobile Services 5,540 8%4 Banks and Lenders 4,727 7%5 Prizes, Sweepstakes and Lotteries 3,422 5%6 Auto-Related Complaints 2,695 4%7 Shop-at-Home and Catalog Sales 2,262 3%8 Television and Electronic Media 1,689 2%9 Internet Services 1,552 2%10 Health Care 1,310 2%
Complaints

Rank Identity Theft Type Percentage1
1 Government Documents or Benefits Fraud 307 44%2 Credit Card Fraud 126 18%3 Phone or Utilities Fraud 82 12%4 Bank Fraud 55 8%5 Employment-Related Fraud 27 4%5 Loan Fraud 27 4%
Other 99 14%Attempted Identity Theft 37 5%
Complaints
Fraud and Other Complaints Count from Rhode Island Consumers = 6,219
1Percentages are based on the total number of CSN fraud and other complaints from Rhode Island consumers (6,219).
RHODE ISLAND Consumer Sentinel Network Complaint Figures
January 1 - December 31, 2014
Total Number of Identity Theft, Fraud and Other Consumer Complaints = 6,918
Identity Theft Types Reported by Rhode Island Victims
Identity Theft Complaints Count from Rhode Island Victims = 699
1Percentages are based on the 699 victims reporting from Rhode Island. Note that CSN identity theft complaints may be coded under multiple theft types.
Top 10 Fraud and Other Complaint Categories Reported by Rhode Island Consumers
Federal Trade Commission Page 61 of 102 Released February 2015
Rank Top Categories Percentage1
1 Debt Collection 925 15%2 Telephone and Mobile Services 711 11%3 Impostor Scams 578 9%4 Banks and Lenders 422 7%5 Auto-Related Complaints 243 4%6 Prizes, Sweepstakes and Lotteries 200 3%7 Shop-at-Home and Catalog Sales 159 3%8 Credit Bureaus, Information Furnishers and Report
Users134 2%
9 Credit Cards 119 2%10 Internet Services 113 2%
Complaints

Fraud and Other Complaints Count from South Carolina Consumers = 25,816
SOUTH CAROLINA Consumer Sentinel Network Complaint Figures
January 1 - December 31, 2014
Total Number of Identity Theft, Fraud and Other Consumer Complaints = 29,356
Identity Theft Types Reported by South Carolina Victims
Identity Theft Complaints Count from South Carolina Victims = 3,540
1Percentages are based on the 3,540 victims reporting from South Carolina. Note that CSN identity theft complaints may be coded under multiple theft types.
Top 10 Fraud and Other Complaint Categories Reported by South Carolina Consumers
Federal Trade Commission Page 62 of 102 Released February 2015
1Percentages are based on the total number of CSN fraud and other complaints from South Carolina consumers (25,816).Note: These figures exclude complaints provided by the South Carolina Department of Consumer Affairs.
Rank Identity Theft Type Percentage1
1 Government Documents or Benefits Fraud 1,255 35%2 Phone or Utilities Fraud 511 14%3 Credit Card Fraud 508 14%4 Bank Fraud 265 7%5 Loan Fraud 209 6%6 Employment-Related Fraud 102 3%
Other 898 25%Attempted Identity Theft 155 4%
Complaints
Rank Top Categories Percentage1
1 Debt Collection 3,752 15%2 Impostor Scams 2,800 11%3 Banks and Lenders 1,785 7%4 Prizes, Sweepstakes and Lotteries 1,629 6%5 Telephone and Mobile Services 1,411 5%6 Auto-Related Complaints 1,207 5%7 Television and Electronic Media 710 3%8 Shop-at-Home and Catalog Sales 688 3%9 Internet Services 539 2%10 Credit Bureaus, Information Furnishers and Report
Users445 2%
Complaints
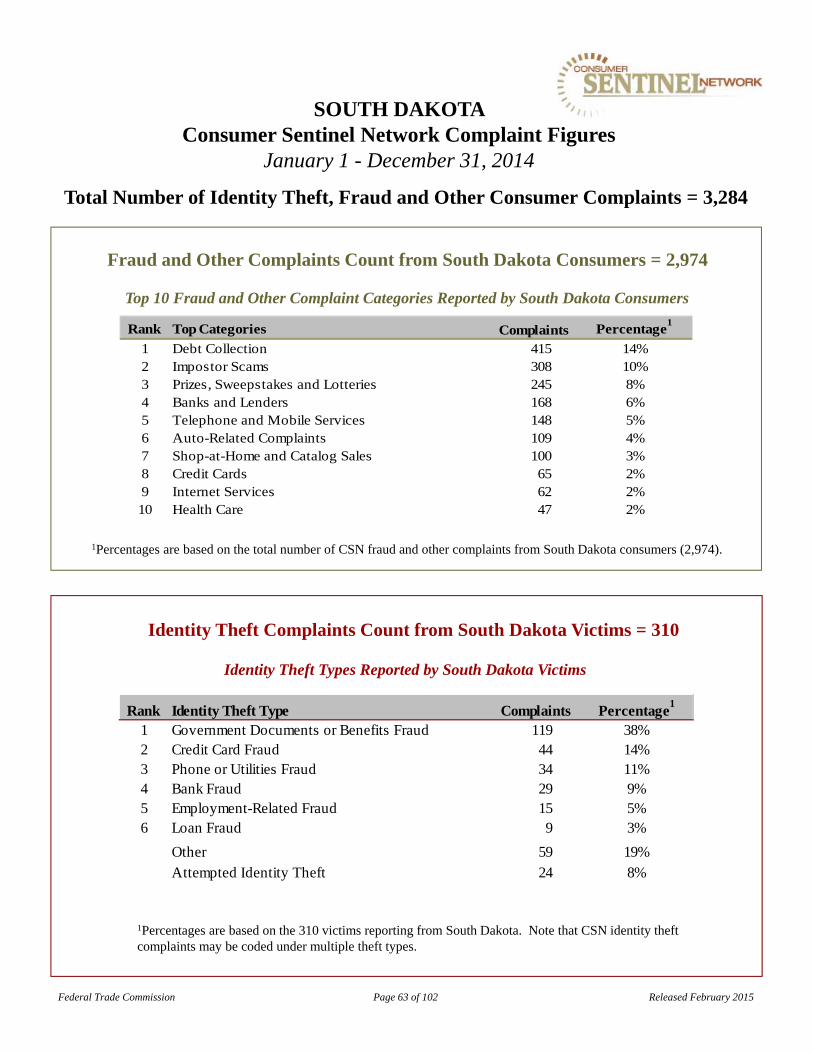
Fraud and Other Complaints Count from South Dakota Consumers = 2,974
1Percentages are based on the total number of CSN fraud and other complaints from South Dakota consumers (2,974).
SOUTH DAKOTA Consumer Sentinel Network Complaint Figures
January 1 - December 31, 2014
Total Number of Identity Theft, Fraud and Other Consumer Complaints = 3,284
Identity Theft Types Reported by South Dakota Victims
Identity Theft Complaints Count from South Dakota Victims = 310
1Percentages are based on the 310 victims reporting from South Dakota. Note that CSN identity theft complaints may be coded under multiple theft types.
Top 10 Fraud and Other Complaint Categories Reported by South Dakota Consumers
Federal Trade Commission Page 63 of 102 Released February 2015
Rank Identity Theft Type Percentage1
1 Government Documents or Benefits Fraud 119 38%2 Credit Card Fraud 44 14%3 Phone or Utilities Fraud 34 11%4 Bank Fraud 29 9%5 Employment-Related Fraud 15 5%6 Loan Fraud 9 3%
Other 59 19%Attempted Identity Theft 24 8%
Complaints
Rank Top Categories Percentage1
1 Debt Collection 415 14%2 Impostor Scams 308 10%3 Prizes, Sweepstakes and Lotteries 245 8%4 Banks and Lenders 168 6%5 Telephone and Mobile Services 148 5%6 Auto-Related Complaints 109 4%7 Shop-at-Home and Catalog Sales 100 3%8 Credit Cards 65 2%9 Internet Services 62 2%10 Health Care 47 2%
Complaints

Fraud and Other Complaints Count from Tennessee Consumers = 37,347
TENNESSEE Consumer Sentinel Network Complaint Figures
January 1 - December 31, 2014
Total Number of Identity Theft, Fraud and Other Consumer Complaints = 42,340
Identity Theft Types Reported by Tennessee Victims
Identity Theft Complaints Count from Tennessee Victims = 4,993
1Percentages are based on the 4,993 victims reporting from Tennessee. Note that CSN identity theft complaints may be coded under multiple theft types.
Top 10 Fraud and Other Complaint Categories Reported by Tennessee Consumers
Federal Trade Commission Page 64 of 102 Released February 2015
1Percentages are based on the total number of CSN fraud and other complaints from Tennessee consumers (37,347).
Note: These figures exclude complaints provided by the Tennessee Division of Consumer Affairs.
Rank Identity Theft Type Percentage1
1 Government Documents or Benefits Fraud 1,871 37%2 Phone or Utilities Fraud 906 18%3 Credit Card Fraud 736 15%4 Bank Fraud 389 8%5 Loan Fraud 234 5%6 Employment-Related Fraud 150 3%
Other 952 19%Attempted Identity Theft 198 4%
Complaints
Rank Top Categories Percentage1
1 Debt Collection 4,575 12%2 Impostor Scams 3,757 10%3 Prizes, Sweepstakes and Lotteries 2,998 8%4 Telephone and Mobile Services 2,475 7%5 Banks and Lenders 2,023 5%6 Television and Electronic Media 1,619 4%7 Auto-Related Complaints 1,522 4%8 Shop-at-Home and Catalog Sales 1,086 3%9 Internet Services 740 2%10 Health Care 714 2%
Complaints
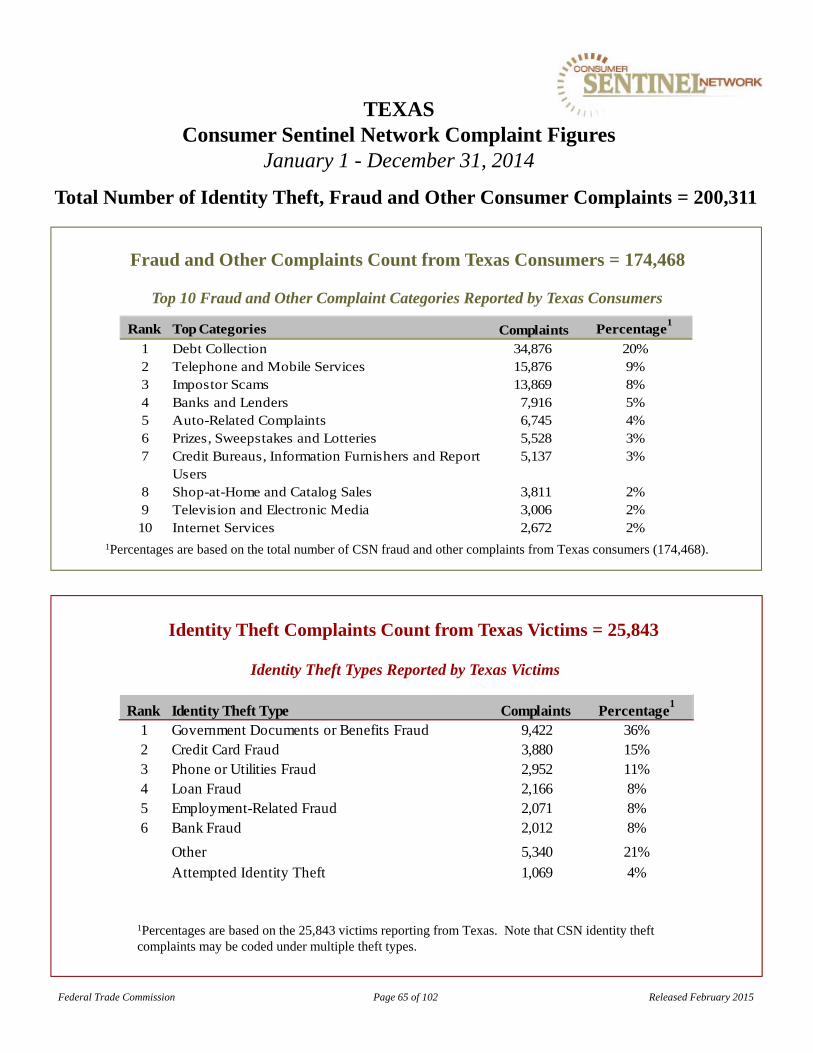
Fraud and Other Complaints Count from Texas Consumers = 174,468
1Percentages are based on the total number of CSN fraud and other complaints from Texas consumers (174,468).
TEXAS Consumer Sentinel Network Complaint Figures
January 1 - December 31, 2014
Total Number of Identity Theft, Fraud and Other Consumer Complaints = 200,311
Identity Theft Types Reported by Texas Victims
Identity Theft Complaints Count from Texas Victims = 25,843
1Percentages are based on the 25,843 victims reporting from Texas. Note that CSN identity theft complaints may be coded under multiple theft types.
Top 10 Fraud and Other Complaint Categories Reported by Texas Consumers
Federal Trade Commission Page 65 of 102 Released February 2015
Rank Identity Theft Type Percentage1
1 Government Documents or Benefits Fraud 9,422 36%2 Credit Card Fraud 3,880 15%3 Phone or Utilities Fraud 2,952 11%4 Loan Fraud 2,166 8%5 Employment-Related Fraud 2,071 8%6 Bank Fraud 2,012 8%
Other 5,340 21%Attempted Identity Theft 1,069 4%
Complaints
Rank Top Categories Percentage1
1 Debt Collection 34,876 20%2 Telephone and Mobile Services 15,876 9%3 Impostor Scams 13,869 8%4 Banks and Lenders 7,916 5%5 Auto-Related Complaints 6,745 4%6 Prizes, Sweepstakes and Lotteries 5,528 3%7 Credit Bureaus, Information Furnishers and Report
Users5,137 3%
8 Shop-at-Home and Catalog Sales 3,811 2%9 Television and Electronic Media 3,006 2%10 Internet Services 2,672 2%
Complaints

Fraud and Other Complaints Count from Utah Consumers = 11,471
1Percentages are based on the total number of CSN fraud and other complaints from Utah consumers (11,471).
UTAH Consumer Sentinel Network Complaint Figures
January 1 - December 31, 2014
Total Number of Identity Theft, Fraud and Other Consumer Complaints = 13,057
Identity Theft Types Reported by Utah Victims
Identity Theft Complaints Count from Utah Victims = 1,586
1Percentages are based on the 1,586 victims reporting from Utah. Note that CSN identity theft complaints may be coded under multiple theft types.
Top 10 Fraud and Other Complaint Categories Reported by Utah Consumers
Federal Trade Commission Page 66 of 102 Released February 2015
Rank Identity Theft Type Percentage1
1 Government Documents or Benefits Fraud 479 30%2 Credit Card Fraud 320 20%3 Phone or Utilities Fraud 163 10%4 Bank Fraud 146 9%5 Employment-Related Fraud 118 7%6 Loan Fraud 74 5%
Other 385 24%Attempted Identity Theft 77 5%
Complaints
Rank Top Categories Percentage1
1 Impostor Scams 1,591 14%2 Debt Collection 1,171 10%3 Banks and Lenders 716 6%4 Prizes, Sweepstakes and Lotteries 687 6%5 Telephone and Mobile Services 593 5%6 Auto-Related Complaints 526 5%7 Internet Services 381 3%8 Shop-at-Home and Catalog Sales 358 3%9 Television and Electronic Media 351 3%10 Health Care 244 2%
Complaints

Fraud and Other Complaints Count from Vermont Consumers = 2,442
1Percentages are based on the total number of CSN fraud and other complaints from Vermont consumers (2,442).
VERMONT Consumer Sentinel Network Complaint Figures
January 1 - December 31, 2014
Total Number of Identity Theft, Fraud and Other Consumer Complaints = 2,844
Identity Theft Types Reported by Vermont Victims
Identity Theft Complaints Count from Vermont Victims = 402
1Percentages are based on the 402 victims reporting from Vermont. Note that CSN identity theft complaints may be coded under multiple theft types.
Top 10 Fraud and Other Complaint Categories Reported by Vermont Consumers
Federal Trade Commission Page 67 of 102 Released February 2015
Rank Identity Theft Type Percentage1
1 Government Documents or Benefits Fraud 223 55%2 Credit Card Fraud 40 10%3 Phone or Utilities Fraud 37 9%4 Bank Fraud 26 6%5 Loan Fraud 8 2%6 Employment-Related Fraud 6 1%
Other 70 17%Attempted Identity Theft 20 5%
Complaints
Rank Top Categories Percentage1
1 Impostor Scams 308 13%2 Debt Collection 294 12%3 Banks and Lenders 208 9%4 Auto-Related Complaints 136 6%5 Telephone and Mobile Services 128 5%6 Prizes, Sweepstakes and Lotteries 117 5%7 Shop-at-Home and Catalog Sales 111 5%8 Internet Services 85 3%9 Television and Electronic Media 67 3%10 Credit Bureaus, Information Furnishers and Report
Users45 2%
Complaints

Fraud and Other Complaints Count from Virginia Consumers = 49,537
1Percentages are based on the total number of CSN fraud and other complaints from Virginia consumers (49,537).
VIRGINIA Consumer Sentinel Network Complaint Figures
January 1 - December 31, 2014
Total Number of Identity Theft, Fraud and Other Consumer Complaints = 55,458
Identity Theft Types Reported by Virginia Victims
Identity Theft Complaints Count from Virginia Victims = 5,921
1Percentages are based on the 5,921 victims reporting from Virginia. Note that CSN identity theft complaints may be coded under multiple theft types.
Top 10 Fraud and Other Complaint Categories Reported by Virginia Consumers
Federal Trade Commission Page 68 of 102 Released February 2015
Rank Identity Theft Type Percentage1
1 Government Documents or Benefits Fraud 2,069 35%2 Credit Card Fraud 998 17%3 Phone or Utilities Fraud 968 16%4 Bank Fraud 560 9%5 Loan Fraud 198 3%6 Employment-Related Fraud 145 2%
Other 1,263 21%Attempted Identity Theft 284 5%
Complaints
Rank Top Categories Percentage1
1 Impostor Scams 6,268 13%2 Debt Collection 5,594 11%3 Banks and Lenders 3,778 8%4 Telephone and Mobile Services 2,694 5%5 Auto-Related Complaints 2,155 4%6 Prizes, Sweepstakes and Lotteries 1,811 4%7 Shop-at-Home and Catalog Sales 1,603 3%8 Credit Bureaus, Information Furnishers and Report
Users1,370 3%
9 Television and Electronic Media 1,321 3%10 Internet Services 1,193 2%
Complaints

Fraud and Other Complaints Count from Washington Consumers = 36,127
WASHINGTON Consumer Sentinel Network Complaint Figures
January 1 - December 31, 2014
Total Number of Identity Theft, Fraud and Other Consumer Complaints = 47,057
Identity Theft Types Reported by Washington Victims
Identity Theft Complaints Count from Washington Victims = 10,930
1Percentages are based on the 10,930 victims reporting from Washington. Note that CSN identity theft complaints may be coded under multiple theft types.
Top 10 Fraud and Other Complaint Categories Reported by Washington Consumers
Federal Trade Commission Page 69 of 102 Released February 2015
1Percentages are based on the total number of CSN fraud and other complaints from Washington consumers (36,127).
Note: These figures exclude complaints provided by the Washington Office of Attorney General.
Rank Identity Theft Type Percentage1
1 Government Documents or Benefits Fraud 6,050 55%2 Credit Card Fraud 1,243 11%3 Phone or Utilities Fraud 667 6%4 Bank Fraud 619 6%5 Employment-Related Fraud 339 3%6 Loan Fraud 145 1%
Other 2,724 25%Attempted Identity Theft 411 4%
Complaints
Rank Top Categories Percentage1
1 Impostor Scams 5,542 15%2 Debt Collection 3,249 9%3 Banks and Lenders 2,629 7%4 Telephone and Mobile Services 2,115 6%5 Auto-Related Complaints 1,474 4%6 Prizes, Sweepstakes and Lotteries 1,362 4%7 Shop-at-Home and Catalog Sales 1,259 3%8 Television and Electronic Media 1,171 3%9 Internet Services 1,077 3%10 Health Care 841 2%
Complaints

Fraud and Other Complaints Count from West Virginia Consumers = 8,634
1Percentages are based on the total number of CSN fraud and other complaints from West Virginia consumers (8,634).
WEST VIRGINIA Consumer Sentinel Network Complaint Figures
January 1 - December 31, 2014
Total Number of Identity Theft, Fraud and Other Consumer Complaints = 9,770
Identity Theft Types Reported by West Virginia Victims
Identity Theft Complaints Count from West Virginia Victims = 1,136
1Percentages are based on the 1,136 victims reporting from West Virginia. Note that CSN identity theft complaints may be coded under multiple theft types.
Top 10 Fraud and Other Complaint Categories Reported by West Virginia Consumers
Federal Trade Commission Page 70 of 102 Released February 2015
Rank Identity Theft Type Percentage1
1 Government Documents or Benefits Fraud 543 48%2 Phone or Utilities Fraud 172 15%3 Credit Card Fraud 158 14%4 Bank Fraud 67 6%5 Loan Fraud 23 2%6 Employment-Related Fraud 20 2%
Other 189 17%Attempted Identity Theft 49 4%
Complaints
Rank Top Categories Percentage1
1 Impostor Scams 998 12%2 Debt Collection 778 9%3 Prizes, Sweepstakes and Lotteries 755 9%4 Telephone and Mobile Services 583 7%5 Auto-Related Complaints 353 4%6 Banks and Lenders 336 4%7 Shop-at-Home and Catalog Sales 318 4%8 Television and Electronic Media 242 3%9 Internet Services 185 2%10 Health Care 142 2%
Complaints

Fraud and Other Complaints Count from Wisconsin Consumers = 24,321
1Percentages are based on the total number of CSN fraud and other complaints from Wisconsin consumers (24,321).
WISCONSIN Consumer Sentinel Network Complaint Figures
January 1 - December 31, 2014
Total Number of Identity Theft, Fraud and Other Consumer Complaints = 28,604
Identity Theft Types Reported by Wisconsin Victims
Identity Theft Complaints Count from Wisconsin Victims = 4,283
1Percentages are based on the 4,283 victims reporting from Wisconsin. Note that CSN identity theft complaints may be coded under multiple theft types.
Top 10 Fraud and Other Complaint Categories Reported by Wisconsin Consumers
Federal Trade Commission Page 71 of 102 Released February 2015
Rank Identity Theft Type Percentage1
1 Government Documents or Benefits Fraud 2,135 50%2 Credit Card Fraud 610 14%3 Phone or Utilities Fraud 376 9%4 Bank Fraud 244 6%5 Loan Fraud 169 4%6 Employment-Related Fraud 117 3%
Other 748 17%Attempted Identity Theft 224 5%
Complaints
Rank Top Categories Percentage1
1 Impostor Scams 2,991 12%2 Debt Collection 2,510 10%3 Telephone and Mobile Services 1,919 8%4 Banks and Lenders 1,681 7%5 Prizes, Sweepstakes and Lotteries 1,099 5%6 Auto-Related Complaints 1,076 4%7 Shop-at-Home and Catalog Sales 934 4%8 Internet Services 690 3%9 Television and Electronic Media 670 3%10 Health Care 641 3%
Complaints

Fraud and Other Complaints Count from Wyoming Consumers = 2,968
1Percentages are based on the total number of CSN fraud and other complaints from Wyoming consumers (2,968).
WYOMING Consumer Sentinel Network Complaint Figures
January 1 - December 31, 2014
Total Number of Identity Theft, Fraud and Other Consumer Complaints = 3,255
Identity Theft Types Reported by Wyoming Victims
Identity Theft Complaints Count from Wyoming Victims = 287
1Percentages are based on the 287 victims reporting from Wyoming. Note that CSN identity theft complaints may be coded under multiple theft types.
Top 10 Fraud and Other Complaint Categories Reported by Wyoming Consumers
Federal Trade Commission Page 72 of 102 Released February 2015
Rank Identity Theft Type Percentage1
1 Government Documents or Benefits Fraud 109 38%2 Credit Card Fraud 41 14%3 Phone or Utilities Fraud 34 12%4 Bank Fraud 25 9%5 Employment-Related Fraud 14 5%6 Loan Fraud 13 5%
Other 66 23%Attempted Identity Theft 16 6%
Complaints
Rank Top Categories Percentage1
1 Prizes, Sweepstakes and Lotteries 365 12%2 Impostor Scams 343 12%3 Debt Collection 294 10%4 Banks and Lenders 124 4%5 Telephone and Mobile Services 113 4%6 Auto-Related Complaints 102 3%7 Shop-at-Home and Catalog Sales 80 3%8 Television and Electronic Media 70 2%9 Internet Services 63 2%10 Credit Bureaus, Information Furnishers and Report
Users55 2%
Complaints
The Consumer Sentinel Network is a free, online database of consumer complaints available only to law enforcement. It includes complaints about identity theft, fraud, financial transactions, debt collection, and credit reports, among other subjects. The Consumer Sentinel Network is based on the premise that sharing information can make law enforcement even more effective. To that end, the Consumer Sentinel Network provides law enforcement members with access to consumer complaints provided directly to the FTC, as well as to complaints shared by other data contributors.
Econsumer.gov was created in April 2001 to gather and share cross-border e-commerce complaints to respond to the challenges of multinational Internet fraud, and enhance consumer confidence in e-commerce. Through econsumer.gov, consumers can file cross-border consumer complaints online and learn about alternative ways to resolve them. All information is available in English, French, German, Japanese, Korean, Polish, Spanish, and Turkish. Using the existing Consumer Sentinel Network, the incoming complaints are shared through the government website with participating consumer protection law enforcers from 28 nations.
The Identity Theft Data Clearinghouse was launched in November 1999 and is the sole national repository of consumer complaints about identity theft. The Clearinghouse provides specific investigative material for law enforcement and broader reports that provide insight to both private and public sector partners on ways to reduce the incidence of identity theft. Information in the Clearinghouse is available to law enforcement members via the Consumer Sentinel Network. This access enables law enforcers to readily spot local identity theft problems and to coordinate with other law enforcement officers where the data reveals common schemes or perpetrators.
www.econsumer.gov
Appendix A1: The Consumer Sentinel Network
www.FTC.gov/idtheft
www.FTC.gov/Sentinel
Federal Trade Commission Page 73 of 102 Released February 2015
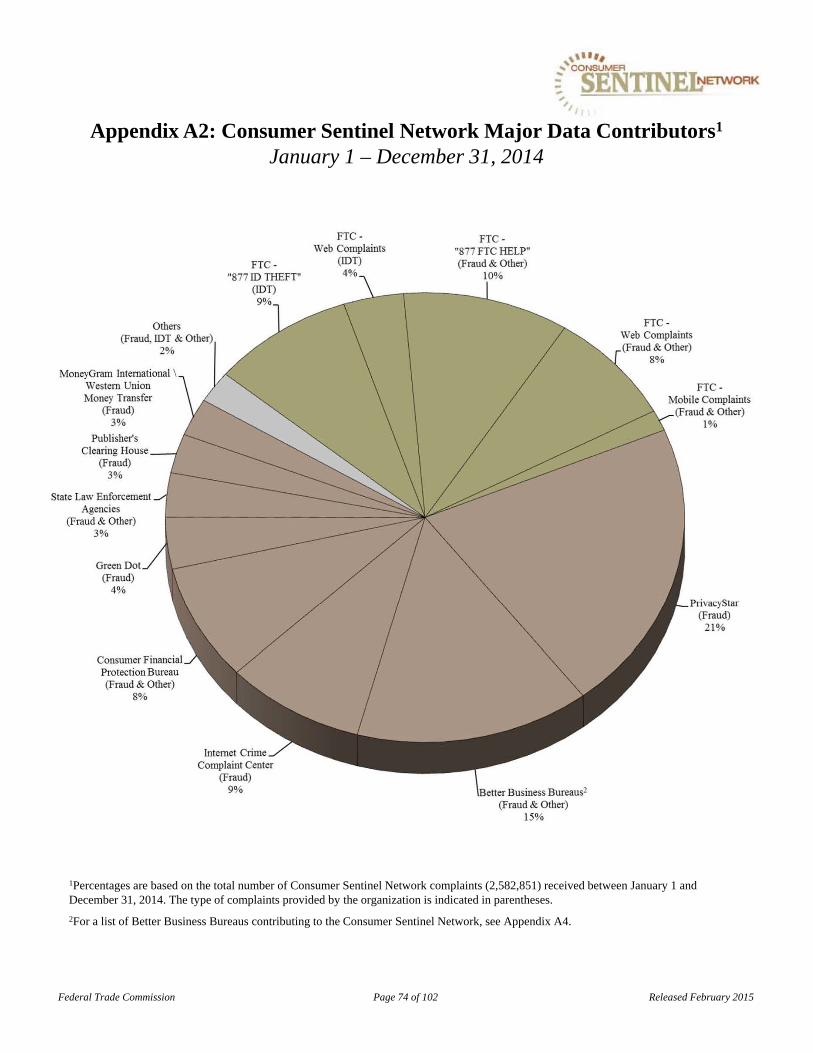
Appendix A2: Consumer Sentinel Network Major Data Contributors1
January 1 – December 31, 2014
1Percentages are based on the total number of Consumer Sentinel Network complaints (2,582,851) received between January 1 and December 31, 2014. The type of complaints provided by the organization is indicated in parentheses.
2For a list of Better Business Bureaus contributing to the Consumer Sentinel Network, see Appendix A4.
Federal Trade Commission Page 74 of 102 Released February 2015
FTC-"877 ID THEFT"
(IDT)
Others (Fraud, IDT & Other)
2%
MoneyGram International \ Western Union Money Transfer
(Fraud) 3%
Publisher's Clearing House
(Fraud) 3%
State Law Enforcement Agencies
(Fraud & Other) 3%
Green (Fraud)
4%
Consumer Financial Protection Bureau (Fraud & Other)
8%
Internet Crime Complaint Center
(Fraud) 9%
FTC-Web Complaints
(IDT)
,, .. ,, ' CONSUMER
SENTINE~ETWOAK
FTC -"877 FTC HELP" (Fraud & Other)
10%
Business Bureaus2 (Fraud & Other)
15%
FTC -Web Complaints (Fraud & Other)
8%
FTC -
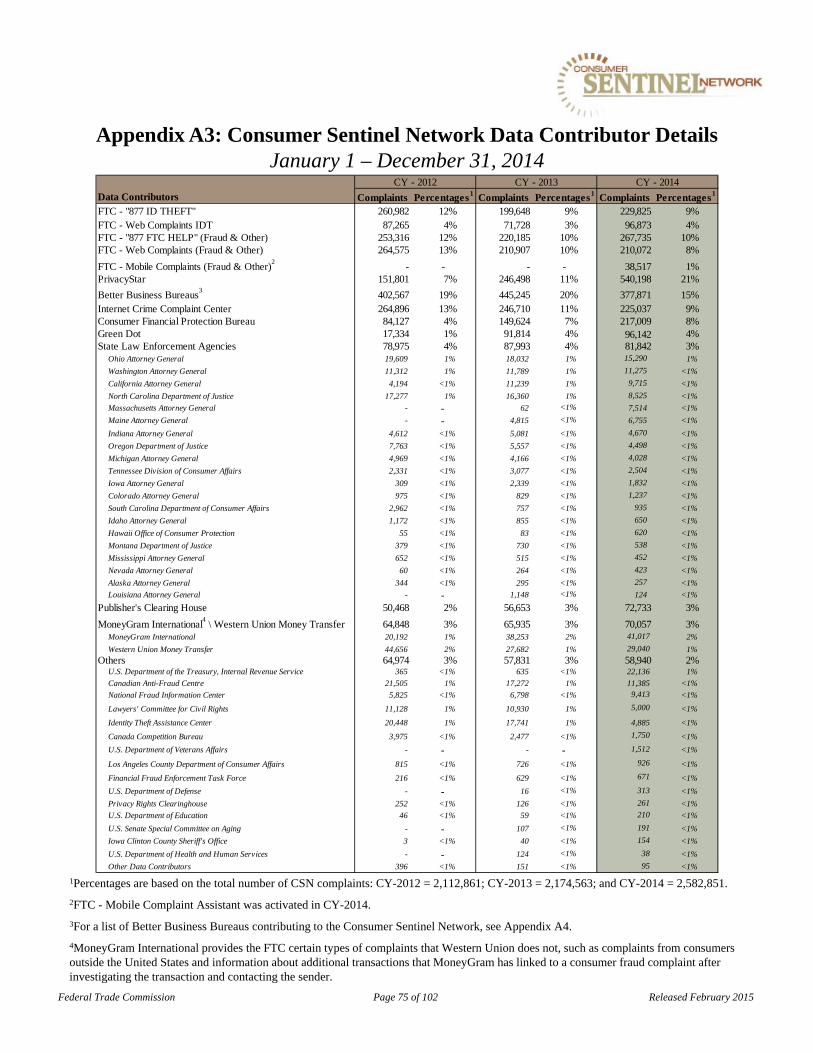
Appendix A3: Consumer Sentinel Network Data Contributor DetailsJanuary 1 – December 31, 2014
1Percentages are based on the total number of CSN complaints: CY-2012 = 2,112,861; CY-2013 = 2,174,563; and CY-2014 = 2,582,851.
2FTC - Mobile Complaint Assistant was activated in CY-2014.
3For a list of Better Business Bureaus contributing to the Consumer Sentinel Network, see Appendix A4.
4MoneyGram International provides the FTC certain types of complaints that Western Union does not, such as complaints from consumers outside the United States and information about additional transactions that MoneyGram has linked to a consumer fraud complaint after investigating the transaction and contacting the sender.
Federal Trade Commission Page 75 of 102 Released February 2015
Complaints Percentages1 Complaints Percentages1 Complaints Percentages1
FTC - "877 ID THEFT" 260,982 12% 199,648 9% 229,825 9%FTC - Web Complaints IDT 87,265 4% 71,728 3% 96,873 4%FTC - "877 FTC HELP" (Fraud & Other) 253,316 12% 220,185 10% 267,735 10%FTC - Web Complaints (Fraud & Other) 264,575 13% 210,907 10% 210,072 8%
FTC - Mobile Complaints (Fraud & Other)2
- - - - 38,517 1%PrivacyStar 151,801 7% 246,498 11% 540,198 21%
Better Business Bureaus3
402,567 19% 445,245 20% 377,871 15%Internet Crime Complaint Center 264,896 13% 246,710 11% 225,037 9%Consumer Financial Protection Bureau 84,127 4% 149,624 7% 217,009 8%Green Dot 17,334 1% 91,814 4% 96,142 4%State Law Enforcement Agencies 78,975 4% 87,993 4% 81,842 3% Ohio Attorney General 19,609 1% 18,032 1% 15,290 1%
Washington Attorney General 11,312 1% 11,789 1% 11,275 <1%
California Attorney General 4,194 <1% 11,239 1% 9,715 <1%
North Carolina Department of Justice 17,277 1% 16,360 1% 8,525 <1%
Massachusetts Attorney General - - 62 <1% 7,514 <1%
Maine Attorney General - - 4,815 <1% 6,755 <1%
Indiana Attorney General 4,612 <1% 5,081 <1% 4,670 <1%
Oregon Department of Justice 7,763 <1% 5,557 <1% 4,498 <1%
Michigan Attorney General 4,969 <1% 4,166 <1% 4,028 <1%
Tennessee Division of Consumer Affairs 2,331 <1% 3,077 <1% 2,504 <1%
Iowa Attorney General 309 <1% 2,339 <1% 1,832 <1%
Colorado Attorney General 975 <1% 829 <1% 1,237 <1%
South Carolina Department of Consumer Affairs 2,962 <1% 757 <1% 935 <1%
Idaho Attorney General 1,172 <1% 855 <1% 650 <1%
Hawaii Office of Consumer Protection 55 <1% 83 <1% 620 <1%
Montana Department of Justice 379 <1% 730 <1% 538 <1%
Mississippi Attorney General 652 <1% 515 <1% 452 <1%
Nevada Attorney General 60 <1% 264 <1% 423 <1%
Alaska Attorney General 344 <1% 295 <1% 257 <1%
Louisiana Attorney General - - 1,148 <1% 124 <1%
Publisher's Clearing House 50,468 2% 56,653 3% 72,733 3%
MoneyGram International4 \ Western Union Money Transfer 64,848 3% 65,935 3% 70,057 3%
MoneyGram International 20,192 1% 38,253 2% 41,017 2%
Western Union Money Transfer 44,656 2% 27,682 1% 29,040 1%
Others 64,974 3% 57,831 3% 58,940 2% U.S. Department of the Treasury, Internal Revenue Service 365 <1% 635 <1% 22,136 1%
Canadian Anti-Fraud Centre 21,505 1% 17,272 1% 11,385 <1%
National Fraud Information Center 5,825 <1% 6,798 <1% 9,413 <1%
Lawyers' Committee for Civil Rights 11,128 1% 10,930 1% 5,000 <1%
Identity Theft Assistance Center 20,448 1% 17,741 1% 4,885 <1%
Canada Competition Bureau 3,975 <1% 2,477 <1% 1,750 <1%
U.S. Department of Veterans Affairs - - - - 1,512 <1%
Los Angeles County Department of Consumer Affairs 815 <1% 726 <1% 926 <1%
Financial Fraud Enforcement Task Force 216 <1% 629 <1% 671 <1%
U.S. Department of Defense - - 16 <1% 313 <1%
Privacy Rights Clearinghouse 252 <1% 126 <1% 261 <1%
U.S. Department of Education 46 <1% 59 <1% 210 <1%
U.S. Senate Special Committee on Aging - - 107 <1% 191 <1%
Iowa Clinton County Sheriff's Office 3 <1% 40 <1% 154 <1%
U.S. Department of Health and Human Services - - 124 <1% 38 <1%
Other Data Contributors 396 <1% 151 <1% 95 <1%
Data Contributors
CY - 2012 CY - 2013 CY - 2014

Appendix A4: Consumer Sentinel NetworkBetter Business Bureau Data Contributors
January 1 – December 31, 2014
Federal Trade Commission Page 76 of 102 Released February 2015
Alabama, Birmingham Kentucky, Lexington Ohio, ToledoAlabama, Huntsville Kentucky, Louisville Ohio, YoungstownAlabama, Mobile Louisiana, Baton Rouge Oklahoma, Oklahoma CityAlberta, Calgary (Canada) Louisiana, Lafayette (Acadiana) Oklahoma, TulsaAlberta, Edmonton (Canada) Louisiana, Lake Charles Ontario, London (Canada)Arizona, Phoenix Louisiana, Monroe Ontario, Ottawa (Canada)Arizona, Tucson Louisiana, New Orleans Pennsylvania, PittsburghArkansas, Little Rock Louisiana, Shreveport Saskatchewan, Regina (Canada)British Columbia, Vancouver (Canada) Manitoba, Winnipeg (Canada) South Carolina, ColumbiaBritish Columbia, Victoria (Canada) Maryland, Baltimore South Carolina, GreenvilleCalifornia, Fresno Massachusetts, Boston South Carolina, Myrtle BeachCalifornia, Oakland Massachusetts, Worchester Tennessee, ChattanoogaCalifornia, Sacramento Michigan, Detroit (Eastern) Tennessee, KnoxvilleCalifornia, San Diego Michigan, Grand Rapids Tennessee, MemphisCalifornia, San Jose (Silicon Valley) Minnesota, Saint Paul Tennessee, NashvilleCalifornia, Santa Ana (Orange County) Mississippi, Jackson Texas, AbileneCalifornia, Santa Barbara (Tri-Counties) Missouri, Kansas City Texas, AmarilloColorado, Colorado Springs Missouri, Saint Louis Texas, AustinColorado, Denver Missouri, Springfield Texas, BeaumontColorado, Fort Collins Nebraska, Omaha Texas, Brazos Valley (Bryan)Connecticut, Wallingford Nevada, Las Vegas Texas, DallasDelaware, Wilmington Nevada, Reno Texas, El PasoDistrict of Columbia, Washington New Hampshire, Concord Texas, Fort WorthFlorida, Clearwater New Jersey, Trenton Texas, HoustonFlorida, Jacksonville (Northeast Florida) New Mexico, Albuquerque Texas, Lubbock (South Plains)Florida, Orlando New York, Buffalo Texas, San AngeloFlorida, Pensacola New York, New York City Texas, TylerFlorida, West Palm Beach North Carolina, Asheville Texas, Wichita FallsGeorgia, Atlanta, Athens and Northeast Georgia North Carolina, Charlotte Utah, Salt Lake CityGeorgia, Columbus North Carolina, Greensboro Virginia, NorfolkGeorgia, Macon North Carolina, Raleigh Virginia, RichmondHawaii, Honolulu North Carolina, Winston-Salem Virginia, RoanokeIdaho, Boise Nova Scotia, Halifax (Canada) Washington, DuPont Illinois, Chicago Ohio, Akron Washington, SpokaneIllinois, Peoria Ohio, Canton Wisconsin, MilwaukeeIndiana, Evansville Ohio, CincinnatiIndiana, Fort Wayne Ohio, ClevelandIndiana, Indianapolis Ohio, ColumbusIowa, Des Moines Ohio, Dayton

Appendix B1: Consumer Sentinel Network Complaint Category Descriptions
Federal Trade Commission Page 77 of 102 Released February 2015
1Advance Payments for Credit Services: The promise of a loan or credit card that requires you to pay a fee first; worthless credit card loss protection and insurance programs; the promise that accurate negative information can be removed from your credit file for a fee; services offering to recover government refunds or unclaimed funds; etc. (Fraud Category)
2Auto-Related Complaints: Misleading or deceptive claims regarding auto prices, financing, leasing or warranties; repair\maintenance issues with newly purchased used or new cars, including dissatisfaction with service provided by auto mechanics; price fixing and price gouging concerns against gas stations and oil companies; etc. (Other Category)
3
Banks and Lenders: Deceptive or predatory mortgage lending practices; problems with modification of mortgage terms; miscellaneous customer service and account issues with bank or credit union products, including payday loans, student loans, auto title loans, fees and overdraft charges; other finance company lending products, services and practices; etc. (Other Category)
4
Business and Job Opportunities: Complaints about franchise or business opportunities: promotion of distributing goods and services, provided by the promoter, with assistance in the form of locations, accounts or customers. Also, complaints about work-at-home plans: an offer a consumer may receive or seek out to work directly from home (e.g. stuffing envelopes or processing medical claims), as well as complaints about multi-level marketing schemes, employment agencies or job counseling, overseas work, inventions or idea promotions. (Fraud Category)
5Buyers' Clubs: Complaints involving free trials or discounts on products and services; a buyers’ club membership becomes a fraud when consumers are billed for "memberships" they did not agree to purchase. Frequently, consumers are offered a free trial offer and are automatically enrolled and charged fees once the free trial period is over. (Fraud Category)
6Charitable Solicitations: Misleading pitches for donations to benefit local service organizations; solicitations for bogus charity or relief organizations; etc. (Fraud Category)
7Computer Equipment and Software: Problems with computer software, hardware and computer equipment purchases; unwanted or unauthorized software installations and downloads; etc. (Other Category)
8Credit Bureaus, Information Furnishers and Report Users: Credit Reporting Agency (CRA) or furnisher provides inaccurate information or fails to reinvestigate disputed information; CRA provides inadequate phone help; difficulties ordering free annual credit reports; impermissible access to\inquiry on credit reports; etc. (Other Category)
9Credit Cards: Account or billing issues, including interest rate changes, late fees, credit disputes and overcharges; fraudulent credit card offers\phishing attempts; etc. (Other Category)
10Debt Collection: Debt collector calls repeatedly or continuously, falsely represents the amount or status of debt, fails to send written notice of debt, falsely threatens suit, uses profane language, fails to identify self as debt collector and\or violates other provisions of the Fair Debt Collection Practices Act. (Other Category)
11Education: Complaints about trade or vocational school services, including issues related to accreditation, billing and collection, or institutional advertising claims related to usefulness of the degree or job prospects after graduation. Also, complaints about traditional colleges and universities. (Other Category)
12
Foreign Money Offers and Counterfeit Check Scams: Letters or e-mails offering the "opportunity" to share in a percentage of millions of dollars that a self-proclaimed government official is trying to transfer illegally out of a foreign country in return for money, bank account numbers or other identifying information from the victim; fraudulent schemes involving foreign lotteries, mystery shoppers or Internet purchases\classified ads in which a counterfeit check overpayment is received along with a request to wire back the difference immediately after check deposit, leaving the victim responsible for the funds withdrawn; etc. (Fraud Category)
13Grants: Deceptive practices by businesses or individuals marketing either government grant opportunities or financial aid assistance services; problems with student loan processors, debt collectors collecting on defaulted student loans, diploma mills and other unaccredited educational institutions; etc. (Fraud Category)
14
Health Care: Fraudulent, misleading or deceptive claims for vision correction procedures; dietary supplements; weight loss products or services; impotency treatments; health spas and equipments; infertility services; sunscreens; HIV test kits; medical discount plans; as well as complaints about over-the-counter or prescription drugs; other medical products, supplies or treatments; etc. (Fraud Category)
15
Home Repair, Improvement and Products: Defective furniture or appliances; service or warranty-related issues; furniture or appliance delivery problems, including receiving wrong or incomplete products; problems with home repair services and contractors; issues with home protection devices or services; as well as complaints about general housing-related issues; etc. (Other Category)
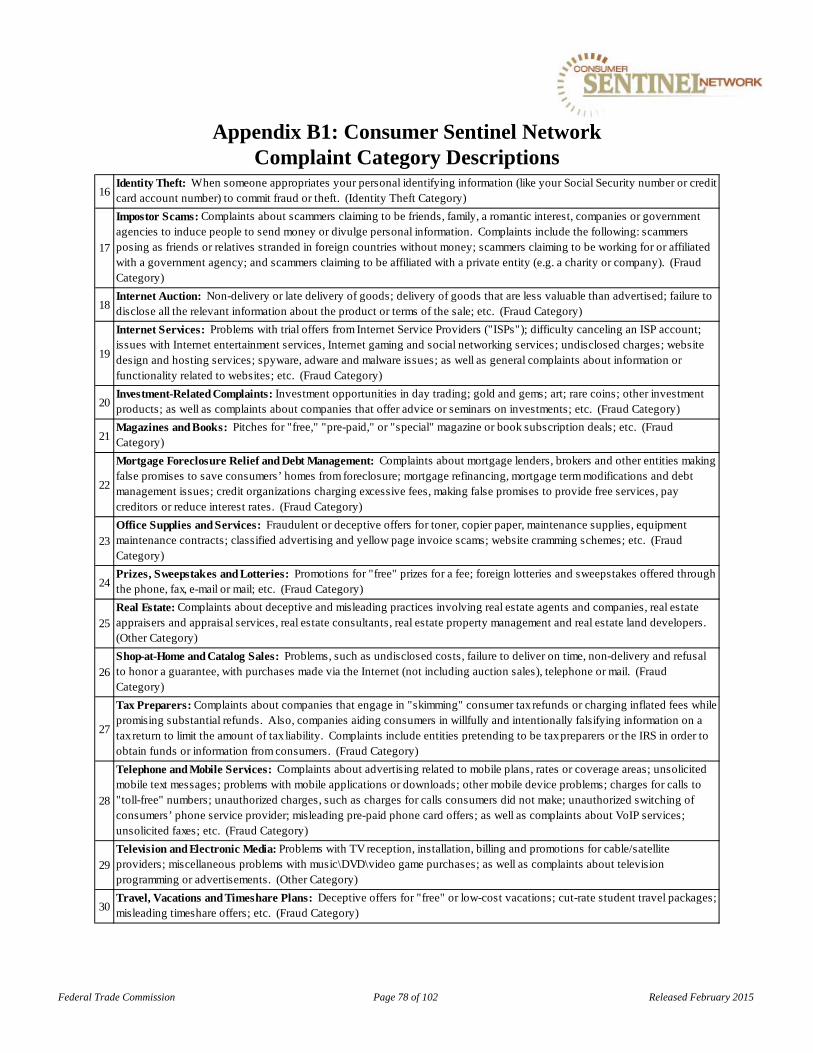
16Identity Theft: When someone appropriates your personal identifying information (like your Social Security number or credit card account number) to commit fraud or theft. (Identity Theft Category)
17
Impostor Scams: Complaints about scammers claiming to be friends, family, a romantic interest, companies or government agencies to induce people to send money or divulge personal information. Complaints include the following: scammers posing as friends or relatives stranded in foreign countries without money; scammers claiming to be working for or affiliated with a government agency; and scammers claiming to be affiliated with a private entity (e.g. a charity or company). (Fraud Category)
18Internet Auction: Non-delivery or late delivery of goods; delivery of goods that are less valuable than advertised; failure to disclose all the relevant information about the product or terms of the sale; etc. (Fraud Category)
19
Internet Services: Problems with trial offers from Internet Service Providers ("ISPs"); difficulty canceling an ISP account; issues with Internet entertainment services, Internet gaming and social networking services; undisclosed charges; website design and hosting services; spyware, adware and malware issues; as well as general complaints about information or functionality related to websites; etc. (Fraud Category)
20Investment-Related Complaints: Investment opportunities in day trading; gold and gems; art; rare coins; other investment products; as well as complaints about companies that offer advice or seminars on investments; etc. (Fraud Category)
21Magazines and Books: Pitches for "free," "pre-paid," or "special" magazine or book subscription deals; etc. (Fraud Category)
22
Mortgage Foreclosure Relief and Debt Management: Complaints about mortgage lenders, brokers and other entities making false promises to save consumers’ homes from foreclosure; mortgage refinancing, mortgage term modifications and debt management issues; credit organizations charging excessive fees, making false promises to provide free services, pay creditors or reduce interest rates. (Fraud Category)
23Office Supplies and Services: Fraudulent or deceptive offers for toner, copier paper, maintenance supplies, equipment maintenance contracts; classified advertising and yellow page invoice scams; website cramming schemes; etc. (Fraud Category)
24Prizes, Sweepstakes and Lotteries: Promotions for "free" prizes for a fee; foreign lotteries and sweepstakes offered through the phone, fax, e-mail or mail; etc. (Fraud Category)
25Real Estate: Complaints about deceptive and misleading practices involving real estate agents and companies, real estate appraisers and appraisal services, real estate consultants, real estate property management and real estate land developers. (Other Category)
26Shop-at-Home and Catalog Sales: Problems, such as undisclosed costs, failure to deliver on time, non-delivery and refusal to honor a guarantee, with purchases made via the Internet (not including auction sales), telephone or mail. (Fraud Category)
27
Tax Preparers: Complaints about companies that engage in "skimming" consumer tax refunds or charging inflated fees while promising substantial refunds. Also, companies aiding consumers in willfully and intentionally falsifying information on a tax return to limit the amount of tax liability. Complaints include entities pretending to be tax preparers or the IRS in order to obtain funds or information from consumers. (Fraud Category)
28
Telephone and Mobile Services: Complaints about advertising related to mobile plans, rates or coverage areas; unsolicited mobile text messages; problems with mobile applications or downloads; other mobile device problems; charges for calls to "toll-free" numbers; unauthorized charges, such as charges for calls consumers did not make; unauthorized switching of consumers’ phone service provider; misleading pre-paid phone card offers; as well as complaints about VoIP services; unsolicited faxes; etc. (Fraud Category)
29Television and Electronic Media: Problems with TV reception, installation, billing and promotions for cable/satellite providers; miscellaneous problems with music\DVD\video game purchases; as well as complaints about television programming or advertisements. (Other Category)
30Travel, Vacations and Timeshare Plans: Deceptive offers for "free" or low-cost vacations; cut-rate student travel packages; misleading timeshare offers; etc. (Fraud Category)
Federal Trade Commission Page 78 of 102 Released February 2015
Appendix B1: Consumer Sentinel Network Complaint Category Descriptions
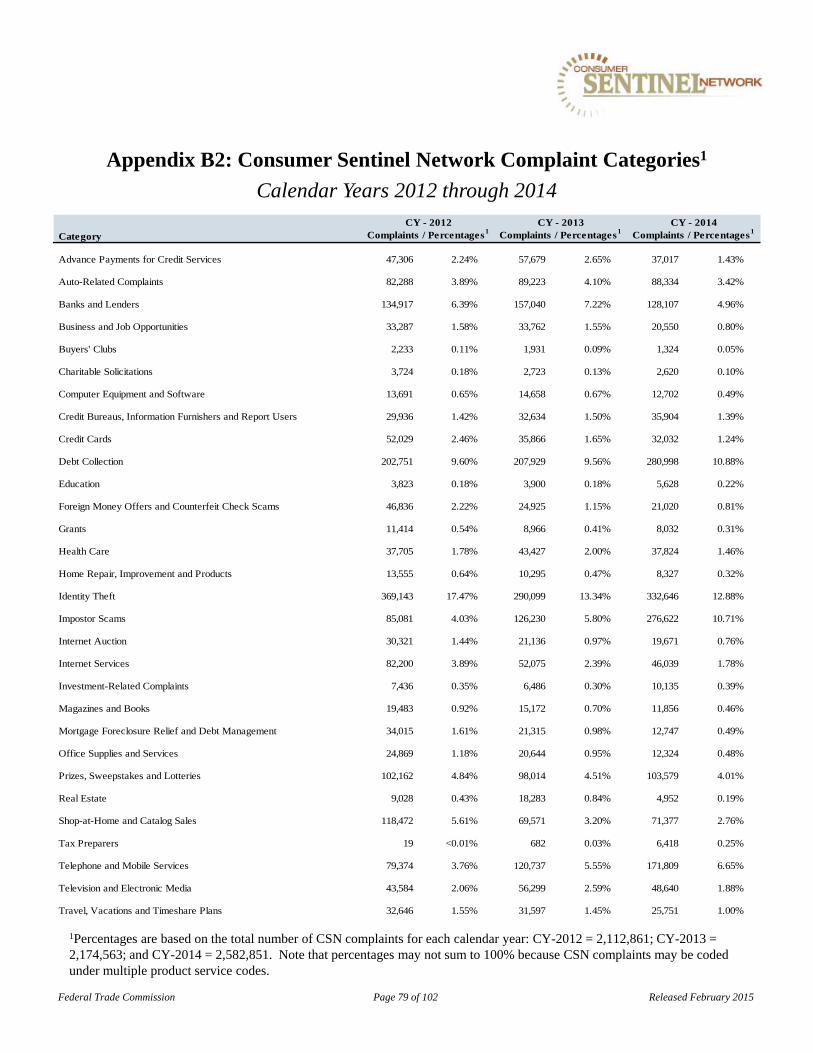
Appendix B2: Consumer Sentinel Network Complaint Categories1
Calendar Years 2012 through 2014
1Percentages are based on the total number of CSN complaints for each calendar year: CY-2012 = 2,112,861; CY-2013 = 2,174,563; and CY-2014 = 2,582,851. Note that percentages may not sum to 100% because CSN complaints may be coded under multiple product service codes.
Federal Trade Commission Page 79 of 102 Released February 2015
Advance Payments for Credit Services 47,306 2.24% 57,679 2.65% 37,017 1.43%
Auto-Related Complaints 82,288 3.89% 89,223 4.10% 88,334 3.42%
Banks and Lenders 134,917 6.39% 157,040 7.22% 128,107 4.96%
Business and Job Opportunities 33,287 1.58% 33,762 1.55% 20,550 0.80%
Buyers' Clubs 2,233 0.11% 1,931 0.09% 1,324 0.05%
Charitable Solicitations 3,724 0.18% 2,723 0.13% 2,620 0.10%
Computer Equipment and Software 13,691 0.65% 14,658 0.67% 12,702 0.49%
Credit Bureaus, Information Furnishers and Report Users 29,936 1.42% 32,634 1.50% 35,904 1.39%
Credit Cards 52,029 2.46% 35,866 1.65% 32,032 1.24%
Debt Collection 202,751 9.60% 207,929 9.56% 280,998 10.88%
Education 3,823 0.18% 3,900 0.18% 5,628 0.22%
Foreign Money Offers and Counterfeit Check Scams 46,836 2.22% 24,925 1.15% 21,020 0.81%
Grants 11,414 0.54% 8,966 0.41% 8,032 0.31%
Health Care 37,705 1.78% 43,427 2.00% 37,824 1.46%
Home Repair, Improvement and Products 13,555 0.64% 10,295 0.47% 8,327 0.32%
Identity Theft 369,143 17.47% 290,099 13.34% 332,646 12.88%
Impostor Scams 85,081 4.03% 126,230 5.80% 276,622 10.71%
Internet Auction 30,321 1.44% 21,136 0.97% 19,671 0.76%
Internet Services 82,200 3.89% 52,075 2.39% 46,039 1.78%
Investment-Related Complaints 7,436 0.35% 6,486 0.30% 10,135 0.39%
Magazines and Books 19,483 0.92% 15,172 0.70% 11,856 0.46%
Mortgage Foreclosure Relief and Debt Management 34,015 1.61% 21,315 0.98% 12,747 0.49%
Office Supplies and Services 24,869 1.18% 20,644 0.95% 12,324 0.48%
Prizes, Sweepstakes and Lotteries 102,162 4.84% 98,014 4.51% 103,579 4.01%
Real Estate 9,028 0.43% 18,283 0.84% 4,952 0.19%
Shop-at-Home and Catalog Sales 118,472 5.61% 69,571 3.20% 71,377 2.76%
Tax Preparers 19 <0.01% 682 0.03% 6,418 0.25%
Telephone and Mobile Services 79,374 3.76% 120,737 5.55% 171,809 6.65%
Television and Electronic Media 43,584 2.06% 56,299 2.59% 48,640 1.88%
Travel, Vacations and Timeshare Plans 32,646 1.55% 31,597 1.45% 25,751 1.00%
Category
CY - 2012 CY - 2013 CY - 2014Complaints / Percentages1 Complaints / Percentages1 Complaints / Percentages1
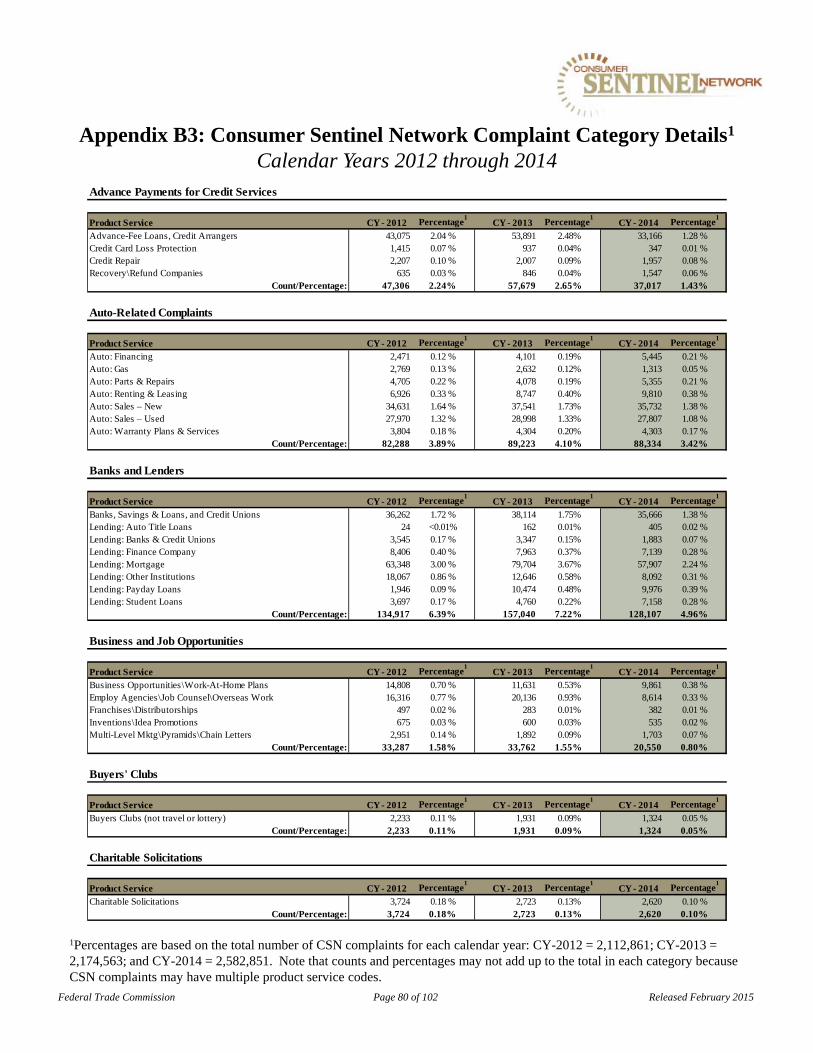
Appendix B3: Consumer Sentinel Network Complaint Category Details1
Calendar Years 2012 through 2014
Federal Trade Commission Page 80 of 102 Released February 2015
1Percentages are based on the total number of CSN complaints for each calendar year: CY-2012 = 2,112,861; CY-2013 = 2,174,563; and CY-2014 = 2,582,851. Note that counts and percentages may not add up to the total in each category because CSN complaints may have multiple product service codes.
Advance Payments for Credit Services
Product Service CY - 2012 Percentage1
CY - 2013 Percentage1
CY - 2014 Percentage1
Advance-Fee Loans, Credit Arrangers 43,075 2.04 % 53,891 2.48% 33,166 1.28 %Credit Card Loss Protection 1,415 0.07 % 937 0.04% 347 0.01 %Credit Repair 2,207 0.10 % 2,007 0.09% 1,957 0.08 %Recovery\Refund Companies 635 0.03 % 846 0.04% 1,547 0.06 %
Count/Percentage: 47,306 2.24% 57,679 2.65% 37,017 1.43%
Auto-Related Complaints
Product Service CY - 2012 Percentage1
CY - 2013 Percentage1
CY - 2014 Percentage1
Auto: Financing 2,471 0.12 % 4,101 0.19% 5,445 0.21 %Auto: Gas 2,769 0.13 % 2,632 0.12% 1,313 0.05 %Auto: Parts & Repairs 4,705 0.22 % 4,078 0.19% 5,355 0.21 %Auto: Renting & Leasing 6,926 0.33 % 8,747 0.40% 9,810 0.38 %Auto: Sales – New 34,631 1.64 % 37,541 1.73% 35,732 1.38 %Auto: Sales – Used 27,970 1.32 % 28,998 1.33% 27,807 1.08 %Auto: Warranty Plans & Services 3,804 0.18 % 4,304 0.20% 4,303 0.17 %
Count/Percentage: 82,288 3.89% 89,223 4.10% 88,334 3.42%
Banks and Lenders
Product Service CY - 2012 Percentage1
CY - 2013 Percentage1
CY - 2014 Percentage1
Banks, Savings & Loans, and Credit Unions 36,262 1.72 % 38,114 1.75% 35,666 1.38 %Lending: Auto Title Loans 24 <0.01% 162 0.01% 405 0.02 %Lending: Banks & Credit Unions 3,545 0.17 % 3,347 0.15% 1,883 0.07 %Lending: Finance Company 8,406 0.40 % 7,963 0.37% 7,139 0.28 %Lending: Mortgage 63,348 3.00 % 79,704 3.67% 57,907 2.24 %Lending: Other Institutions 18,067 0.86 % 12,646 0.58% 8,092 0.31 %Lending: Payday Loans 1,946 0.09 % 10,474 0.48% 9,976 0.39 %Lending: Student Loans 3,697 0.17 % 4,760 0.22% 7,158 0.28 %
Count/Percentage: 134,917 6.39% 157,040 7.22% 128,107 4.96%
Business and Job Opportunities
Product Service CY - 2012 Percentage1
CY - 2013 Percentage1
CY - 2014 Percentage1
Business Opportunities\Work-At-Home Plans 14,808 0.70 % 11,631 0.53% 9,861 0.38 %Employ Agencies\Job Counsel\Overseas Work 16,316 0.77 % 20,136 0.93% 8,614 0.33 %Franchises\Distributorships 497 0.02 % 283 0.01% 382 0.01 %Inventions\Idea Promotions 675 0.03 % 600 0.03% 535 0.02 %Multi-Level Mktg\Pyramids\Chain Letters 2,951 0.14 % 1,892 0.09% 1,703 0.07 %
Count/Percentage: 33,287 1.58% 33,762 1.55% 20,550 0.80%
Buyers' Clubs
Product Service CY - 2012 Percentage1
CY - 2013 Percentage1
CY - 2014 Percentage1
Buyers Clubs (not travel or lottery) 2,233 0.11 % 1,931 0.09% 1,324 0.05 %Count/Percentage: 2,233 0.11% 1,931 0.09% 1,324 0.05%
Charitable Solicitations
Product Service CY - 2012 Percentage1
CY - 2013 Percentage1
CY - 2014 Percentage1
Charitable Solicitations 3,724 0.18 % 2,723 0.13% 2,620 0.10 %Count/Percentage: 3,724 0.18% 2,723 0.13% 2,620 0.10%
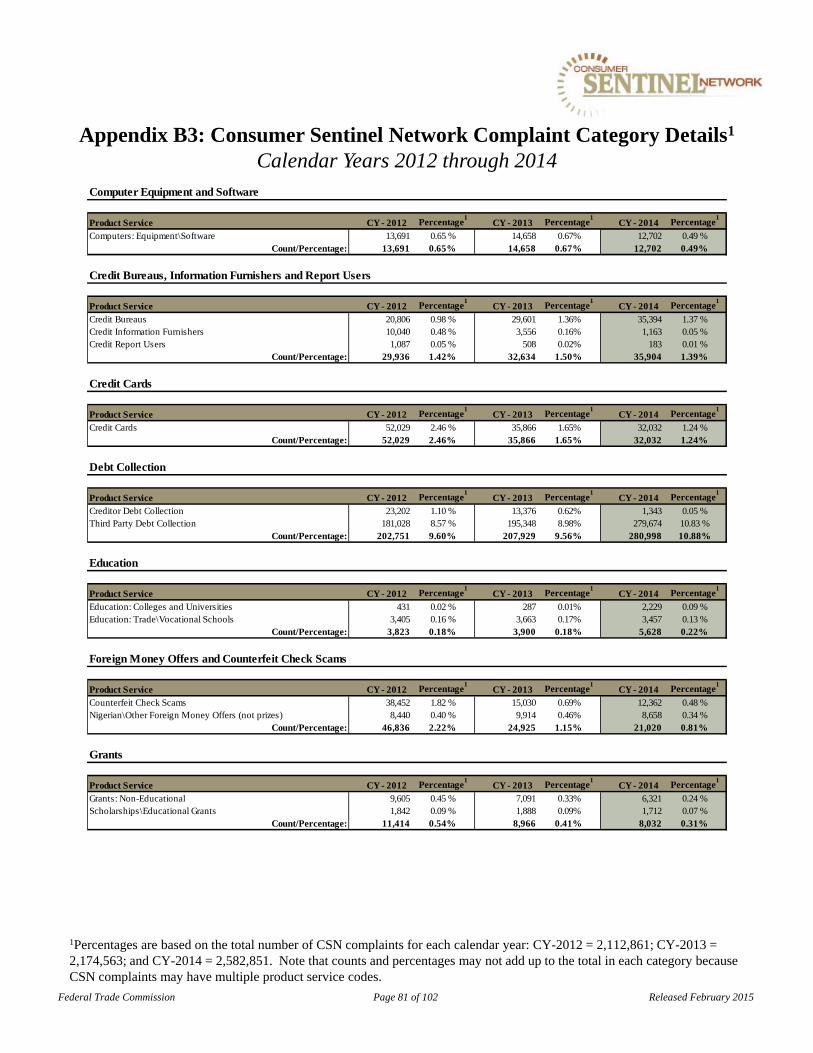
1Percentages are based on the total number of CSN complaints for each calendar year: CY-2012 = 2,112,861; CY-2013 = 2,174,563; and CY-2014 = 2,582,851. Note that counts and percentages may not add up to the total in each category because CSN complaints may have multiple product service codes.
Appendix B3: Consumer Sentinel Network Complaint Category Details1
Calendar Years 2012 through 2014
Federal Trade Commission Page 81 of 102 Released February 2015
Computer Equipment and Software
Product Service CY - 2012 Percentage1
CY - 2013 Percentage1
CY - 2014 Percentage1
Computers: Equipment\Software 13,691 0.65 % 14,658 0.67% 12,702 0.49 %Count/Percentage: 13,691 0.65% 14,658 0.67% 12,702 0.49%
Credit Bureaus, Information Furnishers and Report Users
Product Service CY - 2012 Percentage1
CY - 2013 Percentage1
CY - 2014 Percentage1
Credit Bureaus 20,806 0.98 % 29,601 1.36% 35,394 1.37 %Credit Information Furnishers 10,040 0.48 % 3,556 0.16% 1,163 0.05 %Credit Report Users 1,087 0.05 % 508 0.02% 183 0.01 %
Count/Percentage: 29,936 1.42% 32,634 1.50% 35,904 1.39%
Credit Cards
Product Service CY - 2012 Percentage1
CY - 2013 Percentage1
CY - 2014 Percentage1
Credit Cards 52,029 2.46 % 35,866 1.65% 32,032 1.24 %Count/Percentage: 52,029 2.46% 35,866 1.65% 32,032 1.24%
Debt Collection
Product Service CY - 2012 Percentage1
CY - 2013 Percentage1
CY - 2014 Percentage1
Creditor Debt Collection 23,202 1.10 % 13,376 0.62% 1,343 0.05 %Third Party Debt Collection 181,028 8.57 % 195,348 8.98% 279,674 10.83 %
Count/Percentage: 202,751 9.60% 207,929 9.56% 280,998 10.88%
Education
Product Service CY - 2012 Percentage1
CY - 2013 Percentage1
CY - 2014 Percentage1
Education: Colleges and Universities 431 0.02 % 287 0.01% 2,229 0.09 %Education: Trade\Vocational Schools 3,405 0.16 % 3,663 0.17% 3,457 0.13 %
Count/Percentage: 3,823 0.18% 3,900 0.18% 5,628 0.22%
Foreign Money Offers and Counterfeit Check Scams
Product Service CY - 2012 Percentage1
CY - 2013 Percentage1
CY - 2014 Percentage1
Counterfeit Check Scams 38,452 1.82 % 15,030 0.69% 12,362 0.48 %Nigerian\Other Foreign Money Offers (not prizes) 8,440 0.40 % 9,914 0.46% 8,658 0.34 %
Count/Percentage: 46,836 2.22% 24,925 1.15% 21,020 0.81%
Grants
Product Service CY - 2012 Percentage1
CY - 2013 Percentage1
CY - 2014 Percentage1
Grants: Non-Educational 9,605 0.45 % 7,091 0.33% 6,321 0.24 %Scholarships\Educational Grants 1,842 0.09 % 1,888 0.09% 1,712 0.07 %
Count/Percentage: 11,414 0.54% 8,966 0.41% 8,032 0.31%

Federal Trade Commission Page 82 of 102 Released February 2015
Health Care
Product Service CY - 2012 Percentage1
CY - 2013 Percentage1
CY - 2014 Percentage1
Health Care: Diet Products\Centers\Plans 17,488 0.83 % 20,565 0.95% 18,523 0.72 %Health Care: Dietary Supplements\Herbal Remedies 2,781 0.13 % 2,928 0.13% 3,320 0.13 %Health Care: Drugs-OTC\Prescription 1,204 0.06 % 1,162 0.05% 915 0.04 %Health Care: Eye Care 3,344 0.16 % 3,362 0.15% 2,921 0.11 %Health Care: Medical Discount Plans\Cards\Insurance 3,216 0.15 % 3,749 0.17% 3,092 0.12 %Health Care: Other Medical Treatments 2,660 0.13 % 2,812 0.13% 2,370 0.09 %Health Care: Other Products\Supplies 7,066 0.33 % 8,917 0.41% 6,735 0.26 %
Count/Percentage: 37,705 1.78% 43,427 2.00% 37,824 1.46%
Home Repair, Improvement and Products
Product Service CY - 2012 Percentage1
CY - 2013 Percentage1
CY - 2014 Percentage1
Home Appliances 1,740 0.08 % 1,779 0.08% 1,681 0.07 %Home Furnishings 1,881 0.09 % 1,570 0.07% 1,001 0.04 %Home Protection Devices 2,273 0.11 % 1,324 0.06% 823 0.03 %Home Repair 2,437 0.12 % 2,321 0.11% 1,856 0.07 %Housing 5,261 0.25% 3,338 0.15% 2,997 0.12%
Count/Percentage: 13,555 0.64% 10,295 0.47% 8,327 0.32%
Identity Theft
Product Service CY - 2012 Percentage1
CY - 2013 Percentage1
CY - 2014 Percentage1
Identity Theft 369,143 17.47 % 290,099 13.34% 332,646 12.88 %Count/Percentage: 369,143 17.47 % 290,099 13.34% 332,646 12.88 %
Impostor Scams
Product Service CY - 2012 Percentage1
CY - 2013 Percentage1
CY - 2014 Percentage1
Impostor: Business 18,968 0.90 % 39,809 1.83% 98,620 3.82 %Impostor: Family\Friend 11,793 0.56 % 12,400 0.57% 14,521 0.56 %Impostor: Government 44,150 2.09 % 64,789 2.98% 159,026 6.16 %Romance Scams 10,520 0.50 % 9,833 0.45% 5,240 0.20 %
Count/Percentage: 85,081 4.03% 126,230 5.80% 276,622 10.71%
Internet Auction
Product Service CY - 2012 Percentage1
CY - 2013 Percentage1
CY - 2014 Percentage1
Internet Auction 30,321 1.44 % 21,136 0.97% 19,671 0.76 %Count/Percentage: 30,321 1.44% 21,136 0.97% 19,671 0.76%
Internet Services
Product Service CY - 2012 Percentage1
CY - 2013 Percentage1
CY - 2014 Percentage1
Internet Access Services 8,493 0.40 % 7,261 0.33% 6,910 0.27 %Internet Gaming 2,643 0.13 % 3,136 0.14% 2,809 0.11 %Internet Information Services 37,503 1.77 % 31,289 1.44% 26,028 1.01 %Internet Web Site Design\Promotion 4,228 0.20 % 4,429 0.20% 3,610 0.14 %Social Networking Service 5,218 0.25 % 1,693 0.08% 1,271 0.05 %Spyware\Adware\Malware 24,240 1.15 % 4,392 0.20% 5,444 0.21 %
Count/Percentage: 82,200 3.89% 52,075 2.39% 46,039 1.78%
1Percentages are based on the total number of CSN complaints for each calendar year: CY-2012 = 2,112,861; CY-2013 = 2,174,563; and CY-2014 = 2,582,851. Note that counts and percentages may not add up to the total in each category because CSN complaints may have multiple product service codes.
Appendix B3: Consumer Sentinel Network Complaint Category Details1
Calendar Years 2012 through 2014
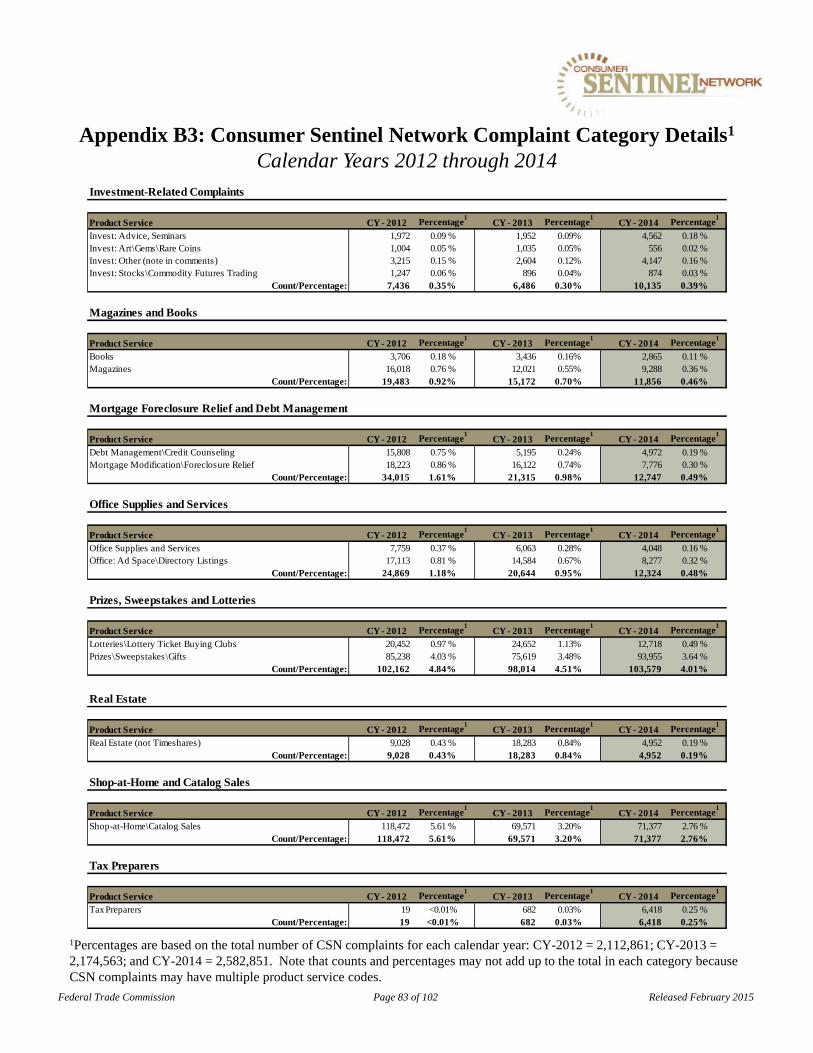
Federal Trade Commission Page 83 of 102 Released February 2015
Investment-Related Complaints
Product Service CY - 2012 Percentage1
CY - 2013 Percentage1
CY - 2014 Percentage1
Invest: Advice, Seminars 1,972 0.09 % 1,952 0.09% 4,562 0.18 %Invest: Art\Gems\Rare Coins 1,004 0.05 % 1,035 0.05% 556 0.02 %Invest: Other (note in comments) 3,215 0.15 % 2,604 0.12% 4,147 0.16 %Invest: Stocks\Commodity Futures Trading 1,247 0.06 % 896 0.04% 874 0.03 %
Count/Percentage: 7,436 0.35% 6,486 0.30% 10,135 0.39%
Magazines and Books
Product Service CY - 2012 Percentage1
CY - 2013 Percentage1
CY - 2014 Percentage1
Books 3,706 0.18 % 3,436 0.16% 2,865 0.11 %Magazines 16,018 0.76 % 12,021 0.55% 9,288 0.36 %
Count/Percentage: 19,483 0.92% 15,172 0.70% 11,856 0.46%
Mortgage Foreclosure Relief and Debt Management
Product Service CY - 2012 Percentage1
CY - 2013 Percentage1
CY - 2014 Percentage1
Debt Management\Credit Counseling 15,808 0.75 % 5,195 0.24% 4,972 0.19 %Mortgage Modification\Foreclosure Relief 18,223 0.86 % 16,122 0.74% 7,776 0.30 %
Count/Percentage: 34,015 1.61% 21,315 0.98% 12,747 0.49%
Office Supplies and Services
Product Service CY - 2012 Percentage1
CY - 2013 Percentage1
CY - 2014 Percentage1
Office Supplies and Services 7,759 0.37 % 6,063 0.28% 4,048 0.16 %Office: Ad Space\Directory Listings 17,113 0.81 % 14,584 0.67% 8,277 0.32 %
Count/Percentage: 24,869 1.18% 20,644 0.95% 12,324 0.48%
Prizes, Sweepstakes and Lotteries
Product Service CY - 2012 Percentage1
CY - 2013 Percentage1
CY - 2014 Percentage1
Lotteries\Lottery Ticket Buying Clubs 20,452 0.97 % 24,652 1.13% 12,718 0.49 %Prizes\Sweepstakes\Gifts 85,238 4.03 % 75,619 3.48% 93,955 3.64 %
Count/Percentage: 102,162 4.84% 98,014 4.51% 103,579 4.01%
Real Estate
Product Service CY - 2012 Percentage1
CY - 2013 Percentage1
CY - 2014 Percentage1
Real Estate (not Timeshares) 9,028 0.43 % 18,283 0.84% 4,952 0.19 %Count/Percentage: 9,028 0.43% 18,283 0.84% 4,952 0.19%
Shop-at-Home and Catalog Sales
Product Service CY - 2012 Percentage1
CY - 2013 Percentage1
CY - 2014 Percentage1
Shop-at-Home\Catalog Sales 118,472 5.61 % 69,571 3.20% 71,377 2.76 %Count/Percentage: 118,472 5.61% 69,571 3.20% 71,377 2.76%
Tax Preparers
Product Service CY - 2012 Percentage1
CY - 2013 Percentage1
CY - 2014 Percentage1
Tax Preparers 19 <0.01% 682 0.03% 6,418 0.25 %Count/Percentage: 19 <0.01% 682 0.03% 6,418 0.25%
1Percentages are based on the total number of CSN complaints for each calendar year: CY-2012 = 2,112,861; CY-2013 = 2,174,563; and CY-2014 = 2,582,851. Note that counts and percentages may not add up to the total in each category because CSN complaints may have multiple product service codes.
Appendix B3: Consumer Sentinel Network Complaint Category Details1
Calendar Years 2012 through 2014
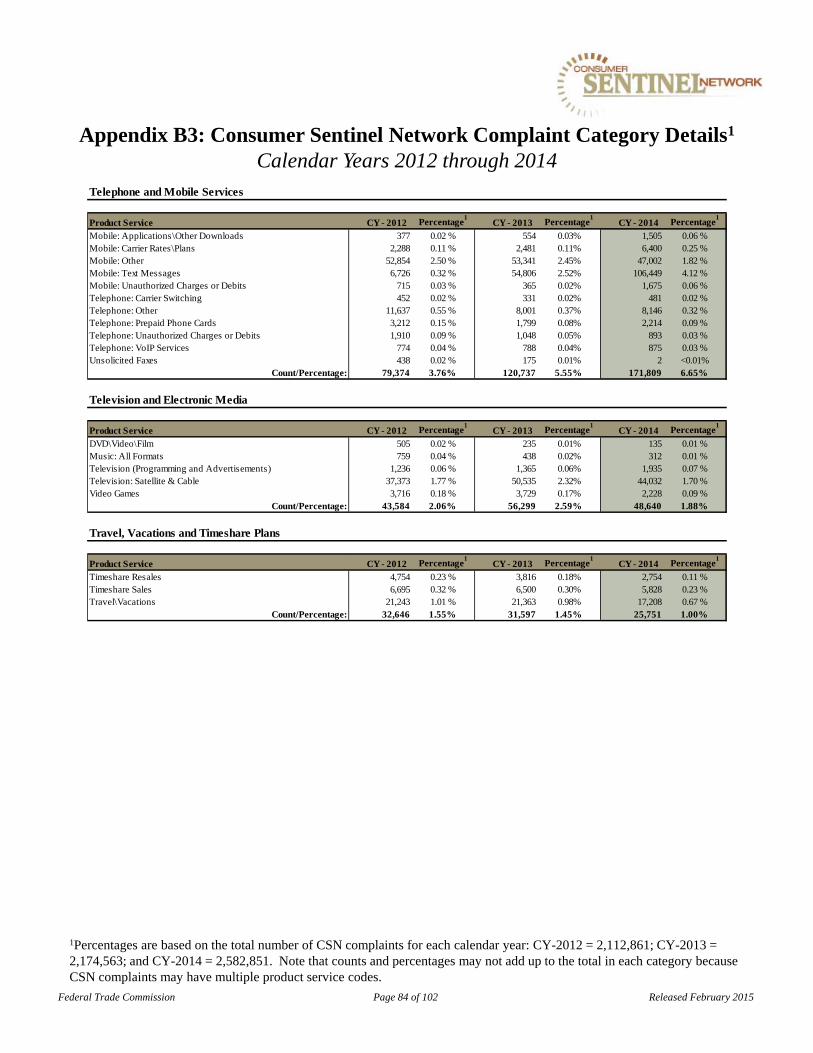
Federal Trade Commission Page 84 of 102 Released February 2015
Telephone and Mobile Services
Product Service CY - 2012 Percentage1
CY - 2013 Percentage1
CY - 2014 Percentage1
Mobile: Applications\Other Downloads 377 0.02 % 554 0.03% 1,505 0.06 %Mobile: Carrier Rates\Plans 2,288 0.11 % 2,481 0.11% 6,400 0.25 %Mobile: Other 52,854 2.50 % 53,341 2.45% 47,002 1.82 %Mobile: Text Messages 6,726 0.32 % 54,806 2.52% 106,449 4.12 %Mobile: Unauthorized Charges or Debits 715 0.03 % 365 0.02% 1,675 0.06 %Telephone: Carrier Switching 452 0.02 % 331 0.02% 481 0.02 %Telephone: Other 11,637 0.55 % 8,001 0.37% 8,146 0.32 %Telephone: Prepaid Phone Cards 3,212 0.15 % 1,799 0.08% 2,214 0.09 %Telephone: Unauthorized Charges or Debits 1,910 0.09 % 1,048 0.05% 893 0.03 %Telephone: VoIP Services 774 0.04 % 788 0.04% 875 0.03 %Unsolicited Faxes 438 0.02 % 175 0.01% 2 <0.01%
Count/Percentage: 79,374 3.76% 120,737 5.55% 171,809 6.65%
Television and Electronic Media
Product Service CY - 2012 Percentage1
CY - 2013 Percentage1
CY - 2014 Percentage1
DVD\Video\Film 505 0.02 % 235 0.01% 135 0.01 %Music: All Formats 759 0.04 % 438 0.02% 312 0.01 %Television (Programming and Advertisements) 1,236 0.06 % 1,365 0.06% 1,935 0.07 %Television: Satellite & Cable 37,373 1.77 % 50,535 2.32% 44,032 1.70 %Video Games 3,716 0.18 % 3,729 0.17% 2,228 0.09 %
Count/Percentage: 43,584 2.06% 56,299 2.59% 48,640 1.88%
Travel, Vacations and Timeshare Plans
Product Service CY - 2012 Percentage1
CY - 2013 Percentage1
CY - 2014 Percentage1
Timeshare Resales 4,754 0.23 % 3,816 0.18% 2,754 0.11 %Timeshare Sales 6,695 0.32 % 6,500 0.30% 5,828 0.23 %Travel\Vacations 21,243 1.01 % 21,363 0.98% 17,208 0.67 %
Count/Percentage: 32,646 1.55% 31,597 1.45% 25,751 1.00%
1Percentages are based on the total number of CSN complaints for each calendar year: CY-2012 = 2,112,861; CY-2013 = 2,174,563; and CY-2014 = 2,582,851. Note that counts and percentages may not add up to the total in each category because CSN complaints may have multiple product service codes.
Appendix B3: Consumer Sentinel Network Complaint Category Details1
Calendar Years 2012 through 2014
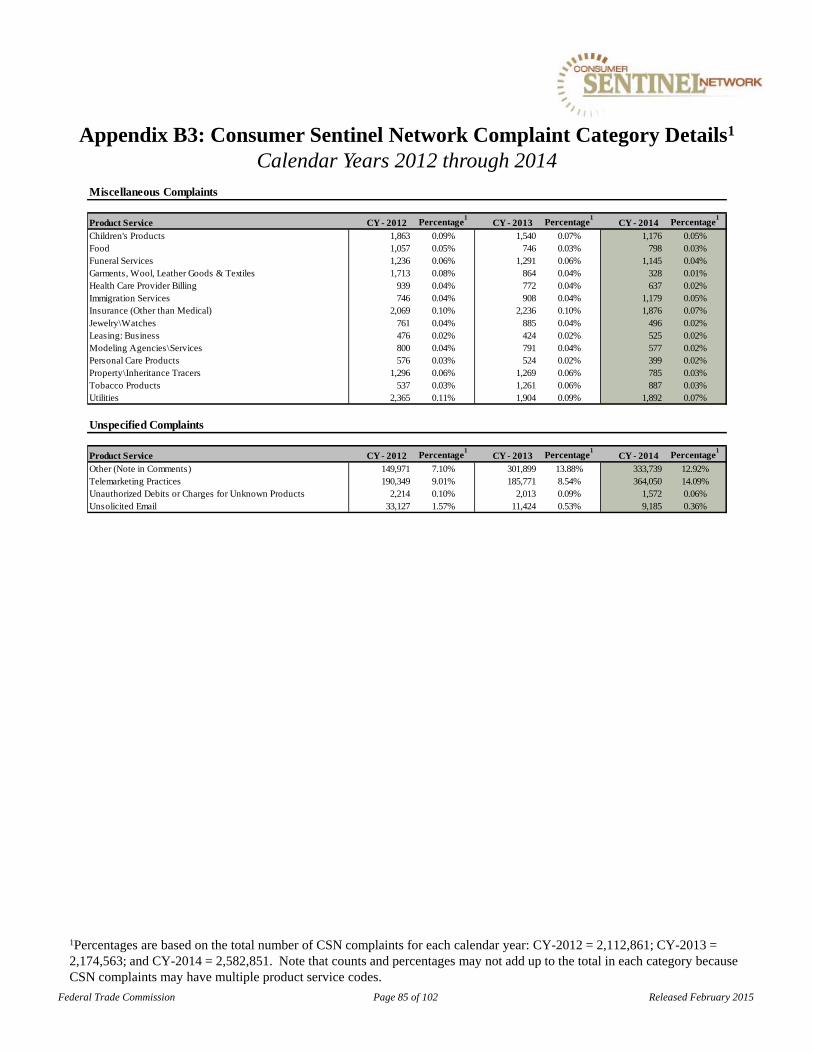
Federal Trade Commission Page 85 of 102 Released February 2015
Miscellaneous Complaints
Product Service CY - 2012 Percentage1
CY - 2013 Percentage1
CY - 2014 Percentage1
Children's Products 1,863 0.09% 1,540 0.07% 1,176 0.05%Food 1,057 0.05% 746 0.03% 798 0.03%Funeral Services 1,236 0.06% 1,291 0.06% 1,145 0.04%Garments, Wool, Leather Goods & Textiles 1,713 0.08% 864 0.04% 328 0.01%Health Care Provider Billing 939 0.04% 772 0.04% 637 0.02%Immigration Services 746 0.04% 908 0.04% 1,179 0.05%Insurance (Other than Medical) 2,069 0.10% 2,236 0.10% 1,876 0.07%Jewelry\Watches 761 0.04% 885 0.04% 496 0.02%Leasing: Business 476 0.02% 424 0.02% 525 0.02%Modeling Agencies\Services 800 0.04% 791 0.04% 577 0.02%Personal Care Products 576 0.03% 524 0.02% 399 0.02%Property\Inheritance Tracers 1,296 0.06% 1,269 0.06% 785 0.03%Tobacco Products 537 0.03% 1,261 0.06% 887 0.03%Utilities 2,365 0.11% 1,904 0.09% 1,892 0.07%
Unspecified Complaints
Product Service CY - 2012 Percentage1
CY - 2013 Percentage1
CY - 2014 Percentage1
Other (Note in Comments) 149,971 7.10% 301,899 13.88% 333,739 12.92%Telemarketing Practices 190,349 9.01% 185,771 8.54% 364,050 14.09%Unauthorized Debits or Charges for Unknown Products 2,214 0.10% 2,013 0.09% 1,572 0.06%Unsolicited Email 33,127 1.57% 11,424 0.53% 9,185 0.36%
1Percentages are based on the total number of CSN complaints for each calendar year: CY-2012 = 2,112,861; CY-2013 = 2,174,563; and CY-2014 = 2,582,851. Note that counts and percentages may not add up to the total in each category because CSN complaints may have multiple product service codes.
Appendix B3: Consumer Sentinel Network Complaint Category Details1
Calendar Years 2012 through 2014

1Average amount paid is based on the total number of fraud complaints where amount paid was reported by consumers from the respective states. The amount paid is based on complaints reporting values from $0 to $999,999.
Appendix C: Consumer Sentinel Network Fraud Complaints & Amount Paid Reported by State and the District of Columbia
January 1 – December 31, 2014
Federal Trade Commission Page 86 of 102 Released February 2015
Note: This appendix excludes 20 state-specific data contributors (the Hawaii Office of Consumer Protection, the Montana, North Carolina and Oregon Departments of Justice, the South Carolina Department of Consumer Affairs, the Tennessee Division of Consumer Affairs, and the Offices of the Attorneys General for Alaska, California, Colorado, Idaho, Indiana, Iowa, Louisiana, Maine, Massachusetts, Michigan, Mississippi, Nevada, Ohio and Washington).
State NameTotal Fraud Complaints
Total Amount Paid Reported
Complaints Reporting
Amount Paid
Percentages Reporting
Amount Paid
AverageAmount
Paid1
Alabama 19,712 $16,968,820 9,484 48% $1,789Alaska 2,259 $3,264,604 1,559 69% $2,094Arizona 25,585 $42,793,737 16,581 65% $2,581Arkansas 10,079 $8,742,319 5,249 52% $1,666California 171,379 $231,436,645 80,078 47% $2,890Colorado 22,069 $28,778,300 14,261 65% $2,018Connecticut 12,219 $16,750,510 7,198 59% $2,327Delaware 4,663 $6,620,510 2,751 59% $2,407District of Columbia 4,049 $2,199,777 2,193 54% $1,003Florida 128,655 $100,685,450 47,848 37% $2,104Georgia 49,514 $31,789,521 18,163 37% $1,750Hawaii 4,199 $7,689,717 2,855 68% $2,693Idaho 5,095 $6,890,010 3,129 61% $2,202Illinois 39,663 $50,275,543 23,695 60% $2,122Indiana 21,094 $19,672,705 12,559 60% $1,566Iowa 8,043 $7,865,362 4,405 55% $1,786Kansas 8,691 $9,100,806 5,221 60% $1,743Kentucky 13,499 $10,796,611 7,504 56% $1,439Louisiana 17,102 $18,705,438 8,595 50% $2,176Maine 4,061 $2,545,105 2,303 57% $1,105Maryland 25,991 $21,003,793 15,783 61% $1,331Massachusetts 26,761 $22,311,575 14,568 54% $1,532Michigan 50,191 $24,408,253 17,216 34% $1,418Minnesota 15,913 $24,113,575 10,314 65% $2,338Mississippi 9,475 $6,574,076 5,071 54% $1,296Missouri 19,962 $17,398,063 10,961 55% $1,587Montana 3,343 $2,422,959 2,002 60% $1,210Nebraska 5,386 $4,648,161 2,951 55% $1,575Nevada 15,058 $38,106,089 8,870 59% $4,296New Hampshire 4,908 $5,443,872 2,741 56% $1,986New Jersey 35,316 $44,139,676 20,020 57% $2,205New Mexico 7,351 $10,078,654 4,680 64% $2,154New York 69,562 $83,413,387 38,995 56% $2,139North Carolina 33,160 $36,442,673 18,626 56% $1,957North Dakota 1,837 $4,159,762 1,118 61% $3,721Ohio 37,000 $28,367,865 19,859 54% $1,428Oklahoma 11,722 $15,075,360 6,260 53% $2,408Oregon 14,031 $16,207,187 8,856 63% $1,830Pennsylvania 47,022 $46,166,043 26,131 56% $1,767Rhode Island 4,174 $2,799,493 1,793 43% $1,561South Carolina 16,657 $18,083,266 9,343 56% $1,935South Dakota 2,050 $3,389,165 1,105 54% $3,067Tennessee 25,346 $23,239,785 12,697 50% $1,830Texas 110,334 $110,373,520 48,113 44% $2,294Utah 7,855 $13,639,103 4,939 63% $2,762Vermont 1,551 $1,796,575 993 64% $1,809Virginia 32,461 $37,373,499 20,010 62% $1,868Washington 24,833 $43,883,140 16,227 65% $2,704West Virginia 6,327 $7,117,455 3,925 62% $1,813Wisconsin 16,594 $15,619,377 10,036 60% $1,556Wyoming 2,190 $3,700,618 1,337 61% $2,768
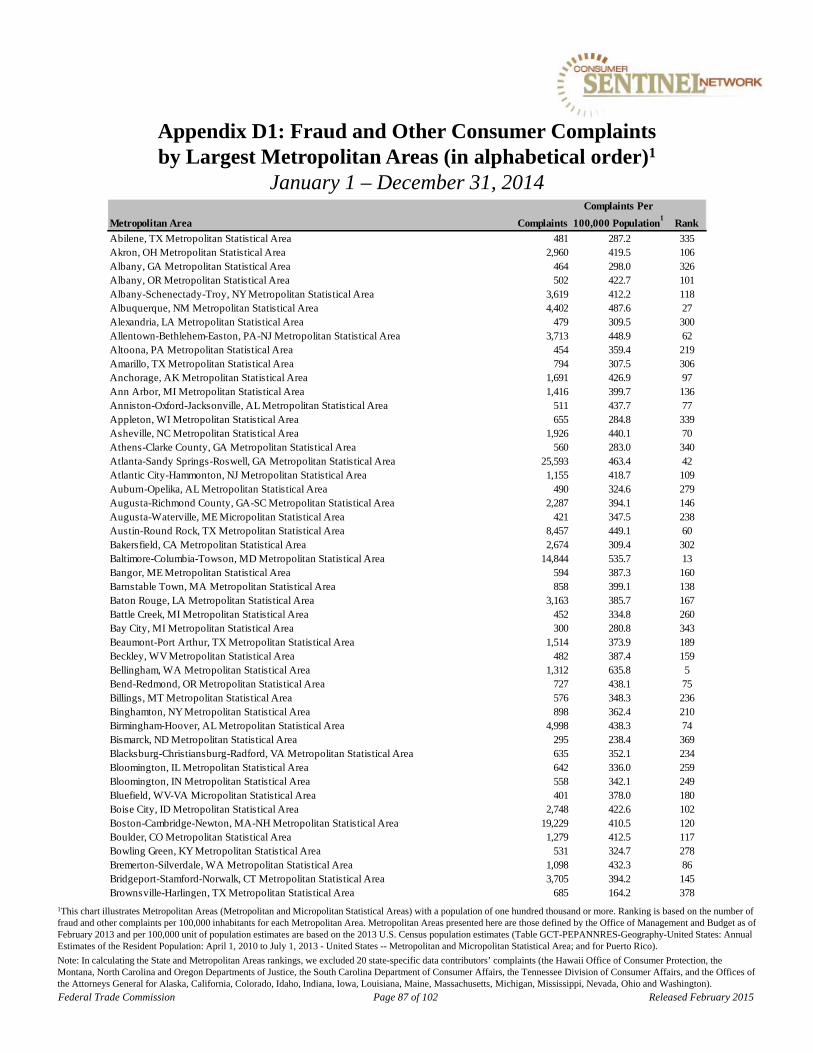
Metropolitan Area Complaints
Complaints Per
100,000 Population1
Rank
Abilene, TX Metropolitan Statistical Area 481 287.2 335Akron, OH Metropolitan Statistical Area 2,960 419.5 106Albany, GA Metropolitan Statistical Area 464 298.0 326Albany, OR Metropolitan Statistical Area 502 422.7 101Albany-Schenectady-Troy, NY Metropolitan Statistical Area 3,619 412.2 118Albuquerque, NM Metropolitan Statistical Area 4,402 487.6 27Alexandria, LA Metropolitan Statistical Area 479 309.5 300Allentown-Bethlehem-Easton, PA-NJ Metropolitan Statistical Area 3,713 448.9 62Altoona, PA Metropolitan Statistical Area 454 359.4 219Amarillo, TX Metropolitan Statistical Area 794 307.5 306Anchorage, AK Metropolitan Statistical Area 1,691 426.9 97Ann Arbor, MI Metropolitan Statistical Area 1,416 399.7 136Anniston-Oxford-Jacksonville, AL Metropolitan Statistical Area 511 437.7 77Appleton, WI Metropolitan Statistical Area 655 284.8 339Asheville, NC Metropolitan Statistical Area 1,926 440.1 70Athens-Clarke County, GA Metropolitan Statistical Area 560 283.0 340Atlanta-Sandy Springs-Roswell, GA Metropolitan Statistical Area 25,593 463.4 42Atlantic City-Hammonton, NJ Metropolitan Statistical Area 1,155 418.7 109Auburn-Opelika, AL Metropolitan Statistical Area 490 324.6 279Augusta-Richmond County, GA-SC Metropolitan Statistical Area 2,287 394.1 146Augusta-Waterville, ME Micropolitan Statistical Area 421 347.5 238Austin-Round Rock, TX Metropolitan Statistical Area 8,457 449.1 60Bakersfield, CA Metropolitan Statistical Area 2,674 309.4 302Baltimore-Columbia-Towson, MD Metropolitan Statistical Area 14,844 535.7 13Bangor, ME Metropolitan Statistical Area 594 387.3 160Barnstable Town, MA Metropolitan Statistical Area 858 399.1 138Baton Rouge, LA Metropolitan Statistical Area 3,163 385.7 167Battle Creek, MI Metropolitan Statistical Area 452 334.8 260Bay City, MI Metropolitan Statistical Area 300 280.8 343Beaumont-Port Arthur, TX Metropolitan Statistical Area 1,514 373.9 189Beckley, WV Metropolitan Statistical Area 482 387.4 159Bellingham, WA Metropolitan Statistical Area 1,312 635.8 5Bend-Redmond, OR Metropolitan Statistical Area 727 438.1 75Billings, MT Metropolitan Statistical Area 576 348.3 236Binghamton, NY Metropolitan Statistical Area 898 362.4 210Birmingham-Hoover, AL Metropolitan Statistical Area 4,998 438.3 74Bismarck, ND Metropolitan Statistical Area 295 238.4 369Blacksburg-Christiansburg-Radford, VA Metropolitan Statistical Area 635 352.1 234Bloomington, IL Metropolitan Statistical Area 642 336.0 259Bloomington, IN Metropolitan Statistical Area 558 342.1 249Bluefield, WV-VA Micropolitan Statistical Area 401 378.0 180Boise City, ID Metropolitan Statistical Area 2,748 422.6 102Boston-Cambridge-Newton, MA-NH Metropolitan Statistical Area 19,229 410.5 120Boulder, CO Metropolitan Statistical Area 1,279 412.5 117Bowling Green, KY Metropolitan Statistical Area 531 324.7 278Bremerton-Silverdale, WA Metropolitan Statistical Area 1,098 432.3 86Bridgeport-Stamford-Norwalk, CT Metropolitan Statistical Area 3,705 394.2 145Brownsville-Harlingen, TX Metropolitan Statistical Area 685 164.2 378
Appendix D1: Fraud and Other Consumer Complaints by Largest Metropolitan Areas (in alphabetical order)1
January 1 – December 31, 2014
1This chart illustrates Metropolitan Areas (Metropolitan and Micropolitan Statistical Areas) with a population of one hundred thousand or more. Ranking is based on the number of fraud and other complaints per 100,000 inhabitants for each Metropolitan Area. Metropolitan Areas presented here are those defined by the Office of Management and Budget as of February 2013 and per 100,000 unit of population estimates are based on the 2013 U.S. Census population estimates (Table GCT-PEPANNRES-Geography-United States: Annual Estimates of the Resident Population: April 1, 2010 to July 1, 2013 - United States -- Metropolitan and Micropolitan Statistical Area; and for Puerto Rico).
Note: In calculating the State and Metropolitan Areas rankings, we excluded 20 state-specific data contributors’ complaints (the Hawaii Office of Consumer Protection, the Montana, North Carolina and Oregon Departments of Justice, the South Carolina Department of Consumer Affairs, the Tennessee Division of Consumer Affairs, and the Offices of the Attorneys General for Alaska, California, Colorado, Idaho, Indiana, Iowa, Louisiana, Maine, Massachusetts, Michigan, Mississippi, Nevada, Ohio and Washington).
Federal Trade Commission Page 87 of 102 Released February 2015
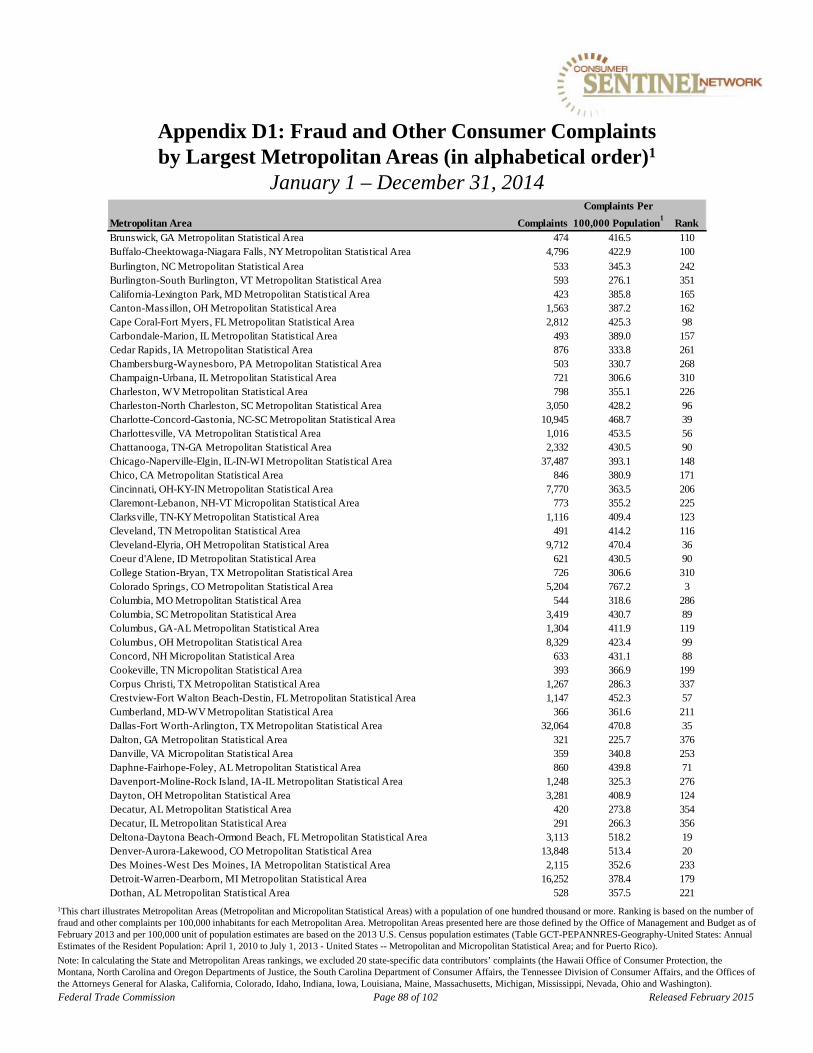
Metropolitan Area Complaints
Complaints Per
100,000 Population1
RankBrunswick, GA Metropolitan Statistical Area 474 416.5 110Buffalo-Cheektowaga-Niagara Falls, NY Metropolitan Statistical Area 4,796 422.9 100
Burlington, NC Metropolitan Statistical Area 533 345.3 242Burlington-South Burlington, VT Metropolitan Statistical Area 593 276.1 351California-Lexington Park, MD Metropolitan Statistical Area 423 385.8 165Canton-Massillon, OH Metropolitan Statistical Area 1,563 387.2 162Cape Coral-Fort Myers, FL Metropolitan Statistical Area 2,812 425.3 98Carbondale-Marion, IL Metropolitan Statistical Area 493 389.0 157Cedar Rapids, IA Metropolitan Statistical Area 876 333.8 261Chambersburg-Waynesboro, PA Metropolitan Statistical Area 503 330.7 268Champaign-Urbana, IL Metropolitan Statistical Area 721 306.6 310Charleston, WV Metropolitan Statistical Area 798 355.1 226Charleston-North Charleston, SC Metropolitan Statistical Area 3,050 428.2 96Charlotte-Concord-Gastonia, NC-SC Metropolitan Statistical Area 10,945 468.7 39Charlottesville, VA Metropolitan Statistical Area 1,016 453.5 56Chattanooga, TN-GA Metropolitan Statistical Area 2,332 430.5 90Chicago-Naperville-Elgin, IL-IN-WI Metropolitan Statistical Area 37,487 393.1 148Chico, CA Metropolitan Statistical Area 846 380.9 171Cincinnati, OH-KY-IN Metropolitan Statistical Area 7,770 363.5 206Claremont-Lebanon, NH-VT Micropolitan Statistical Area 773 355.2 225Clarksville, TN-KY Metropolitan Statistical Area 1,116 409.4 123Cleveland, TN Metropolitan Statistical Area 491 414.2 116Cleveland-Elyria, OH Metropolitan Statistical Area 9,712 470.4 36Coeur d'Alene, ID Metropolitan Statistical Area 621 430.5 90College Station-Bryan, TX Metropolitan Statistical Area 726 306.6 310Colorado Springs, CO Metropolitan Statistical Area 5,204 767.2 3Columbia, MO Metropolitan Statistical Area 544 318.6 286Columbia, SC Metropolitan Statistical Area 3,419 430.7 89Columbus, GA-AL Metropolitan Statistical Area 1,304 411.9 119Columbus, OH Metropolitan Statistical Area 8,329 423.4 99Concord, NH Micropolitan Statistical Area 633 431.1 88Cookeville, TN Micropolitan Statistical Area 393 366.9 199Corpus Christi, TX Metropolitan Statistical Area 1,267 286.3 337Crestview-Fort Walton Beach-Destin, FL Metropolitan Statistical Area 1,147 452.3 57Cumberland, MD-WV Metropolitan Statistical Area 366 361.6 211Dallas-Fort Worth-Arlington, TX Metropolitan Statistical Area 32,064 470.8 35Dalton, GA Metropolitan Statistical Area 321 225.7 376Danville, VA Micropolitan Statistical Area 359 340.8 253Daphne-Fairhope-Foley, AL Metropolitan Statistical Area 860 439.8 71Davenport-Moline-Rock Island, IA-IL Metropolitan Statistical Area 1,248 325.3 276Dayton, OH Metropolitan Statistical Area 3,281 408.9 124Decatur, AL Metropolitan Statistical Area 420 273.8 354Decatur, IL Metropolitan Statistical Area 291 266.3 356Deltona-Daytona Beach-Ormond Beach, FL Metropolitan Statistical Area 3,113 518.2 19Denver-Aurora-Lakewood, CO Metropolitan Statistical Area 13,848 513.4 20Des Moines-West Des Moines, IA Metropolitan Statistical Area 2,115 352.6 233Detroit-Warren-Dearborn, MI Metropolitan Statistical Area 16,252 378.4 179Dothan, AL Metropolitan Statistical Area 528 357.5 221
Appendix D1: Fraud and Other Consumer Complaints by Largest Metropolitan Areas (in alphabetical order)1
January 1 – December 31, 2014
1This chart illustrates Metropolitan Areas (Metropolitan and Micropolitan Statistical Areas) with a population of one hundred thousand or more. Ranking is based on the number of fraud and other complaints per 100,000 inhabitants for each Metropolitan Area. Metropolitan Areas presented here are those defined by the Office of Management and Budget as of February 2013 and per 100,000 unit of population estimates are based on the 2013 U.S. Census population estimates (Table GCT-PEPANNRES-Geography-United States: Annual Estimates of the Resident Population: April 1, 2010 to July 1, 2013 - United States -- Metropolitan and Micropolitan Statistical Area; and for Puerto Rico).
Note: In calculating the State and Metropolitan Areas rankings, we excluded 20 state-specific data contributors’ complaints (the Hawaii Office of Consumer Protection, the Montana, North Carolina and Oregon Departments of Justice, the South Carolina Department of Consumer Affairs, the Tennessee Division of Consumer Affairs, and the Offices of the Attorneys General for Alaska, California, Colorado, Idaho, Indiana, Iowa, Louisiana, Maine, Massachusetts, Michigan, Mississippi, Nevada, Ohio and Washington).
Federal Trade Commission Page 88 of 102 Released February 2015

Metropolitan Area Complaints
Complaints Per
100,000 Population1
Rank
Dover, DE Metropolitan Statistical Area 1,062 626.9 7Duluth, MN-WI Metropolitan Statistical Area 1,006 359.4 219Dunn, NC Micropolitan Statistical Area 435 348.0 237Durham-Chapel Hill, NC Metropolitan Statistical Area 1,907 356.7 223East Stroudsburg, PA Metropolitan Statistical Area 785 469.6 38
Eau Claire, WI Metropolitan Statistical Area 472 286.8 336El Centro, CA Metropolitan Statistical Area 322 182.3 377El Paso, TX Metropolitan Statistical Area 2,314 278.4 346Elizabethtown-Fort Knox, KY Metropolitan Statistical Area 616 406.7 126Elkhart-Goshen, IN Metropolitan Statistical Area 601 299.7 325Erie, PA Metropolitan Statistical Area 1,167 416.3 111Eugene, OR Metropolitan Statistical Area 1,552 435.7 80Eureka-Arcata-Fortuna, CA Micropolitan Statistical Area 522 388.1 158Evansville, IN-KY Metropolitan Statistical Area 1,131 359.9 217Fairbanks, AK Metropolitan Statistical Area 335 333.5 262Fargo, ND-MN Metropolitan Statistical Area 688 307.8 305Farmington, NM Metropolitan Statistical Area 350 276.7 350Fayetteville, NC Metropolitan Statistical Area 1,680 445.4 67Fayetteville-Springdale-Rogers, AR-MO Metropolitan Statistical Area 1,575 320.1 284Flagstaff, AZ Metropolitan Statistical Area 382 279.8 345Flint, MI Metropolitan Statistical Area 1,559 375.3 187Florence, SC Metropolitan Statistical Area 708 343.3 246Florence-Muscle Shoals, AL Metropolitan Statistical Area 481 326.5 275Fond du Lac, WI Metropolitan Statistical Area 359 352.7 231Fort Collins, CO Metropolitan Statistical Area 1,416 448.1 64Fort Smith, AR-OK Metropolitan Statistical Area 811 289.7 331Fort Wayne, IN Metropolitan Statistical Area 1,548 365.0 203Fresno, CA Metropolitan Statistical Area 2,924 306.1 313Gadsden, AL Metropolitan Statistical Area 394 379.1 175Gainesville, FL Metropolitan Statistical Area 1,345 497.4 24Gainesville, GA Metropolitan Statistical Area 492 262.1 360Gettysburg, PA Metropolitan Statistical Area 345 339.7 255Glens Falls, NY Metropolitan Statistical Area 453 352.7 231Goldsboro, NC Metropolitan Statistical Area 319 256.1 364Grand Forks, ND-MN Metropolitan Statistical Area 236 234.2 373Grand Junction, CO Metropolitan Statistical Area 512 347.0 239Grand Rapids-Wyoming, MI Metropolitan Statistical Area 3,276 322.2 282Greeley, CO Metropolitan Statistical Area 1,179 437.0 78Green Bay, WI Metropolitan Statistical Area 952 304.7 316Greensboro-High Point, NC Metropolitan Statistical Area 2,956 398.9 139Greenville, NC Metropolitan Statistical Area 578 331.7 265Greenville-Anderson-Mauldin, SC Metropolitan Statistical Area 3,698 434.6 83Gulfport-Biloxi-Pascagoula, MS Metropolitan Statistical Area 1,450 379.1 175Hagerstown-Martinsburg, MD-WV Metropolitan Statistical Area 1,179 456.5 49Hammond, LA Metropolitan Statistical Area 453 361.2 212Hanford-Corcoran, CA Metropolitan Statistical Area 388 257.0 362Harrisburg-Carlisle, PA Metropolitan Statistical Area 2,436 436.8 79Harrisonburg, VA Metropolitan Statistical Area 411 318.3 288
Appendix D1: Fraud and Other Consumer Complaints by Largest Metropolitan Areas (in alphabetical order)1
January 1 – December 31, 2014
1This chart illustrates Metropolitan Areas (Metropolitan and Micropolitan Statistical Areas) with a population of one hundred thousand or more. Ranking is based on the number of fraud and other complaints per 100,000 inhabitants for each Metropolitan Area. Metropolitan Areas presented here are those defined by the Office of Management and Budget as of February 2013 and per 100,000 unit of population estimates are based on the 2013 U.S. Census population estimates (Table GCT-PEPANNRES-Geography-United States: Annual Estimates of the Resident Population: April 1, 2010 to July 1, 2013 - United States -- Metropolitan and Micropolitan Statistical Area; and for Puerto Rico).
Note: In calculating the State and Metropolitan Areas rankings, we excluded 20 state-specific data contributors’ complaints (the Hawaii Office of Consumer Protection, the Montana, North Carolina and Oregon Departments of Justice, the South Carolina Department of Consumer Affairs, the Tennessee Division of Consumer Affairs, and the Offices of the Attorneys General for Alaska, California, Colorado, Idaho, Indiana, Iowa, Louisiana, Maine, Massachusetts, Michigan, Mississippi, Nevada, Ohio and Washington).
Federal Trade Commission Page 89 of 102 Released February 2015
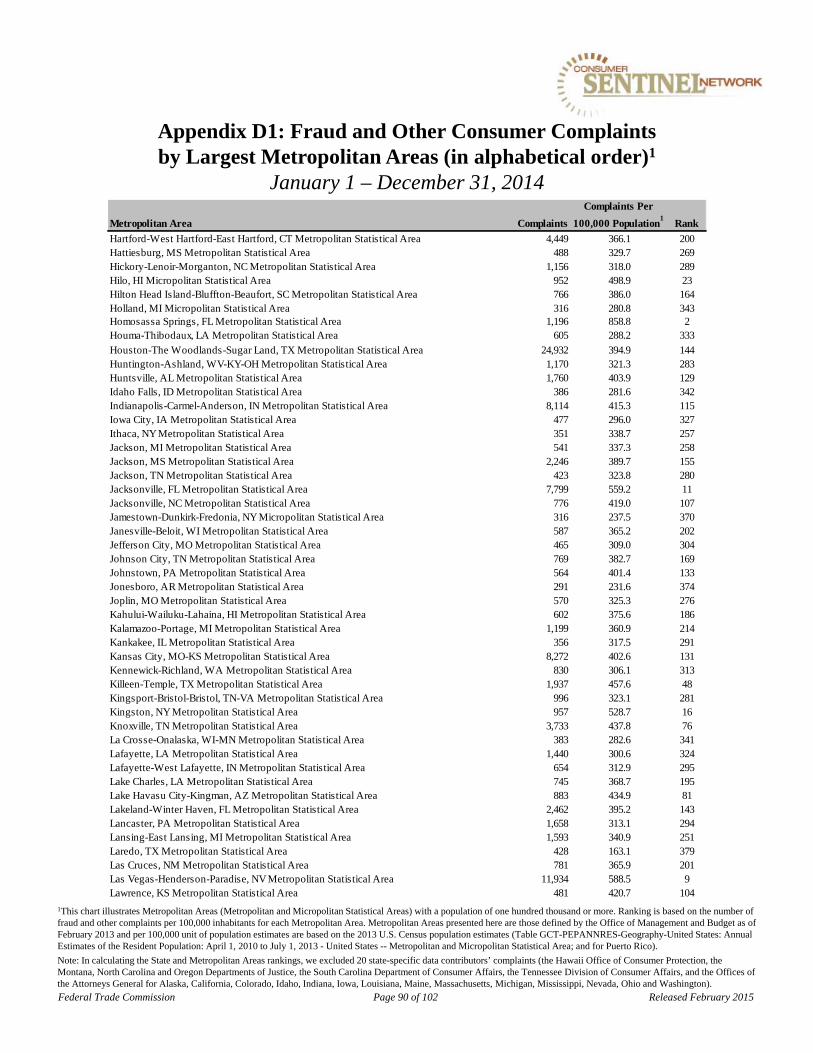
Metropolitan Area Complaints
Complaints Per
100,000 Population1
Rank
Hartford-West Hartford-East Hartford, CT Metropolitan Statistical Area 4,449 366.1 200Hattiesburg, MS Metropolitan Statistical Area 488 329.7 269Hickory-Lenoir-Morganton, NC Metropolitan Statistical Area 1,156 318.0 289Hilo, HI Micropolitan Statistical Area 952 498.9 23Hilton Head Island-Bluffton-Beaufort, SC Metropolitan Statistical Area 766 386.0 164Holland, MI Micropolitan Statistical Area 316 280.8 343Homosassa Springs, FL Metropolitan Statistical Area 1,196 858.8 2Houma-Thibodaux, LA Metropolitan Statistical Area 605 288.2 333
Houston-The Woodlands-Sugar Land, TX Metropolitan Statistical Area 24,932 394.9 144Huntington-Ashland, WV-KY-OH Metropolitan Statistical Area 1,170 321.3 283Huntsville, AL Metropolitan Statistical Area 1,760 403.9 129Idaho Falls, ID Metropolitan Statistical Area 386 281.6 342Indianapolis-Carmel-Anderson, IN Metropolitan Statistical Area 8,114 415.3 115Iowa City, IA Metropolitan Statistical Area 477 296.0 327Ithaca, NY Metropolitan Statistical Area 351 338.7 257Jackson, MI Metropolitan Statistical Area 541 337.3 258Jackson, MS Metropolitan Statistical Area 2,246 389.7 155Jackson, TN Metropolitan Statistical Area 423 323.8 280Jacksonville, FL Metropolitan Statistical Area 7,799 559.2 11Jacksonville, NC Metropolitan Statistical Area 776 419.0 107Jamestown-Dunkirk-Fredonia, NY Micropolitan Statistical Area 316 237.5 370Janesville-Beloit, WI Metropolitan Statistical Area 587 365.2 202Jefferson City, MO Metropolitan Statistical Area 465 309.0 304Johnson City, TN Metropolitan Statistical Area 769 382.7 169Johnstown, PA Metropolitan Statistical Area 564 401.4 133Jonesboro, AR Metropolitan Statistical Area 291 231.6 374Joplin, MO Metropolitan Statistical Area 570 325.3 276Kahului-Wailuku-Lahaina, HI Metropolitan Statistical Area 602 375.6 186Kalamazoo-Portage, MI Metropolitan Statistical Area 1,199 360.9 214Kankakee, IL Metropolitan Statistical Area 356 317.5 291Kansas City, MO-KS Metropolitan Statistical Area 8,272 402.6 131Kennewick-Richland, WA Metropolitan Statistical Area 830 306.1 313Killeen-Temple, TX Metropolitan Statistical Area 1,937 457.6 48Kingsport-Bristol-Bristol, TN-VA Metropolitan Statistical Area 996 323.1 281Kingston, NY Metropolitan Statistical Area 957 528.7 16Knoxville, TN Metropolitan Statistical Area 3,733 437.8 76La Crosse-Onalaska, WI-MN Metropolitan Statistical Area 383 282.6 341Lafayette, LA Metropolitan Statistical Area 1,440 300.6 324Lafayette-West Lafayette, IN Metropolitan Statistical Area 654 312.9 295Lake Charles, LA Metropolitan Statistical Area 745 368.7 195Lake Havasu City-Kingman, AZ Metropolitan Statistical Area 883 434.9 81Lakeland-Winter Haven, FL Metropolitan Statistical Area 2,462 395.2 143Lancaster, PA Metropolitan Statistical Area 1,658 313.1 294Lansing-East Lansing, MI Metropolitan Statistical Area 1,593 340.9 251Laredo, TX Metropolitan Statistical Area 428 163.1 379Las Cruces, NM Metropolitan Statistical Area 781 365.9 201Las Vegas-Henderson-Paradise, NV Metropolitan Statistical Area 11,934 588.5 9Lawrence, KS Metropolitan Statistical Area 481 420.7 104
Appendix D1: Fraud and Other Consumer Complaints by Largest Metropolitan Areas (in alphabetical order)1
January 1 – December 31, 2014
1This chart illustrates Metropolitan Areas (Metropolitan and Micropolitan Statistical Areas) with a population of one hundred thousand or more. Ranking is based on the number of fraud and other complaints per 100,000 inhabitants for each Metropolitan Area. Metropolitan Areas presented here are those defined by the Office of Management and Budget as of February 2013 and per 100,000 unit of population estimates are based on the 2013 U.S. Census population estimates (Table GCT-PEPANNRES-Geography-United States: Annual Estimates of the Resident Population: April 1, 2010 to July 1, 2013 - United States -- Metropolitan and Micropolitan Statistical Area; and for Puerto Rico).
Note: In calculating the State and Metropolitan Areas rankings, we excluded 20 state-specific data contributors’ complaints (the Hawaii Office of Consumer Protection, the Montana, North Carolina and Oregon Departments of Justice, the South Carolina Department of Consumer Affairs, the Tennessee Division of Consumer Affairs, and the Offices of the Attorneys General for Alaska, California, Colorado, Idaho, Indiana, Iowa, Louisiana, Maine, Massachusetts, Michigan, Mississippi, Nevada, Ohio and Washington).
Federal Trade Commission Page 90 of 102 Released February 2015
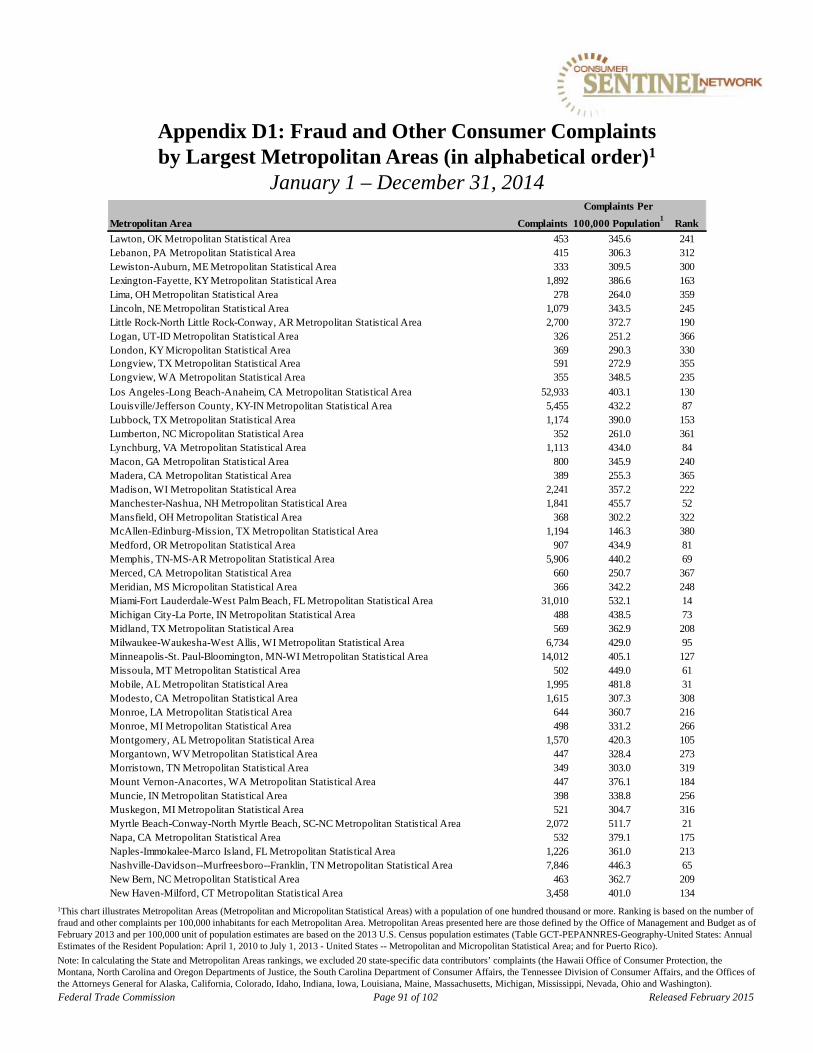
Metropolitan Area Complaints
Complaints Per
100,000 Population1
Rank
Lawton, OK Metropolitan Statistical Area 453 345.6 241Lebanon, PA Metropolitan Statistical Area 415 306.3 312Lewiston-Auburn, ME Metropolitan Statistical Area 333 309.5 300Lexington-Fayette, KY Metropolitan Statistical Area 1,892 386.6 163Lima, OH Metropolitan Statistical Area 278 264.0 359Lincoln, NE Metropolitan Statistical Area 1,079 343.5 245Little Rock-North Little Rock-Conway, AR Metropolitan Statistical Area 2,700 372.7 190Logan, UT-ID Metropolitan Statistical Area 326 251.2 366London, KY Micropolitan Statistical Area 369 290.3 330Longview, TX Metropolitan Statistical Area 591 272.9 355Longview, WA Metropolitan Statistical Area 355 348.5 235
Los Angeles-Long Beach-Anaheim, CA Metropolitan Statistical Area 52,933 403.1 130Louisville/Jefferson County, KY-IN Metropolitan Statistical Area 5,455 432.2 87Lubbock, TX Metropolitan Statistical Area 1,174 390.0 153Lumberton, NC Micropolitan Statistical Area 352 261.0 361Lynchburg, VA Metropolitan Statistical Area 1,113 434.0 84Macon, GA Metropolitan Statistical Area 800 345.9 240Madera, CA Metropolitan Statistical Area 389 255.3 365Madison, WI Metropolitan Statistical Area 2,241 357.2 222Manchester-Nashua, NH Metropolitan Statistical Area 1,841 455.7 52Mansfield, OH Metropolitan Statistical Area 368 302.2 322McAllen-Edinburg-Mission, TX Metropolitan Statistical Area 1,194 146.3 380Medford, OR Metropolitan Statistical Area 907 434.9 81Memphis, TN-MS-AR Metropolitan Statistical Area 5,906 440.2 69Merced, CA Metropolitan Statistical Area 660 250.7 367Meridian, MS Micropolitan Statistical Area 366 342.2 248Miami-Fort Lauderdale-West Palm Beach, FL Metropolitan Statistical Area 31,010 532.1 14Michigan City-La Porte, IN Metropolitan Statistical Area 488 438.5 73Midland, TX Metropolitan Statistical Area 569 362.9 208Milwaukee-Waukesha-West Allis, WI Metropolitan Statistical Area 6,734 429.0 95Minneapolis-St. Paul-Bloomington, MN-WI Metropolitan Statistical Area 14,012 405.1 127Missoula, MT Metropolitan Statistical Area 502 449.0 61Mobile, AL Metropolitan Statistical Area 1,995 481.8 31Modesto, CA Metropolitan Statistical Area 1,615 307.3 308Monroe, LA Metropolitan Statistical Area 644 360.7 216Monroe, MI Metropolitan Statistical Area 498 331.2 266Montgomery, AL Metropolitan Statistical Area 1,570 420.3 105Morgantown, WV Metropolitan Statistical Area 447 328.4 273Morristown, TN Metropolitan Statistical Area 349 303.0 319Mount Vernon-Anacortes, WA Metropolitan Statistical Area 447 376.1 184Muncie, IN Metropolitan Statistical Area 398 338.8 256Muskegon, MI Metropolitan Statistical Area 521 304.7 316Myrtle Beach-Conway-North Myrtle Beach, SC-NC Metropolitan Statistical Area 2,072 511.7 21Napa, CA Metropolitan Statistical Area 532 379.1 175Naples-Immokalee-Marco Island, FL Metropolitan Statistical Area 1,226 361.0 213Nashville-Davidson--Murfreesboro--Franklin, TN Metropolitan Statistical Area 7,846 446.3 65New Bern, NC Metropolitan Statistical Area 463 362.7 209New Haven-Milford, CT Metropolitan Statistical Area 3,458 401.0 134
Appendix D1: Fraud and Other Consumer Complaints by Largest Metropolitan Areas (in alphabetical order)1
January 1 – December 31, 2014
1This chart illustrates Metropolitan Areas (Metropolitan and Micropolitan Statistical Areas) with a population of one hundred thousand or more. Ranking is based on the number of fraud and other complaints per 100,000 inhabitants for each Metropolitan Area. Metropolitan Areas presented here are those defined by the Office of Management and Budget as of February 2013 and per 100,000 unit of population estimates are based on the 2013 U.S. Census population estimates (Table GCT-PEPANNRES-Geography-United States: Annual Estimates of the Resident Population: April 1, 2010 to July 1, 2013 - United States -- Metropolitan and Micropolitan Statistical Area; and for Puerto Rico).
Note: In calculating the State and Metropolitan Areas rankings, we excluded 20 state-specific data contributors’ complaints (the Hawaii Office of Consumer Protection, the Montana, North Carolina and Oregon Departments of Justice, the South Carolina Department of Consumer Affairs, the Tennessee Division of Consumer Affairs, and the Offices of the Attorneys General for Alaska, California, Colorado, Idaho, Indiana, Iowa, Louisiana, Maine, Massachusetts, Michigan, Mississippi, Nevada, Ohio and Washington).
Federal Trade Commission Page 91 of 102 Released February 2015
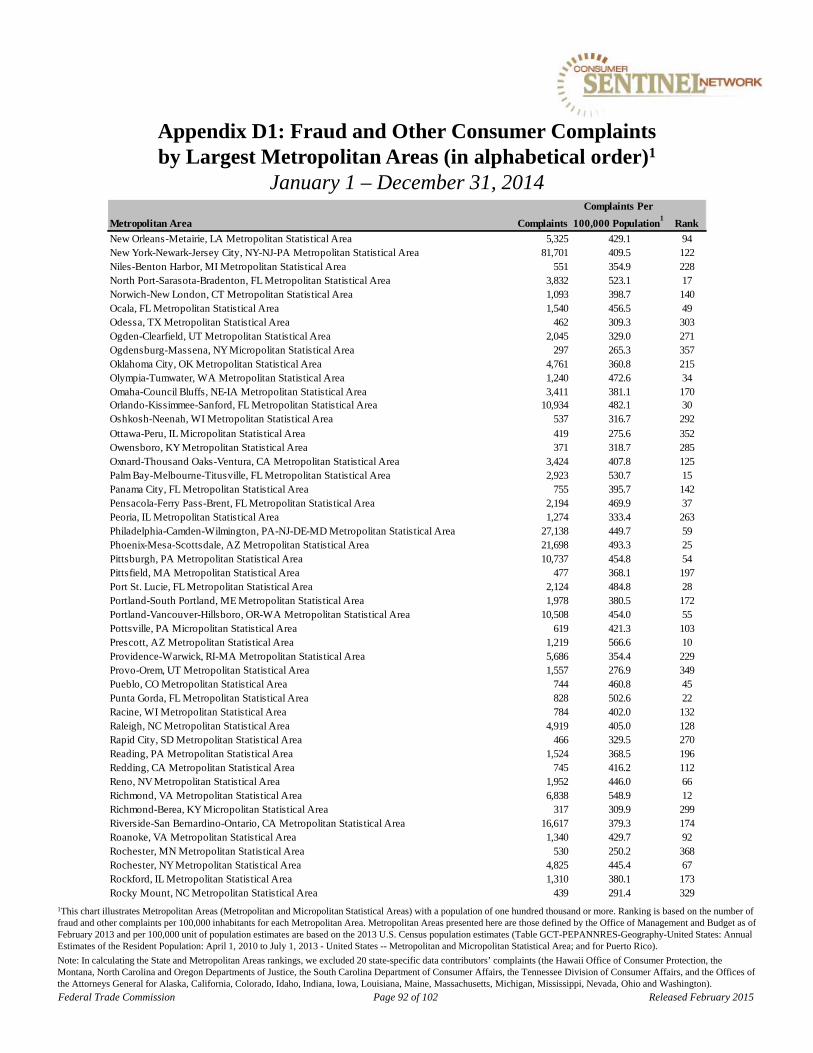
Metropolitan Area Complaints
Complaints Per
100,000 Population1
Rank
New Orleans-Metairie, LA Metropolitan Statistical Area 5,325 429.1 94New York-Newark-Jersey City, NY-NJ-PA Metropolitan Statistical Area 81,701 409.5 122Niles-Benton Harbor, MI Metropolitan Statistical Area 551 354.9 228North Port-Sarasota-Bradenton, FL Metropolitan Statistical Area 3,832 523.1 17Norwich-New London, CT Metropolitan Statistical Area 1,093 398.7 140Ocala, FL Metropolitan Statistical Area 1,540 456.5 49Odessa, TX Metropolitan Statistical Area 462 309.3 303Ogden-Clearfield, UT Metropolitan Statistical Area 2,045 329.0 271Ogdensburg-Massena, NY Micropolitan Statistical Area 297 265.3 357Oklahoma City, OK Metropolitan Statistical Area 4,761 360.8 215Olympia-Tumwater, WA Metropolitan Statistical Area 1,240 472.6 34Omaha-Council Bluffs, NE-IA Metropolitan Statistical Area 3,411 381.1 170Orlando-Kissimmee-Sanford, FL Metropolitan Statistical Area 10,934 482.1 30Oshkosh-Neenah, WI Metropolitan Statistical Area 537 316.7 292
Ottawa-Peru, IL Micropolitan Statistical Area 419 275.6 352Owensboro, KY Metropolitan Statistical Area 371 318.7 285Oxnard-Thousand Oaks-Ventura, CA Metropolitan Statistical Area 3,424 407.8 125Palm Bay-Melbourne-Titusville, FL Metropolitan Statistical Area 2,923 530.7 15Panama City, FL Metropolitan Statistical Area 755 395.7 142Pensacola-Ferry Pass-Brent, FL Metropolitan Statistical Area 2,194 469.9 37Peoria, IL Metropolitan Statistical Area 1,274 333.4 263Philadelphia-Camden-Wilmington, PA-NJ-DE-MD Metropolitan Statistical Area 27,138 449.7 59Phoenix-Mesa-Scottsdale, AZ Metropolitan Statistical Area 21,698 493.3 25Pittsburgh, PA Metropolitan Statistical Area 10,737 454.8 54Pittsfield, MA Metropolitan Statistical Area 477 368.1 197Port St. Lucie, FL Metropolitan Statistical Area 2,124 484.8 28Portland-South Portland, ME Metropolitan Statistical Area 1,978 380.5 172Portland-Vancouver-Hillsboro, OR-WA Metropolitan Statistical Area 10,508 454.0 55Pottsville, PA Micropolitan Statistical Area 619 421.3 103Prescott, AZ Metropolitan Statistical Area 1,219 566.6 10Providence-Warwick, RI-MA Metropolitan Statistical Area 5,686 354.4 229Provo-Orem, UT Metropolitan Statistical Area 1,557 276.9 349Pueblo, CO Metropolitan Statistical Area 744 460.8 45Punta Gorda, FL Metropolitan Statistical Area 828 502.6 22Racine, WI Metropolitan Statistical Area 784 402.0 132Raleigh, NC Metropolitan Statistical Area 4,919 405.0 128Rapid City, SD Metropolitan Statistical Area 466 329.5 270Reading, PA Metropolitan Statistical Area 1,524 368.5 196Redding, CA Metropolitan Statistical Area 745 416.2 112Reno, NV Metropolitan Statistical Area 1,952 446.0 66Richmond, VA Metropolitan Statistical Area 6,838 548.9 12Richmond-Berea, KY Micropolitan Statistical Area 317 309.9 299Riverside-San Bernardino-Ontario, CA Metropolitan Statistical Area 16,617 379.3 174Roanoke, VA Metropolitan Statistical Area 1,340 429.7 92Rochester, MN Metropolitan Statistical Area 530 250.2 368Rochester, NY Metropolitan Statistical Area 4,825 445.4 67Rockford, IL Metropolitan Statistical Area 1,310 380.1 173Rocky Mount, NC Metropolitan Statistical Area 439 291.4 329
Appendix D1: Fraud and Other Consumer Complaints by Largest Metropolitan Areas (in alphabetical order)1
January 1 – December 31, 2014
1This chart illustrates Metropolitan Areas (Metropolitan and Micropolitan Statistical Areas) with a population of one hundred thousand or more. Ranking is based on the number of fraud and other complaints per 100,000 inhabitants for each Metropolitan Area. Metropolitan Areas presented here are those defined by the Office of Management and Budget as of February 2013 and per 100,000 unit of population estimates are based on the 2013 U.S. Census population estimates (Table GCT-PEPANNRES-Geography-United States: Annual Estimates of the Resident Population: April 1, 2010 to July 1, 2013 - United States -- Metropolitan and Micropolitan Statistical Area; and for Puerto Rico).
Note: In calculating the State and Metropolitan Areas rankings, we excluded 20 state-specific data contributors’ complaints (the Hawaii Office of Consumer Protection, the Montana, North Carolina and Oregon Departments of Justice, the South Carolina Department of Consumer Affairs, the Tennessee Division of Consumer Affairs, and the Offices of the Attorneys General for Alaska, California, Colorado, Idaho, Indiana, Iowa, Louisiana, Maine, Massachusetts, Michigan, Mississippi, Nevada, Ohio and Washington).
Federal Trade Commission Page 92 of 102 Released February 2015

Metropolitan Area Complaints
Complaints Per
100,000 Population1
Rank
Roseburg, OR Micropolitan Statistical Area 463 433.0 85Sacramento--Roseville--Arden-Arcade, CA Metropolitan Statistical Area 10,161 458.6 47Saginaw, MI Metropolitan Statistical Area 578 294.1 328Salem, OH Micropolitan Statistical Area 375 354.1 230Salem, OR Metropolitan Statistical Area 1,427 356.4 224Salinas, CA Metropolitan Statistical Area 1,190 277.5 347Salisbury, MD-DE Metropolitan Statistical Area 1,757 455.8 51Salt Lake City, UT Metropolitan Statistical Area 4,417 387.3 160San Angelo, TX Metropolitan Statistical Area 333 285.7 338San Antonio-New Braunfels, TX Metropolitan Statistical Area 8,628 378.8 178San Diego-Carlsbad, CA Metropolitan Statistical Area 15,025 467.9 40San Francisco-Oakland-Hayward, CA Metropolitan Statistical Area 20,557 455.2 53San Jose-Sunnyvale-Santa Clara, CA Metropolitan Statistical Area 7,506 391.0 152San Luis Obispo-Paso Robles-Arroyo Grande, CA Metropolitan Statistical Area 1,106 400.1 135Santa Cruz-Watsonville, CA Metropolitan Statistical Area 990 367.5 198Santa Fe, NM Metropolitan Statistical Area 925 627.4 6Santa Maria-Santa Barbara, CA Metropolitan Statistical Area 1,495 343.1 247Santa Rosa, CA Metropolitan Statistical Area 2,074 419.0 107Savannah, GA Metropolitan Statistical Area 1,650 450.8 58Scranton--Wilkes-Barre--Hazleton, PA Metropolitan Statistical Area 2,302 409.6 121Seattle-Tacoma-Bellevue, WA Metropolitan Statistical Area 16,884 467.7 41Sebastian-Vero Beach, FL Metropolitan Statistical Area 700 493.0 26Sheboygan, WI Metropolitan Statistical Area 315 274.1 353Sherman-Denison, TX Metropolitan Statistical Area 479 391.5 151Show Low, AZ Micropolitan Statistical Area 381 355.0 227Shreveport-Bossier City, LA Metropolitan Statistical Area 1,741 389.9 154Sierra Vista-Douglas, AZ Metropolitan Statistical Area 1,200 926.8 1Sioux City, IA-NE-SD Metropolitan Statistical Area 399 236.5 371Sioux Falls, SD Metropolitan Statistical Area 800 328.5 272South Bend-Mishawaka, IN-MI Metropolitan Statistical Area 1,083 339.9 254Spartanburg, SC Metropolitan Statistical Area 1,181 370.2 193Spokane-Spokane Valley, WA Metropolitan Statistical Area 2,595 484.4 29Springfield, IL Metropolitan Statistical Area 800 377.8 181Springfield, MA Metropolitan Statistical Area 2,364 377.1 182Springfield, MO Metropolitan Statistical Area 1,720 383.3 168Springfield, OH Metropolitan Statistical Area 541 397.3 141St. Cloud, MN Metropolitan Statistical Area 633 330.9 267St. George, UT Metropolitan Statistical Area 461 311.9 298St. Joseph, MO-KS Metropolitan Statistical Area 328 256.7 363St. Louis, MO-IL Metropolitan Statistical Area 11,188 399.4 137State College, PA Metropolitan Statistical Area 431 277.3 348Staunton-Waynesboro, VA Metropolitan Statistical Area 397 332.1 264Stockton-Lodi, CA Metropolitan Statistical Area 2,432 345.3 242Sumter, SC Metropolitan Statistical Area 330 305.2 315Syracuse, NY Metropolitan Statistical Area 2,595 392.0 150Tallahassee, FL Metropolitan Statistical Area 1,638 438.8 72Tampa-St. Petersburg-Clearwater, FL Metropolitan Statistical Area 14,966 521.4 18Terre Haute, IN Metropolitan Statistical Area 522 303.1 318
Appendix D1: Fraud and Other Consumer Complaints by Largest Metropolitan Areas (in alphabetical order)1
January 1 – December 31, 2014
1This chart illustrates Metropolitan Areas (Metropolitan and Micropolitan Statistical Areas) with a population of one hundred thousand or more. Ranking is based on the number of fraud and other complaints per 100,000 inhabitants for each Metropolitan Area. Metropolitan Areas presented here are those defined by the Office of Management and Budget as of February 2013 and per 100,000 unit of population estimates are based on the 2013 U.S. Census population estimates (Table GCT-PEPANNRES-Geography-United States: Annual Estimates of the Resident Population: April 1, 2010 to July 1, 2013 - United States -- Metropolitan and Micropolitan Statistical Area; and for Puerto Rico).
Note: In calculating the State and Metropolitan Areas rankings, we excluded 20 state-specific data contributors’ complaints (the Hawaii Office of Consumer Protection, the Montana, North Carolina and Oregon Departments of Justice, the South Carolina Department of Consumer Affairs, the Tennessee Division of Consumer Affairs, and the Offices of the Attorneys General for Alaska, California, Colorado, Idaho, Indiana, Iowa, Louisiana, Maine, Massachusetts, Michigan, Mississippi, Nevada, Ohio and Washington).
Federal Trade Commission Page 93 of 102 Released February 2015
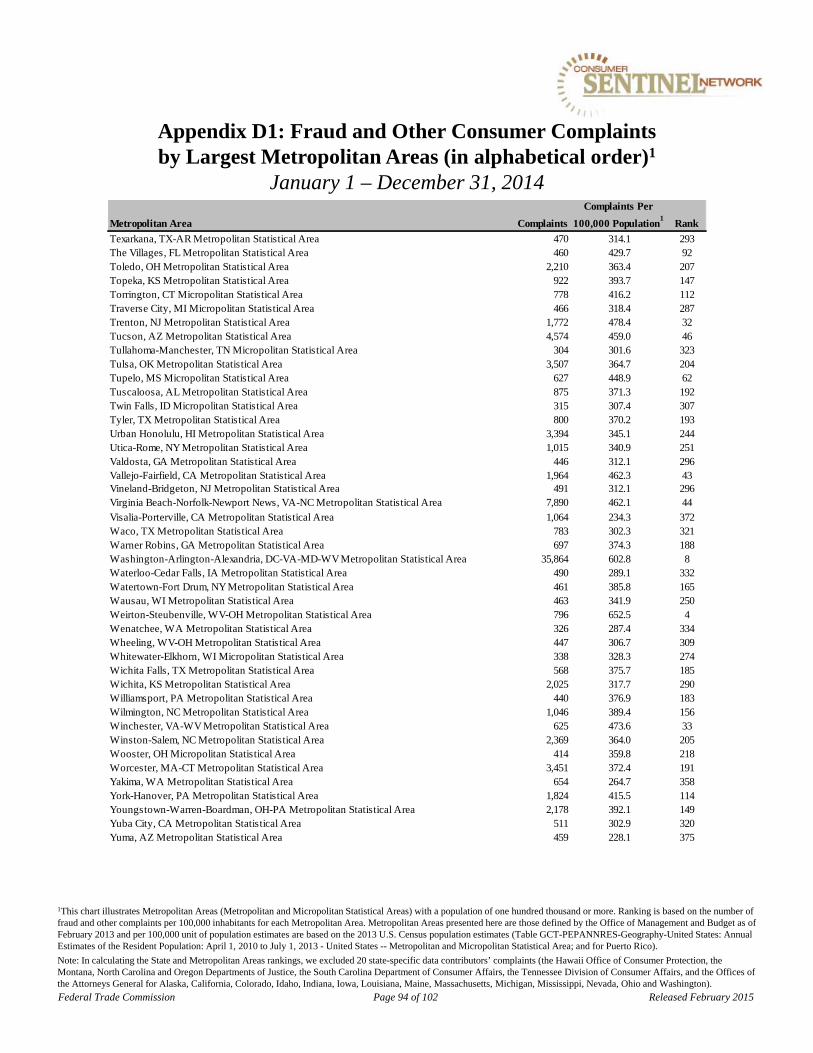
Metropolitan Area Complaints
Complaints Per
100,000 Population1
Rank
Texarkana, TX-AR Metropolitan Statistical Area 470 314.1 293The Villages, FL Metropolitan Statistical Area 460 429.7 92Toledo, OH Metropolitan Statistical Area 2,210 363.4 207Topeka, KS Metropolitan Statistical Area 922 393.7 147Torrington, CT Micropolitan Statistical Area 778 416.2 112Traverse City, MI Micropolitan Statistical Area 466 318.4 287Trenton, NJ Metropolitan Statistical Area 1,772 478.4 32Tucson, AZ Metropolitan Statistical Area 4,574 459.0 46Tullahoma-Manchester, TN Micropolitan Statistical Area 304 301.6 323Tulsa, OK Metropolitan Statistical Area 3,507 364.7 204Tupelo, MS Micropolitan Statistical Area 627 448.9 62Tuscaloosa, AL Metropolitan Statistical Area 875 371.3 192Twin Falls, ID Micropolitan Statistical Area 315 307.4 307Tyler, TX Metropolitan Statistical Area 800 370.2 193Urban Honolulu, HI Metropolitan Statistical Area 3,394 345.1 244Utica-Rome, NY Metropolitan Statistical Area 1,015 340.9 251Valdosta, GA Metropolitan Statistical Area 446 312.1 296Vallejo-Fairfield, CA Metropolitan Statistical Area 1,964 462.3 43Vineland-Bridgeton, NJ Metropolitan Statistical Area 491 312.1 296Virginia Beach-Norfolk-Newport News, VA-NC Metropolitan Statistical Area 7,890 462.1 44
Visalia-Porterville, CA Metropolitan Statistical Area 1,064 234.3 372Waco, TX Metropolitan Statistical Area 783 302.3 321Warner Robins, GA Metropolitan Statistical Area 697 374.3 188Washington-Arlington-Alexandria, DC-VA-MD-WV Metropolitan Statistical Area 35,864 602.8 8Waterloo-Cedar Falls, IA Metropolitan Statistical Area 490 289.1 332Watertown-Fort Drum, NY Metropolitan Statistical Area 461 385.8 165Wausau, WI Metropolitan Statistical Area 463 341.9 250Weirton-Steubenville, WV-OH Metropolitan Statistical Area 796 652.5 4Wenatchee, WA Metropolitan Statistical Area 326 287.4 334Wheeling, WV-OH Metropolitan Statistical Area 447 306.7 309Whitewater-Elkhorn, WI Micropolitan Statistical Area 338 328.3 274Wichita Falls, TX Metropolitan Statistical Area 568 375.7 185Wichita, KS Metropolitan Statistical Area 2,025 317.7 290Williamsport, PA Metropolitan Statistical Area 440 376.9 183Wilmington, NC Metropolitan Statistical Area 1,046 389.4 156Winchester, VA-WV Metropolitan Statistical Area 625 473.6 33Winston-Salem, NC Metropolitan Statistical Area 2,369 364.0 205Wooster, OH Micropolitan Statistical Area 414 359.8 218Worcester, MA-CT Metropolitan Statistical Area 3,451 372.4 191Yakima, WA Metropolitan Statistical Area 654 264.7 358York-Hanover, PA Metropolitan Statistical Area 1,824 415.5 114Youngstown-Warren-Boardman, OH-PA Metropolitan Statistical Area 2,178 392.1 149Yuba City, CA Metropolitan Statistical Area 511 302.9 320Yuma, AZ Metropolitan Statistical Area 459 228.1 375
Appendix D1: Fraud and Other Consumer Complaints by Largest Metropolitan Areas (in alphabetical order)1
January 1 – December 31, 2014
1This chart illustrates Metropolitan Areas (Metropolitan and Micropolitan Statistical Areas) with a population of one hundred thousand or more. Ranking is based on the number of fraud and other complaints per 100,000 inhabitants for each Metropolitan Area. Metropolitan Areas presented here are those defined by the Office of Management and Budget as of February 2013 and per 100,000 unit of population estimates are based on the 2013 U.S. Census population estimates (Table GCT-PEPANNRES-Geography-United States: Annual Estimates of the Resident Population: April 1, 2010 to July 1, 2013 - United States -- Metropolitan and Micropolitan Statistical Area; and for Puerto Rico).
Note: In calculating the State and Metropolitan Areas rankings, we excluded 20 state-specific data contributors’ complaints (the Hawaii Office of Consumer Protection, the Montana, North Carolina and Oregon Departments of Justice, the South Carolina Department of Consumer Affairs, the Tennessee Division of Consumer Affairs, and the Offices of the Attorneys General for Alaska, California, Colorado, Idaho, Indiana, Iowa, Louisiana, Maine, Massachusetts, Michigan, Mississippi, Nevada, Ohio and Washington).
Federal Trade Commission Page 94 of 102 Released February 2015
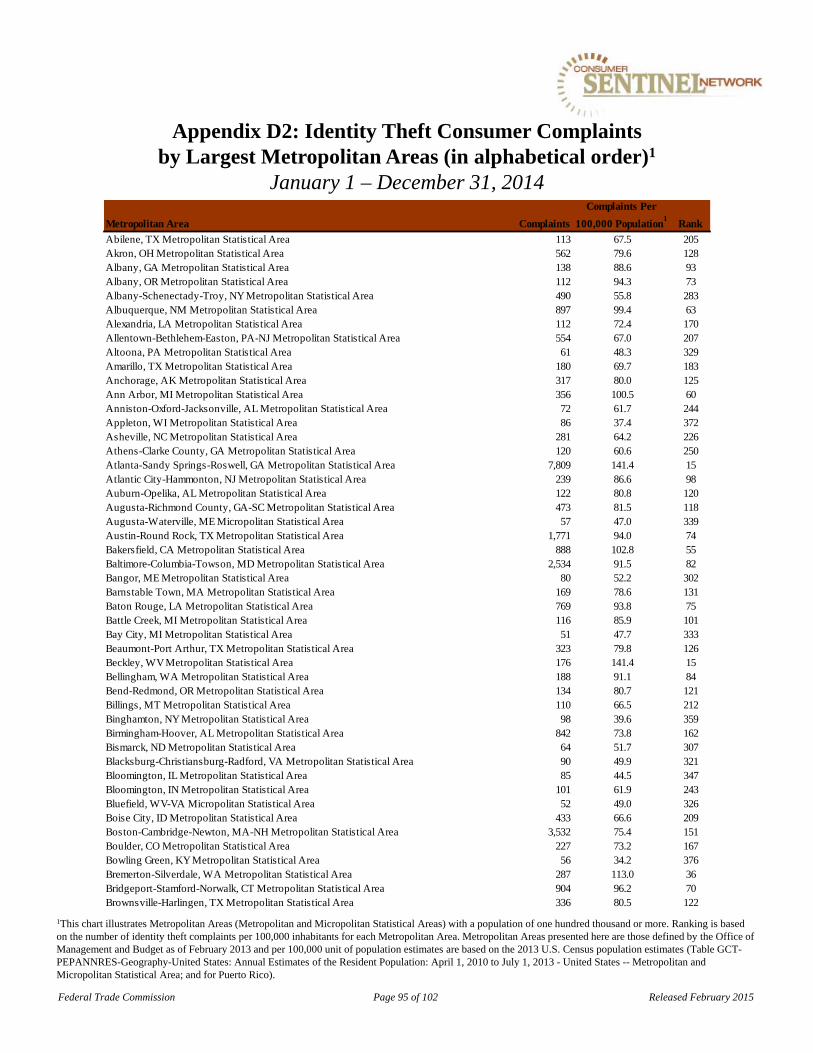
Metropolitan Area Complaints
Complaints Per
100,000 Population1
Rank
Abilene, TX Metropolitan Statistical Area 113 67.5 205Akron, OH Metropolitan Statistical Area 562 79.6 128Albany, GA Metropolitan Statistical Area 138 88.6 93Albany, OR Metropolitan Statistical Area 112 94.3 73Albany-Schenectady-Troy, NY Metropolitan Statistical Area 490 55.8 283Albuquerque, NM Metropolitan Statistical Area 897 99.4 63Alexandria, LA Metropolitan Statistical Area 112 72.4 170Allentown-Bethlehem-Easton, PA-NJ Metropolitan Statistical Area 554 67.0 207Altoona, PA Metropolitan Statistical Area 61 48.3 329Amarillo, TX Metropolitan Statistical Area 180 69.7 183Anchorage, AK Metropolitan Statistical Area 317 80.0 125Ann Arbor, MI Metropolitan Statistical Area 356 100.5 60Anniston-Oxford-Jacksonville, AL Metropolitan Statistical Area 72 61.7 244Appleton, WI Metropolitan Statistical Area 86 37.4 372Asheville, NC Metropolitan Statistical Area 281 64.2 226Athens-Clarke County, GA Metropolitan Statistical Area 120 60.6 250Atlanta-Sandy Springs-Roswell, GA Metropolitan Statistical Area 7,809 141.4 15Atlantic City-Hammonton, NJ Metropolitan Statistical Area 239 86.6 98Auburn-Opelika, AL Metropolitan Statistical Area 122 80.8 120Augusta-Richmond County, GA-SC Metropolitan Statistical Area 473 81.5 118Augusta-Waterville, ME Micropolitan Statistical Area 57 47.0 339Austin-Round Rock, TX Metropolitan Statistical Area 1,771 94.0 74Bakersfield, CA Metropolitan Statistical Area 888 102.8 55Baltimore-Columbia-Towson, MD Metropolitan Statistical Area 2,534 91.5 82Bangor, ME Metropolitan Statistical Area 80 52.2 302Barnstable Town, MA Metropolitan Statistical Area 169 78.6 131Baton Rouge, LA Metropolitan Statistical Area 769 93.8 75Battle Creek, MI Metropolitan Statistical Area 116 85.9 101Bay City, MI Metropolitan Statistical Area 51 47.7 333Beaumont-Port Arthur, TX Metropolitan Statistical Area 323 79.8 126Beckley, WV Metropolitan Statistical Area 176 141.4 15Bellingham, WA Metropolitan Statistical Area 188 91.1 84Bend-Redmond, OR Metropolitan Statistical Area 134 80.7 121Billings, MT Metropolitan Statistical Area 110 66.5 212Binghamton, NY Metropolitan Statistical Area 98 39.6 359Birmingham-Hoover, AL Metropolitan Statistical Area 842 73.8 162Bismarck, ND Metropolitan Statistical Area 64 51.7 307Blacksburg-Christiansburg-Radford, VA Metropolitan Statistical Area 90 49.9 321Bloomington, IL Metropolitan Statistical Area 85 44.5 347Bloomington, IN Metropolitan Statistical Area 101 61.9 243Bluefield, WV-VA Micropolitan Statistical Area 52 49.0 326Boise City, ID Metropolitan Statistical Area 433 66.6 209Boston-Cambridge-Newton, MA-NH Metropolitan Statistical Area 3,532 75.4 151Boulder, CO Metropolitan Statistical Area 227 73.2 167Bowling Green, KY Metropolitan Statistical Area 56 34.2 376Bremerton-Silverdale, WA Metropolitan Statistical Area 287 113.0 36Bridgeport-Stamford-Norwalk, CT Metropolitan Statistical Area 904 96.2 70Brownsville-Harlingen, TX Metropolitan Statistical Area 336 80.5 122
Appendix D2: Identity Theft Consumer Complaints by Largest Metropolitan Areas (in alphabetical order)1
January 1 – December 31, 2014
1This chart illustrates Metropolitan Areas (Metropolitan and Micropolitan Statistical Areas) with a population of one hundred thousand or more. Ranking is based on the number of identity theft complaints per 100,000 inhabitants for each Metropolitan Area. Metropolitan Areas presented here are those defined by the Office of Management and Budget as of February 2013 and per 100,000 unit of population estimates are based on the 2013 U.S. Census population estimates (Table GCT-PEPANNRES-Geography-United States: Annual Estimates of the Resident Population: April 1, 2010 to July 1, 2013 - United States -- Metropolitan and Micropolitan Statistical Area; and for Puerto Rico).
Federal Trade Commission Page 95 of 102 Released February 2015

Metropolitan Area Complaints
Complaints Per
100,000 Population1
Rank
Brunswick, GA Metropolitan Statistical Area 74 65.0 220Buffalo-Cheektowaga-Niagara Falls, NY Metropolitan Statistical Area 618 54.5 292Burlington, NC Metropolitan Statistical Area 111 71.9 173Burlington-South Burlington, VT Metropolitan Statistical Area 161 75.0 154California-Lexington Park, MD Metropolitan Statistical Area 104 94.9 72Canton-Massillon, OH Metropolitan Statistical Area 270 66.9 208Cape Coral-Fort Myers, FL Metropolitan Statistical Area 988 149.4 11Carbondale-Marion, IL Metropolitan Statistical Area 73 57.6 271Cedar Rapids, IA Metropolitan Statistical Area 150 57.2 273Chambersburg-Waynesboro, PA Metropolitan Statistical Area 72 47.3 337Champaign-Urbana, IL Metropolitan Statistical Area 125 53.2 297Charleston, WV Metropolitan Statistical Area 130 57.8 268Charleston-North Charleston, SC Metropolitan Statistical Area 640 89.9 90Charlotte-Concord-Gastonia, NC-SC Metropolitan Statistical Area 2,022 86.6 98Charlottesville, VA Metropolitan Statistical Area 109 48.6 327Chattanooga, TN-GA Metropolitan Statistical Area 352 65.0 220Chicago-Naperville-Elgin, IL-IN-WI Metropolitan Statistical Area 9,992 104.8 48Chico, CA Metropolitan Statistical Area 212 95.5 71Cincinnati, OH-KY-IN Metropolitan Statistical Area 1,469 68.7 196Claremont-Lebanon, NH-VT Micropolitan Statistical Area 113 51.9 303Clarksville, TN-KY Metropolitan Statistical Area 172 63.1 234Cleveland, TN Metropolitan Statistical Area 71 59.9 256Cleveland-Elyria, OH Metropolitan Statistical Area 2,155 104.4 50Coeur d'Alene, ID Metropolitan Statistical Area 89 61.7 244College Station-Bryan, TX Metropolitan Statistical Area 163 68.8 195Colorado Springs, CO Metropolitan Statistical Area 660 97.3 67Columbia, MO Metropolitan Statistical Area 103 60.3 252Columbia, SC Metropolitan Statistical Area 619 78.0 137Columbus, GA-AL Metropolitan Statistical Area 404 127.6 22Columbus, OH Metropolitan Statistical Area 1,508 76.7 145Concord, NH Micropolitan Statistical Area 85 57.9 267Cookeville, TN Micropolitan Statistical Area 59 55.1 290Corpus Christi, TX Metropolitan Statistical Area 373 84.3 107Crestview-Fort Walton Beach-Destin, FL Metropolitan Statistical Area 217 85.6 103Cumberland, MD-WV Metropolitan Statistical Area 38 37.5 370Dallas-Fort Worth-Arlington, TX Metropolitan Statistical Area 8,158 119.8 27Dalton, GA Metropolitan Statistical Area 68 47.8 332Danville, VA Micropolitan Statistical Area 63 59.8 257Daphne-Fairhope-Foley, AL Metropolitan Statistical Area 182 93.1 77Davenport-Moline-Rock Island, IA-IL Metropolitan Statistical Area 193 50.3 317Dayton, OH Metropolitan Statistical Area 823 102.6 56Decatur, AL Metropolitan Statistical Area 77 50.2 318Decatur, IL Metropolitan Statistical Area 65 59.5 259Deltona-Daytona Beach-Ormond Beach, FL Metropolitan Statistical Area 769 128.0 21Denver-Aurora-Lakewood, CO Metropolitan Statistical Area 2,440 90.5 87Des Moines-West Des Moines, IA Metropolitan Statistical Area 316 52.7 300Detroit-Warren-Dearborn, MI Metropolitan Statistical Area 6,522 151.9 10Dothan, AL Metropolitan Statistical Area 167 113.1 35
Appendix D2: Identity Theft Consumer Complaints by Largest Metropolitan Areas (in alphabetical order)1
January 1 – December 31, 2014
1This chart illustrates Metropolitan Areas (Metropolitan and Micropolitan Statistical Areas) with a population of one hundred thousand or more. Ranking is based on the number of identity theft complaints per 100,000 inhabitants for each Metropolitan Area. Metropolitan Areas presented here are those defined by the Office of Management and Budget as of February 2013 and per 100,000 unit of population estimates are based on the 2013 U.S. Census population estimates (Table GCT-PEPANNRES-Geography-United States: Annual Estimates of the Resident Population: April 1, 2010 to July 1, 2013 - United States -- Metropolitan and Micropolitan Statistical Area; and for Puerto Rico).
Federal Trade Commission Page 96 of 102 Released February 2015

Metropolitan Area Complaints
Complaints Per
100,000 Population1
Rank
Dover, DE Metropolitan Statistical Area 139 82.0 115Duluth, MN-WI Metropolitan Statistical Area 156 55.7 284Dunn, NC Micropolitan Statistical Area 75 60.0 254Durham-Chapel Hill, NC Metropolitan Statistical Area 475 88.9 92East Stroudsburg, PA Metropolitan Statistical Area 81 48.5 328Eau Claire, WI Metropolitan Statistical Area 56 34.0 377El Centro, CA Metropolitan Statistical Area 109 61.7 244El Paso, TX Metropolitan Statistical Area 614 73.9 159Elizabethtown-Fort Knox, KY Metropolitan Statistical Area 110 72.6 169Elkhart-Goshen, IN Metropolitan Statistical Area 114 56.8 275Erie, PA Metropolitan Statistical Area 163 58.2 265Eugene, OR Metropolitan Statistical Area 290 81.4 119Eureka-Arcata-Fortuna, CA Micropolitan Statistical Area 91 67.7 204Evansville, IN-KY Metropolitan Statistical Area 156 49.6 323Fairbanks, AK Metropolitan Statistical Area 75 74.7 155Fargo, ND-MN Metropolitan Statistical Area 86 38.5 364Farmington, NM Metropolitan Statistical Area 47 37.2 374Fayetteville, NC Metropolitan Statistical Area 334 88.5 94Fayetteville-Springdale-Rogers, AR-MO Metropolitan Statistical Area 251 51.0 311Flagstaff, AZ Metropolitan Statistical Area 75 54.9 291Flint, MI Metropolitan Statistical Area 482 116.0 31Florence, SC Metropolitan Statistical Area 153 74.2 158Florence-Muscle Shoals, AL Metropolitan Statistical Area 68 46.2 342Fond du Lac, WI Metropolitan Statistical Area 40 39.3 360Fort Collins, CO Metropolitan Statistical Area 206 65.2 218Fort Smith, AR-OK Metropolitan Statistical Area 168 60.0 254Fort Wayne, IN Metropolitan Statistical Area 326 76.9 142Fresno, CA Metropolitan Statistical Area 1,121 117.3 30Gadsden, AL Metropolitan Statistical Area 75 72.2 171Gainesville, FL Metropolitan Statistical Area 312 115.4 32Gainesville, GA Metropolitan Statistical Area 130 69.2 189Gettysburg, PA Metropolitan Statistical Area 55 54.2 293Glens Falls, NY Metropolitan Statistical Area 54 42.0 353Goldsboro, NC Metropolitan Statistical Area 85 68.2 200Grand Forks, ND-MN Metropolitan Statistical Area 32 31.8 379Grand Junction, CO Metropolitan Statistical Area 76 51.5 309Grand Rapids-Wyoming, MI Metropolitan Statistical Area 571 56.2 280Greeley, CO Metropolitan Statistical Area 210 77.8 139Green Bay, WI Metropolitan Statistical Area 147 47.1 338Greensboro-High Point, NC Metropolitan Statistical Area 545 73.5 166Greenville, NC Metropolitan Statistical Area 111 63.7 231Greenville-Anderson-Mauldin, SC Metropolitan Statistical Area 708 83.2 110Gulfport-Biloxi-Pascagoula, MS Metropolitan Statistical Area 238 62.2 241Hagerstown-Martinsburg, MD-WV Metropolitan Statistical Area 162 62.7 237Hammond, LA Metropolitan Statistical Area 59 47.0 339Hanford-Corcoran, CA Metropolitan Statistical Area 104 68.9 192Harrisburg-Carlisle, PA Metropolitan Statistical Area 402 72.1 172Harrisonburg, VA Metropolitan Statistical Area 49 37.9 368
Appendix D2: Identity Theft Consumer Complaints by Largest Metropolitan Areas (in alphabetical order)1
January 1 – December 31, 2014
1This chart illustrates Metropolitan Areas (Metropolitan and Micropolitan Statistical Areas) with a population of one hundred thousand or more. Ranking is based on the number of identity theft complaints per 100,000 inhabitants for each Metropolitan Area. Metropolitan Areas presented here are those defined by the Office of Management and Budget as of February 2013 and per 100,000 unit of population estimates are based on the 2013 U.S. Census population estimates (Table GCT-PEPANNRES-Geography-United States: Annual Estimates of the Resident Population: April 1, 2010 to July 1, 2013 - United States -- Metropolitan and Micropolitan Statistical Area; and for Puerto Rico).
Federal Trade Commission Page 97 of 102 Released February 2015
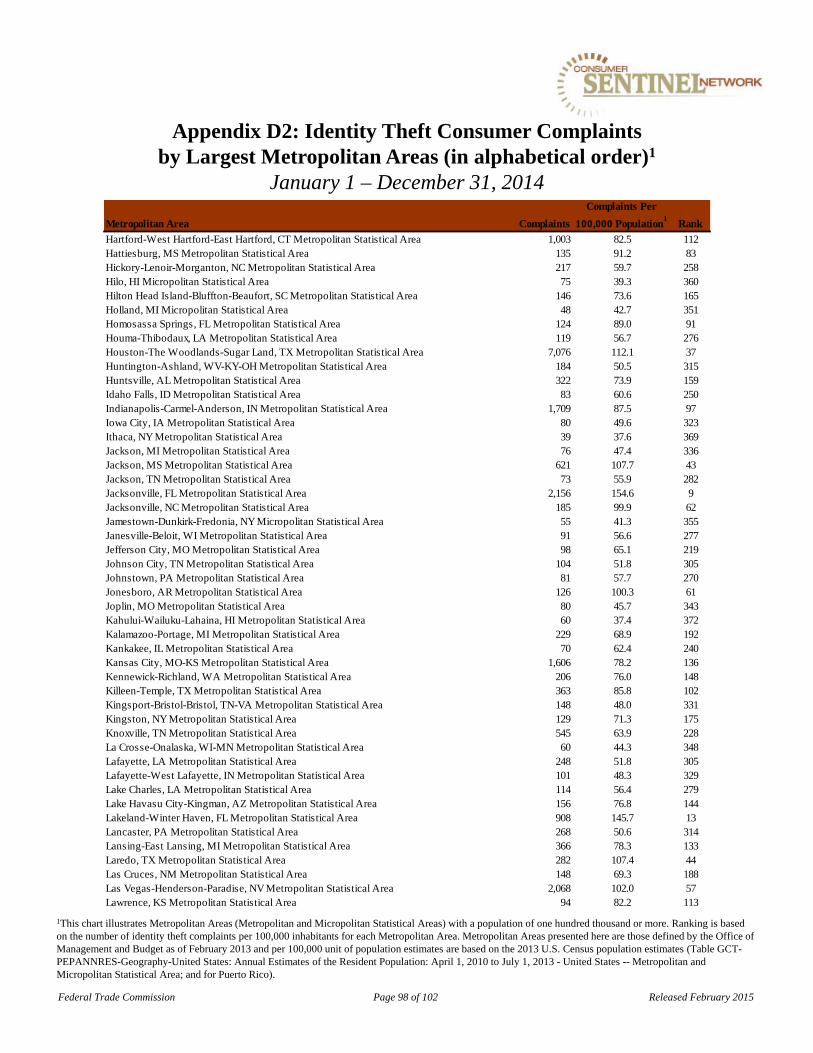
Metropolitan Area Complaints
Complaints Per
100,000 Population1
Rank
Hartford-West Hartford-East Hartford, CT Metropolitan Statistical Area 1,003 82.5 112Hattiesburg, MS Metropolitan Statistical Area 135 91.2 83Hickory-Lenoir-Morganton, NC Metropolitan Statistical Area 217 59.7 258Hilo, HI Micropolitan Statistical Area 75 39.3 360Hilton Head Island-Bluffton-Beaufort, SC Metropolitan Statistical Area 146 73.6 165Holland, MI Micropolitan Statistical Area 48 42.7 351Homosassa Springs, FL Metropolitan Statistical Area 124 89.0 91Houma-Thibodaux, LA Metropolitan Statistical Area 119 56.7 276Houston-The Woodlands-Sugar Land, TX Metropolitan Statistical Area 7,076 112.1 37Huntington-Ashland, WV-KY-OH Metropolitan Statistical Area 184 50.5 315Huntsville, AL Metropolitan Statistical Area 322 73.9 159Idaho Falls, ID Metropolitan Statistical Area 83 60.6 250Indianapolis-Carmel-Anderson, IN Metropolitan Statistical Area 1,709 87.5 97Iowa City, IA Metropolitan Statistical Area 80 49.6 323Ithaca, NY Metropolitan Statistical Area 39 37.6 369Jackson, MI Metropolitan Statistical Area 76 47.4 336Jackson, MS Metropolitan Statistical Area 621 107.7 43Jackson, TN Metropolitan Statistical Area 73 55.9 282Jacksonville, FL Metropolitan Statistical Area 2,156 154.6 9Jacksonville, NC Metropolitan Statistical Area 185 99.9 62Jamestown-Dunkirk-Fredonia, NY Micropolitan Statistical Area 55 41.3 355Janesville-Beloit, WI Metropolitan Statistical Area 91 56.6 277Jefferson City, MO Metropolitan Statistical Area 98 65.1 219Johnson City, TN Metropolitan Statistical Area 104 51.8 305Johnstown, PA Metropolitan Statistical Area 81 57.7 270Jonesboro, AR Metropolitan Statistical Area 126 100.3 61Joplin, MO Metropolitan Statistical Area 80 45.7 343Kahului-Wailuku-Lahaina, HI Metropolitan Statistical Area 60 37.4 372Kalamazoo-Portage, MI Metropolitan Statistical Area 229 68.9 192Kankakee, IL Metropolitan Statistical Area 70 62.4 240Kansas City, MO-KS Metropolitan Statistical Area 1,606 78.2 136Kennewick-Richland, WA Metropolitan Statistical Area 206 76.0 148Killeen-Temple, TX Metropolitan Statistical Area 363 85.8 102Kingsport-Bristol-Bristol, TN-VA Metropolitan Statistical Area 148 48.0 331Kingston, NY Metropolitan Statistical Area 129 71.3 175Knoxville, TN Metropolitan Statistical Area 545 63.9 228La Crosse-Onalaska, WI-MN Metropolitan Statistical Area 60 44.3 348Lafayette, LA Metropolitan Statistical Area 248 51.8 305Lafayette-West Lafayette, IN Metropolitan Statistical Area 101 48.3 329Lake Charles, LA Metropolitan Statistical Area 114 56.4 279Lake Havasu City-Kingman, AZ Metropolitan Statistical Area 156 76.8 144Lakeland-Winter Haven, FL Metropolitan Statistical Area 908 145.7 13Lancaster, PA Metropolitan Statistical Area 268 50.6 314Lansing-East Lansing, MI Metropolitan Statistical Area 366 78.3 133Laredo, TX Metropolitan Statistical Area 282 107.4 44Las Cruces, NM Metropolitan Statistical Area 148 69.3 188Las Vegas-Henderson-Paradise, NV Metropolitan Statistical Area 2,068 102.0 57Lawrence, KS Metropolitan Statistical Area 94 82.2 113
Appendix D2: Identity Theft Consumer Complaints by Largest Metropolitan Areas (in alphabetical order)1
January 1 – December 31, 2014
1This chart illustrates Metropolitan Areas (Metropolitan and Micropolitan Statistical Areas) with a population of one hundred thousand or more. Ranking is based on the number of identity theft complaints per 100,000 inhabitants for each Metropolitan Area. Metropolitan Areas presented here are those defined by the Office of Management and Budget as of February 2013 and per 100,000 unit of population estimates are based on the 2013 U.S. Census population estimates (Table GCT-PEPANNRES-Geography-United States: Annual Estimates of the Resident Population: April 1, 2010 to July 1, 2013 - United States -- Metropolitan and Micropolitan Statistical Area; and for Puerto Rico).
Federal Trade Commission Page 98 of 102 Released February 2015
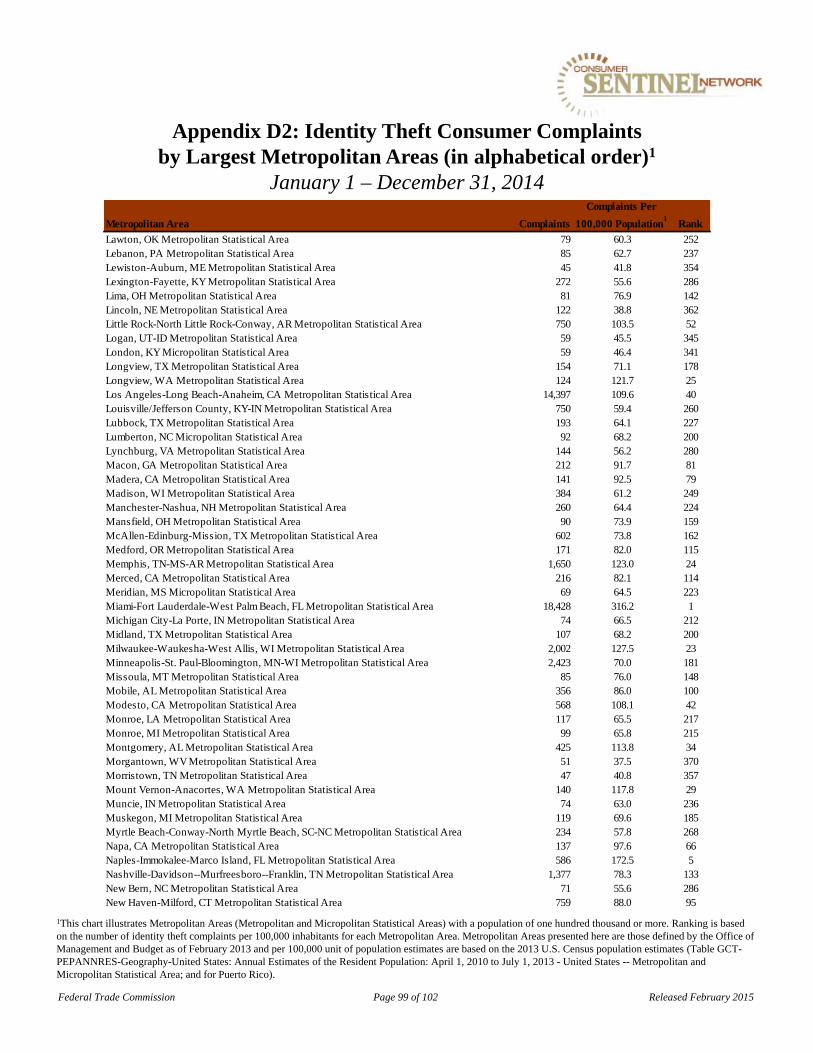
Metropolitan Area Complaints
Complaints Per
100,000 Population1
Rank
Lawton, OK Metropolitan Statistical Area 79 60.3 252Lebanon, PA Metropolitan Statistical Area 85 62.7 237Lewiston-Auburn, ME Metropolitan Statistical Area 45 41.8 354Lexington-Fayette, KY Metropolitan Statistical Area 272 55.6 286Lima, OH Metropolitan Statistical Area 81 76.9 142Lincoln, NE Metropolitan Statistical Area 122 38.8 362Little Rock-North Little Rock-Conway, AR Metropolitan Statistical Area 750 103.5 52Logan, UT-ID Metropolitan Statistical Area 59 45.5 345London, KY Micropolitan Statistical Area 59 46.4 341Longview, TX Metropolitan Statistical Area 154 71.1 178Longview, WA Metropolitan Statistical Area 124 121.7 25Los Angeles-Long Beach-Anaheim, CA Metropolitan Statistical Area 14,397 109.6 40Louisville/Jefferson County, KY-IN Metropolitan Statistical Area 750 59.4 260Lubbock, TX Metropolitan Statistical Area 193 64.1 227Lumberton, NC Micropolitan Statistical Area 92 68.2 200Lynchburg, VA Metropolitan Statistical Area 144 56.2 280Macon, GA Metropolitan Statistical Area 212 91.7 81Madera, CA Metropolitan Statistical Area 141 92.5 79Madison, WI Metropolitan Statistical Area 384 61.2 249Manchester-Nashua, NH Metropolitan Statistical Area 260 64.4 224Mansfield, OH Metropolitan Statistical Area 90 73.9 159McAllen-Edinburg-Mission, TX Metropolitan Statistical Area 602 73.8 162Medford, OR Metropolitan Statistical Area 171 82.0 115Memphis, TN-MS-AR Metropolitan Statistical Area 1,650 123.0 24Merced, CA Metropolitan Statistical Area 216 82.1 114Meridian, MS Micropolitan Statistical Area 69 64.5 223Miami-Fort Lauderdale-West Palm Beach, FL Metropolitan Statistical Area 18,428 316.2 1Michigan City-La Porte, IN Metropolitan Statistical Area 74 66.5 212Midland, TX Metropolitan Statistical Area 107 68.2 200Milwaukee-Waukesha-West Allis, WI Metropolitan Statistical Area 2,002 127.5 23Minneapolis-St. Paul-Bloomington, MN-WI Metropolitan Statistical Area 2,423 70.0 181Missoula, MT Metropolitan Statistical Area 85 76.0 148Mobile, AL Metropolitan Statistical Area 356 86.0 100Modesto, CA Metropolitan Statistical Area 568 108.1 42Monroe, LA Metropolitan Statistical Area 117 65.5 217Monroe, MI Metropolitan Statistical Area 99 65.8 215Montgomery, AL Metropolitan Statistical Area 425 113.8 34Morgantown, WV Metropolitan Statistical Area 51 37.5 370Morristown, TN Metropolitan Statistical Area 47 40.8 357Mount Vernon-Anacortes, WA Metropolitan Statistical Area 140 117.8 29Muncie, IN Metropolitan Statistical Area 74 63.0 236Muskegon, MI Metropolitan Statistical Area 119 69.6 185Myrtle Beach-Conway-North Myrtle Beach, SC-NC Metropolitan Statistical Area 234 57.8 268Napa, CA Metropolitan Statistical Area 137 97.6 66Naples-Immokalee-Marco Island, FL Metropolitan Statistical Area 586 172.5 5Nashville-Davidson--Murfreesboro--Franklin, TN Metropolitan Statistical Area 1,377 78.3 133New Bern, NC Metropolitan Statistical Area 71 55.6 286New Haven-Milford, CT Metropolitan Statistical Area 759 88.0 95
Appendix D2: Identity Theft Consumer Complaints by Largest Metropolitan Areas (in alphabetical order)1
January 1 – December 31, 2014
1This chart illustrates Metropolitan Areas (Metropolitan and Micropolitan Statistical Areas) with a population of one hundred thousand or more. Ranking is based on the number of identity theft complaints per 100,000 inhabitants for each Metropolitan Area. Metropolitan Areas presented here are those defined by the Office of Management and Budget as of February 2013 and per 100,000 unit of population estimates are based on the 2013 U.S. Census population estimates (Table GCT-PEPANNRES-Geography-United States: Annual Estimates of the Resident Population: April 1, 2010 to July 1, 2013 - United States -- Metropolitan and Micropolitan Statistical Area; and for Puerto Rico).
Federal Trade Commission Page 99 of 102 Released February 2015
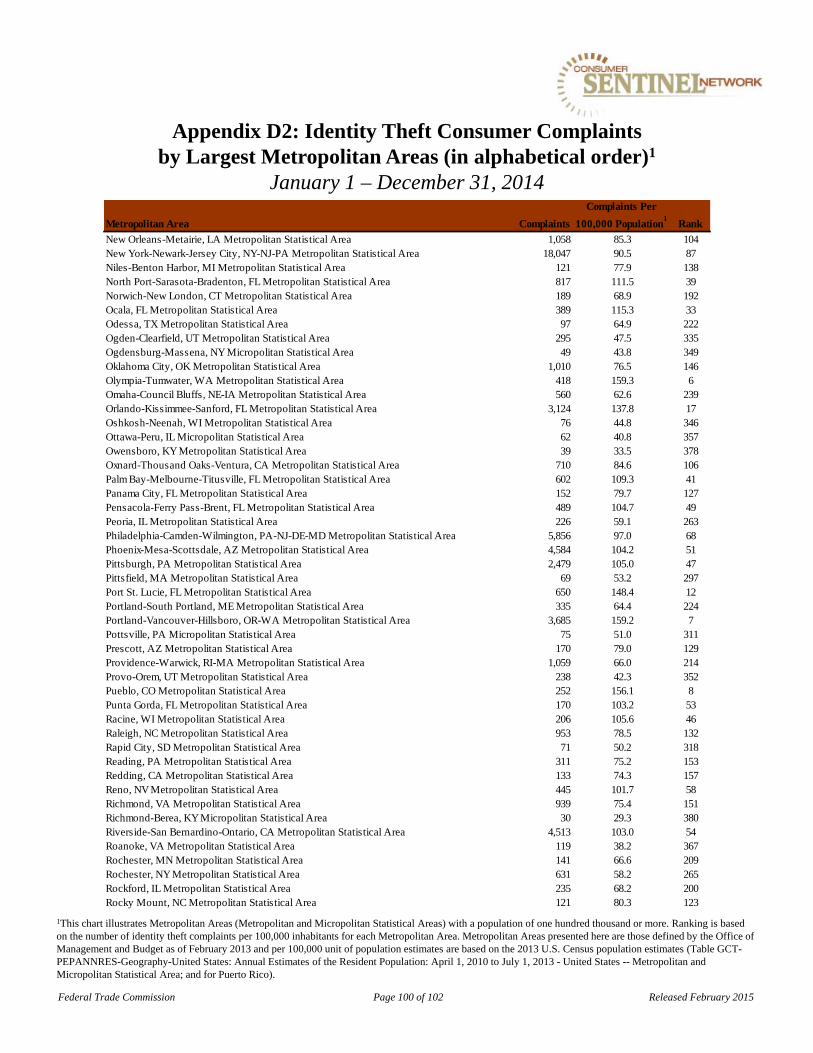
Metropolitan Area Complaints
Complaints Per
100,000 Population1
Rank
New Orleans-Metairie, LA Metropolitan Statistical Area 1,058 85.3 104New York-Newark-Jersey City, NY-NJ-PA Metropolitan Statistical Area 18,047 90.5 87Niles-Benton Harbor, MI Metropolitan Statistical Area 121 77.9 138North Port-Sarasota-Bradenton, FL Metropolitan Statistical Area 817 111.5 39Norwich-New London, CT Metropolitan Statistical Area 189 68.9 192Ocala, FL Metropolitan Statistical Area 389 115.3 33Odessa, TX Metropolitan Statistical Area 97 64.9 222Ogden-Clearfield, UT Metropolitan Statistical Area 295 47.5 335Ogdensburg-Massena, NY Micropolitan Statistical Area 49 43.8 349Oklahoma City, OK Metropolitan Statistical Area 1,010 76.5 146Olympia-Tumwater, WA Metropolitan Statistical Area 418 159.3 6Omaha-Council Bluffs, NE-IA Metropolitan Statistical Area 560 62.6 239Orlando-Kissimmee-Sanford, FL Metropolitan Statistical Area 3,124 137.8 17Oshkosh-Neenah, WI Metropolitan Statistical Area 76 44.8 346Ottawa-Peru, IL Micropolitan Statistical Area 62 40.8 357Owensboro, KY Metropolitan Statistical Area 39 33.5 378Oxnard-Thousand Oaks-Ventura, CA Metropolitan Statistical Area 710 84.6 106Palm Bay-Melbourne-Titusville, FL Metropolitan Statistical Area 602 109.3 41Panama City, FL Metropolitan Statistical Area 152 79.7 127Pensacola-Ferry Pass-Brent, FL Metropolitan Statistical Area 489 104.7 49Peoria, IL Metropolitan Statistical Area 226 59.1 263Philadelphia-Camden-Wilmington, PA-NJ-DE-MD Metropolitan Statistical Area 5,856 97.0 68Phoenix-Mesa-Scottsdale, AZ Metropolitan Statistical Area 4,584 104.2 51Pittsburgh, PA Metropolitan Statistical Area 2,479 105.0 47Pittsfield, MA Metropolitan Statistical Area 69 53.2 297Port St. Lucie, FL Metropolitan Statistical Area 650 148.4 12Portland-South Portland, ME Metropolitan Statistical Area 335 64.4 224Portland-Vancouver-Hillsboro, OR-WA Metropolitan Statistical Area 3,685 159.2 7Pottsville, PA Micropolitan Statistical Area 75 51.0 311Prescott, AZ Metropolitan Statistical Area 170 79.0 129Providence-Warwick, RI-MA Metropolitan Statistical Area 1,059 66.0 214Provo-Orem, UT Metropolitan Statistical Area 238 42.3 352Pueblo, CO Metropolitan Statistical Area 252 156.1 8Punta Gorda, FL Metropolitan Statistical Area 170 103.2 53Racine, WI Metropolitan Statistical Area 206 105.6 46Raleigh, NC Metropolitan Statistical Area 953 78.5 132Rapid City, SD Metropolitan Statistical Area 71 50.2 318Reading, PA Metropolitan Statistical Area 311 75.2 153Redding, CA Metropolitan Statistical Area 133 74.3 157Reno, NV Metropolitan Statistical Area 445 101.7 58Richmond, VA Metropolitan Statistical Area 939 75.4 151Richmond-Berea, KY Micropolitan Statistical Area 30 29.3 380Riverside-San Bernardino-Ontario, CA Metropolitan Statistical Area 4,513 103.0 54Roanoke, VA Metropolitan Statistical Area 119 38.2 367Rochester, MN Metropolitan Statistical Area 141 66.6 209Rochester, NY Metropolitan Statistical Area 631 58.2 265Rockford, IL Metropolitan Statistical Area 235 68.2 200Rocky Mount, NC Metropolitan Statistical Area 121 80.3 123
Appendix D2: Identity Theft Consumer Complaints by Largest Metropolitan Areas (in alphabetical order)1
January 1 – December 31, 2014
1This chart illustrates Metropolitan Areas (Metropolitan and Micropolitan Statistical Areas) with a population of one hundred thousand or more. Ranking is based on the number of identity theft complaints per 100,000 inhabitants for each Metropolitan Area. Metropolitan Areas presented here are those defined by the Office of Management and Budget as of February 2013 and per 100,000 unit of population estimates are based on the 2013 U.S. Census population estimates (Table GCT-PEPANNRES-Geography-United States: Annual Estimates of the Resident Population: April 1, 2010 to July 1, 2013 - United States -- Metropolitan and Micropolitan Statistical Area; and for Puerto Rico).
Federal Trade Commission Page 100 of 102 Released February 2015

Metropolitan Area Complaints
Complaints Per
100,000 Population1
Rank
Roseburg, OR Micropolitan Statistical Area 59 55.2 288Sacramento--Roseville--Arden-Arcade, CA Metropolitan Statistical Area 2,198 99.2 65Saginaw, MI Metropolitan Statistical Area 163 82.9 111Salem, OH Micropolitan Statistical Area 55 51.9 303Salem, OR Metropolitan Statistical Area 567 141.6 14Salinas, CA Metropolitan Statistical Area 296 69.0 191Salisbury, MD-DE Metropolitan Statistical Area 229 59.4 260Salt Lake City, UT Metropolitan Statistical Area 770 67.5 205San Angelo, TX Metropolitan Statistical Area 51 43.8 349San Antonio-New Braunfels, TX Metropolitan Statistical Area 2,128 93.4 76San Diego-Carlsbad, CA Metropolitan Statistical Area 2,814 87.6 96San Francisco-Oakland-Hayward, CA Metropolitan Statistical Area 5,060 112.0 38San Jose-Sunnyvale-Santa Clara, CA Metropolitan Statistical Area 1,628 84.8 105San Luis Obispo-Paso Robles-Arroyo Grande, CA Metropolitan Statistical Area 197 71.3 175Santa Cruz-Watsonville, CA Metropolitan Statistical Area 209 77.6 141Santa Fe, NM Metropolitan Statistical Area 134 90.9 86Santa Maria-Santa Barbara, CA Metropolitan Statistical Area 299 68.6 198Santa Rosa, CA Metropolitan Statistical Area 361 72.9 168Savannah, GA Metropolitan Statistical Area 337 92.1 80Scranton--Wilkes-Barre--Hazleton, PA Metropolitan Statistical Area 310 55.2 288Seattle-Tacoma-Bellevue, WA Metropolitan Statistical Area 7,473 207.0 2Sebastian-Vero Beach, FL Metropolitan Statistical Area 170 119.7 28Sheboygan, WI Metropolitan Statistical Area 44 38.3 366Sherman-Denison, TX Metropolitan Statistical Area 84 68.7 196Show Low, AZ Micropolitan Statistical Area 58 54.0 294Shreveport-Bossier City, LA Metropolitan Statistical Area 431 96.5 69Sierra Vista-Douglas, AZ Metropolitan Statistical Area 90 69.5 186Sioux City, IA-NE-SD Metropolitan Statistical Area 90 53.3 296Sioux Falls, SD Metropolitan Statistical Area 123 50.5 315South Bend-Mishawaka, IN-MI Metropolitan Statistical Area 202 63.4 233Spartanburg, SC Metropolitan Statistical Area 186 58.3 264Spokane-Spokane Valley, WA Metropolitan Statistical Area 484 90.3 89Springfield, IL Metropolitan Statistical Area 112 52.9 299Springfield, MA Metropolitan Statistical Area 487 77.7 140Springfield, MO Metropolitan Statistical Area 250 55.7 284Springfield, OH Metropolitan Statistical Area 97 71.2 177St. Cloud, MN Metropolitan Statistical Area 66 34.5 375St. George, UT Metropolitan Statistical Area 74 50.1 320St. Joseph, MO-KS Metropolitan Statistical Area 63 49.3 325St. Louis, MO-IL Metropolitan Statistical Area 5,724 204.4 3State College, PA Metropolitan Statistical Area 60 38.6 363Staunton-Waynesboro, VA Metropolitan Statistical Area 46 38.5 364Stockton-Lodi, CA Metropolitan Statistical Area 915 129.9 19Sumter, SC Metropolitan Statistical Area 69 63.8 229Syracuse, NY Metropolitan Statistical Area 315 47.6 334Tallahassee, FL Metropolitan Statistical Area 706 189.1 4Tampa-St. Petersburg-Clearwater, FL Metropolitan Statistical Area 3,956 137.8 17Terre Haute, IN Metropolitan Statistical Area 88 51.1 310
Appendix D2: Identity Theft Consumer Complaints by Largest Metropolitan Areas (in alphabetical order)1
January 1 – December 31, 2014
1This chart illustrates Metropolitan Areas (Metropolitan and Micropolitan Statistical Areas) with a population of one hundred thousand or more. Ranking is based on the number of identity theft complaints per 100,000 inhabitants for each Metropolitan Area. Metropolitan Areas presented here are those defined by the Office of Management and Budget as of February 2013 and per 100,000 unit of population estimates are based on the 2013 U.S. Census population estimates (Table GCT-PEPANNRES-Geography-United States: Annual Estimates of the Resident Population: April 1, 2010 to July 1, 2013 - United States -- Metropolitan and Micropolitan Statistical Area; and for Puerto Rico).
Federal Trade Commission Page 101 of 102 Released February 2015
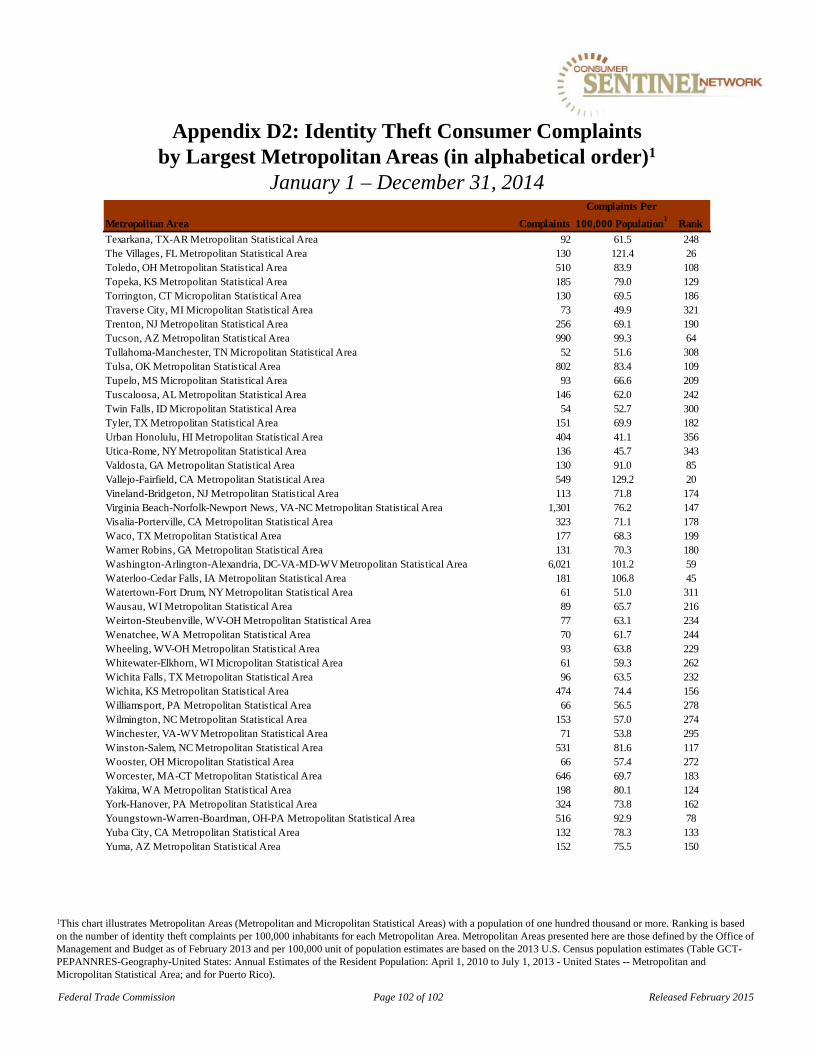
Metropolitan Area Complaints
Complaints Per
100,000 Population1
Rank
Texarkana, TX-AR Metropolitan Statistical Area 92 61.5 248The Villages, FL Metropolitan Statistical Area 130 121.4 26Toledo, OH Metropolitan Statistical Area 510 83.9 108Topeka, KS Metropolitan Statistical Area 185 79.0 129Torrington, CT Micropolitan Statistical Area 130 69.5 186Traverse City, MI Micropolitan Statistical Area 73 49.9 321Trenton, NJ Metropolitan Statistical Area 256 69.1 190Tucson, AZ Metropolitan Statistical Area 990 99.3 64Tullahoma-Manchester, TN Micropolitan Statistical Area 52 51.6 308Tulsa, OK Metropolitan Statistical Area 802 83.4 109Tupelo, MS Micropolitan Statistical Area 93 66.6 209Tuscaloosa, AL Metropolitan Statistical Area 146 62.0 242Twin Falls, ID Micropolitan Statistical Area 54 52.7 300Tyler, TX Metropolitan Statistical Area 151 69.9 182Urban Honolulu, HI Metropolitan Statistical Area 404 41.1 356Utica-Rome, NY Metropolitan Statistical Area 136 45.7 343Valdosta, GA Metropolitan Statistical Area 130 91.0 85Vallejo-Fairfield, CA Metropolitan Statistical Area 549 129.2 20Vineland-Bridgeton, NJ Metropolitan Statistical Area 113 71.8 174Virginia Beach-Norfolk-Newport News, VA-NC Metropolitan Statistical Area 1,301 76.2 147Visalia-Porterville, CA Metropolitan Statistical Area 323 71.1 178Waco, TX Metropolitan Statistical Area 177 68.3 199Warner Robins, GA Metropolitan Statistical Area 131 70.3 180Washington-Arlington-Alexandria, DC-VA-MD-WV Metropolitan Statistical Area 6,021 101.2 59Waterloo-Cedar Falls, IA Metropolitan Statistical Area 181 106.8 45Watertown-Fort Drum, NY Metropolitan Statistical Area 61 51.0 311Wausau, WI Metropolitan Statistical Area 89 65.7 216Weirton-Steubenville, WV-OH Metropolitan Statistical Area 77 63.1 234Wenatchee, WA Metropolitan Statistical Area 70 61.7 244Wheeling, WV-OH Metropolitan Statistical Area 93 63.8 229Whitewater-Elkhorn, WI Micropolitan Statistical Area 61 59.3 262Wichita Falls, TX Metropolitan Statistical Area 96 63.5 232Wichita, KS Metropolitan Statistical Area 474 74.4 156Williamsport, PA Metropolitan Statistical Area 66 56.5 278Wilmington, NC Metropolitan Statistical Area 153 57.0 274Winchester, VA-WV Metropolitan Statistical Area 71 53.8 295Winston-Salem, NC Metropolitan Statistical Area 531 81.6 117Wooster, OH Micropolitan Statistical Area 66 57.4 272Worcester, MA-CT Metropolitan Statistical Area 646 69.7 183Yakima, WA Metropolitan Statistical Area 198 80.1 124York-Hanover, PA Metropolitan Statistical Area 324 73.8 162Youngstown-Warren-Boardman, OH-PA Metropolitan Statistical Area 516 92.9 78Yuba City, CA Metropolitan Statistical Area 132 78.3 133Yuma, AZ Metropolitan Statistical Area 152 75.5 150
Appendix D2: Identity Theft Consumer Complaints by Largest Metropolitan Areas (in alphabetical order)1
January 1 – December 31, 2014
1This chart illustrates Metropolitan Areas (Metropolitan and Micropolitan Statistical Areas) with a population of one hundred thousand or more. Ranking is based on the number of identity theft complaints per 100,000 inhabitants for each Metropolitan Area. Metropolitan Areas presented here are those defined by the Office of Management and Budget as of February 2013 and per 100,000 unit of population estimates are based on the 2013 U.S. Census population estimates (Table GCT-PEPANNRES-Geography-United States: Annual Estimates of the Resident Population: April 1, 2010 to July 1, 2013 - United States -- Metropolitan and Micropolitan Statistical Area; and for Puerto Rico).
Federal Trade Commission Page 102 of 102 Released February 2015

Federal Trade Commission | ftc.gov


![BPATC SCHOOL & COLLEGE · 2019. 7. 23. · Class 840736[3.17-50th] 840737[5.00-2nd] 840738[4.06-26th] 840740[4.56-8th] 840743[4.83-4th] 840751[4.33-13rd] 840761[4.83-3rd] 840764[4.17-21st]](https://static.fdocuments.in/doc/165x107/60a7812b3706154e157cfada/bpatc-school-2019-7-23-class-840736317-50th-840737500-2nd-840738406-26th.jpg)