SENTENCING REFORM IN NORTH CAROLINA Thomas W. Ross.
44
SENTENCING REFORM IN NORTH CAROLINA Thomas W. Ross
-
Upload
maegan-block -
Category
Documents
-
view
218 -
download
4
Transcript of SENTENCING REFORM IN NORTH CAROLINA Thomas W. Ross.

SENTENCING REFORM IN
NORTH CAROLINA
Thomas W. Ross

PROBLEMS IN THE CRIMINAL JUSTICE SYSTEM
• JUDICIAL SENTENCES LOSING MEANING
• FELONS SERVING ONLY A FRACTION OF SENTENCE

40%
25%
18%
12%
0%5%
10%15%20%25%30%35%40%
Per
cen
t S
erve
d
1986 1991* 1993 1998**
Selected Years
PERCENT OF SENTENCE SERVED FOR FELONS
* Sentencing Commission created** Projected with cap and no new prisons

PROBLEMS IN THE CRIMINAL JUSTICE SYSTEM
• JUDICIAL SENTENCES LOSING MEANING• FELONS SERVING ONLY A FRACTION OF
SENTENCE• MISDEMEANORS SPINNING THROUGH SYSTEM• PROBATION VIOLATIONS ESCALATING• OFFENDERS REFUSING ALTERNATIVES TO
PRISON• PUBLIC CONFIDENCE ERODING

THE FIRST STEP
• CREATION OF SENTENCING COMMISSION
• 23 INITIAL MEMBERS
• LEGISLATIVE DIRECTIVES

LEGISLATIVE DIRECTIVES
• CONSTRUCT CORRECTIONAL SIMULATION MODEL
• CLASSIFY CRIMINAL OFFENSES
• RECOMMEND STRUCTURE FOR SENTENCING
• DEVELOP COMPREHENSIVE COMMUNITY CORRECTION STRATEGY
• CONSIDER OTHER POLICY ISSUES
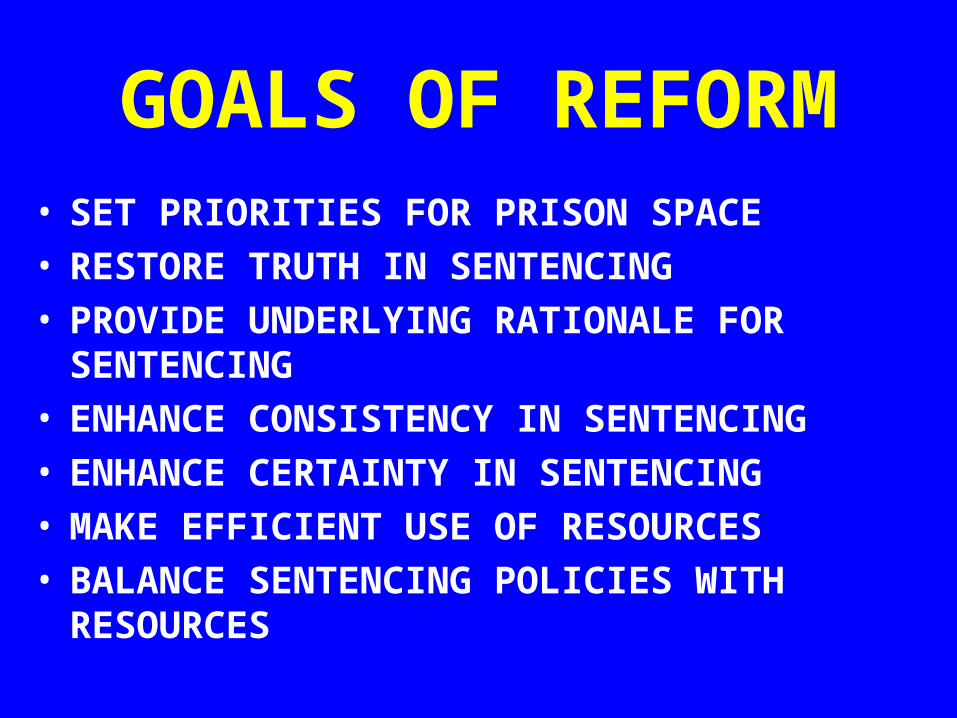
GOALS OF REFORM• SET PRIORITIES FOR PRISON SPACE• RESTORE TRUTH IN SENTENCING• PROVIDE UNDERLYING RATIONALE FOR
SENTENCING• ENHANCE CONSISTENCY IN SENTENCING• ENHANCE CERTAINTY IN SENTENCING• MAKE EFFICIENT USE OF RESOURCES• BALANCE SENTENCING POLICIES WITH
RESOURCES

PROCESS FOLLOWED
• COMPONENTS OF SENTENCING DECISION

COMPONENTS OF STRUCTURED SENTENCING
OFFENSE
STRUCTURE DEFENDANT’S
PRIOR RECORD
DURATION
DISPOSITION

PROCESS FOLLOWED
• COMPONENTS OF SENTENCING DECISION
• SUBCOMMITTEES DEVELOPED PROPOSALS

FELONY CLASSIFICATION CRITERIA*
CLASS CRITERIA
A Reserved for First Degree Murder
[Reasonably tend to result or does result in]: B Serious debilitating long-term personal injury
C Serious long-term personal injury
Serious long-term or widespread societal injury
D Serious infringements on property interest which also implicate physical safety concerns by use of a deadly weapon or an offense involving an occupied dwelling
E Serious personal injury
* Personal injury includes both physical and mental injury. Societal injury includes violations of public morality, judicial or government operations, and/or public order and welfare. Note: The criteria were not used in the classification of the homicide offenses or drug offenses.

FELONY CLASSIFICATION CRITERIA*
CLASS CRITERIA
F Significant personal injury Serious societal injury
G Serious property loss: Loss from the person or from the person’s dwelling
H Serious property loss: Loss from any structure designed to house or secure any activity or property
Loss occasioned by the taking or removing of property Loss occasioned by breach of trust, formal or informal Personal injury Significant societal injury
I Serious property loss: All other felonious property loss
Societal injury
M All other misdemeanors
* Personal injury includes both physical and mental injury. Societal injury includes violations of public morality, judicial or government operations, and/or public order and welfare. Note: The criteria were not used in the classification of the homicide offenses or drug offenses.

COMPONENTS OF STRUCTURED SENTENCING
OFFENSE
STRUCTURE DEFENDANT’S
PRIOR RECORD
DURATION
DISPOSITION

SCORING PRIOR RECORD/FELONY SENTENCING (For offenses committed on or after December 1, 1997)
NUMBER TYPE POINTS
Prior Felony Class A Conviction x 10
Prior Felony Class B1 Conviction x 9
Prior Felony Class B2 or C or D Conviction x 6
Prior Felony Class E or F or G Conviction x 4
Prior Felony Class H or I Conviction x 2
Prior Misdemeanor Class A1 or 1 Conviction*,
Prior Impaired Driving Conviction, or Prior
Impaired Driving in a Commercial Vehicle
Conviction x 1
SUBTOTAL
If all the elements of the present offense are included in any
prior offense, whether or not the prior offense was used in
determining prior record level + 1
If the offense was committed:
(a) while on probation, parole, or post-release supervision; or
(b) while serving a sentence of imprisonment; or
(c) while on escape + 1
TOTAL
*Class 1 misdemeanor offenses under Chapter 20 are not assigned any points except for misdemeanor death by vehicle [G.S. 20-141.4(a)(2)]

CLASSIFYING PRIOR RECORD LEVEL
POINTS LEVEL
0 I
1 – 4 II
5 – 8 III
9 – 14 IV
15 – 18 V
19+ VI
PRIOR RECORD LEVEL _____

FELONY PUNISHMENT CHART
PRIOR RECORD LEVEL
I0 Pts
II1-4 Pts
III5-8 Pts
IV9-14 Pts
V15-18 Pts
VI19+ Pts
A
B1
B2
C
D
E
F
G
H
I
OF
FE
NSE
CL
ASS

COMPONENTS OF STRUCTURED SENTENCING
OFFENSE
STRUCTURE DEFENDANT’S
PRIOR RECORD
DURATION
DISPOSITION

TYPES OF PUNISHMENTS UNDER STRUCTURED SENTENCING
ACTIVE INTERMEDIATE COMMUNITY
Unsupervised Probation Fines Day Fines Treatment Alternatives to
Street Crime (TASC) Outpatient Substance
Abuse and Mental Health Treatment
Victim Restitution Community Service
Work Regular Supervised
Probation
Intensive Supervision Probation
Electronic House
Arrest Day Reporting Center Residential Facility Drug Treatment
Court Split Sentence/Special
Probation
Prison Jail

FELONY PUNISHMENT CHART
PRIOR RECORD LEVEL
I0 Pts
II1-4 Pts
III5-8 Pts
IV9-14 Pts
V15-18 Pts
VI19+ Pts
A Death or Life Without Parole
A A A A A A
B1
A A A A A A
B2
A A A A A A
C
A A A A A A
D
I/A I/A A A A A
E
I/A I/A I/A A A A
F
I/A I/A I/A I/A A A
G
C/I/A I/A I/A I/A I/A A
H
C C/I I I/A I/A I/A
I
Note: A – Active Punishment I – Intermediate Punishment C – Community Punishment* Numbers shown are in months and represent the range of minimum sentences.
OF
FE
NSE
CL
ASS

SOURCE: NC Sentencing and Policy Advisory Commission, FY 2007/08 Felony Statistical Report Data
DISTRIBUTION OF FY 2007/08 CONVICTIONS WITHIN THE FELONY
PUNISHMENT CHART
Prior Record Level Offense Class I
0 Pts II
1-4 Pts III
5-8 Pts IV
9-14 Pts V
15-18 Pts VI
19+ Pts Total
A 45 28 9 9 3 2 96 B1 69 40 23 8 1 3 144 B2 107 97 44 41 6 2 297 C 111 180 238 294 115 92 1,030 D 292 228 140 80 21 20 781 E 469 434 153 96 29 23 1,204 F 622 714 469 312 71 45 2,233 G 715 1,270 994 714 146 98 3,937 H 2,794 3,654 2,331 1,877 567 479 11,702 I 1,724 3,064 1,267 1,053 268 299 7,675
TOTAL 6,948 9,709 5,668 4,484 1,227 1,063 29,099
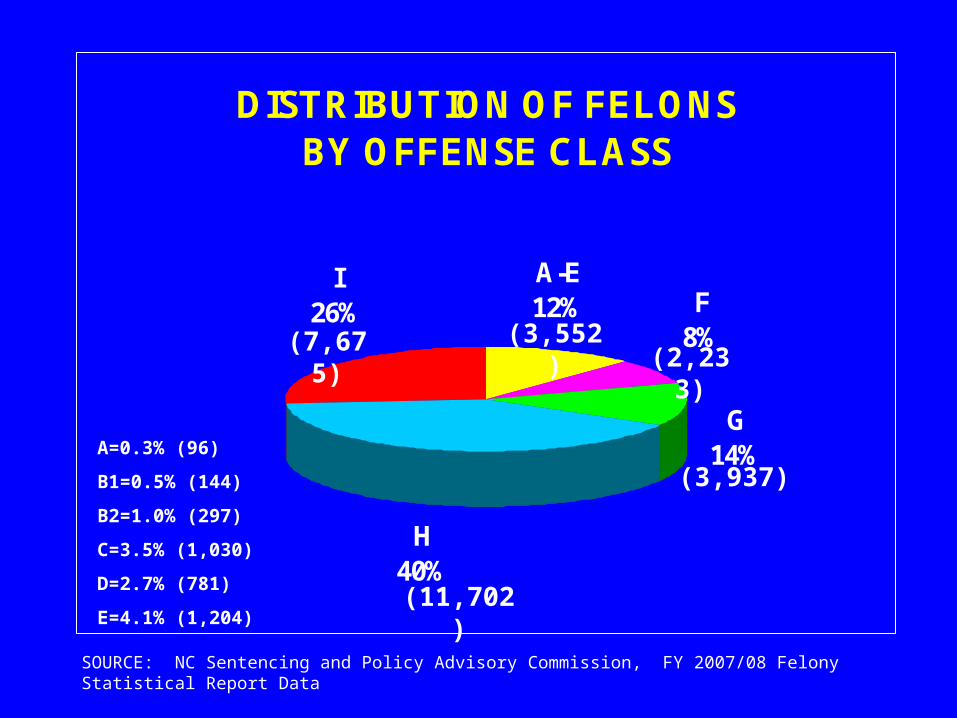
DISTRIBUTION OF FELONS BY OFFENSE CLASS
H40%
A-E12%
G14%
F8%
I26%
SOURCE: NC Sentencing and Policy Advisory Commission, FY 2007/08 Felony Statistical Report Data
(7,675)
(3,937)
(11,702)
(3,552)(2,233)
A=0.3% (96)
B1=0.5% (144)
B2=1.0% (297)
C=3.5% (1,030)
D=2.7% (781)
E=4.1% (1,204)

24%
33%
20%15%
4% 4%0%
5%
10%
15%
20%
25%
30%
35%
I II III IV V VI
FELONY CONVICTIONS BY PRIOR RECORD LEVEL
SOURCE: NC Sentencing and Policy Advisory Commission, FY 2007/08 Felony Statistical Report Data

DISTRIBUTION OF FELONY CONVICTIONS BY CRIME TYPE
Other14%
Property34%
Non-Trafficking
Drug34%
Person18%
SOURCE: NC Sentencing and Policy Advisory Commission, FY 2007/08 Felony Statistical Report Data

COMPONENTS OF STRUCTURED SENTENCING
OFFENSE
STRUCTURE DEFENDANT’S
PRIOR RECORD
DURATION
DISPOSITION

*** Effective for Offenses Committed on or after 12/1/95***
FELONY PUNISHMENT CHART
PRIOR RECORD LEVEL
I0 Pts
II1-4 Pts
III5-8 Pts
IV9-14 Pts
V15-18 Pts
VI19+ Pts
A Death or Life Without Parole
A240-300
A288-360
A336-420
A384-480
ALife Without
Parole
ALife Without
Parole
DISPOSITIONAggravated Range
192-240 230-288 269-336 307-384 346-433 384-480 PRESUMPTIVE RANGEB1
144-192 173-230 202-269 230-307 260-346 288-384 Mitigated Range
A157-196
A189-237
A220-276
A251-313
A282-353
A313-392
125-157 151-189 176-220 201-251 225-282 251-313B2
94-125 114-151 132-176 151-201 169-225 188-251
A73-92
A100-125
A116-145
A133-167
A151-188
A168-210
58-73 80-100 93-116 107-133 121-151 135-168C
44-58 60-80 70-93 80-107 90-121 101-135
A64-80
A77-95
A103-129
A117-146
A133-167
A146-183
51-64 61-77 82-103 94-117 107-133 117-146D
38-51 46-61 61-82 71-94 80-107 88-117
I/A25-31
I/A29-36
A34-42
A46-58
A53-66
A59-74
20-25 23-29 27-34 37-46 42-53 47-59E
15-20 17-23 20-27 28-37 32-42 35-47
I/A16-20
I/A19-24
I/A21-26
A25-31
A34-42
A39-49
13-16 15-19 17-21 20-25 27-34 31-39F
10-13 11-15 13-17 15-20 20-27 23-31
I/A13-16
I/A15-19
I/A16-20
I/A20-25
A21-26
A29-36
10-13 12-15 13-16 16-20 17-21 23-29G
8-10 9-12 10-13 12-16 13-17 17-23
C/I/A6-8
I/A8-10
I/A10-12
I/A11-14
I/A15-19
A20-25
5-6 6-8 8-10 9-11 12-15 16-20H
4-5 4-6 6-8 7-9 9-12 12-16
C6-8
C/I6-8
I6-8
I/A8-10
I/A9-11
I/A10-12
4-6 4-6 5-6 6-8 7-9 8-10I
3-4 3-4 4-5 4-6 5-7 6-8Note: A – Active Punishment I – Intermediate Punishment C – Community Punishment* Numbers shown are in months and represent the range of minimum sentences.
OF
FE
NS
E C
LA
SS

AVERAGE PERCENT OF SENTENCE SERVED
17% 15%
109%
19%22%24%29%32%36%38%41%
11% 9% 8%
95%
27%35%39%
0%
20%
40%
60%
80%
100%
86 87 88 89 90 91 92 93 SS*
End of Fiscal Year
Felonies Misdemeanors
*FY 2007/08 Structured Sentencing Data
SOURCE: NC Sentencing and Policy Advisory Commission and NC Department of Correction

AVERAGE* MONTHS SERVED IN PRISON
25 23 2321
1916
5 4 3 2 2 2 2
16
24
38
5 4
05
10152025303540
86 87 88 89 90 91 92 93 SS*End of Fiscal year
Mon
ths
Felonies Misdemeanors
*FY 2007/08 Structured Sentencing Simulation data
SOURCE: NC Sentencing and Policy Advisory Commission

47%
39%
28%
44%
26%
17%
0%
10%
20%
30%
40%
50%
Active Intermediate Community
TYPE OF PUNISHMENT IMPOSED FOR FELONS
Old Law*
Structured Sentencing*
* NC Sentencing and Policy Advisory Commission, FY 2007/08 Felony Statistical Report Data
** 1993 Pre-Structured Sentencing Data

PERCENT RECEIVING ACTIVE SENTENCE BY FELONY OFFENSE CLASS
Offense Class
Percent Active: FSA – 1993
Percent Active: SSA – 2007/08
A 100% 100% B1 100% 100% B2 97% 100% C 84% 100% D 93% 100% E 52% 52% F 47% 57% G 65% 42% H 45% 38% I 31% 12%
TOTAL 47% 39%
SOURCE: NC Sentencing and Policy Advisory Commission, FY 2007/08 Felony Statistical Report Data

AVERAGE MONTHS SERVED* BY OFFENSE CLASS
Offense Class
Average Months: FSA – 1993
Average Months: SSA – 2007/08
B1 240 283 B2 92 189 C 55 95 D 73 74 E 25 32 F 23 23 G 22 19 H 12 10 I 7 6
TOTAL 16 38
* FSA based on CY 1993 data; SSA based on FY 2007/08 Felony Structured Sentencing Simulation data.
SOURCE: NC Sentencing and Policy Advisory Commission and NC Department of Correction

4,658.94,622.94,711.85,005.25,266.8
5,452.0
4,919.8 4,771.04,641.7 4,654.4
5,592.5
0
2000
4000
6000
8000
97 98 99 00 01 02 03 04 05 06 07
SOURCE: State Bureau of Investigation, 2007
NC CRIME TRENDS INDEX CRIME RATES

620.2
550.5503.8
454.7483.5 480.2478.6
649
460.9475.3498.1
597603
0
200
400
600
800
95 96 97 98 99 00 01 02 03 04 05 06 07
SOURCE: State Bureau of Investigation, 2007
NC CRIME TRENDSVIOLENT CRIME RATES

• TRUTH IN SENTENCING RESTORED
• ANNUAL PROJECTIONS TO HELP PLAN PRISON CAPACITY
• NO PAROLE FOR OFFENDERS SENTENCED UNDER STRUCTURED SENTENCING
• PRISON CAP REPEALED
• VIOLENT OFFENDERS SERVING LONGER SENTENCES
• TOUGHER COMMUNITY PUNISHMENTS
• PUNISHMENT MORE CERTAIN AND CONSISTENT
• SENTENCING POLICY FORMULATED IN CONSIDERATION OF CORRECTIONAL RESOURCES
THE N.C. CRIMINAL JUSTICE SYSTEM TODAY

NC PRISON POPULATION
AND CAPACITYUpdated January 2009
0
5,000
10,000
15,000
20,000
25,000
30,000
35,000
40,000
45,000
50,000
1994 1996 1998 2000 2002 2004 2006 2008 2010 2012 2014 2016 2018
Population Capacity
Note: Prison capacity figures reflect Expanded Operating Capacity.
SOURCE: NC Sentencing and Policy Advisory Commission and NC Department of Correction

DISTRIBUTION OF THE PROJECTED PRISON POPULATION BY OFFENSE CLASS
FELONIES ONLY
19.1%
26.3%
53.4%
17.5%
26.3%
55.1%
17.3%
25.7%
56.0%
0%
20%
40%
60%
80%
100%
2009 2013 2018
A-DE-GH-I
SOURCE: NC Sentencing and Policy Advisory Commission, FY 2007/08 Structured Sentencing Simulation Model

SOURCE: NC Sentencing and Policy Advisory Commission, FY 2007/08 Felony Statistical Report Data
ALL FELONY CONVICTIONS
Class A-D
8%Class E-G
25%Class H-I
67%
ALL ACTIVE SENTENCES
Class A-D
21%
Class E-G
32%
Class H-I
47%
DISTRIBUTION OF FY 2007/08 CONVICTIONS AND SENTENCES

Class A-D
53%
Class H-I 19%
Class E-G
26%
DISTRIBUTION OF THE 2009 PROJECTED PRISON POPULATION BY OFFENSE CLASS
NOTE: The distribution of the 2009 projected prison population is based only on felonies and excludes offenses for which the offense class is unknown (1%).SOURCE: NC Sentencing and Policy Advisory Commission, FY 2007/08 Structured Sentencing Simulation Model

THE CRIMINAL JUSTICE SYSTEM TOMORROW
• PRISONS WILL BECOME OVERCROWDED• LAWSUITS WILL RETURN• INCREASED RISKS TO CORRECTIONAL
OFFICERS• PROPOSALS FOR PAROLE WILL RETURN• TRUTH IN SENTENCING WILL BE
COMPROMISED• HUNDREDS OF MILLIONS OF DOLLARS WILL
BE SPENT ON PRISONS AND NOT AVAILABLE FOR OTHER NEEDS

ROLE OF THE SENTENCING COMMISSION
• MONITORING
• IMPACT ANALYSIS
• ANALYSIS OF NEW LEGISLATION
• RECOMMENDING MODIFICATIONS

ADVANTAGES OF STRUCTURED SENTENCING
• PROMOTES TRUTH IN SENTENCING• SETS PRIORITIES • ALLOWS EFFICIENT USE OF RESOURCES• ENHANCES CONSISTENCY AND CERTAINTY IN
SENTENCING• PROVIDES UNDERLYING RATIONALE FOR
SENTENCING• BALANCES POLICY WITH RESOURCES

***Effective for Offenses Committed on or after 12/1/95***
MISDEMEANOR PUNISHMENT CHART
PRIOR CONVICTION LEVELSI II III
CLASS No PriorConvictions
One to FourPrior
Convictions
Five or MorePrior
ConvictionsA1 1 - 60 days
C/I/A1 - 75 days
C/I/A1 - 150 days
C/I/A1 1 - 45 days
C1 - 45 days
C/I/A1 - 120 days
C/I/A2 1 - 30 days
C1 - 45 days
C/I1 - 60 days
C/I/A3 1 - 10 days
C1 - 15 days
C/I1 - 20 days
C/I/A
A - Active Punishment I - Intermediate Punishment C - Community Punishment
Cells with slash allow either disposition at the discretion of the judge.

Offense Class
Prior Record Level
TotalI0 Points
II1-4 Points
III5-8 Points
IV9-14 Points
V15-18 Points
VI19+ Points
A
AA = 45 (100%)
(n = 45)Life/Death
AA = 28 (100%)
(n = 28)Life/Death
AA = 9 (100%)
(n = 9)Life/Death
AA = 9 (100%)
(n = 9)Life/Death
AA = 3 (100%)
(n = 3)Life/Death
AA = 2 (100%)
(n = 2)Life/Death
AA = 96 (100%)
(n = 96)Life/Death
B1
AA = 69 (100%)
(n = 69)196 min245 max
AA = 40 (100%)
(n = 40)250 min309 max
AA = 23 (100%)
(n =23)303 min372 max
AA = 8 (100%)
(n = 8)348 min427 max
AA = 1 (100%)
(n = 1)433 min529 max
AA = 3 (100%)
(n = 3)464 min563 max
AA = 144 (100%)
(n = 144)244 min302 max
B2
AA = 107 (100%)
(n = 107)136 min172 max
AA = 97 (100%)
(n = 97)169 min212 max
AA = 44 (100%)
(n = 44)201 min250 max
AA = 41 (100%)
(n = 41)227 min282 max
AA = 6 (100%)
(n = 6)263 min325 max
AA = 2 (100%)
(n = 2)277 min341 max
AA = 297 (100%)
(n = 297)172 min216 max
C
AA = 111 (100%)
(n = 111)60 min81 max
AA = 180 (100%)
(n = 180)77 min
101 max
AA = 238 (100%)
(n = 238)85 min
110 max
AA = 294 (100%)
(n = 294)95 min
123 max
AA = 115 (100%)
(n = 115)106 min136 max
AA = 92 (100%)
(n = 92)118 min149 max
AA = 1,030(100%)
(n = 1,030)89 min
115 max
D
AA = 292 (100%)
(n = 292)49 min69 max
AA = 228 (100%)
(n = 228)62 min83 max
AA = 140 (100%)
(n = 140)82 min
108 max
AA = 80 (100%)
(n = 80)97 min
126 max
AA = 21 (100%)
(n = 21)107 min138 max
AA = 20 (100%)
(n = 20)122 min155 max
AA = 781 (100%)
(n = 781)67 min90 max
E
I/AI = 319 (68%)A = 150 (32%)
(n = 469)22 min36 max
I/AI = 264 (61%)A = 170 (39%)
(n = 434)25 min39 max
AA = 153 (100%)
(n = 153)29 min44 max
AA = 96 (100%)
(n = 96)40 min57 max
AA = 29 (100%)
(n = 29)46 min65 max
AA = 23 (100%)
(n = 23)54 min74 max
I/AI = 583 (48%)A = 621 (52%)
(n = 1,204)30 min45 max
DISTRIBUTION OF FY 2007/08 CONVICTIONS AND SENTENCES WITHIN THE FELONY PUNISHMENT CHART
(CONTINUED ON NEXT SLIDE)

DISTRIBUTION OF FY 2007/08 CONVICTIONS AND SENTENCES WITHIN THE FELONY PUNISHMENT CHART
(CONTINUED FROM PREVIOUS SLIDE)
Offense Class
Prior Record LevelTotalI
0 PointsII
1-4 PointsIII
5-8 PointsIV
9-14 PointsV
15-18 PointsVI
19+ Points
F
I/AI = 391 (63%)A = 231 (37%)
(n = 622)14 min18 max
I/AI = 367 (51%)
A = 347 (49%) (n = 714)16 min19 max
I/AI = 209 (45%)A = 260 (55%)
(n = 469)18 min22 max
AA = 312 (100%)
(n = 312)20 min25 max
AA = 71 (100%)
(n = 71)27 min32 max
AA = 45 (100%)
(n = 45)31 min38 max
I/AI = 967 (43%)
A = 1,266 (57%) (n = 2,233)
18 min22 max
G
I/AI = 537 (75%)A = 178 (25%)
(n = 715)11 min14 max
I/AI = 910 (72%)A = 360 (28%)
(n = 1,270)13 min16 max
I/AI = 545 (55%)A = 449 (45%)
(n = 994)14 min17 max
I/AI = 278 (39%)A = 436 (61%)
(n = 714)17 min21 max
AA = 146 (100%)
(n = 146)18 min22 max
AA = 98 (100%)
(n = 98)25 min31 max
I/AI = 2,270 (58%)A = 1,667 (42%)
(n = 3,937)15 min19 max
H
C/I/AC = 1,474 (53%)
I = 985 (35%)A = 335 (12%)
(n = 2,794)5 min7 max
I/AI = 2,714 (74%)A = 940 (26%)
(n = 3,654)7 min8 max
I/AI = 1,300 (56%)A = 1,031 (44%)
(n = 2,331)8 min
10 max
I/AI = 698 (37%)
A = 1,179 (63%)(n = 1,877)
10 min12 max
I/AI = 120 (21%)A = 447 (79%)
(n = 567)13 min16 max
AA = 479 (100%)
(n = 479)18 min21 max
C/I/AC = 1,474 (12%)I = 5,817 (50%)A = 4,411 (38%)
(n = 11,702)10 min12 max
I
CC = 1,724 (100%)
(n = 1,724)N/A
C/IC = 1,799 (59%)I = 1,265 (41%)
(n = 3,064)N/A
II = 1,267 (100%)
(n = 1,267)N/A
I/AI = 495 (47%)A = 558 (53%)
(n = 1,053)6 min8 max
I/AI = 93 (35%)
A = 175 (65%)(n = 268)
8 min10 max
I/AI = 72 (24%)
A = 227 (76%)(n = 299)
9 min11 max
C/I/AC = 3,523 (46%)I = 3,255 (42%)A = 897 (12%)
(n = 7,675)7 min9 max
TOTAL
C/I/AC = 3,198 (46%)I = 2,232 (32%)A = 1,518 (22%)
(n = 6,948)41 min53 max
C/I/AC = 1,799 (18%)I = 5,520 (57%)A = 2,390 (25%)
(n = 9,709)32 min41 max
I/AI = 3,321 (59%)A = 2,347 (41%)
(n = 5,668)31 min39 max
I/AI = 1,534 (34%)A = 2,950 (66%)
(n = 4,484)27 min35 max
I/AI = 213 (17%)
A = 1,014 (83%)(n = 1,227)
29 min37 max
I/AI = 72 (7%)
A = 991 (93%)(n = 1,063)
31 min38 max
C/I/AC = 4,997 (17%)I = 12,892 (44%)A = 11,210 (39%)
(n = 29,099)31 min40 max