Sensory Symptoms and Immune Response in Individuals...
14
Clinical and Experimental Medical Sciences, Vol. 1, 2013, no. 1, 1 - 14 HIKARI Ltd, www.m-hikari.com Sensory Symptoms and Immune Response in Individuals Infected with HTLV-1 Davi Tanajura 1 , Marshall Glesby 2 and Edgar Carvalho 3 1,3 Universidade Federal da Bahia Serviço de Imunologia - Hospital Universitário Prof. Edgard Santos Rua João das Botas S/N, Canela, Salvador, Bahia, Brasil, 40 110 160 2 Weill Cornell Medical College 525 East 68th Street, Box 566, New York, NY 10065 Corresponding author: Davi Tanajura Costa Serviço de Imunologia Hospital Universitário Prof. Edgard Santos Rua João das Botas S/N, Canela, Salvador, Bahia, Brasil 40 110 160 Phone: 55 71 3237 7353 Fax: 55 71 3237 7353 e-mail: [email protected], [email protected]
Transcript of Sensory Symptoms and Immune Response in Individuals...
Clinical and Experimental Medical Sciences, Vol. 1, 2013, no. 1, 1 - 14
HIKARI Ltd, www.m-hikari.com
Sensory Symptoms and Immune Response in
Individuals Infected with HTLV-1
Davi Tanajura1, Marshall Glesby
2 and Edgar Carvalho
3
1,3Universidade Federal da Bahia
Serviço de Imunologia - Hospital Universitário Prof. Edgard Santos
Rua João das Botas S/N, Canela, Salvador, Bahia, Brasil, 40 110 160
2 Weill Cornell Medical College
525 East 68th Street, Box 566, New York, NY 10065
Corresponding author:
Davi Tanajura Costa
Serviço de Imunologia
Hospital Universitário Prof. Edgard Santos
Rua João das Botas S/N, Canela, Salvador, Bahia, Brasil
40 110 160
Phone: 55 71 3237 7353
Fax: 55 71 3237 7353
e-mail: [email protected], [email protected]
2 D. Tanajura, M. Glesby and E. Carvalho
Abstract
The human T-lymphotropic virus type 1 (HTLV-1) is endemic worldwide and
causes HTLV-1 associated myelopathy/ tropical spastic paraparesis (HAM/TSP).
It is also associated with a variety of disabling syndromes. Sensory symptoms are
among themanifestations of HTLV-1 that are found in patients even without
HAM/TSP. The objective of this study was to compare clinical and
immunological characteristics of HTLV-1 patients with and without SS. Methods:
Cross sectional study with 237 HTLV-1 patients without HAM/TSP divided into
two groups: Individuals with sensory symptoms (n= 92), defined as those
complaining of hand or foot numbness in the past year, and asymptomatic
individuals (n=145). Patients with diabetes, co-infections or immunological
diseases were excluded. . Results: The proportion of women was higher in the
sensory symptoms group (66.3% vs 50.7% of asymptomatics); consequently
comparisons between groups were adjusted for gender. Other demographic
variables and risk factors did not differ between groups. The sensory symptoms
group had a higher frequency of other neurological complaints, with self-reported
weakness in the arms (adjusted OR 4.63) and legs (aOR 4.19) being the most
common. No differences were found between groups on physical exam. No
difference was found between the proviral loads but the sensory symptoms group
had significantly lower levels of TNF-α and IL10. Conclusion: In this cross-
sectional study, patients with HTLV-1 and sensory symptoms had a greater
frequency of other neurologic symptoms and a different immunologic profile
compared to those without sensory symptoms.
Keywords: Peripheral neuropathy, polyneuropathy, immune response, HTLV-1,
HAM/TSP, cytokines, proviral load
Introduction
The human T lymphotropic virus type 1 (HTLV-1) is an endemic retrovirus with
an estimated 10 to 20 million carriers around the world (15). Two diseases are
attributable to HTLV-1 and occur in about 5% of infected individuals: Adult T-
cell Lymphoma/Leukemia (ATLL) and HTLV-1 associated myelopathy/ tropical
spastic paraparesis (HAM/TSP) (2).
Although most infected people do not develop these diseases a broad spectrum of
clinical (uveitis, infective dermatitis, arthritis, pneumonitis and sicca syndrome)
Sensory symptoms and immune response 3
and neurological (overactive bladder, myopathy, polyneuropathy, cognitive
disorders, motor neuron syndrome, autonomic dysfunction) have been described
in a large proportion of patients (9).
Numerous studies have described central nervous system (CNS) manifestations of
HTLV-1, but very few have focused on peripheral nervous system complications.
Furthermore, data on peripheral neuropathy are mostly limited to patients with
HAM/TSP (10).
Our objectives in this study were to evaluate the prevalence of sensory symptoms
(SS) in HTLV-1 patients without HAM/TSP and to characterize the
immunological profiles and proviral load in this population.
Methods
This was a cross-sectional study nested within an ongoing clinic-based
cohort study of a 500 individuals with positive ELISA serology (Cambridge
Biotech, Worcester, MA) who attended the HTLV clinic at the Hospital
Universitário Prof. Edgar Santos of the Federal University of Bahia, Salvador,
Bahia, Brazil. Of the 500 HTLV individuals 430 were confirmed by Western Blot
analysis (HTLV Blot 2.4, Genelabs, Science Park Drive, Singapore) to have
HTLV-1 infection. From those, 78 HAM/TSP patients and 60 patients with
isolated overactive bladder were identified and excluded from analysis, but the
prevalence of SS was also computed in those groups. We also excluded patients
with diabetes mellitus (n=8) and those co-infected (n=47) with hepatitis B and C,
HIV, syphilis or Chagas disease. Patients were also evaluated for immune
diseases, known toxin exposure, neurotoxic medication exposure, and metabolic
and infectious disorders, but none had those exclusionary conditions. A total of
237 HTLV-1 individuals were included in our study.
Clinical exam
All subjects completed an interviewer-administered questionnaire that
captured epidemiological and clinical data and were examined by one of two
neurologists. Participants self-defined race and ethnicity in this study. Sensory
symptoms were defined as self-reported numbness in the hands and/or feet in the
past year.
Muscular strength was evaluated with the Medical Research Council
criteria (8) as follows: 0 = no movement, 1 = a flicker of movement is seen or felt
in the muscle, 2= muscle moves the joint when gravity is eliminated, 3= muscle
cannot move against resistance but moves the joint fully against gravity, 4= active
movement against gravity and some resistance; 5 = normal strength. Arm and leg
strength were evaluated in both sides in proximal and distal muscles. If the score
was less or equal to 4 in one muscle, the segment was considered weak for our
analysis.
Reflexes were defined according to the NINDS criteria (7): 0=none;
1=present but diminished; 2=normal; 3=enhanced; 4=hyperactive, pathological
and with clonus. The routinely evaluated reflexes were biceps, triceps,
4 D. Tanajura, M. Glesby and E. Carvalho
brachioradialis in both arms and patellar and ankle jerks in the legs. Any segment
with a reflex graded 0 or 1 was considered abnormal.
Cell preparation and proliferation assay
Peripheral blood mononuclear cells (PBMC) were isolated and cultivated
in RPMI 1640 (Gibco, Grand Island, NY, USA) plus 10% heat inactivated human
AB Rh+ serum (Sigma Chemical Co., St. Louis, MO), antibiotics and glutamine.
A total of 2 × 10⁵ cells/mL were incubated at 37°C in 5 % CO2 atmosphere in a 96
well flat-bottom microtiter plates.
Cytokine determination PBMC were adjusted to 3 × 10⁶ cells/mL in RPMI
1640 plus 10 % serum AB Rh+. The cells were cultured unstimulated and were
incubated at 37°C in 5 % CO2 atmosphere for 72 hours until supernatants were
collected. IFN-γ, TNF-α, IL- 5 and IL-10 levels were measured by sandwich
ELISA technique (R & D system, Minneapolis, MN).
Pro-viral load The DNA was extracted from 106 PBMCs using a
phenol/chloroform procedure. HTLV-1 proviral load was determined using real-
time TaqMan PCR.
Statistical analysis
Data were analyzed with Stata software v.11 (Stata Corporation, College
Station, TX, USA). Results were presented as means and standard deviations
(SD), absolute number with proportions or odds ratios (OR) with 95% confidence
intervals (CI). Differences between proportions were analyzed with Chi-square or
Fisher’s exact test as indicated. Differences between continuous variables were
analyzed with independent sample t-test or Mann-Whitney test as appropriate.
Univariate and bivariate logistic regression models, the latter adjusted for gender,
were used to characterize associations between covariates and SS status.
Statistical significance was defined as p<0.05.
Results
The prevalence of sensory symptoms in the overall study population (n =
430) was 50.7% (95% confidence interval [CI] 45.8-55.3%). The prevalence in
patients with HAM/TSP (n = 78) and isolated overactive bladder (n = 60) were
71.8% (95% CI 62.6—83.0%) and 70.0% (95% CI 58.0—82.0%), respectively.
After exclusion of these patients with advanced HTLV-1 disease, the prevalence
of SS among the remaining 237 patients was 40.1% (95% CI 33.8—46.4).
For the remaining analyses, the study population was divided into two
groups: asymptomatic (n=142) and those with sensory symptoms (n=95). Table 1
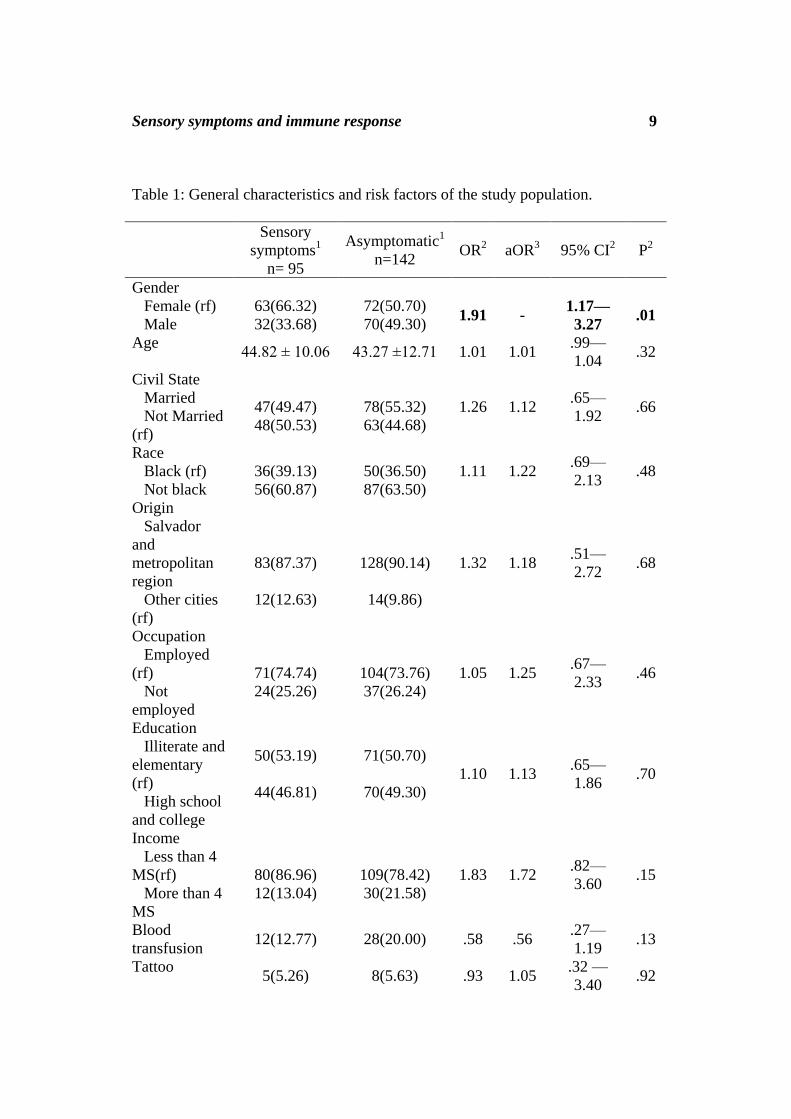
summarizes the general characteristics of the study population. The only
statistically significant difference between groups was a higher female
predominance in the SS group (66.3% vs. 50.7%, p=0.01). There were no
differences in risk factors for HTLV-1 acquisition between groups.
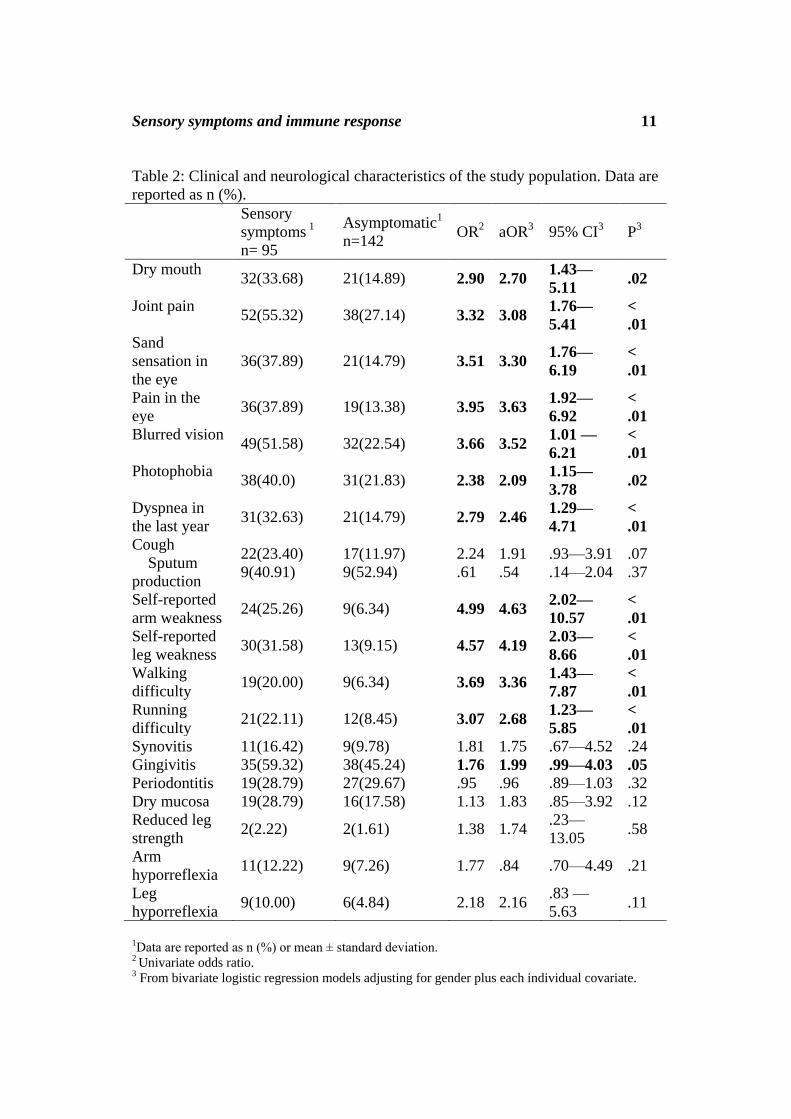
Regarding clinical symptoms, the SS group presented with more
complaints than the asymptomatic group. Eye complaints (sand sensation, pain,
Sensory symptoms and immune response 5
blurred vision, photophobia), dry mouth, dyspnea, joint pain, arm and leg
weakness, walking and running difficulty were statistically significant. No
differences were found on clinical exam as summarized in table 2.
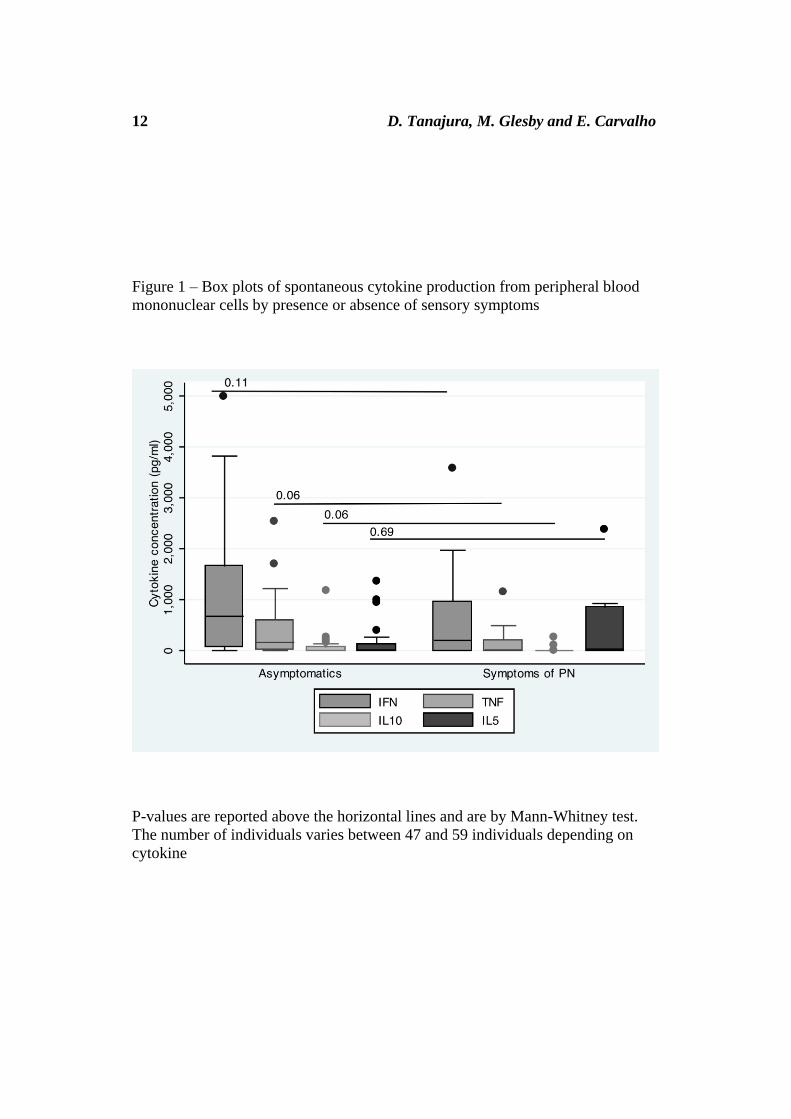
Spontaneous production of TNF- and IL-10 in PBMCs tended to be
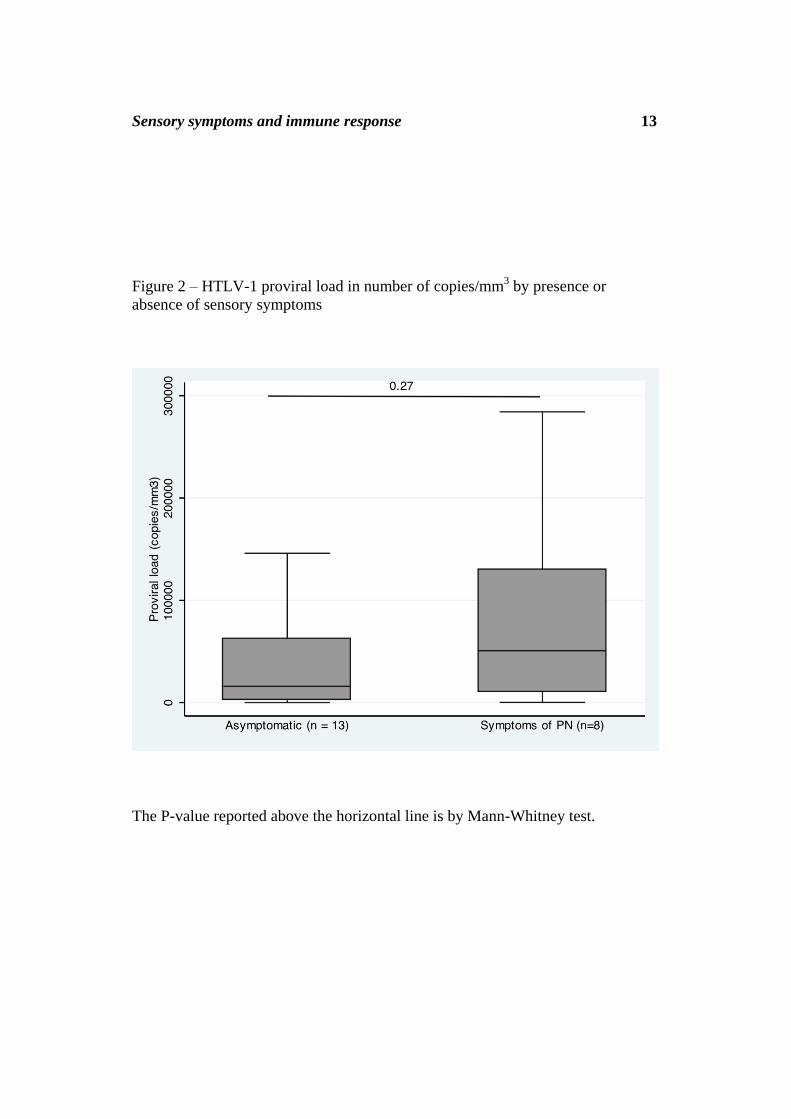
lower in the SS group (p=0.06 for both cytokines)(Figure 1). Proviral load was
available in a subset of patients and did not differ significantly between groups
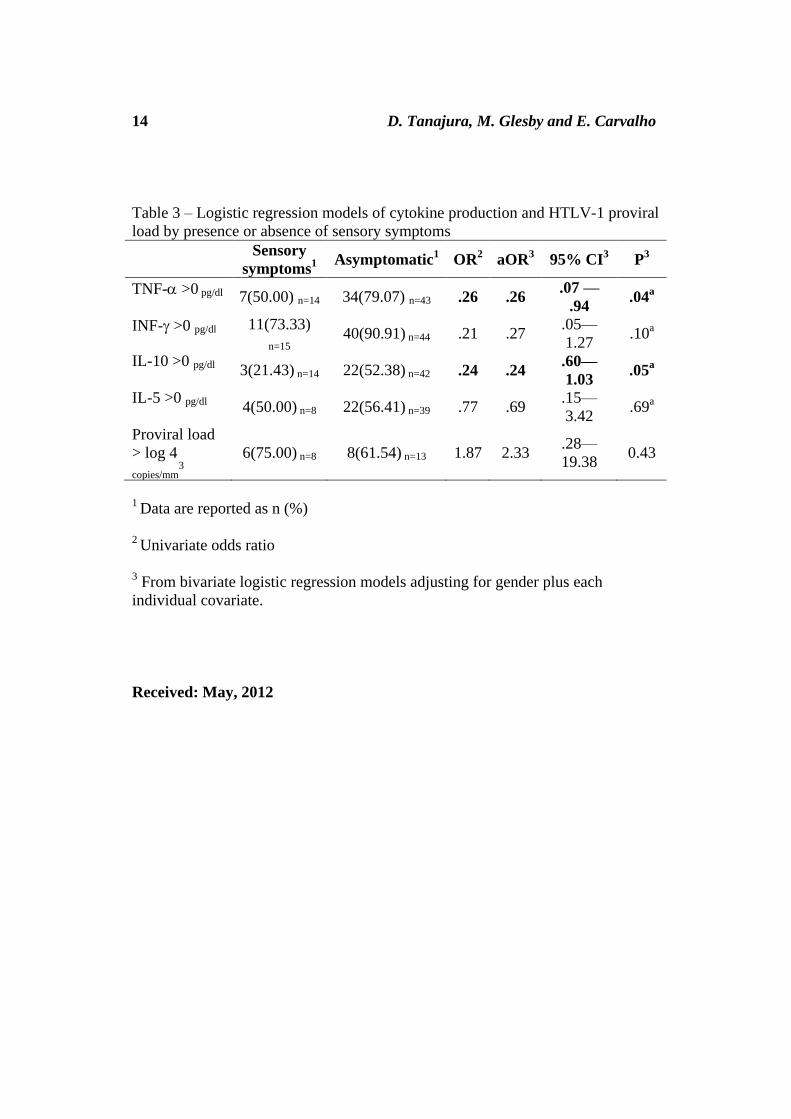
(Figure 2). We constructed logistic regression models with cytokine data
dichotomized around 0 pg/ml and adjusted for gender. In these models,
detectable spontaneous production of both TNF- and IL-10 was significantly and
inversely associated with having SS (table 3).
Discussion
In this study the prevalence of SS among all HTLV-1 infected subjects in
our cohort was 50.7% overall and 40.1% after exclusion of patients with
diagnoses of HAM/TSP and isolated overactive bladder. We also showed a close
relationship between SS and other self-reported symptoms. We found only a
limited association of SS with findings on physical examination. Specifically,
only gingivitis was associated with SS, whereas neurologic findings did not differ
between groups.
Few publications exist about peripheral nerve manifestations in HTLV-1
infected individuals and most of them have focused on HAM/TSP. In the only
study of HTLV-1 patients without HAM/TSP, Leite (6) found a prevalence of
peripheral nervous system involvement in 13.4%, of whom 6.2% were confirmed
with biopsies and electroneuromyography (EMG). About half of patients had an
abnormal EMG and the most common pattern was sensory motor polyneuropathy
with axonal pattern. In the same study one of five biopsies showed inflammatory
infiltrates and two had axonal degeneration.
Our study may have overestimated the prevalence of peripheral nervous
system involvement because our definition was based on clinical criteria. Only
two patients in our study underwent EMG for clinical purposes, and both results
were normal (data not shown). No patients had nerve or skin biopsies.
Furthermore, it is possible that patients with SS were more likely to continue to be
followed in our HTLV-1 clinic relative to asymptomatic patients, which would
enrich the study population for symptomatic patients.
Another limitation of our study was the reliance on self-reported history.
Following the same principle some epidemiological studies of peripheral
neuropathy in HIV-infected patients based the diagnosis only on clinical
symptoms and signs.(4)(1). This is important for identification of those patients in
places with low resources and with no access to electroneuromiography or nerve
biopsies.
A recent study of patients with HAM/TSP found that 30% had peripheral
nerve involvement, and an axonal motor sensory polyneuropathy was the major
6 D. Tanajura, M. Glesby and E. Carvalho
finding. In this study neuropathy was less common in patients with breastfeeding
history (p=0.03) and more common in those with a transfusion history (p=0.01).
Duration of the disease was not associated with PN (10). In our study patients
with HAM/TSP and isolated overactive bladder had relatively high prevalence of
PN symptoms (71.8% and 70.0%, respectively), but again this was based only on
clinical data without neurophysiologic studies for confirmation.
In a cohort study Biwas et. al (3) described a higher prevalence of
impaired vibration sense in HTLV 1 and 2 groups compared to seronegative-
individuals, but no differences in monofilament examination for sensory
neuropathy. Impaired vibration sense can reveal subclinical manifestations of
myelopathy since pathological studies shows that the segments in spinal cord that
are impaired are the corticospinal tract and the posterior column. In our study data
were not collected systematically on sensory exams, but absent and decreased leg
and arm reflexes were studied and no significants difference were found.
In this study some cytokines were shown to be produced at a low level, the
opposite of HAM/TSP and overactive bladder profile who have high spontaneous
production of Th1 cytokines. Our impression is that peripheral neuropathy is more
a degenerative than inflammatory process, which seems to appear in the “cold”
phase of the disease. Also it seems to involve a subtype of small fibers pattern
with few objective or ancillary exam alterations. The principal clue seems to be
the chronic clinical complaint.
Demyelination, remyelination and axonal degeneration and regeneration
were the most common patterns found in sural nerve biopsies of HAM/TSP
patients with peripheral nerve symptoms. Those studies, however, failed to show
associations between inflammatory infiltrates and the duration of the disease,
proviral load or evidence for direct viral infection (13) (11) (14)
(5). Also some
cases of combined inflammatory myopathy and peripheral degenerative
neuropathy in patients without HAM/TSP have been described (16).
To date our study is the first one relating spontaneous cytokine production
in PBMCs to sensory symptoms in HTLV-1 patients. We found decreased levels
of TNF-α and IL-10 relative to asymptomatic patients. In contrast an elevated
production of these cytokines were patients with HAM/TSP (12), suggesting a
different mechanism of disease in HTLV-1 SS patients. The proviral load was
slightly higher in SS patients, but this was not statistically significant perhaps due
to the small sample size (n=21).
Conclusion
HTLV-1-infected patients with sensory symptoms are more likely to have
other neurological and clinical symptoms by history but do not differ on
neurological examination when compared to asymptomatic HTLV-1-infected
controls. Levels of TNF- and IL-10 were lower in PN patients, suggesting that
the pathogenesis of peripheral neuropathy differs from that of HAM/TSP.
Sensory symptoms and immune response 7
Bibliography
1. Y Anziska, EP Helzner, H Crystal, MJ Glesby, M Plankey, K Weber, E
Golub and P Burian, The relationship between race and HIV-distal sensory
polyneuropathy in a large cohort of US women, Journal of the neurological
sciences, 315(1-2) (2012),129-132.
2. AQC Araujo and MTT Silva,The HTLV-1 neurological complex, Lancet
neurology, 5(12) (2006),1068-1076.
3. HH Biswas, JW Engstrom, Z Kaidarova, G Garratty, JW Gibble, BH
Newman, JW Smith, et al, Neurologic abnormalities in HTLV-I- and
HTLV-II-infected individuals without overt myelopathy, Neurology,
73(10) (2009), 781-789.
4. CL Cherry, JS Affandi, BJ Brew, J Creighton, S Djauzi, DJ Hooker, D
Imran, et al, Hepatitis C seropositivity is not a risk factor for sensory
neuropathy among patients with HIV, Neurology, 74(19) (2006), 1538-
1542.
5. T Kiwaki, F Umehara, Y Arimura, S Izumo, K Arimura, K Itoh and M
Osame, The clinical and pathological features of peripheral neuropathy
accompanied with HTLV-I associated myelopathy, Journal of the
neurological sciences, 206(1) (2003),17-21.
6. ACC Leite, MTT Silva, AH Alamy, CR Afonso, M Lima, MJ Andrada-
Serpa, OJM Nascimento and AQC Araújo, Peripheral neuropathy in
HTLV-I infected individuals without tropical spastic paraparesis/HTLV-I-
associated myelopathy, Journal of neurology, 251(7) (2004), 877-881.
7. S Manschot, L van Passel, E Buskens, A Algra and J van Gijn, Mayo and
NINDS scales for assessment of tendon reflexes: between observer
agreement and implications for communication, Journal of neurology,
neurosurgery, and psychiatry, 64(2) (1998), 253-255.
8. JR Mendell and J Florence. Manual muscle testing, Muscle & nerve 13
Suppl (1990), S16-20.
9. F Proietti, ABF Carneiro-Proietti, BC Catalan-Soares and EL Murphy.
Global epidemiology of HTLV-I infection and associated diseases,
Oncogene, 24(39) (2005), 6058-6068.
8 D. Tanajura, M. Glesby and E. Carvalho
10. M Saeidi, P Sasannejad, M Foroughipour, S Shahami and A Shoeibi,
Prevalence of peripheral neuropathy in patients with HTLV-1 associated
myelopathy/tropical spastic paraparesis (HAM/TSP), Acta neurologica
Belgica, 111(1) (2011), 41-44.
11. G Said, C Goulon-Goeau, C Lacroix, A Fève, H Descamps and M
Fouchard, Inflammatory lesions of peripheral nerve in a patient with human
T-lymphotropic virus type I-associated myelopathy, Annals of neurology,
24(2) (1988), 275-277.
12. SB Santos, AF Porto, AL Muniz, ARD Jesus, E Magalhães, A Melo, WO
Dutra, KJ Gollob and EM Carvalho, Exacerbated inflammatory cellular
immune response HTLV-I asymptomatic carriers, BMC Infectious
Diseases, 8(2004), 1-8.
13. R Shimazaki, H Ueyama, T Mori, M Mori, S Fujimoto, T Kumamoto and T
Tsuda, Chronic sensory neuronopathy associated with human T-cell
lymphotropic virus type I infection, Journal of the neurological sciences,
194(1) (2002), 55-58.
14. K Sugimura, A Takahashi, M Watanabe, K Mano and H Watanabe,
Demyelinating changes in sural nerve biopsy of patients with HTLV-I-
associated myelopathy, Neurology, 40(8) (1990), 1263-1266.
15. G de Thé and R Bomford, An HTLV-I vaccine: why, how, for whom?,
AIDS research and human retroviruses, 9(5) (1993), 381-386.
16. JC Vernant, R Bellance, G Buisson, S Havard, J Mikol and G Roman,
Peripheral Neuropathies and Myositis Associated to HTLV-I Infection in
Martinique, In Human Retrovirology: HTLV, WA Blattner, New York,
Raven Press, 1989, 225-235.
Acknowledgements.
This work was supported in part by the National Institutes of Health/National
Institute of Allergy and Infectious Diseases (Grants R01 AI079238-02 and K24
AI078884) The content is solely the responsibility of the authors and does not
necessarily represent the official views of the National Institute of Allergy and
Infectious Diseases or the National Institutes of Health.
Sensory symptoms and immune response 9
Table 1: General characteristics and risk factors of the study population.
Sensory
symptoms1
n= 95
Asymptomatic1
n=142 OR
2 aOR
3 95% CI
2 P
2
Gender
Female (rf)
Male
63(66.32)
32(33.68)
72(50.70)
70(49.30)
1.91
-
1.17—
3.27
.01
Age 44.82 ± 10.06 43.27 ±12.71 1.01 1.01
.99—
1.04 .32
Civil State
Married
Not Married
(rf)
47(49.47)
48(50.53)
78(55.32)
63(44.68)
1.26 1.12 .65—
1.92 .66
Race
Black (rf)
Not black
36(39.13)
56(60.87)
50(36.50)
87(63.50)
1.11 1.22 .69—
2.13 .48
Origin
Salvador
and
metropolitan
region
Other cities
(rf)
83(87.37)
12(12.63)
128(90.14)
14(9.86)
1.32 1.18 .51—
2.72 .68
Occupation
Employed
(rf)
Not
employed
71(74.74)
24(25.26)
104(73.76)
37(26.24)
1.05 1.25 .67—
2.33 .46
Education
Illiterate and
elementary
(rf)
High school
and college
50(53.19)
44(46.81)
71(50.70)
70(49.30)
1.10 1.13 .65—
1.86 .70
Income
Less than 4
MS(rf)
More than 4
MS
80(86.96)
12(13.04)
109(78.42)
30(21.58)
1.83 1.72 .82—
3.60 .15
Blood
transfusion 12(12.77) 28(20.00) .58 .56
.27—
1.19 .13
Tattoo 5(5.26) 8(5.63) .93 1.05
.32 —
3.40 .92
10 D. Tanajura, M. Glesby and E. Carvalho
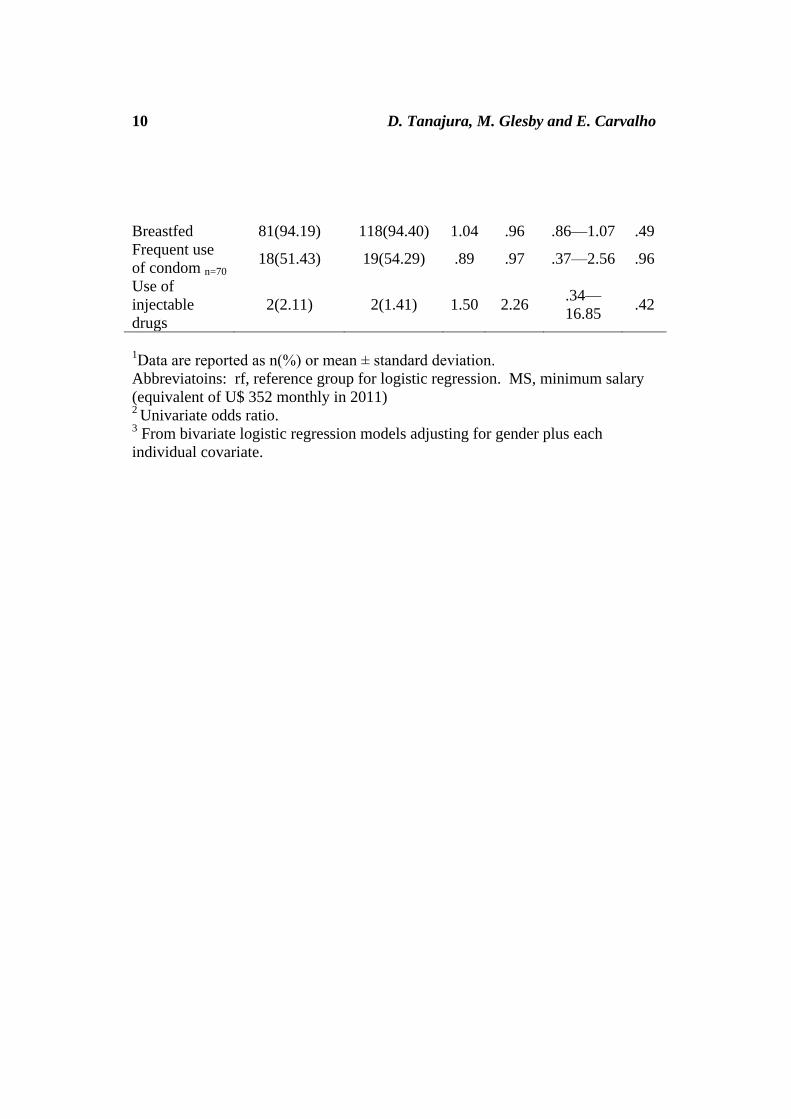
Breastfed 81(94.19) 118(94.40) 1.04 .96 .86—1.07 .49
Frequent use
of condom n=70 18(51.43) 19(54.29) .89 .97 .37—2.56 .96
Use of
injectable
drugs
2(2.11) 2(1.41) 1.50 2.26 .34—
16.85 .42
1Data are reported as n(%) or mean ± standard deviation.
Abbreviatoins: rf, reference group for logistic regression. MS, minimum salary
(equivalent of U$ 352 monthly in 2011) 2
Univariate odds ratio. 3 From bivariate logistic regression models adjusting for gender plus each
individual covariate.
Sensory symptoms and immune response 11
Table 2: Clinical and neurological characteristics of the study population. Data are
reported as n (%).
Sensory
symptoms 1
n= 95
Asymptomatic1
n=142 OR
2 aOR
3 95% CI
3 P
3
Dry mouth 32(33.68) 21(14.89) 2.90 2.70
1.43—
5.11 .02
Joint pain 52(55.32) 38(27.14) 3.32 3.08
1.76—
5.41
<
.01
Sand
sensation in
the eye
36(37.89) 21(14.79) 3.51 3.30 1.76—
6.19
<
.01
Pain in the
eye 36(37.89) 19(13.38) 3.95 3.63
1.92—
6.92
<
.01
Blurred vision 49(51.58) 32(22.54) 3.66 3.52
1.01 —
6.21
<
.01
Photophobia 38(40.0) 31(21.83) 2.38 2.09
1.15—
3.78 .02
Dyspnea in
the last year 31(32.63) 21(14.79) 2.79 2.46
1.29—
4.71
<
.01
Cough
Sputum
production
22(23.40)
9(40.91)
17(11.97)
9(52.94)
2.24
.61
1.91
.54
.93—3.91
.14—2.04
.07
.37
Self-reported
arm weakness 24(25.26) 9(6.34) 4.99 4.63
2.02—
10.57
<
.01
Self-reported
leg weakness 30(31.58) 13(9.15) 4.57 4.19
2.03—
8.66
<
.01
Walking
difficulty 19(20.00) 9(6.34) 3.69 3.36
1.43—
7.87
<
.01
Running
difficulty 21(22.11) 12(8.45) 3.07 2.68
1.23—
5.85
<
.01
Synovitis 11(16.42) 9(9.78) 1.81 1.75 .67—4.52 .24
Gingivitis 35(59.32) 38(45.24) 1.76 1.99 .99—4.03 .05
Periodontitis 19(28.79) 27(29.67) .95 .96 .89—1.03 .32
Dry mucosa 19(28.79) 16(17.58) 1.13 1.83 .85—3.92 .12
Reduced leg
strength 2(2.22) 2(1.61) 1.38 1.74
.23—
13.05 .58
Arm
hyporreflexia 11(12.22) 9(7.26) 1.77 .84 .70—4.49 .21
Leg
hyporreflexia 9(10.00) 6(4.84) 2.18 2.16
.83 —
5.63 .11
1Data are reported as n (%) or mean ± standard deviation.
2 Univariate odds ratio. 3 From bivariate logistic regression models adjusting for gender plus each individual covariate.
12 D. Tanajura, M. Glesby and E. Carvalho
Figure 1 – Box plots of spontaneous cytokine production from peripheral blood
mononuclear cells by presence or absence of sensory symptoms
P-values are reported above the horizontal lines and are by Mann-Whitney test.
The number of individuals varies between 47 and 59 individuals depending on
cytokine
Sensory symptoms and immune response 13
Figure 2 – HTLV-1 proviral load in number of copies/mm3 by presence or
absence of sensory symptoms
The P-value reported above the horizontal line is by Mann-Whitney test.
14 D. Tanajura, M. Glesby and E. Carvalho
Table 3 – Logistic regression models of cytokine production and HTLV-1 proviral
load by presence or absence of sensory symptoms
Sensory
symptoms1
Asymptomatic1 OR
2 aOR
3 95% CI
3 P
3
TNF- >0 pg/dl 7(50.00) n=14 34(79.07) n=43 .26 .26 .07 —
.94 .04
a
INF- >0 pg/dl 11(73.33)
n=15 40(90.91) n=44 .21 .27
.05—
1.27 .10
a
IL-10 >0 pg/dl 3(21.43) n=14 22(52.38) n=42 .24 .24 .60—
1.03 .05
a
IL-5 >0 pg/dl 4(50.00) n=8 22(56.41) n=39 .77 .69 .15—
3.42 .69
a
Proviral load
> log 4
copies/mm3
6(75.00) n=8 8(61.54) n=13 1.87 2.33 .28—
19.38 0.43
1 Data are reported as n (%)
2 Univariate odds ratio
3 From bivariate logistic regression models adjusting for gender plus each
individual covariate.
Received: May, 2012