Sensory studies of an energy dense drink for elderly people
72
Faculty of Natural Resources and Agricultural Sciences Department of Food Science Sensory studies of an energy dense drink for elderly people Rebecka Langborger Agronomy Programe – Food Science Independent Project in Food Science• Master Thesis • 30 hec • Advanced A2E Publikation/Sveriges lantbruksuniversitet, Institutionen för livsmedelsvetenskap, no 402 Uppsala, 2015
Transcript of Sensory studies of an energy dense drink for elderly people
Faculty of Natural Resources and Agricultural Sciences Department of Food Science
Sensory studies of an energy dense drink for elderly people
Rebecka Langborger
Agronomy Programe – Food Science Independent Project in Food Science• Master Thesis • 30 hec • Advanced A2E Publikation/Sveriges lantbruksuniversitet, Institutionen för livsmedelsvetenskap, no 402 Uppsala, 2015

Sensory studies of an energy dense drink for elderly people
Rebecka Langborger
Supervisor: Rikard Landberg, Department of Food Science, SLU
Assistant Supervisor: Olof Böök, Aventure AB
Examiner: Maud Langton, Department of Food Science, SLU
Credits: 30 hec Level: Advanced A2E Course title: Independent Project in Food Science – Master Thesis Course code: EX0425 Programme/education: Agronomy in Food Science Place of publication: Uppsala Year of publication: 2015 Title of series: Publikation/Sveriges lantbruksuniversitet, Institutionen för livsmedelsvetenskap Serie no: 402 Online publication: http://stud.epsilon.slu.se Keywords: sensory analysis, consumer field test, energy dense drink, malnutrition
Sveriges lantbruksuniversitet Swedish University of Agricultural Sciences
Faculty of Natural Resources and Agricultural Sciences Department of Food Science

1
Abstract The average length of life is increasing in the western world, hence the older
population is growing. A common health problem among the elderly is malnutri-tion. Malnutrition causes decreased body strength and is associated with an ampli-fied risk of infections, depression, fractures and increased mortality. The health care system is therefore faced with the challenge to prevent malnutrition among the growing population of elderly. This could be done by providing nutritious foods developed to meet the specific needs of elderly. The overall objective of this project was to test a healthy energy dense drink based on oats targeted for the el-derly consumers as a strategy to prevent malnutrition among elderly. The aim was further to test the energy dense drink on young active people, for comparison. The consumers’ attitude was investigated through a sensory consumer field test and the opinions of the personnel in the health care system were assessed through semi-structured interviews and a test market. The young preferred the Raspber-ry/blueberry product (52%) and the elderly favoured the Strawberry product (51%). The majority of the elderly could consume the product daily (61%) and thought that the new energy dense drink was needed on the market (68%). The personnel thought that the product was a good contribution to the market, but that it would benefit from a better package design and a less viscous texture. In conclu-sion, the energy dense drink was appreciated both by the elderly and the young consumers as well as by the personnel.
Keywords: sensory analysis, consumer field test, energy dense drink, malnutrition

2
Sammanfattning Medellivslängden i västvärlden har ökat, vilket lett till att den äldre population-
en växer. Ett vanligt hälsoproblem bland äldre är malnutrition, vilket i sin tur ökar risken för infektioner, frakturer och depressioner samt bidrar till ökad dödlighet. Därför står hälsovårdssystemet inför utmaningen att förebygga malnutrition bland den ökande äldre befolkningen. Detta genom att tillgodose näringsrika livsmedel speciellt utvecklade att matcha äldres behov. Syften med projektet var att testa en hälsosam energität dryck baserad på havre riktad mot äldre konsumenter som en strategi att förebygga malnutrition bland äldre. Vidare var syftet att för jämförelse testa den energitäta drycken på unga aktiva personer. Konsumenternas attityd un-dersöktes genom ett sensoriskt konsumenttest och åsikter från personal i hälso-vårdssystemet samlades in genom semistrukturerade intervjuer och en test mark-nad. De unga aktiva föredrog Hallon/blåbär produkten (52%), medan de äldre gillade Jordgubbs produkten (51%) mest. Majoriteten av de äldre kunde tänka sig en daglig konsumtion av produkten (61%), och tyckte samtidigt att produkten behövdes på marknaden (68%). Personalen tyckte att produkten var ett bra kom-plement till marknaden, men att den kunde förbättras genom en bättre designad förpackning tillsammans med en lösare konsistens. Sammanfattningsvis var den energitäta drycken uppskattad av både unga och äldre konsumenter samt personal i hälsovårdssystemet. Nyckelord: sensorisk analys, konsumenttest, energität dryck, malnutrition

3
Table of contents
1 Introduction 7 1.1 Malnutrition among elderly people 7
1.1.1 Nutritional requirements among elderly people 7
1.1.2 Prevention of malnutrition among the elderly 8
1.1.3 Incorporation of nutrient enriched- and energy dense drinks in the diet9
1.2 Product development 9
1.3 Oat products and their health effects 9
1.4 Health effects related to β-glucans in oats 10
1.5 Test market 11
1.6 Sensory analysis 11
1.6.1 Objective- and subjective methods 11
1.6.2 Consumer field tests 12
1.6.3 Sensory consumer tests 13
1.6.4 Questionnaire- and interview design 14
1.6.5 Focus group discussion 15
1.6.6 Psychological errors effecting the sensory evaluation 15
1.7 Aim 16
2 Materials and methods 17 2.1 Materials 17
2.2 Methods 18
2.3 Improvements of test products 18
2.3.1 Colour test 18
2.3.2 Making the Strawberry and the Raspberry-blueberry products 19
2.3.3 Improvements of the Strawberry product 19
2.3.4 Evaluation of the consistency 20
2.3.5 Analysis of the flinched products 20
2.4 Evaluation of the test product by consumers and personnel 20
2.4.1 Test market 21
2.4.2 Sensory consumer field test 22
2.4.3 Focus group discussion 22
2.4.4 Semi-structured interviews with personnel 23
2.4.5 Statistical analysis 23
3 Results 24 3.1 Improvements of test products 24
3.1.1 Colour test 24

4
3.1.2 Producing the Strawberry and the Raspberry/blueberry products 24
3.1.3 Improvements of the Strawberry product 25
3.1.4 Evaluation of the consistency 26
3.1.5 Analysis of the finished products 26
3.2 Sensory consumer field test 27
3.3 Focus group discussion 31
3.4 Semi structured interviews with the personnel 32
4 Discussion 33 4.1 Optimisation of the test product 33
4.1.1 Colour test 33
4.1.2 Adjustments of the strawberry taste 33
4.1.3 Evaluation of the consistency 33
4.1.4 Analysis of the finished product 34
4.2 Sensory consumer fired test 34
4.2.1 Young active persons 35
4.2.2 Elderly participants 35
4.2.3 Psychological errors 36
4.3 Focus group discussion 37
4.4 Semi structured interviews with the personnel 37
5 Conclusion 39
References 40
Appendix 1 Recipe Strawberry 43
Appendix 2 Recipe Raspberry/blueberry 44
Appendix 3 Recipe Apple/pear 45
Appendix 4 Nutritional calculations Strawberry 46
Appendix 5 Nutritional calculations Raspberry/blueberry 47
Appendix 6 Nutritional calculations Apple/pear 48
Appendix 7 Information sheet drink+ 49
Appendix 8 Consumer field test, hospitals and institutional homes 52
Appendix 9 Consumer field test young physical active persons 60
Appendix 10 Focus group discussion questions 66

5
Appendix 11 Semi-structured questions for the personnel 67
Appendix 12 Popular scientific summary-Judgements of a fresh new product69

6

7
1 Introduction
1.1 Malnutrition among the elderly people During the last century the expected life time in the western world has increased
by 30 years. This rise is thought to continue, meaning that the majority of the peo-ple born today will reach 100 years and more (Christensen et al., 2009). Therefore the demography of the society will be pushed towards an older population, also because of lower birth numbers (Livsmedelverket, 2011a). When getting old the risk of malnutrition and disease increase (Mowé, Bohmer & Kindt, 1994). Malnu-trition among elderly is associated with increased risk of infections, decreased body strength, depression, fractures and increased mortality (Lauque et al., 2000). Malnutrition is a common problem among elderly living at institutional homes as reviewed by Pauly, Stehle & Volkert (2007). An increased disability and function-al impairment rises the risk of malnutrition. In Europe 37% of the institutionalised elderly suffer from malnutrition (Guigoz et al., 2002). The social care systems therefore face a challenge to feed this growing elderly population with nutritious food (Livsmedelsverket, 2011b).
1.1.1 Nutritional requirements among elderly people
Elderly persons have different energy and nutrient requirements than adults (Livsmedelverket, 2011b). The body composition will change when ageing due to decreased muscle mass (scarpenia) and increased amount of fat tissue, partly due to lower physical activity. Fat tissue requires less energy than muscle tissue, hence the daily energy requirement will decrease for elderly people (Bales & Ritchie, 2002). The recommendations of vitamins and minerals are about the same for el-derly as for healthy adults, with the difference of an increased need of vitamin D. The elderly above 75 years are recommended 20μg/day whereas as adults ought to

8
consume 10 μg/day (NNR, 2012). In a study made by Manders et al (2009) more than 80% of the institutionalised elderly had vitamin D deficiency. Elderly are also recommended to increase the proportion of protein in their diet from 10-20E% (the recommendation for adults) to 15-20 E%. This due to scarpenia and since it is a chronic disease, being more common among elderly, it often causes protein loss together with decreased appetite (NNR, 2012).
1.1.2 Prevention of malnutrition among elderly
In order to prevent malnutrition, different strategies are needed. First of all, el-derly suffering from malnutrition need to be identified (Pauly, Stehle & Volkert, 2007). Food is essential within prevention of malnutrition. However foods do not only provide nutrition and energy but are also important for the wellbeing. To promote wellbeing, the food health care system for elderly would benefit from being more individualized, both regarding physical- and psychological needs (Livsmedelverket, 2011b). An interview study by Wikby & Fägerskjöld (2004) confirms that the willingness to eat and the appetite among elderly were associated with both external and internal factors such as mood, personal values, eating envi-ronment as well as the wholesomeness of the food. The study also highlights the need of individual nutritional care in the prevention of malnutrition.
In order to prevent malnutrition, the food provided for elderly should be careful-ly adapted with an appropriate composition. Because of lost appetite among elder-ly, a good solution to cover the daily energy need is to serve several small meals per day (Livsmedelverket, 2011b). About six meals per day are favourable, with three main meals and three snacks. The inclusion of desserts and energy dense drinks in the daily menu will therefore contribute to an increased energy- and nu-trient intake (Livsmedelverket, 2011b & bpacnz, 2011).
Upon ageing the olfaction will deteriorate, meaning that the ability to sense and separate flavours will rust (Griep et al, 1995). The receptors of the tongue will also change when getting older, resulting in a decreased sensitivity and ability to detect and identify food flavours (Livsmedelverket 2011a). Salivary hypofunction, xero-stomi or dry mouth is a common problem among elderly. The problem has many causes, for example decreased saliva production or plethora of medications. Sour foods are known to enhance saliva production and can thus help in the prevention of xerostomi (Turner & Ship, 2007). An extra focus upon taste and flavour is therefore needed when preparing food for elderly people in order to stimulate the appetite (Livsmedelsverket, 2011a). Due to vision impairment the importance of the foods appearance will diminish upon ageing (Livsmedelsverket, 2011a).

9
1.1.3 Incorporation of nutrient enriched- and energy dense drinks in the diet
One way to prevent malnutrition can be to incorporate energy dense products or enriched nutritional supplement into the normal diet without compromising the intake of the normal food (bpacnz, 2011). An energy dense drink is a good example of such a supplement that elderly can take as a snack or in addition of a whole menu (Manders et al., 2009). Studies have shown that serving of an energy dense drink will both increase the energy- and nutrient intake among elderly. Hence en-ergy dense drinks can be said to be a useful tool in prevention of malnutrition among institutionalised elderly (Manders et al., 2009; Laque et al., 2000).
1.2 Product development Food companies need to launch new products in order to be profitable and stay
interesting for the consumers. To develop new food products several factors needs to be taken into consideration, such as; research, suitable physical facilities, finan-cial resources and skilled personnel that can organise and conduct the product development (Fuller, 2011).
To know which new products to develop a food company needs to have ideas. Ideas can either be product- or consumer oriented. A product oriented idea is based on what raw material and technology that are present, from that a new con-cept is created. A consumer oriented idea on the other hand is based on what needs the consumers have, what kind of products they lack. A problem with product oriented ideas can be that the consumers do not see a need for these products and hence will not buy them. Therefore consumer oriented ideas are superior since a company always wants to reach economic growth (Jongen & Meulenberg, 2005).
There are three common steps in new food product development: Product strat-egy and definition, implementation and marketing and product introduction and commercialization (Rudolph, 1995). In order to develop the best product possible accepted by the right consumer segment, the consumers´ opinions are of great value to the developers in order to ensure that the consumers’ wants and needs are met (Brody & Lord, 2007).
1.3 Oat products and their health effects Oat (Avena sativa L.) is a cereal grain that is harvested with hulls. The hulls rep-
resent about 25 % of the total weigh and when removed the groat, or the naked kernel remains. The groat has a higher fat- and protein content compared with other cereals. Oats also contain several enzymes, one of them is lipase, causing

10
oxidation of fatty acids if not being denaturated. Enzymes are denaturated using heat treatment to prevent milled products from having a short shelf life (Delcour & Hoseney, 2010).
Oat grains are commonly accepted by consumers worldwide (Clemens & van Klinken, 2014a). The grains are used in a wide range of products such as low-energy beverages, medical foods, bakery goods and granolas (Clemens & van Klinken, 2014a). A large number of studies have consistently shown positive health effects of whole grain foods and recommendations about increased intakes have been endorsed by governmental agencies in many parts of the world (Clem-ens & van Klinken, 2014b). Oat is high in dietary fibres, and has unique physico-chemical properties (Delcour & Hoseney, 2010). A systematic review by Thies et al (2014) shows that several studies have proven that oat lowers the blood choles-terol. Hence association between reduced risk of cardio vascular diseases and dia-betes type two and whole grain consumption including oats have been made (Thies et al., 2014). Even though oat is a popular grain, the production is de-creased due to plant pathogens and climatic conditions (Badaeva et al, 2010).
1.4 Health effects related to β-glucans in oats Oat bran has a high concentration of the soluble fibres β-glucans (3-5%) (Asp,
Mattsson & Önning, 1991). Foods containing β-glucans have been shown to re-duce plasma cholesterol concentrations with about 5-10% (Othman, Moghadasian & Jones, 2011). It is thought that several mechanisms together causes the reduc-tion of cholesterol due to β-glucans. However the fact that β-glucans decreases the absorption of bile acid is accepted to be the dominant reason behind the cholester-ol lowering (Malkki, 2001). It has been shown that β-glucans contribute to a re-duced post-prandial glucose response and delayed gastric emptying (Braaten et al, 1991). This since the high molecular weight of β-glucans exhibit high viscosities at low concentrations (Ren et al, 2003).
The EFSA Panel on Dietetic Products, Nutrition and Allergies (2011) concluded that β-glucans from oats and barley are characterised well enough in order to make health claims about maintenance of normal blood LDL-cholesterol concentrations for products containing a sufficient amount of β-glucans.
Studies have shown that both the food matrix and the food processing may ef-fect the properties of β-glucans in foods. The β-glucans in fermented or intact grains seems to be more available than in more processed products (Tosh, 2013; Kreckhoffs, Hornstra & Mensink, 2003). Also the growing conditions and variety of oats may influence the amounts and the effects of the β-glucans (Asp, Mattsson & Önning, 1991).
11
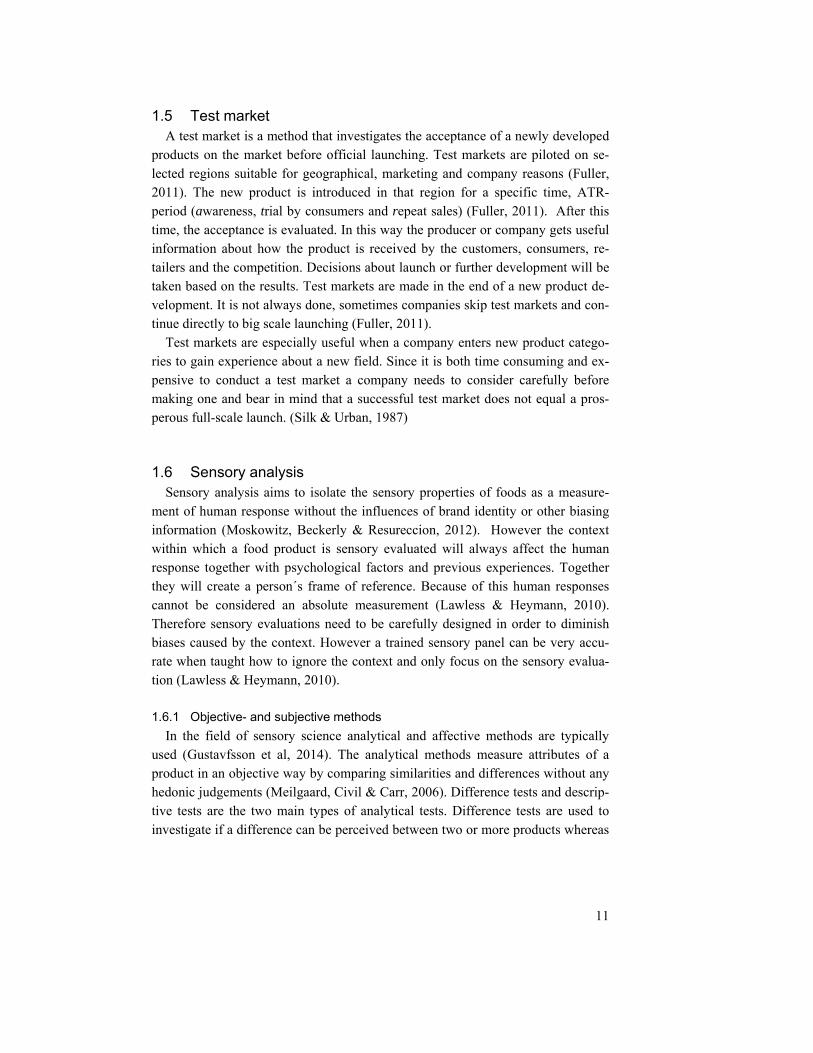
1.5 Test market A test market is a method that investigates the acceptance of a newly developed
products on the market before official launching. Test markets are piloted on se-lected regions suitable for geographical, marketing and company reasons (Fuller, 2011). The new product is introduced in that region for a specific time, ATR-period (awareness, trial by consumers and repeat sales) (Fuller, 2011). After this time, the acceptance is evaluated. In this way the producer or company gets useful information about how the product is received by the customers, consumers, re-tailers and the competition. Decisions about launch or further development will be taken based on the results. Test markets are made in the end of a new product de-velopment. It is not always done, sometimes companies skip test markets and con-tinue directly to big scale launching (Fuller, 2011).
Test markets are especially useful when a company enters new product catego-ries to gain experience about a new field. Since it is both time consuming and ex-pensive to conduct a test market a company needs to consider carefully before making one and bear in mind that a successful test market does not equal a pros-perous full-scale launch. (Silk & Urban, 1987)
1.6 Sensory analysis Sensory analysis aims to isolate the sensory properties of foods as a measure-
ment of human response without the influences of brand identity or other biasing information (Moskowitz, Beckerly & Resureccion, 2012). However the context within which a food product is sensory evaluated will always affect the human response together with psychological factors and previous experiences. Together they will create a person´s frame of reference. Because of this human responses cannot be considered an absolute measurement (Lawless & Heymann, 2010). Therefore sensory evaluations need to be carefully designed in order to diminish biases caused by the context. However a trained sensory panel can be very accu-rate when taught how to ignore the context and only focus on the sensory evalua-tion (Lawless & Heymann, 2010).
1.6.1 Objective- and subjective methods
In the field of sensory science analytical and affective methods are typically used (Gustavfsson et al, 2014). The analytical methods measure attributes of a product in an objective way by comparing similarities and differences without any hedonic judgements (Meilgaard, Civil & Carr, 2006). Difference tests and descrip-tive tests are the two main types of analytical tests. Difference tests are used to investigate if a difference can be perceived between two or more products whereas

12
descriptive tests are used to describe what the differences are, and their intensities (Lawless & Heymann, 2010).
The affective methods consist of consumer tests that either investigate the pref-erence or the acceptance among consumers. Preference tests provide information about which product is preferred over another. Acceptance tests on the other hand will give information about how much a product is liked and why (Meilgaard, Civil & Carr, 2006).
For product development, sensory analysis methods are of great use. A differ-ence test may be used if a company wants to launch an existing product but with a new package. The difference test will then provide information about the product being perceived the same or not, despite a new package (Lawless & Heymann, 2010). When developing a new product, descriptive tests are essential in order to get information about the intensity of the product attributes and what distinguish it from concurring products (Meilgaard, Civil & Carr, 2006). Consumer tests are used to get information about how consumers perceive a newly developed product or a modified product compared with an existing product. If the consumers do not prefer or accept the product then the company needs to change it in order to have a successful launch and good sales (Gustavfsson et al, 2014).
1.6.2 Consumer field tests
To prevent failure of new products on the market, consumer field tests are used (Gustafsson et al, 2014). Before launching of the new product the attitude and preference of consumers for the product is studied in order to ensure that the de-sired characteristics are successfully delivered (Moskowits, Beckley & Resurrec-cion, 2012). Problems that were not noted during laboratory tests can be observed through a sensory consumer field test and if modified before the actual launching the company can avoid costly mistakes (Fuller, 2011).
There is a difference between sensory evaluation filed tests and consumer prod-uct concept tests. The former is conducted by a sensory evaluation department whereas the latter is made by marketing researchers. The information gained by the tests is used in different ways depending on if the purpose is related to sensory science or marketing science. Marketers use the information in order to optimise the advertisements and marketing. The sensory experts on the other hand use the data collected in research and development (Fuller, 2011).
How the product is displayed to the consumers differs. Within marketing the full concept is presented. In a sensory test minimal information is given to the consumer. This because one wants avoid previous knowledge to affects the opin-ion of the new product (Lawless & Heymann, 2010). Also the number of partici-pants is different, in a sensory consumer test it common to have between 50-100

13
consumers; in a market research on the other hand one commonly uses more than 100 consumers. (Brody & Lord, 2007).
1.6.3 Sensory consumer tests
Consumer tests in the field of sensory science can be used both for launching new products or to modify already existing products. To succeed with a sensory consumer test it is essential to perform it on the right consumer segment in order to translate the results to a general population. If a product is aimed to be consumed by elderly the test should also be conducted among elderly, and preferably on con-sumers who use the product category frequently (Moskowits, Beckley & Resur-reccion, 2012).
To measure opinions of consumers, different scales are commonly used. The nine-point hedonic scale is the most common type of scale used in sensory test (see figure 1). The scale consists of nine statements indicating how liked or dis-liked a specified attribute is (Resurreccion, 1998).
Figure 1. Showing the nine-point hedonic scale In order to have statistical power in a sensory consumer test the number of at-
tenders shall be sufficiently large. About 75-150 participants are needed to ensure detection of a relevant difference in a population where the standard deviation in response is about 20-30% (Lawless & Heymann, 2010).
There are four common types of consumer sensory tests used to measure the overall acceptability of products. Namely; internal employee panel, local standing panel, central location test and home use test (Lawless & Heymann, 2010). If the personnel at a sensory test facility or a research department pose the members of a sensory panel then it is said to be an internal employee panel. This is a fast and economic method with the disadvantage that the panellists are not blind to the product concept and not randomly selected in order to represent a whole popula-tion (Resurreccion, 1988).
1. Like extremely 2. Like very much 3. Like moderately 4. Like slightly 5. Neither like nor dislike 6. Dislike slightly 7. Dislike moderately 8. Dislike very much 9. Dislike extremely

14
A local standing panel consists of a group of people living close together with similar socioeconomic status (Resurreccion, 1988). The group are intermittently asked to evaluate products. Since the same panel can be used for several types of product this is a time- and money saving method with easy distribution. The downside is that the opinions of the local group may not be representative for con-sumer opinions beyond that specific geographic area. The group is not randomly selected and the panellists may discuss the product amongst one another (Lawless & Heymann, 2010).
The most frequently used consumer test type regarding foods is the central loca-tion test. This test is often performed at a service provider, for example a shopping mall or a school. This method is more time consuming and expensive but reaches a bigger segment and a specific consumer field (Gustavfsson et al, 2014).
Home use tests are the most realistic test types since the product are brought home where they are normally consumed. This is however the most costly method, but on the other hand it gives representative and useful information (Resurreccion, 1988).
All four test types have advantages and disadvantages, which test to use is therefore a question of context, time, money and safety concerns. (Lawless & Heymann, 2010)
1.6.4 Questionnaire- and interview design
A questionnaire or an interview may be conducted in several ways; by a person asking questions, by a self-administrated paper, through a website or by telephone (Brace, 2008). Each method is suitable for different situations. The length of the interview/questionnaire is critical and it should in general not take longer than 20 minutes to complete (Lawless & Heymann, 2010).
A questionnaire, should go from more general questions to more specific ones to keep a good flow. In food consumer tests questions about the general opinion about the product shall be posed first, preferably using a nine-point hedonic scale. Among the more specific questions both open questions and liking-scales can be used. If more than one product is tested, the questionnaire can be ended with a preference question where preferred product can be indicated. The final part of an interview or a questionnaire should deal with questions about sensitive demo-graphic data, in this way the respondent will feel more comfortable to share per-sonal information.
The way questions are constructed is of great importance and the questions must be adapted and understood by the responders. Questions should be kept as brief as possible asking about information the respondent likely knows. The question should be specific and neutral, hence not suggesting a correct or an incorrect an-swer (Lawless & Heymann, 2010).

15
Constructing a decent questionnaire that is fit for purpose is complex and suffi-cient time for development should be devoted (Lawless & Heymann, 2010).
1.6.5 Focus group discussion
A focus group discussion is performed by a small group of participants, usually 8-12 people and a moderator leading the discussion (Lawless and Heymann, 2010). The group will discuss a specified topic or an issue, and gather data about the group’s perspective of the question. The questions being asked are opened-ended in order to stimulate interaction among the participants as well as between the participants and the moderator (Wong, 2008). The method has proven useful in several research fields such as sensory- medical and health research (Lawless & Heymann, 2010; Wong, 2008)
1.6.6 Psychological errors effecting the sensory evaluation
When performing sensory analysis it is important to be aware of psychological factors that may influence the judgements. When humans acts as the measuring instruments the risk of psychological errors will always be present. To minimize the errors, evaluation should be performed by qualified consumers. In affective tests there are a number of errors that needs to be considered when designing the study and data analysis is performed. The errors are called; error of central tenden-cy, sample presentation-order error, expectation error, stimulus error, leniency error and halo effect (Resurreccion, 1998).
It has been suggested that when using a hedonic scale, consumers tend to avoid the extreme points such as “like extremely much” on a nine point hedonic scale. Instead consumers commonly use the middle of the scale. Hence this error type is called error of central tendency (Meilgaard, Vance & Thomas, 1999).
It is known that the fist sample tried often scores higher values than if tested af-ter other products. To concur this sample presentation-order error it is recom-mended to use balanced sample presentation order, meaning frequency of the or-der of sample presentation shall be the same for all products (Meilgaard, Vance & Thomas, 1999).
When pre-knowledge about the product affects the judgement, this is called ex-pectation error (Resurreccion, 1998).
The stimulus error occurs when a panellists judges a stimulus instead of the ac-tual sensation. For example if judging wine when the sample with a screw cap will score lower than the sample with a wooden cork i.e. when the judgement of the wine is influenced by the closure method rather than its taste. To avoid this, such information should not be given to the panellists (Meilgaard, Vance & Thomas, 1999).

16
If a panellist judges the samples based on his or her feelings towards the persons who developed the product, instead of his or hers feeling about the actual product, this leads to leniency error. To minimize this risk one should use consumers that have no relation to the product developer.
Halo effect is described as the tendency to view a product more positively due to influential sensory attributes or other positive influences. Because of this a sen-sory test should be conducted in a sterile environment to avoid other factors to influence the judgement of the product.
Before conducting an affective consumer test the experimental design should be adapted to minimize the risk for different types of psychological errors (Resurrec-cion, 1998).
1.7 Aim The overall objective of this project was to test a healthy energy dense drink
based on oats targeted for elderly consumers as a strategy to prevent malnutrition among elderly. The aim was further to test the energy dense drink on young active people, for comparison. The specific aims included: Improvements of existing test products regarding the sensory attributes of
colour, taste and consistency. Arrangement of a test market at selected places in Sweden as well as a sen-
sory consumer field test in order to elucidate product attributes of im-portance to consumer acceptance.
Evaluation of the liking and usefulness of the developed energy dense drink in elderly health care by using semi structured interviews with the personnel at health care centres.
Assessment of the product acceptance among young active adults. .
17
2 Materials and methods
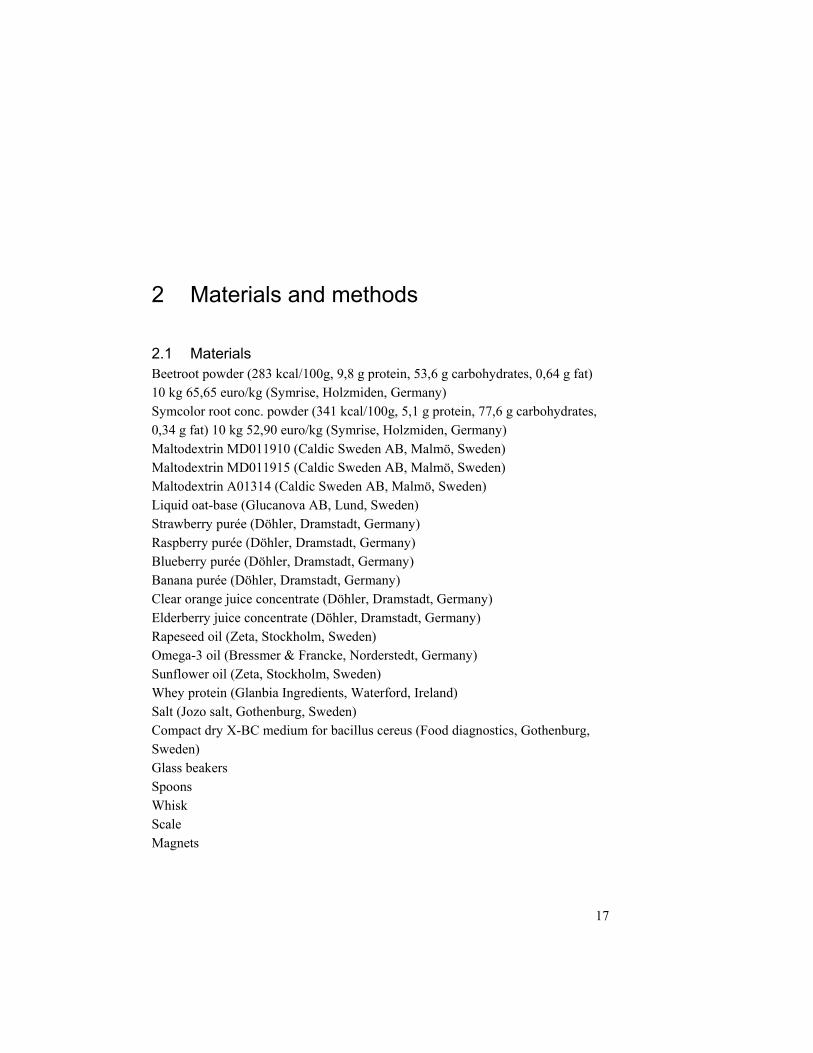
2.1 Materials Beetroot powder (283 kcal/100g, 9,8 g protein, 53,6 g carbohydrates, 0,64 g fat) 10 kg 65,65 euro/kg (Symrise, Holzmiden, Germany) Symcolor root conc. powder (341 kcal/100g, 5,1 g protein, 77,6 g carbohydrates, 0,34 g fat) 10 kg 52,90 euro/kg (Symrise, Holzmiden, Germany) Maltodextrin MD011910 (Caldic Sweden AB, Malmö, Sweden) Maltodextrin MD011915 (Caldic Sweden AB, Malmö, Sweden) Maltodextrin A01314 (Caldic Sweden AB, Malmö, Sweden) Liquid oat-base (Glucanova AB, Lund, Sweden) Strawberry purée (Döhler, Dramstadt, Germany) Raspberry purée (Döhler, Dramstadt, Germany) Blueberry purée (Döhler, Dramstadt, Germany) Banana purée (Döhler, Dramstadt, Germany) Clear orange juice concentrate (Döhler, Dramstadt, Germany) Elderberry juice concentrate (Döhler, Dramstadt, Germany) Rapeseed oil (Zeta, Stockholm, Sweden) Omega-3 oil (Bressmer & Francke, Norderstedt, Germany) Sunflower oil (Zeta, Stockholm, Sweden) Whey protein (Glanbia Ingredients, Waterford, Ireland) Salt (Jozo salt, Gothenburg, Sweden) Compact dry X-BC medium for bacillus cereus (Food diagnostics, Gothenburg, Sweden) Glass beakers Spoons Whisk Scale Magnets

18
Magnetic heater Water bath Electrical stirrer Microwave oven Immersion blender Thermometer Viscometer Dry matter measurer pH-meter
2.2 Methods
2.3 Improvements of test products An energy dense drink based on liquid oat bran had been developed in three
Swedish inspired varieties: Strawberry, Raspberry/blueberry and Apple/pear. The aim of the energy dense drink was that it should have a good taste and contribute to the fulfilling of the daily calorie requirement of its consumers. Because of this, improvements and evaluation of the products were performed before testing the product on potential consumer segments. Since the Apple/pear product was con-sidered to be good already, only the Strawberry and the Raspberry/blueberry prod-ucts were evaluated and improved.
2.3.1 Colour test
Twenty grams of the products, Strawberry and Raspberry/blueberry, were poured into glass beakers, four replicates of each. Different concentrations of the two beet root powders, beetroot powder and Symcolor root conc. powder were mixed into the samples, at 0.5 % or 0.8 % of the weight, respectively. The heat stability of the beet root colour powders were tested by heating at 100°C while stirring at 580 rpm for five minutes. The colour was also observed after 24 hours of cold storage.
According to instructions from the supplier, the Symcolor root conc. powder was supposed to be mixed with water before usage (5% solution). Both tastes were therefore coloured with the dilution (0.5 % of the solution were added). The sup-plier also recommended the beet root powder to be used in the concentration 0.25%; this concentration was therefore tested for both products.

19
The appearance of all samples were noted, compared between each other, and discussions were held between the experimenter and the supervisor of which powder type and concentration to use.
2.3.2 Making the Strawberry and the Raspberry-blueberry products
The oat-base was made by mixing 100 g of the pre-prepared flour mix, contain-ing oat bran flour and enzymes, with 900 g water (10% solution). The mix was then put in a 65°C water bath with an electrical stirrer for 1 hour. The mixture was then heated in a microwave oven two times until boiling and stirred in between, followed by cooling on ice to 4°C. After cooling, the mixture was homogenised by an immersion stirrer and stored in a refrigerator.
All ingredients were then mixed together and heated while stirring until 60°C, (for proportions and recipe see appendix 1 and 2). Finally, the drinks were filled into plastic bottles and stored in a refrigerator. Nutritional calculations were made for the two products (see appendix 4 and 5). The drinks were tasted and evaluated regarding colour appearance and taste by the person mixing the products. The density was measured by recording the weight of 50 ml of each sample, followed by calculating the kg/m3. The dry matter content was measured using a dry matter measurer and pH was registered using a pH-meter.
2.3.3 Improvements of the Strawberry product
Two salt (NaCl) concentrations 0.01% and 0.05% respectively were mixed into the Strawberry product. The samples were evaluated by taste and compared with a plane sample without any salt by the person making the samples.
After a meeting with a geriatric home the suggestion of adding orange juice to the Strawberry product was made, this because sourness stimulates the saliva pro-duction and hence the appetite. To get more sourness and freshness in the Straw-berry product, samples with incorporation of Raspberry, Orange juice and Elder-berry juice was made.
Raspberry purée was included in the Strawberry product in two different ways. In sample 1; 150 g of strawberry purée, 23g of raspberry purée and 50 g of banana purée were used. In sample 2; 173g of strawberry purée, 25 g of raspberry purée and 25 g of banana purée was used (for the rest of the recipe se appendix 1). Clear orange juice concentrate was included in the strawberry recipe. Sample 3 contained 4.6% of orange concentrate whereas sample 4 had 2.2% of orange con-centrate. Elderberry juice concentrate was added to the Strawberry product in two different concentration, sample 5 contained 6.6% elderberry concentrate and sam-ple 6 4.6%. The six samples were then tasted and evaluated regarding taste and

20
appearance by the experimenter and the supervisor in order to judge which ad-justments that were successful.
2.3.4 Evaluation of the texture
The Raspberry/blueberry product was made (see appendix 2 for recipe), but without adding maltodextrin. The drink was then separated into three glass beakers (142.5 g/beaker). After calculating 5% of the total weight, 7.5 g of each maltodex-trin type, MD011910, MD011915 and A01314, was added to each beaker. The solubility of the maltodextrin powders was observed and the texture of the three samples was later evaluated by tasting the samples. The viscosity was measured with a viscometer at 60 rpm with the sample temperature 19°C. The results were later discussed by the experimenter and the supervisor in order to decide which maltodextrin type to use in the recipes for the products.
2.3.5 Analysis of the flinched products
The three product types (Strawberry, Raspberry/blueberry and Apple/pear) were produced in a pilot plant in Belgium. Each variety were analysed by measuring the pH, the viscosity and the dry matter content using a pH-meter, viscometer and a dry matter measurer respectively.
The total bacteria count was obtained by sending samples of the three products to an external lab.
To analyse the B.cereus status in the three products four serial dilutions were made; 1:10, 1:100, 1:1000 and 1:10000 respectively under sterile conditions. One millilitre of each dilution were put ready plates with medium for B.cereus fol-lowed by incubation for 24 hours at 31°C. By counting the light blue/blue colonies on each plate the number of B.cereus were obtained.
The data was later used to compare similarities and differences between the samples and to see if the products were microbiologically safe to consume.
2.4 Evaluation of the test product by consumers and personnel In order to evaluate newly developed food products several tests are needed.
Not only quantitative measurements are important, also qualitative measures in-vestigating the markets reactions on a new product and the attitudes of consumers are essential (Fuller, 2011).
In this project, the primary target group are elderly (65 years or older), living at home, in an institutional home or at a hospital. Since young physical active per-sons have a high energy need, they are also considered a potential future consumer

21
segment. Hence young physical active persons exercising at least two times a week being within the age span of 15-35 years old are considered a secondary target group. The products were therefore tested on both elderly- and young active consumers.
In order to investigate how the concept of the new products worked in practice a test market was held together with semi-structured interviews with the personnel.
2.4.1 Test market
A test market was held at four selected places in Sweden, two institutional homes and two hospitals (Figure 1). The test market was initialised by performing a sensory consumer field test of the three products at the four places participating in the test market. Each test market location then got the three products (Strawber-ry, Raspberry/blueberry and Apple/pear) delivered to them together with an in-struction paper (Appendix 7). The test marked lasted for four weeks, during that time the staff at the four places were asked to serve the products daily. After two weeks two staff members from each location were interviewed by the telephone in order to evaluate how the concept of the new product had worked.
The results from the sensory consumer filed test together with the data from the interviews were later used in order to evaluate the consumers´ and the personnel´s attitude towards the products and the product concept. Test market places Sensory consumer field test locations
Figure 2. Showing an overview of the locations of the test markets and the sensory consumer field tests.
Institutional home Hyllie Park, Malmö, Sweden
Test performed at all departments
Hospital, Kungälvs Sjukhus, Sweden
Test performed at one department
Hospital, Ystad Lasatett, Sweden
Test performed at one department
Institutional home Gurataregården, Eslöv. Sweden
Test performed at two departments
Kungälvs Sjukhus 6 participants
Hyllie park 5 participants
Senior restaurant Leo-pold, Uppsala, Sweden
(occasion 1) 22 participants
Senior restaurant Leo-pold, Uppsala, Sweden
(occasion 2) 8 participants
Gutaregården 7 participants
Health care center Gear-dahallen, Lund, Sweden 96 participants (Young)
Ystad Lasarett 6 participants

22
2.4.2 Sensory consumer field test
2.4.2.1 Young physical active persons
A sensory consumer field test for young physically-active persons was per-formed at a health centre in Lund, Sweden (see Figure 1). Inclusion criteria were: age 15-35 y, and exercise at least two times a week. Exercise here was meant by either muscle- or cardio training at the health care centre or equivalent at another location. Attending participants were served the three samples in small plastic cups with a random three digit code. While trying the sample they were asked to fill out the questionnaire (see appendix 9). The test was finished when data from 96 participants was collected for data analysis.
2.4.2.2 Elderly persons
A sensory consumer field test was performed at the two hospitals and at two el-derly institutional homes with elderly consumers being 65 years old or older (see figure 1). Before starting the test, instructions were given orally together with in-formation that the participation was voluntary and that one could at any time de-cide not to join the sensory consumer field test. The ones that wanted to participate were served the three samples in small plastic cups coded with a three digit code. The consumers at these places were old and not capable of filling out the ques-tionnaire (see appendix 8) themselves. Therefore, the test leader helped each per-son performing the test, with reading the questions and filling out the question-naire.
In order to increase the number of elderly participants in the sensory consumer field test, the test was held at a senior restaurant in Uppsala two times with ap-proximately one week in between. The three samples were served in the same way as above using the same questionnaire. The test was performed in the same way at the two occasions but with new participants.
In total, 54 consumers participated in the sensory consumer field test, at the end of each visits, the questionnaires were collected and later used for data analysis.
2.4.3 Focus group discussion
A focus group discussion was held with four elderly persons living at home. All participants were above 75 years old, three women and one man. Three panel leaders were also present. The discussion started by asking general questions about what the panel thought about snacks (see appendix 10). Then different types of new products were evaluated by the panel, including the three products of the en-ergy dense drink (Strawberry, Raspberry/blueberry and Apple/pear). The panel

23
discussed what they thought about the products and the panel leaders asked addi-tional questions when required. The discussion was recorded and notes were taken by the panel leaders.
2.4.4 Semi-structured interviews with personnel
After two weeks of serving of the drink daily two members of each working staff at the two hospitals and the two institutional homes were interviewed by the telephone. The interviews had a semi-structured layout (see appendix 11) and aimed to evaluate the concept of having an energy dense drink in the daily routine. How it worked in practice to distribute the drink, serve the drink and how the per-sonnel perceived the consumers to like the drink. Notes were taken for each inter-view by the interviewer and later the data was summarised.
2.4.5 Statistical analysis
General linear model (GLM) was used in order to investigate how characteris-tics such as age, gender and location contributed to scoring of product the attrib-utes “general liking”, “colour”, “taste” and “consistency”. Friedman´s test was performed on ranking sums to see if the influence of colour, taste and consistency had a significantly different importance upon the choice of preference. The statis-tical program Minitab was used to conduct the statistical analysis.

24
3 Results
3.1 Improvements of test products The colour of the Strawberry and the Raspberry/blueberry products were im-
proved by the addition of beet root powder. By addition of salt and orange juice concentrate the Strawberry product got a better taste. By changing the malto-dexrine type in all three products a less viscous product was obtained.
3.1.1 Colour test
No distinct colour difference could be observed between the two powder types, Beetroot powder and Symcolour root conc. powder when blended into the prod-ucts. The higher concentration of the powders, 0.8%, resulted in a more intense and bright colour whereas the 0.5% concentration gave a less strong colouring. None of the eight samples showed any obvious change in colour upon heating. After 24 hours in cold storage the Beetroot powder had a more intense colour when used in both the Strawberry and the Raspberry/ blueberry product.
Addition of 0.25% the two types of beetroot powder resulted in colouring for both products. Colouring with the dilution of Symcolor root conc. powder resulted in almost no colouring at all. Both the Strawberry and the Raspberry/blueberry products looked about the same as before. Due to economic reasons and the colour stability it was decided to use 0.25% of the Beet root power as colouring agent.
3.1.2 Producing the Strawberry and the Raspberry/blueberry products
The Strawberry and the Raspberry/blueberry products were produced to evalu-ate their attributes to get an overview of the product characteristics. It was clear that the Strawberry product needed an improvement of taste, with a more intense strawberry taste and enhanced sourness. The Raspberry/blueberry product on the other hand had a good taste (see Table 1).

25
Table 1. Attributes of the Strawberry and the Raspberry/blueberry products Product Colour* Taste* Kcal/100 g Density
kg/dm3
Dry matter content %
Strawberry Natural pink
Oily, weak taste of
strawberry
1311 1.03 32
Raspberry/blueberry Natural purple
and pink
Sour, oily, strong taste
of both raspberry and blue-
berry
131 1.03 36
1The calorie content before the addition of orange juice concentrate, for modified calorie content see appendix 4. * Based on sensory evaluation performed by the experimenter.
3.1.3 Improvements of the Strawberry product
In order to improve the taste of the Strawberry product it was decided to include 0.01% salt and 4.6% orange juice concentrate in the recipe (see appendix 1).
3.1.3.1 Addition of salt to the Strawberry product
The sample with no added salt had a taste of oat together with a weak strawber-ry taste and an oily texture. The sample with 0.01% salt had a mild sourness and an enhanced strawberry taste with an aftertaste of oats. With the inclusion of 0.05% salt a light taste of salt could be sensed together with a weak strawberry taste and an after taste of oat. After the taste evaluation it was decided to include 0.01% salt in the strawberry product recipe (see appendix 1).
It was shown that incorporation of orange juice concentrate in the Strawberry product gave a more sour and fresh taste together with an enhanced strawberry taste. Therefore it was decided to include 4.6% of orange juice concentrate in the recipe (see appendix 1 and Table 2). The addition of elderberry juice concentrate was shown to give an acrid taste and a dark purple color. A higher proportion of strawberry- versus banana purée gave a pink color and a fresher taste compared with a higher proportion of banana purée (Table 2).

26
Table 2. Taste- and appearance evaluation of different samples of the Strawberry product with different fruit purée proportions (sample 1-2) and separate additions of orange- and elderberry juice concentrate (sample 3-6). Sample Taste evaluation Appearance
1a Smooth, oat taste, weak taste of strawberry
Pink colour
2b Smooth, weak sourness, fresh taste of berries
Pink colour
3c Fresh and sour taste, no clear taste of orange
Pink colour, a bit lighter than sample 1 and 2
4d Oat taste, heavy Pink colour, a bit lighter than sample 1 and 2
5e Acrid and bitter taste Dark purple colour 6f Fresh and acrid taste Dark purple colour
a150 g strawberry, 23,25g raspberry, 50g banana b173.25g strawberry, 25g raspberry, 25g banana c4,6% orange concentrate d2,2% orange concentrate e6,6% elderberry concentrate f4,6% elderberry concentrate
3.1.4 Evaluation of the texture
Because the maltodextrin variety called MD01915 was easy to dissolve and gave a less viscous and smooth drink, it was decided to use this type in all three product recipes (Table 3 and appendix 1-3).
Table 3. Evaluation of the mouthfeel, the viscosity and the solubility of the three maltodextrin types added to the Raspberry/blueberry product.
Sample Texture Viscosity Solubility
MD01910 Smooth, a bit thicker compared with the others
424 cp1 Hard to dissolve
MD01915 Smooth, medium thick-ness
405 cp1 Easy to dissolve
A01314 Smooth but also slimy, quite loose consistency
430 cp1 Easy to dissolve
1 cp= milli Pascal-second
3.1.5 Analysis of the finished products
Improved products produced in the pilot plant were evaluated and results are shown in Table 4. The Apple/pear product has a higher pH and a lower viscosity and dry matter content compared with the Strawberry and the Raspberry/blueberry products. A low dry matter content is correlated with a low viscosity due to less

27
particles. The microbiological analyses show that all three products are considered to be safe. Table 4. Displaying the measured pH, viscosity and dry matter content together with the total bacteria count and the B.cereus count for the three flavours pro-duced in the pilot plant.
Flavour pH Viscosity* Dry mat-ter con-
tent
Total bacte-ria count
B.cereus count
Strawberry 4.8 1612 cp 35% 10 cfu/g 0 Raspberry/blueberry 4.7 1800 cp 32% 200 cfu/g 0
Apple/pear 5.6 638 cp 25% <100 cfu/g 0 *Using spindle number 63 and sample temperature 16°C.
3.2 Sensory consumer field test Ninety-six young active persons (65 women and 31 men) participated in the
sensory consumer field test together with 54 elderly persons (33 women and 21 men). As seen in Figure 3a-b, no big differences existed between how the young and the elderly scored the three products. Both groups gave the Apple/pear product worst scores regarding general liking, colour and taste and the Raspber-ry/blueberry product best scores on the colour. All products were judged equally concerning the consistency by both groups. The elderly gave the Strawberry prod-uct best taste scores.
Figure 3a. Summary from young active persons.
0
2
4
6General liking
Colour
Taste
Consistency
Strawberry Raspberry/blueberry Apple/pear

28
Figure 3b. Summary from elderly persons. Figure 3a-b shows a summary of what the consumers thought about the three samples (Strawberry, Raspberry/blueberry and Apple/pear) regarding the attrib-utes colour, taste and consistency (2a displays young active persons and 2b elder-ly). The values were based on the nine-point hedonic scale where 1=like extremely much and 9=dislike extremely much.
In the sensory consumer field test it was shown that 68% of the elderly thought the products were needed and that 61% of the elderly could consume the products daily, and 30% sometimes.
The serving sequence of the Strawberry and Raspberry/blueberry products was
almost the same for elderly and young with the Apple/pear product served first fewer times than the Strawberry and Raspberry/blueberry products. The Ap-ple/pear product was also the least preferred product by both groups. Most of the young preferred the Raspberry/blueberry product whereas the majority of the el-derly favoured the Strawberry product. No apparent difference was observed with-in the groups of young and elderly. However some differences existed, for exam-ple; young men and the age group 26-35 years preferred the Apple/pear product more frequently than the young women and the age group 15-25 years. For the elderly the preference distribution were more equally between the genders. Differ-ences existed between the age groups 65-75 and 75+, where the 75+ preferred the Raspberry/blueberry product more and the 65-75 on the other hand choose the Apple/pear product to a greater extent (Table 5).
0
2
4
6General liking
Colour
Taste
Consistency
Strawberry Raspberry/blueberry Apple/pear
29
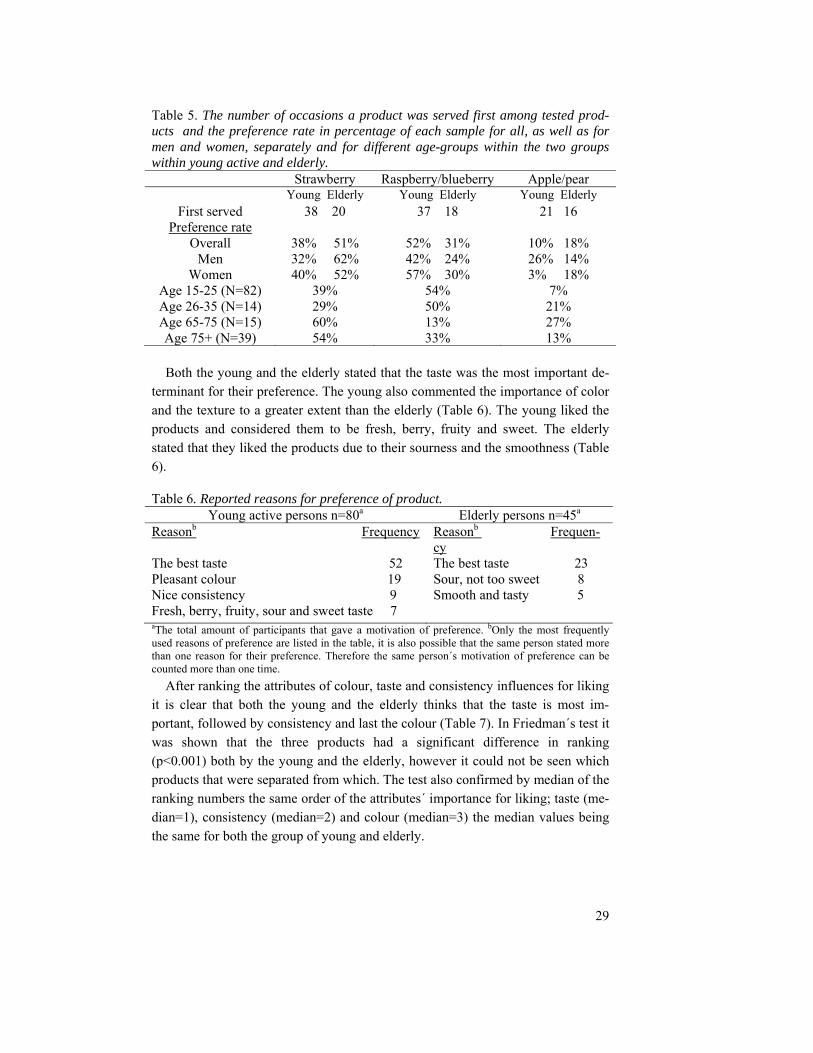
Table 5. The number of occasions a product was served first among tested prod-ucts and the preference rate in percentage of each sample for all, as well as for men and women, separately and for different age-groups within the two groups within young active and elderly.
Strawberry Raspberry/blueberry Apple/pear Young Elderly Young Elderly Young Elderly
First served 38 20 37 18 21 16 Preference rate
Overall 38% 51% 52% 31% 10% 18% Men 32% 62% 42% 24% 26% 14%
Women 40% 52% 57% 30% 3% 18% Age 15-25 (N=82) 39% 54% 7% Age 26-35 (N=14) 29% 50% 21% Age 65-75 (N=15) 60% 13% 27% Age 75+ (N=39) 54% 33% 13%
Both the young and the elderly stated that the taste was the most important de-
terminant for their preference. The young also commented the importance of color and the texture to a greater extent than the elderly (Table 6). The young liked the products and considered them to be fresh, berry, fruity and sweet. The elderly stated that they liked the products due to their sourness and the smoothness (Table 6). Table 6. Reported reasons for preference of product.
Young active persons n=80a Elderly persons n=45a
Reasonb Frequency Reasonb Frequen-cy
The best taste 52 Pleasant colour 19 Nice consistency 9 Fresh, berry, fruity, sour and sweet taste 7
The best taste 23 Sour, not too sweet 8 Smooth and tasty 5
aThe total amount of participants that gave a motivation of preference. bOnly the most frequently used reasons of preference are listed in the table, it is also possible that the same person stated more than one reason for their preference. Therefore the same person´s motivation of preference can be counted more than one time.
After ranking the attributes of colour, taste and consistency influences for liking it is clear that both the young and the elderly thinks that the taste is most im-portant, followed by consistency and last the colour (Table 7). In Friedman´s test it was shown that the three products had a significant difference in ranking (p<0.001) both by the young and the elderly, however it could not be seen which products that were separated from which. The test also confirmed by median of the ranking numbers the same order of the attributes´ importance for liking; taste (me-dian=1), consistency (median=2) and colour (median=3) the median values being the same for both the group of young and elderly.

30
Table 7. Showing the mean values of the rang numbers when the consumers were asked to rang which attribute (colour, taste and consistency) that were most im-portant for liking a product; 1=most important and 3= least important.
Colour Taste Consistency
Young Elderly Young Elderly Young Elderly 2.8 2.2 1.0 1.0 2.2 1.9
. In Table 8 it is displayed that the products were appreciated both by the young
and the elderly, especially the Strawberry and the Raspberry/blueberry products with means between 2.9-4.2 on the 9-pion hedonic scale where 3= moderately liked. Apple/pear had higher means reaching from 4.1-5.4, but it was still consid-ered good since 5 represented neither like nor dislike. The young judged signifi-cant differences in product colour (p<0.05) . The elderly could not detect a signifi-cant colour difference between the Strawberry- and the Raspberry/blueberry prod-uct (p<0.05). The young consumers did not sense a clear difference in taste be-tween the Strawberry- and the Raspberry/blueberry product (p<0.05) . Moreover, the elderly scored the different tastes differently (p<0.05). A significant difference in consistency between the Apple/pear- and the Strawberry product was seen by the young, but the Raspberry/blueberry product could not be separated from the other two products (p<0.05). The elderly did not detect any significant difference in consistency between any of the three products (p<0.05). Table 8. Liking (1-9) of colour, taste and consistency for the three products (Strawberry, Raspberry/blueberry and Apple/pear) among young and elderly, respectively.
Product Colour Taste Consistency
Young Elderly Young Elderly Young Elderly
Strawberry 3.8A 4.2A 3.4A 3.0A 3.5A 3.5A Raspberry/blueberry 2.9B 3.1A 3.6A 4.1B 3.8AB 4.2A
Apple/pear 5.0C 5.2C 5.4B 5.2C 4.2B 4.1A
Differences in liking was tested by GLM where product and gender were entered as a factor in the model. Different letters indicate statistically difference between products (p<0.05) as evaluated by a post hoc t-test.
Table 9 shows that all attributes were perceived significantly differently be-tween products, except for the elderly and the perceived consistency (p<0.05). Gender significantly affected how elderly judged the consistency (p<0.05). The age of the young active affected how the taste and consistency were judged (p<0.05).

31
Table 9. P-values derived from GLM where product, gender, age and location were included as factors in the model for different attributes
Factor p-value colour
p-value taste
p-value consistency
Young Elderly Young Elderly Young Elderly Product 0.00 0.00 0.00 0.00 0.01 0.09
Gender 0.95 0.16 0.05 0.15 0.44 0.00
Age 0.45 0.13 0.03 0.14 0.01 0.15
Location 0.90 0.96 0.05
p<0.05 was considered statistically significant.
3.3 Focus group discussion The usual snack in the afternoon for the panel of elderly consisted of coffee and
a sweet cookie. They all responded that they did not have the snack because they were hungry, rather because they thought it was a nice and social thing to do. When they were asked if they lacked some special snack on the market, all panel members thought there was more than enough already, and that they rather pre-ferred making their snacks themselves. This is because it was considered cheaper and contains less additives. If they were to buy a snack, they wanted it to be healthy, not too sweet and not too big in size, with a clear statement that it was aimed to be good for elderly persons. They stressed the importance of the price and that many old people do not have a lot of money. They also highlighted that the main reason for buying a snack would be that it tastes good.
When trying the drink, all panel members liked all the three products. All four participants preferred the Apple/pear product. This is because it had a nice and smooth texture with a sweet taste. Since the Strawberry- and the Raspber-ry/blueberry products had a thicker consistency, it was suggested to be consumed with a spoon.
If they would have the products as a snack they would want to consume 1,5-2 dl either in a glass, a small bowl or a tetra container with a straw. They would buy the product if it had a good price and if they knew it was good for elderly. They also had a positive attitude for β-glucans and wanted products containing them due to its cholesterol lowering abilities.

32
3.4 Semi structured interviews with the personnel One department at one of the institutional homes did not serve the drink after
the sensory consumer filed test had been performed. This was because the elderly that participated in the sensory consumer field test did not want the drink. Howev-er, all the other chosen departments at the institutional homes and the hospitals joined the test marked and served the drink daily. The personnel thought that the package of the drink was difficult to handle. The package was too big (2 li-tres/package) and when pouring the drink it easily got messy. To solve this prob-lem the drink was poured into cans before distribution. All personnel at the four different places thought that it would be better to have the drink in smaller pack-ages of one litre, similar to a milk package. The staff that served the drink all thought that this kind of product was needed and that it was a good option, espe-cially for the ones having difficulties eating.
At the different places, the drink was served in different ways, this was because no clear instruction about how to serve the drink was given. In the instructions it was only suggested to serve between 1.5-2 dl. One of the institutional homes chose to serve 1.5 dl in wine glasses. The other institutional home served 1-1.5 dl of drink in small plastic glasses. At one of the hospitals they served 0.75-1 dl of the drink in normal glasses, here the more viscous products (Strawberry and Raspber-ry/blueberry) were served with a spoon whereas the Apple/pear taste were not due to its looser consistency. The second hospital served 0.5 dl of the drink in small plastic glasses.
At all four places the consumers generally consumed the full volume they were served. The drink was served several times each day, sometimes in combinations with other foods and other times alone. It was mostly considered as an in between meal and an evening snack.
The attitude towards the products among the consumers were mostly positive, with the exception of the ones being very ill that had a negative attitude. Overall the personnel got comments about that the consistency being too viscous if it was meant to be consumed without a spoon. There were also opinions about the drink tasting too much of banana. Because of the fact the all drinks contains banana, and since that was not being referred to in the name some consumers felt misguided. Some also thought the drinks had a strong after taste of oats, and that the oat taste was too distinguished.

33
4 Discussion
4.1 Optimisation of the test product
4.1.1 Colour test
The calorie content differed between the two powder types. The Symcolor root conc. powder had a higher calorie- and carbohydrate content. The Beetroot powder on the other hand had a lower calorie content but a higher protein- and fat content. Hence one can choose between a higher calorie content or a higher protein- and fat concentration.
Also the price of the powders were of interest when choosing which one to use. The Beetroot powder were more expensive than the Symcolor root conc. powder. The Beetroot powder was more expensive but gave a better result regarding col-ouring and colour stability.
4.1.2 Adjustments of the strawberry taste
Adding more strawberry purée did not enhance the sourness as was hoped, nei-ther did the addition of elderberry juice concentrate (see Table 2). Probably elder-berry flower juice concentrate would have given more sourness and not a purple colour. Due to misunderstandings the wrong concentrate was ordered.
4.1.3 Evaluation of the texture
The sample A01314 had the highest value measured by the viscometer, but was perceived to have a loosest texture (see Table 3). This confirms that it is important to both evaluate the viscosity with mechanical measurements as well as sensory analysis.

34
4.1.4 Analysis of the final product
Proportions of the ingredients hardly differed between the products (appendix 1-3). The differences were due to the fruit purées, where the Strawberry, Raspberry and Blueberry purées contains more particles than the Apple- and Pear purées. Therefor the Apple/pear product will gain a lower viscosity and a lower dry matter content compared with the other two products (Table 4).
Why the pH was higher for the Apple/pear product (Table 4) most likely has to do with the fruit purées as well.
Higher total aerobic bacteria count was observed for Raspberry/blueberry prod-uct and this could be due to contamination while preparing the samples, or during the making of the product but all the three products were within a good range and was considered to be safe.
4.2 Sensory consumer filed test The young and the elderly did not seem to notice any difference in consistency
between the products (see Figure 3a-b). These results are somewhat conflicting since many commented on the fact that the Raspberry/blueberry- and Strawberry products were too viscous. These two products do have a distinctly higher viscosi-ty compared with the Apple/pear product (Table 4). Why the consumers did not score different regarding the consistency can be due to the fact that the question about the consistency was the last one, and then people might have gotten tired and wanted to finish the questionnaire. It can also be because people did not fully understand the meaning of the expression consistency.
Perhaps there were more young men within the age group 26-35, that can ex-plain why this age group preferred the Apple/pear product. Why the young men seemed to prefer the Apple/pear product more and the young women the Raspber-ry/blueberry product was hard to say, it is probably a combination of both external factors and sensory attributes. The majority of the young participating were wom-en , therefore it was likely that the preference rating would have been different if the gender distribution were more equal.
The age group 75+ prefers the Raspberry/blueberry product more compared with the 65-75 group. This may be linked to the fact that sour foods stimulate the production of saliva and that elderly often suffer from xerostomi and hence like sour foods. It was also mentioned by the elderly that they like the products due to their sourness (Table 6). The Raspberry/blueberry product has the lowest pH and can therefore be said to be most sour product (Table 4).

35
The Raspberry/blueberry product, preferred by the majority of the young, had the strongest colour. The young commented on the colour influencing the liking, also the texture was mentioned more by the young compared with the elderly (Ta-ble 6). Since young persons have stronger senses compared with elderly perhaps they notice the colour and the texture more and therefore it may influence the choice of preference more for young compared with elderly. A difference within the senses of young and elderly was confirmed by the fact that young active and elderly perceived the attributes of the three products differently through their sens-es. It was also clear that the elderly had trouble understanding how to judge the consistency of the three products (Table 8).
It makes sense that age affects how the young judge the taste and the consisten-cy, since people within the same age groups are likely to have similar experiences and further similar frames of reference. This is also a reason of why young and elderly differ in their judgements (Table 6, Table 8 and Table 9).
4.2.1 Young active persons
Since the test was performed at a health care centre, people that participated were on the go and sometimes in a rush. Because of this some people chose not to participate due to lack of time. To make the test proceed faster and more smoothly, it would have been better with two persons conducting the test instead of one. Then there would have been more time to explain the test and at the same time ask people to participate. Due to this, there was no time to use balanced serving order.
Going through the questionnaires it was clear that some had used the scale in the opposite way, using 1 as dislike extremely much instead of like extremely much. It is commonly known to use a scale from 1-10 where 10 is the best. It was described in the instructions how to use the scale but obviously not everyone read the instructions carefully. Therefore it would have been preferable to give oral explanations to all participants. With two test leaders oral instructions could have been given to more people. Perhaps it would have been better using a scale with words instead of numbers, then the problem with using the scale in the opposite way would have been avoided. In retrospective the best solution would have been to turn the scale and use 1 as dislike extremely much and 9 as like extremely much in order to make it more logical. It was a mistake to not think of this solution.
4.2.2 Elderly participants
The elderly participating in the consumer field test at the two institutional homes and the two hospitals were not able to fill in the questionnaires themselves. This was due to their high age, mental state and physical disabilities. The test leader helped each individual to conduct the test by explaining, reading the ques-

36
tions and fill in the questionnaire for them. The fact that the elderly did not fill out the questionnaires themselves may be a problem since the test leader could have introduced unintentional bias. However because the test leader filled out the ques-tionnaires they were filled in correctly and the consumers got each question ex-plained and could ask questions if they wanted.
Due to the mental state of the elderly not everyone fully understood the concept of the test. Many had problems with the scales, it was proven difficult to choose a number that represented a sensation. Perhaps it would have been easier to relate to expressions instead of numbers. As for the young and physical active persons pos-sibly it would have been better using a scale with words instead of numbers. Since no training was made before conducting the test the scale cannot be guaranteed to be used in the same way by all. This makes the results less reliable.
Before conducting the test a supervisor at one of the institutional homes and a dietician, experienced with elderly, had been giving feedback on the questionnaire. Therefore it was thought that the elderly could fill in the questionnaire themselves. However after performing the sensory consumer field test it was established that this type of questionnaire was too complicated for the elderly at these places. A simpler sensory test like a paired comparison test or a ranking test might would have worked. Since the aim was to gather information about which and why cer-tain attributes lead to liking or disliking of the product, paired comparison- or ranking test would not fulfil this aim. Therefore one chose to have this type of questionnaire. To make the result more reliable it would have been better to train a panel of elderly to use the scale in the right way and calibrate them to judge the wanted sensory attributes. Due to time limiting factors this was not possible and hence it was chosen to perform this type of questionnaire (see Appendix 8). For further studies it would be recommended to train a panel to judge sensory attrib-utes and to use a paired comparison test or ranking test for preference data.
The elderly are a difficult target group when conducting questionnaire studies, especially if staying at hospitals or institutional homes. People at these places are often ill and not in the mood nor the state of wanting to participate in a question-naire study. This, together with the fact that they did not fill out the questionnaire themselves, resulted in fewer answers than expected.
4.2.3 Psychological errors
As can be seen in Table 5 the Apple/pear product that was served first fewest times also has the lowest preference number within both groups of young and el-derly. Therefore one can suspect that balanced serving order error may have oc-curred. Moreover the serving order is not the only thing that will affect the prefer-

37
ence, sensory attributes are of greater importance. However unconsciously, the serving order may well influence the choice of preference.
When analysing the questionnaires the error of central tendency could not be seen. People used the whole scale, also the extreme points. When presenting the samples participants were told it was an oat-based product with added fruits. Per-haps some people connected this with health and therefore gave the products fa-vourable scores. Also the opposite is possible, that this pre-knowledge may affect the judgement in a negative way. Because of this it is likely that some expectation error have occurred among the participants.
The test was not performed in a sterile environment, there were many sounds and many people moving, especially at the health care centre. It was also possible for the consumers to talk to each other while conducting the test, even though this was not recommended. Therefore, halo effect most likely occurred to some extent. This is however natural since a central locations test cannot be performed in a sterile environment with consumers sitting in separate booths.
Since the samples were served in plastic cups and the packages were not visible for the consumers, it is not probable that stimulus from the package have affected the judgements, therefore the risk of stimulus error is low. The test leader did not know the persons participating in the test, and the company producing the products was not marketed, only mentioned if someone asked. Hence likelihood of leniency error is low.
To which extent psychological error have occurred or not is hard to estimate or know. Because humans are the measuring instrument it is however clear that psy-chological errors will happen. It is also a bigger risk for psychological errors when conducting a consumer filed test, this because the respondents are not trained with-in sensory judgement.
4.3 Focus group discussion Based on the focus group discussion the product would benefit from having a
clear statement that it is beneficial for elderly to consume, it should therefore be marketed towards the elderly. They also had a positive attitude towards the fact that the product contains natural ingredients, no additives and β-glucans. Mention-ing this in the marketing of the product would hence be beneficial.
4.4 Semi structured interviews with the personnel Since no direct instructions about how and when to serve the drink was given, it
was up to each place to decide this. The drink was served at different times, which proves that it can be used both as an in between meal and as complement to a full

38
meal. Since it is a drink it is easy to distribute it several times a day in order to match individual needs and preference. As to how much to serve it would be ad-visable to serve at least 1 dl to obtain a distinct contribution of calories. To only serve 0.5 dl is not enough if the aim is to fulfil the daily calorie requirement. Be-cause of this an instruction instead of a recommendation about how much to serve would have been better.
The fact that the ones being served the drink consumed the volume being served, was a good proof of that the products are appreciated. It is also good in a nutritional point of view.
It was clear that some staff members were more motivated than others to partic-ipate in the test market. It is therefore important to inform the personnel before about the aim and the background of such a project. Here the responsible manager deciding to participate in the test markets has an obligation. The staff members serving the drink should know what they are serving and why the consumers bene-fit from the product. However most of the personnel showed a positive attitude towards the products and the concept of having an energy dense drink in the daily routine.
In conclusion the feedback from the personnel is of great use for further im-provements of the products in order to fit the needs of the health care system.

39
5 Conclusion The majority of the elderly could consume the product daily and they thought that the products were needed on the market. The products were well liked by the con-sumers, both young and elderly. The Raspberry/blueberry product was preferred by the young active persons and the Strawberry was favored by the elderly. Both the young and the elderly claimed that taste is the most important factor for liking. The consumers liked that the products had a fresh, fruity, berry and smooth taste. The colour and texture seemed to be of more importance for younger when choos-ing product than for elderly. No major differences in the preference choice could be seen within the groups of young and elderly. The young and the elderly judged sensory attributes differently due to difference in their frames of reference and their senses. Hence the product would benefit from being marketed towards these two groups separately in order to match the different consumer profiles. Personnel overall showed a positive attitude towards the product and the concept of this new energy dense drink for elderly. They considered the product to be a good contri-bution to the market, but that it would benefit from a less viscous texture together with a better designed package.
In further projects, it would be interesting to investigate exactly how much of the product that was consumed by elderly consumers and if it could be linked to weight gain, improved nutritional status, and decreased malnutrition. Since vege-table-based products are trendy and allergy friendly, research on the possibility of exchanging the whey protein for a plant based protein source is of interest. Also more experiments on the texture are needed, investigating the possibility of getting a less viscous product with the same viscosity for all product types. To ask young and elderly which flavors they would which for in such a product would be of interest in order to customize different products targeted towards young and elder-ly separately.
40
References
Asp NG, Mattsson B, Önning G (1991). Variation in dietary fibre, β-glucan, starch, protein, fat and hull content of oats grown in Sweden 1987-1989. European Journal of Clinical Nutrition number
46, 31-37
Badaeva ED, Shelukhina OY, Diederichsen A, et al (2010). Comparative cytogenic analysis of Av-
ena macrostachya and diploid C-genome Avena species. Genome number 53, 125-137
Bales CW & Ritchie CS (2002). Sarcpoenia, weight loss, and nutritional frailty in the elderly. Annual
Review of Nutrition, number 22, 309-323
Bpacnz (2011). Strategies to improve nutrition in elderly people. Best Practice Journal
Braaten JT, Wood PJ, Scott FW, Riedel KD, Poste LM, Collins MW (1991). Oat gum, a soluble fibre which lowers glucose and insulin in normal individuals arfter oral glucose load: comparision with
guar gum. American Journal of Nutrition number 53, 1425-1430
Brody AL & Lord JB (2007). Developing new Food Products for a changing marketplace, second
edition. CRC Press
Christensen K, Doblhammer G, Rau R & Vaupel JW (2009). Agening populations: the challenges
ahead. Lancet number 374, 196-208
Clemens R & van Klinken BJ (2014a). The future of oats in the food and health continuum. British
journal of nutrition number 112, 75-79
Clemens R & van Klinken BJ (2014b). Oats, more than just a whole grain: an introduction. British
journal of nutrition number 112, 1-3
Delcour J.A & Hoseney R.C (2010). Principles of cereal science and technology. AACC Internation-
al, Inc
EFSA Panel on Dietetic Products, Nutrition and Allergies (2011). Scientific Opinion on
41
the substantiation of health claims related to beta-glucans from oats and barley and maintenance of normal blood LDL-cholesterol concentrations (ID 1236, 1299), increase in satiety leading to a re-
duction in energy intake (ID 851, 852), reduction of post-prandial glycaemic responses (ID821,
824),and“digestive function” (ID850)pursuant to Article13(1) of Regulation (EC) No1924/20061.EFSA Journal number 9
Fuller GW (2011). New Product Development. From Concept to Marketplace, third edition. Taylor and Francis Group, LLC
Griep MI, Mets TF, Vercurysse A et al (1995). Food odour: Thresholds in relation to age, nutritional, and health status. Journal of Gerontology 50A, B407-B414
Guigoz Y, Lauque S, Vellas BJ (2002). Identifying the elderly at risk for malnutrition. The Mini Nutritional Assessment. Clinics in Generatric Medicinr numer 18, 737-757
Gustavfsson IB, Jonsäll A, Mossberg L, Swahn J, Öström Å (2014). Sensorik och marknadsföring.
Studentlitteratur AB, Lund
Jongen WMF & Meulenberg MTG (2005). Innovation in agri-food systems, product quality and
consumer acceptance. Wageningen Academic Pubichers, The Netherlands
Kerckhoffs D, Hornstra G, Mensink R (2003). Cholesterol-lowering effect of glucan from oat bran in
midily hyoercholesterolemic subjects may decrease when glucan is incorporated into bread and cookies. American Journal of Clinical Nutrition number 78, 221-227
Laque S, Arnaud Battanider F, Mansourian R, Guigoz Y, Paintin M, Nourhashemi F et al (2000). Protein-energy oral supplementation in malnourished nursing-home residents. A controlled trial.
Age Ageing number 29, 51-56
Laying down the general principles and requirements of food law, establishing the European Food
Safety Authority and laying down procedures in matters of food safety (2002). (2002/178/EG)
Lawless, H T. Heymann H.( 2010). Sensory evaluation of food, principles and practices, second
edi tion. Springer Science + Business Media
Livsmedelverket (2011a). Vetenskapligt underlag till råd om bra mat I äldreomsorgen. ISSN 1104-
7089
Livsmedelsverket (2011b). Bra mat i äldreomsorgen, mat och meny. ISBN 978 91 7714 210 2
Tabergs tryckeri AB
Malkki (2001). Handbook of dietary fibre. New York: Marcel Dekker, 497-512
Manders M, De Groot CPGM, Blauw YH, Dhonushshe-Rutten RAM, Van Hoeckel-Prust L, Bindels LG, Siebelink E, Van Staveren WA. Effect of a nutrient-enriched drink on dietary intake and
nutri tional status in institutionalised elderly. European Journal of Clinical Nutrition number
63, 1241-1250

42
Meilgaard MC, Civille GV & Carr TB (2006). Sensory Evaluation Techniques, fourth edition. CRC Press, Taylor and Francis Group
Moskowitz HR, Beckely JH & Resurreccion AVA (2012). Sensory and Consumer Research in Food Product Design and Development, second edition. Backwell Publishing and the Institute for Food
Technologists
Mowé M, Bohmer T & Kindth E (1994). Reduced nutritional status in an elderly population (<70y)
is probable before disease and possibly contributes to the development of disease. American
Journal of Clinical Nutrition number 59, 317-324
Nordic Nutrition Recommendations (NNR) (2012). ISBN 978 92 893 2670 4. Nordic Council of
Ministers 2014
Othman RA, Moghadasiab MH & Jones PJH (2011). Cholesterol-lowering effects of β-glucan. Inter-
national Life Science Institute
Pauly L, Stehle P & Volkert D (2007). Nutritional situation of elderly nursing homes residents.
Gerontologie und Geriatrie number 40, 3-12
Petersson B (1994). Forskning och etiska koder. Nya Doxa, Nora
Ren Y, Ellis PR, Ross-Murphy SB, Wang Q, Wood PJ (2003). Dilute and semi-dilute solution prop-erties of (1-3)(1-4) β-D-glucan, the endosperm cell wall polysaccharide of oats. Carbohydrate
Polymers Journal number 53, 401-408
Resurreccion A (1998). Consumer sensory testing for product development. Aspen Pubilshers,Inc
Rudolph (1995). The food product development process. British Journal of Nutrition number 97, 3-11
Singh R, De S & Belkheir A (2013). Avena sativa (oat) a potential nutraceutical and therapeutic
agent: an overview. Critical Reviews in Food Science and Nutrition, number 53, 126-144
Silk AJ & Urban GL (1987). Pre-Test-Market Evaluation of New Packaged Goods: a Model and
Measurement Metrology. Journal of Marketing Research number 15, 171-191
Thies F, Masson LF, Boffetta P & Etherton PK (2014). Oats and CVD risk markers: a systematic
literature review. Brtitsh journal of nutrition number 112, 19-30
Turner MD & Ship JA (2007). Dry mouth and its effects on the oral health of elderly people. The
journal of the American dental association number 138, 15-20
Wikby K & Fägerskiöld A (2004). The Willingness to eat. An investigation of appetite a
mong elderly people. Scandinavian Journal of Caring Sciences number 18, 120-127

43
Appendix 1 Recipe Strawberry 500 g of finished drink (+1,25g beetroot powder)
*Was incorporated to the recipe after the evaluation of the strawberry taste, 23 g of the strawberry purée was substituted by orange juice concentrate.
Strawberry purée 150.25 g Glucanova LOB 1 200 g Banana purée Orange juice con-centrate*
50 g 23 g
Rapeseed oil 16.15 g Omega-3 2.75 g Sunflower oil 7.65 g Whey protein 22 g Maltodextrin 28.2 g Beetroot powder 1.25 g Salt 0.05 g

44
Appendix 2 Recipe Raspberry/blueberry 500 g of finished drink (+1,25g beetroot powder)
Raspberry purée 89.7 g Blueberry purée 42.5 g Glucanova LOB 1 225 g Banana purée 70 g Rapeseed oil 15.7 g Omega-3 2.75 g Sunflower oil 7.35 g Whey protein 21.7 g Maltodextrin 25.3 g Beetroot powder 1.25 g

45
Appendix 3 Recipe Apple/pear 500 g of finished drink
Apple purée 121 g Pear purée 31 g Glucanova LOB 1 236.7 g Banana purée 43 g Rapeseed oil 16.15 g Omega-3 2.75 g Sunflower oil 7.5 g Whey protein 22.7 g Maltodextrin 19.2 g

46
Appendix 4 Nutritional calculations Strawberry Ingredient Kcal/g g/100g Kcal/100g Strawberry purée 0.33 30.0 9.9 Glucanova LOB 1 0.48 40 19.2 Banana purée Orange juice con-centrate
1.01 2.12
10 4.6
10.1 9.75
Rapeseed oil 9 3.23 29.07 Omega-3 9 0.55 4.95 Sunflower oil 9 1.53 13.77 Whey protein 4 4.4 17.6 Maltodextrin 4 5.64 22.56 Beetroot powder 2.83 0.25 0.71 Salt 0 0.01 0 Total count Kcal/100g= 137.61
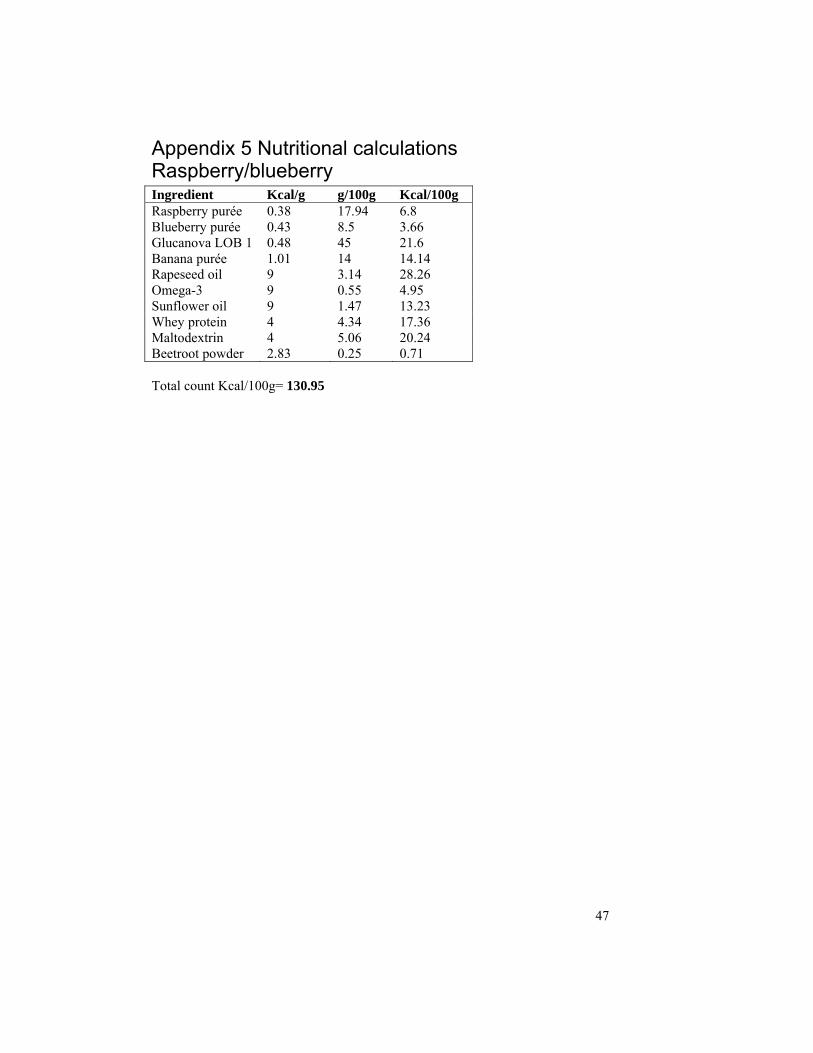
47
Appendix 5 Nutritional calculations Raspberry/blueberry Ingredient Kcal/g g/100g Kcal/100g Raspberry purée Blueberry purée
0.38 0.43
17.94 8.5
6.8 3.66
Glucanova LOB 1 0.48 45 21.6 Banana purée 1.01 14 14.14Rapeseed oil 9 3.14 28.26 Omega-3 9 0.55 4.95 Sunflower oil 9 1.47 13.23 Whey protein 4 4.34 17.36 Maltodextrin 4 5.06 20.24 Beetroot powder 2.83 0.25 0.71 Total count Kcal/100g= 130.95

48
Appendix 6 Nutritional calculations Apple/pear Ingredient Kcal/g g/100g Kcal/100g Apple purée Pear purée
0.63 0.54
24.2 6.2
15.25 3.35
Glucanova LOB 1 0.48 47.34 22.7 Banana purée 1.01 8.6 8.69 Rapeseed oil 9 3.23 29.07 Omega-3 9 0.55 4.95 Sunflower oil 9 1.5 13.5 Whey protein 4 4.54 18.16 Maltodextrin 4 3.84 15.36 Total count Kcal/100g= 131.03

49
Appendix 7 Information sheet drink+ Bakgrundsinformation +Dryck är en näringstät dryck gjord på naturliga råvaror med havre som bas. Drycken finns i tre olika smaker, jordgubb, hallon/blåbär och äpple/päron. Smakerna kommer från rena fruktpuréer som blandats med havrenbasen, olja, omega-3 och vassleproteiner. Drycken är baserad på svensk forskning och framtagen av Aventue AB. Syftet med drycken är att den ska vara god och bidra till att det dagliga energibehovet uppfylls. Testet För att testa hur +Dryck tas emot av marknaden har två äldreboenden och två sjukhus valts ut för att delta i en testmarknad för drycken. Drycken kommer under cirka fyra veckor serveras i den dagliga verksamheten. Testet startas med ett konsumenttest då konsumenter testar drycken och svarar på frågor om vad de tycker om de olika smakerna. Konceptet och mottagandet utvärderas sedan genom intervjuer med personalen några veckor in i testet. Hantering av drycken Drycken kommer i två-liters förpackningar, i oöppnad förpackning är håll-barheten 3 månader. I öppnad förpackning håller sig drycken en vecka. Drycken ska alltid förvaras i kylskåp. Personen som öppnar en förpackning, skriver öppningsdatum och signatur på förpackningen, samt datum en vecka framåt. På så sätt blir det lätt att hålla reda på hållbarheten. Viktigt att komma ihåg är också att förpackning-en ska omskakas innan servering. Förpackningen är en budgetförpackning som bara används för detta test, därför kan den vara lite otymplig att hantera. Öppnade förpackningar bör förvaras liggandes för att undvika läckage. När förpackningen öppnas måste man spräcka en plasthinna, vilket lättast görs med en kniv. Omskak-ningen bör göras försiktigt, även här i liggande position. För att lättast kunna servera drycken underlättar det att först hälla upp drycken i en kanna för att sedan fylla upp glas. Det kommer lätt dryck utanför, därför är det bra att ha papper nära till hands. Drycken kan serveras när som helst på dygnet, den kan exempelvis fungera som ett mellanmål, aptitretare eller sängfösare, testanläggningen bestämmer själv när drycken ska serveras. Tanken är att valfri mängd ska serveras i ett glas till konsumenterna. Allergiinformation Drycken är äggfri, det kan finnas spår av laktos och sojaproteiner, drycken är inte mjölkproteinfri då den innehåller vassleproteiner.

50
Drycken är inte garanterat glutenfri. Havren som använts till havrebasen är inte garanterat glutenfri därför kan inte drycken sägas vara glutenfri. Däre-mot har inga nämnvärda mängder gluten kunnat detekteras i drycken. Näringsinformation
Smak kcal/kJ/100g kcal/100ml
Jordgubb 137/576 142
Hallon/blåbär 131/549 133
Äpple/päron 131/549 133
Smak Näringsvärde per 100g dryckJordgubb Energi 576 kJ/137
kcal Protein 5 g Kolhydrater 15 g varav sockerarter 4 g Fett 6 g varav mättat fett 0,5 g varav enkelomättat fett 2,6 g varav fleromättat fett 2,4 g Fibrer 2 g Salt 0,01 g
Hallon/blåbär Energi 549 kJ/131 kcal Protein 6 g Kolhydrater 13 g varav sockerarter 4 g Fett 6 g varav mättat fett 0,5 g varav enkelomättat fett 2,5 g varav fleromättat fett 2,1 g Fibrer 2 g Salt 0 g
Äpple/päron Energi 549 kJ/131

51
kcal Protein 6 g Kolhydrater 13 g varav sockerarter 5 g Fett 6 g varav mättat fett 0,5 g varav enkelomättat fett 2,5 g varav fleromättat fett 2,1 g Fibrer 2 g Salt 0 g
Ingredienser Jordgubb: Havrebas (vatten, havre 10%) (40%), jordgubbspuré (30%), bananpuré (10%), maltodextrin (5,6%), apelsinkoncentrat (4,7%), vassleprotein (4,4%), rapsolja (3,2%), solrosolja (1,5%), omega-3 (från linfrön) (0,55%), rödbetspulver (0,25%), salt (0,01%) Hallon/blåbär: Havrebas (vatten, havre 10%) (45%), hallonpuré (18%), bananpuré (14%), blåbärspuré (8,4%), maltodextrin (5,0%), vassleprotein (4,3%), rapsolja (3,1%), solrosolja (1,5%), omega-3 (från linfrön) (0,55%), rödbetspulver (0,25%) Äpple/päron: Havrebas (vatten, havre 10%) (47%), äpplepuré (24%), bananpuré (8,6%), päronpuré (6,2%), vassleprotein (4,5%), maltodextrin (3,8%), rapsolja (3,2%), solrosolja (1,5%), omega-3 (från linfrön) (0,55%) Kontaktpersoner Rebecka Langborger 0702570412, [email protected] Olof Böök 0708761065, [email protected]

52
Appendix 8 Consumer field test, hospitals and institutional homes
Konsumenttest på Aventures +Dryck
+Dryck är en näringstät dryck med havre som bas, baserad på svensk forskning, designad för att äldre ska kunna täcka sitt dagliga energibehov.
Testdeltagandet är frivilligt och svaren är anonyma.
Testnummer:…………………………………………………………………. Ålder:…………………………………………
Kvinna/Man:………………………………………………………..
Generellt gillande
Prova varje prov i den givna ordningen, från vänster till höger. Skölj gärna munnen med vatten mellan proverna. Markera ett nummer på skalan som representerar vad du generellt tycker om vart och ett av de tre proverna, där 1=tycker extremt bra om, 5= tycker varken bra eller illa om och 9=tycker extremt illa om.
Vid frågor kontakta testledaren.

53
Vänligen fortsätt till nästa sida
Vad tycker du generellt om proven?
Prov:
1 2 3 4 5 6 7 8 9
Övriga kommentarer:
Prov:
1 2 3 4 5 6 7 8 9
Övriga kommentarer:
Prov:
1 2 3 4 5 6 7 8 9
Övriga kommentarer:
Tycker extremt bra om
Tycker varken bra eller illa om
Tycker extremt illa om
Tycker extremt bra om
Tycker varken bra eller illa om
Tycker extremt illa om
Tycker extremt bra om
Tycker varken bra eller illa om
Tycker extremt illa om

54
Vänligen fortsätt till nästa sida
Specifika frågor
Prova varje prov igen, från vänster till höger, och svara på mer specifika frågor för vad du tycker om färgen, smaken och konsistensen. Markera på skalan det nummer som stämmer bäst in på vad du tycker om de olika attributen, där 1=tycker extremt bra om, 5= tycker varken bra eller illa om och 9=tycker extremt illa om.
Vid frågor kontakta testledaren.

55
Vänligen fortsätt till nästa sida
Vad tycker du om färgen?
Prov:
1 2 3 4 5 6 7 8 9
Övriga kommentarer:
Prov:
1 2 3 4 5 6 7 8 9
Övriga kommentarer:
Prov:
1 2 3 4 5 6 7 8 9
Tycker extremt bra om
Tycker varken bra eller illa om
Tycker extremt illa om
Tycker extremt bra om
Tycker varken bra eller illa om
Tycker extremt illa om
Tycker extremt bra om
Tycker varken bra eller illa om
Tycker extremt illa om

56
Övriga kommentarer:
Vänligen fortsätt till nästa sida
Vad tycker du om smaken?
Prov:
1 2 3 4 5 6 7 8 9
Övriga kommentarer:
Prov:
1 2 3 4 5 6 7 8 9
Övriga kommentarer:
Prov:
Tycker extremt bra om
Tycker varken bra eller illa om
Tycker extremt illa om
Tycker extremt bra om
Tycker varken bra eller illa om
Tycker extremt illa om
Tycker extremt bra om
Tycker varken bra eller illa om
Tycker extremt illa om

57
1 2 3 4 5 6 7 8 9
Övriga kommentarer:
Vänligen fortsätt till nästa sida
Vad tycker du om konsistensen?
Prov:
1 2 3 4 5 6 7 8 9
Övriga kommentarer:
Prov:
1 2 3 4 5 6 7 8 9
Övriga kommentarer:
Prov:
Tycker extremt bra om
Tycker varken bra eller illa om
Tycker extremt illa om
Tycker extremt bra om
Tycker varken bra eller illa om
Tycker extremt illa om
Tycker extremt bra om
Tycker varken bra eller illa om
Tycker extremt illa om

58
1 2 3 4 5 6 7 8 9
Övriga kommentarer:
Vänligen fortsätt till nästa sida
Öppna frågor
Sammantaget vilket av proverna föredrar du?
Varför föredrar du just detta prov?
Rangordna vilken av egenskaperna färg, smak och konsistens som har störst betydelse för att du ska gilla produkten. Rangordna från1-3, där 1=mest betydelse och 3=minst betydelse. Skriv en siffra bakom varje ord.
Färg
Smak
Konsistens
Kan du tänka dig att dricka en sådan produkt dagligen?
Ja Nej Inte dagligen men ibland
Övriga kommentarer:
Tycker du att denna typ av produkt behövs?

59
Ja Nej
Övriga kommentarer:
Vänligen fortsätt till nästa sida
Tycker du att produkten kan förbättras på något sätt?
Hur är din aptit, hur skulle du ranka din matlust? Markera det alternativ som passar bäst in på hur du oftast känner dig.
God aptit, jag känner hunger och tycker om att äta
Varken god eller dålig aptit, jag känner hunger ibland och tycker om att äta emellanåt
Dålig aptit, jag känner sällan hunger och tycker inte om att äta
Andra synpunkter
Tack för din medverkan!

60
Appendix 9 Consumer field test young physical active persons
Konsumenttest på Aventures +Dryck Gerdahallen
+Dryck är en näringstät dryck med havre som bas, baserad på svensk forskning. Drycken är gjord på naturliga råvaror och fullproppad med nyttig energi.
För att delta i testet ska du vara mellan 15-35 år och träna mist två gånger i veckan
Testdeltagandet är frivilligt och svaren är anonyma.
Ålder:……………………… Kvinna/Man:………………………
Prova varje prov i den givna ordningen, från vänster till höger. Skölj gärna munnen med vatten mellan proverna. Svara på frågorna för vart och ett av proverna vad du tycker om dem, ange ett nummer på den 9-gradiga skalan som passar bäst in på vad dy tycker, där 1= tycker extremt bra om och 9=tycker extrem illa om.
Vid frågor kontakta testledaren.
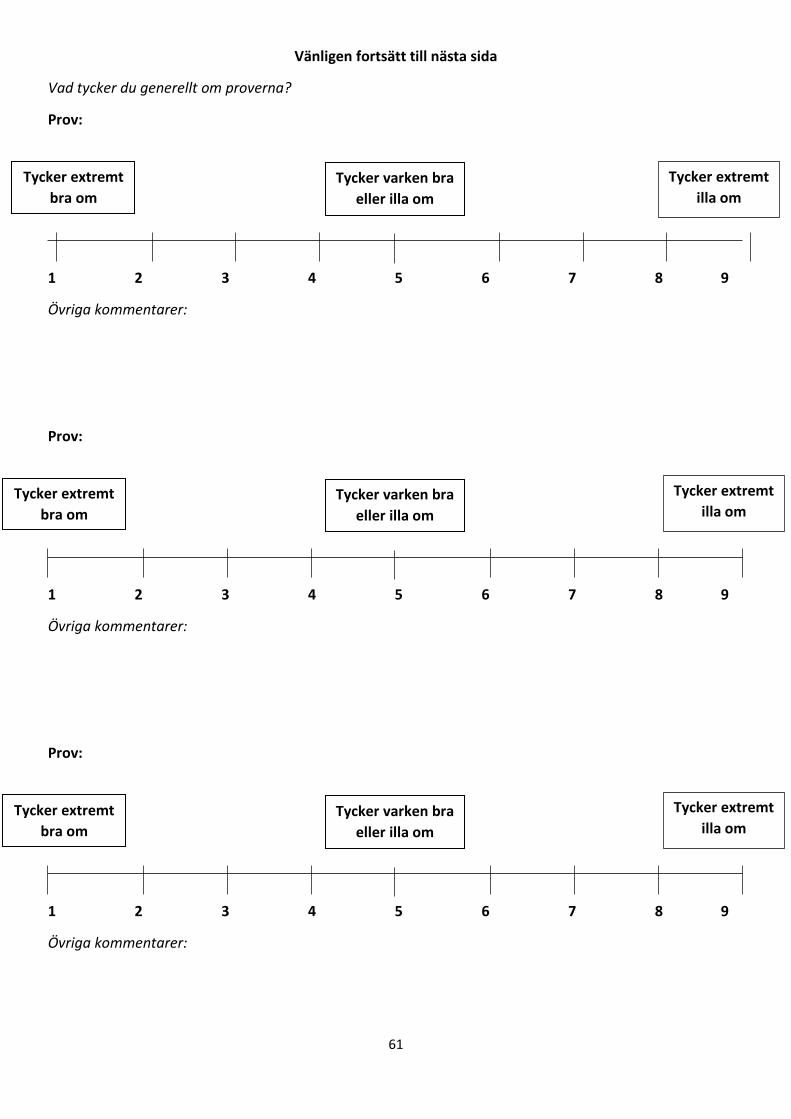
61
Vänligen fortsätt till nästa sida
Vad tycker du generellt om proverna?
Prov:
1 2 3 4 5 6 7 8 9
Övriga kommentarer:
Prov:
1 2 3 4 5 6 7 8 9
Övriga kommentarer:
Prov:
1 2 3 4 5 6 7 8 9
Övriga kommentarer:
Tycker extremt bra om
Tycker varken bra eller illa om
Tycker extremt illa om
Tycker extremt bra om
Tycker varken bra eller illa om
Tycker extremt illa om
Tycker extremt bra om
Tycker varken bra eller illa om
Tycker extremt illa om

62
Vänligen fortsätt till nästa sida
Vad tycker du om färgen?
Prov:
1 2 3 4 5 6 7 8 9
Övriga kommentarer:
Prov:
1 2 3 4 5 6 7 8 9
Övriga kommentarer:
Prov:
1 2 3 4 5 6 7 8 9
Övriga kommentarer:
Tycker extremt bra om
Tycker varken bra eller illa om
Tycker extremt illa om
Tycker extremt bra om
Tycker varken bra eller illa om
Tycker extremt illa om
Tycker extremt bra om
Tycker varken bra eller illa om
Tycker extremt illa om

63
Vänligen fortsätt till nästa sida
Vad tycker du om smaken?
Prov:
1 2 3 4 5 6 7 8 9
Övriga kommentarer:
Prov:
1 2 3 4 5 6 7 8 9
Övriga kommentarer:
Prov:
1 2 3 4 5 6 7 8 9
Övriga kommentarer:
Tycker extremt bra om
Tycker varken bra eller illa om
Tycker extremt illa om
Tycker extremt bra om
Tycker varken bra eller illa om
Tycker extremt illa om
Tycker extremt bra om
Tycker varken bra eller illa om
Tycker extremt illa om

64
Vänligen fortsätt till nästa sida
Vad tycker du om konsistensen?
Prov:
1 2 3 4 5 6 7 8 9
Övriga kommentarer:
Prov:
1 2 3 4 5 6 7 8 9
Övriga kommentarer:
Prov:
1 2 3 4 5 6 7 8 9
Tycker extremt bra om
Tycker varken bra eller illa om
Tycker extremt illa om
Tycker extremt bra om
Tycker varken bra eller illa om
Tycker extremt illa om
Tycker extremt bra om
Tycker varken bra eller illa om
Tycker extremt illa om

65
Övriga kommentarer:
Vänligen fortsätt till nästa sida
Sammantaget vilket av proverna föredrar du?
Varför föredrar du just detta prov?
Rangordna vilken av egenskaperna färg, smak och konsistens som har störst betydelse för att du ska gilla produkten. Rangordna från1-3, där 1=mest betydelse och 3=minst betydelse. Skriv en siffra bakom varje ord.
Färg
Smak
Konsistens
Hur många gånger per vecka tränar du? Ringa in det svarsalternativ som passar bäst in.
2-3 gånger per vecka 3-5 gånger per vecka 5-7 gånger per vecka
Vilken typ av träning brukar du göra?
Tack för din medverkan!

66
Appendix 10 Focus group discussion questions
Frågor till äldre:
1). Vad äter ni för mellanmål idag?
- varför väljer ni detta? - vad är bra/dåligt med denna produkt? 2). Vad tycker ni saknas på marknaden?
- förslag? 3). Finns det produkter ni absolut inte skulle välja?
- varför? 4). Vad är det viktigaste med ett mellanmål?
- minimikrav - önskemål - wow 5). Vad är viktigt med konsistensen?
- att den går lätt att svälja? Tunn - tjock - krispig - med bitar - grynigt - munkänsla 6). Vad är viktigt med storleken?
- stor, liten - dryck 1,5 dl 3-5 dl 1 liter 7). Enligt NNR ökar behovet av protein och vitamin D vid 75+, är detta något ni tänker på när ni
väljer mellanmål?

67
Appendix 11 Semi-structured questions for the personnel
Vad tycker personalen om Aventures +Dryck?
Semistrukturerad intervju
Anställd som:
År på yrket:
Kvinna/Man:
Datum:
Efter att ha serverat Aventures +Dryck under testperioden, vad tycker du generellt om konceptet, att servera en kylförvarad energität dryck till patienter? Ange på en skala 1-9 vad du tycker där 1=tycker extremt bra om och 9= tycker extremt illa om.
Varför tycker du så?
Hur upplever du de äldres/patienternas attityd mot produkterna? Ange på en skala 1-9 hur du upplever deras attityd där 1=extremt positiv attityd och 9= extremt negativ attityd.
Finns det vissa grupper som du upplever har en viss attityd? Kanske att de med redan dålig aptit inte tycker om drycken eller liknande. Viss sjukdom, gillar/gillar inte drycken.
Tycker du att denna typ av produkt behövs? Motivera ditt svar.
68
Har produkten varit lätt att hantera i den dagliga verksamheten? Motivera varför/varför inte.
Vad tycker du om förpackningen? Ange på en ska 1-9 vad du tycker där 1= tycker extrem bra om och 9= tycker extrem illa om.
Skulle det vara bättre om förpackningen var utformad på ett annat sätt?
Tycker du att produkten kan förbättras på något sätt?
Hur har produkten serverats, beskriv i vilken typ av glas och i vilken mängd?
När och hur många gånger per dag har produkten serverats? Beskriv i samband med vilken måltid produkten har serverats och vid vilken/vilka tid/tider produkten har serverats?
Har konsumenterna över lag druckit upp mängden de blivit serverade?
Andra synpunkter:
Tack för din medverkan!

69
Appendix 12 Popular scientific summary-Judgements of a fresh new product
Do elderly and young active persons share the same opinions about a
newly developed product? That was the question being asked in the beginning of this project. Aventure AB had developed a new energy dense drink in three Swedish inspired varieties namely; Strawberry, Raspberry/blueberry and Apple/pear. The products had been developed with the background knowledge that malnutrition among elderly are increasing, and that an energy dense product with a good taste were needed on the market. Elderly being malnourished often stays at hospitals or institutional homes, therefor two hospitals and two institutional homes in Sweden were chosen and asked if they wanted to participate in a so called test marked. A test market is a method used by companies that wants to test a new product in a small scale before big scale launching. This is done in order to get useful information about how the new product is received by the market, the personnel as well as the consumers.
But before the test marked could start the three products needed some improvements. Therefor the colours of the Raspberry/blueberry- and the Strawberry products were enhanced by addition of beet root powder. The Strawberry product also needed a better taste and after various experiments it was a proven success to add salt and orange juice concentrate to the recipe in order to give the product a fresh and more intense strawberry taste.
Now the products were ready to be tasted by its consumers. In order to get information about what the consumers thought about the different products a sensory consumer field test were performed. Here the consumers tried all three products as coded samples, meaning that they did not know which product they tried only that it was a newly developed energy dense drink with three different flavorings. This because one wants to avoid prejudges and too much background information to influence the judgements of sensory attributes.
Since young active persons share an extra energy need with the malnourished elderly they were also considers potential consumers of the new energy dense drink. Therefor the products were also tasted and judged by young active persons. Because of this it was also possible to compare what young and elderly thought about the products.
It was shown that the young preferred the Raspberry/blueberry product and that the elderly liked the Strawberry product the most. Both groups liked the Apple/pear product the least. Both the young and the elderly stated that the taste is the most important thing when choosing which product one prefers. After the taste the consistency ended up and lastly the colour of a product would affect the preference choice. A company of course has to consider all these attributes when developing a new product but it is good to know what people plays most attention to, then the developers can work extra hard on that attribute.
Looking at the numbers it was clear that both the young and the elderly appreciated the products, especially the Raspberry/blueberry and the Strawberry products. The products can therefore be said to have good chances succeeding on the market. After interviewing the personnel in the health care system one could conclude that they also liked the products. They thought they were need

70
on the market and that they were tasty. However the product would benefit from a smaller and better designed package as well a looser consistency. With this information some adjustments should be made before official launching.
Since the senses will rust upon ageing the colour and the consistency of products is not as important as for young persons with more alert senses. How attributes like colour, taste and consistency are perceived and judged also has to do with a person´s frame of reference which is linked to previous experiences as well as psychological- and surrounding environmental factors. It is likely that the two age groups of young and elderly have similar frames of reference and hence will judge attributes equally within the same age group.
So do they? Not always, they had different preferences, but they scored the products very similar. It is also seems like the senses differ between the young and the elderly as well as the frame of reference. Hence attributes will be perceived differently. Therefor the product would benefit from being marketed toward young and elderly separately in order to be a success.