Sensors 2008 sensors - CAS › xwzx › jxlwtj › 200904 › W020090715581488030329.pdfSensors...
19
Sensors 2008, 8, 681-699 sensors ISSN 1424-8220 © 2008 by MDPI www.mdpi.org/sensors Full Research Paper Analysis of Urban-Rural Land-Use Change during 1995-2006 and Its Policy Dimensional Driving Forces in Chongqing, China Hualou Long 1, *, Xiuqin Wu 2 , Wenjie Wang 3 and Guihua Dong 4 1 Institute of Geographic Sciences and Natural Resources Research (IGSNRR), Chinese Academy of Sciences, Beijing 100101, China 2 College of Soil and Water Conservation, Beijing Forestry University, Laboratory of Soil and Water Conservation and Desertification Combating, The Ministry of Education, Beijing 100083, China 3 Chinese Research Academy of Environmental Sciences, Beijing 100012, China 4 China National Environmental Monitoring Center, Beijing 100029, China * Author to whom correspondence should be addressed. E-mail: [email protected] (Hualou Long), Tel: +86-10-6488-8169, Fax: +86-10-6485-7065 Received: 26 December 2007 / Accepted: 29 January 2008 / Published: 4 February 2008 Abstract: This paper analyzes the urban-rural land-use change of Chongqing and its policy dimensional driving forces from 1995 to 2006, using high-resolution Landsat TM (Thematic Mapper) data of 1995, 2000 and 2006, and socio-economic data from both research institutes and government departments. The outcomes indicated that urban-rural land-use change in Chongqing can be characterized by two major trends: First, the non-agricultural land increased substantially from 1995 to 2006, thus causing agricultural land especially farmland to decrease continuously. Second, the aggregation index of urban settlements and rural settlements shows that local urban-rural development experienced a process of changing from aggregation (1995-2000) to decentralization (2000-2006). Chongqing is a special area getting immersed in many important policies, which include the establishment of the municipality directly under the Central Government, the building of Three Gorges Dam Project, the Western China Development Program and the Grain-for-Green Programme, and bring about tremendous influences on its land-use change. By analyzing Chongqing’s land-use change and its policy driving forces, some implications for its new policy of ‘Urban-rural Integrated Reform’ are obtained. That is more attentions need to be paid to curbing excessive and idle rural housing and consolidating rural construction land, and to laying out a scientific land-use plan for its
Transcript of Sensors 2008 sensors - CAS › xwzx › jxlwtj › 200904 › W020090715581488030329.pdfSensors...

Sensors 2008, 8, 681-699
sensors ISSN 1424-8220 © 2008 by MDPI
www.mdpi.org/sensors
Full Research Paper
Analysis of Urban-Rural Land-Use Change during 1995-2006 and Its Policy Dimensional Driving Forces in Chongqing, China
Hualou Long 1,*, Xiuqin Wu 2, Wenjie Wang 3 and Guihua Dong 4 1 Institute of Geographic Sciences and Natural Resources Research (IGSNRR), Chinese Academy of
Sciences, Beijing 100101, China 2 College of Soil and Water Conservation, Beijing Forestry University, Laboratory of Soil and Water
Conservation and Desertification Combating, The Ministry of Education, Beijing 100083, China 3 Chinese Research Academy of Environmental Sciences, Beijing 100012, China 4 China National Environmental Monitoring Center, Beijing 100029, China
* Author to whom correspondence should be addressed. E-mail: [email protected] (Hualou Long), Tel: +86-10-6488-8169, Fax: +86-10-6485-7065 Received: 26 December 2007 / Accepted: 29 January 2008 / Published: 4 February 2008
Abstract: This paper analyzes the urban-rural land-use change of Chongqing and its policy dimensional driving forces from 1995 to 2006, using high-resolution Landsat TM (Thematic Mapper) data of 1995, 2000 and 2006, and socio-economic data from both research institutes and government departments. The outcomes indicated that urban-rural land-use change in Chongqing can be characterized by two major trends: First, the non-agricultural land increased substantially from 1995 to 2006, thus causing agricultural land especially farmland to decrease continuously. Second, the aggregation index of urban settlements and rural settlements shows that local urban-rural development experienced a process of changing from aggregation (1995-2000) to decentralization (2000-2006). Chongqing is a special area getting immersed in many important policies, which include the establishment of the municipality directly under the Central Government, the building of Three Gorges Dam Project, the Western China Development Program and the Grain-for-Green Programme, and bring about tremendous influences on its land-use change. By analyzing Chongqing’s land-use change and its policy driving forces, some implications for its new policy of ‘Urban-rural Integrated Reform’ are obtained. That is more attentions need to be paid to curbing excessive and idle rural housing and consolidating rural construction land, and to laying out a scientific land-use plan for its
Sensors 2008, 8
682
rural areas taking such rural land-use issues as farmland occupation and rural housing land management into accounts, so as to coordinate and balance the urban-rural development.
Keywords: Land-use change; Driving forces; Urban-rural development; Policy dimension; Chongqing; China.
1. Introduction
Currently, both remote sensing (RS) and geographic information systems (GIS) have covered wide range of applications in the fields of agriculture and environments, such as estimation of crop evapotranspiration [1], crop yield forecasting [2], analysis of thermal energy fluxes in urban areas [3,4], integrated eco-environment assessment [5], etc. In addition, RS and GIS have been recognized as powerful and effective tools and widely applied in detecting the spatio-temporal dynamics of land-use and land-cover (LULC) [6-9]. Based on RS, the researchers can obtain valuable multi-temporal data for monitoring land-use patterns and processes [10,11], and GIS techniques make possible the analysis and mapping of these patterns [12-15]. Usually, spatially explicit time series of land-use change can be developed based on RS [16-18]. There are widely used approaches of change detection and statistical analysis, which enable us to discover the structural variation among different land-cover patterns and to diagnose land-use change based on time series socio-economic data [19-25]. These time series analyses of land-use change and the identification of its driving forces can provide decision-makers with important information for the sustainable management of land resources and regional development [26-28].
Generally, the urban areas are characterized by the concentration of people, and accelerated urban growth is usually associated with and driven by the population concentration in an area. The process of urbanization or its growth drives the change in land use/cover pattern, which may also have adverse impacts on ecology of the area, especially hydro-geomorphology and vegetation [29]. Recently, issues related to urban land change have attracted the interest among a wide variety of researchers. Gradient analysis was combined with remote sensing images and landscape metrics to analyze and compare the spatial and temporal dynamics of urban sprawl [30,31]. Research results showed that different patterns of urban expansion in the metropolitan area of Milan could be associated with specific environmental costs, in particular, for land consumption and mobility generation [32]. In addition, there are many studies concerning urban sprawl focusing on the environmental impacts, land development, metrics, dynamics and modelling of urban encroachment [33-37].
At present, both rural development and urban development in China are in a transition period—the transformation of a traditional agricultural society into a modern industrial and urban society [38], and China has been experiencing an unprecedented and accelerated urban expansion since the 1980s [39]. More attention has been paid to urban sprawl in China. Tian et al divided China into 27 urban regions and analyzed the dynamic patterns and driving forces of urban land changes [40]. China’s urban land increased by 817 thousand hectares during 1990-2000 [41], and the change had high spatial and temporal differences, which had been largely driven by demographic change, economic growth, and changes in land-use policies and regulations [40,41]. Pearl River Delta (PRD) of south China is a hot area to study the urbanization of China. By using RS and GIS, Weng studied urban growth in PRD and

Sensors 2008, 8
683
found that there has been a notable and uneven urban growth and a tremendous loss in cropland between 1989 and 1997 [7]. Li and Yeh analyzed urban expansion and spatial restructuring of land-use patterns in PRD and provided new evidence with spatial details about the uneven land development in the PRD [42]. Seto and Kaufmann modelled the drivers of urban land-use change in PRD, integrating remote sensing with socio-economic data [43]. Weng and Yang studied the impact of Guangzhou’s urban expansion on urban heat islands and developed an approach to evaluate the sustainability for Guangzhou’s urban ecosystem [44,45]. As China’s largest and wealthiest city, Shanghai’s dynamic growth since the 1990s indicates the spatial form of new metropolitan expansion patterns, and the driving mechanisms include the rise of a land market, settlement of inner suburbs by urban core and ‘‘floating’’ populations, and peri-urban in-filling [46]. The urban land area in the Beijing–Tianjin–Hebei region expanded by 71% between 1990 and 2000, 74% of all the new urban land was converted from farmland, and there was a general tendency for smaller cities to have higher percentages [47]. Moreover, there are lots of studies concerning urban expansion in eastern and coastal China [48-51].
While there are numerous studies analyzing the urban expansion in eastern and coastal China (includes Beijing, Tianjin, Hebei, Shanghai, Jiangsu, Zhejiang, Fujian, Shandong, Guangdong, and Hainan), the urban sprawl and rural development in western China has found much less attention. The objectives of this paper are to analyze the characteristics and policy dimensional driving forces of urban-rural land-use change over the period from 1995 to 2006 in Chongqing, which experienced two milestone events—set-up as a municipality directly under the Central Government and the building of the Three Gorges Dam in last decade, to obtain some implications for future sustainable urban-rural development.
2. Study area
Our study area, Chongqing, is located on the upper reaches of the Yangtze River. It ranges from 105º11´E to 110º11´E, and from 28º10´N to 32º13´N. Chongqing covers about 82 400 km2 crisscrossed by rivers and mountains, with average elevation of 400 m. The area is featured by mountain and hills, with large sloping areas at different heights, and it slopes down from north and south towards the Yangtze valley, with sharp rises and falls (Fig. 1). The central subtropical moist monsoon climate dominates Chongqing year-round, with mean daily temperature of 18.4℃, mean annual rainfall of 1 100 mm, and mean annual non-frost period of 345 days, all of which are beneficial for agricultural production.
There are three unprecedented opportunities for the socio-economic development of Chongqing: the building of the Three Gorges Dam Project, the establishment of the municipality directly under the Central Government, and the Western China Development Program, all of which bring new vigor to Chongqing and turn a new folio on Chongqing’s history [52].
The above opportunities added more fuel to Chongqing’s socio-economic development. Chongqing’s population has been increasing by an annual rate of 0.51% since 1995. With a total population of 31.7 million, the population density in Chongqing was up to 385 persons/km2 in 2005, which was almost three times the average population density (136 persons/km2) of China at the same period [53]. Of the total population, 74 percent were engaged in farming, providing much of the labor force to produce commercial grains. The gross grain output in Chongqing amounted to 11.68 million

Sensors 2008, 8
684
tons in 2005. In 2005, Chongqing’s Gross Domestic Product (GDP) amounted to 307 billion RMB¥ (1 US$≈8 RMB¥), which increased by 202% from 1995 to 2005 [53]. However, with the growth of population and economic activities, land use in Chongqing has changed dramatically as evidenced by the continuous decline of cultivated land. In 1996, according to the statistical data from the Ministry of Land and Resources of China (MLRC), the total area of cultivated land in Chongqing was around 2 545 thousand hectares (It should be clear here, that the definition of cultivated land of MLRC is different from that of our classification standards of interpreting remote sensed data). By the end of 2005, it had decreased to 2 263 thousand hectares, a decline of 11.1% in a decade [54]. The ongoing land-use change in Chongqing is not only a serious challenge to the local government, but can be also seen as a model of land-use change in rapidly developing regions of western China.
Figure 1. Location of the study area Chongqing.

Sensors 2008, 8
685
3. Methodology
3.1 Data
The analysis of land-use change in Chongqing is based on three LULC maps at a 1:100 000 scale. These maps were derived from historical Landsat TM (Thematic Mapper) satellite images, which were acquired in 1995, 2000 and 2006, respectively, by Institute of Geographic Sciences and Natural Resources Research of the Chinese Academy of Sciences (the maps of 1995 and 2000) and China National Environmental Monitoring Center (the map of 2006). An efficient classification system was drafted and an effective research team was organized to work on remote sensed data through human-machine interactive interpretation to guarantee classification consistency and accuracy. Land-use maps, classified into 6 first levels and 25 second levels of land-use categories in total, were drawn based on the Landsat TM data [8]. There were six major LULC types (cultivated land, woodland, grassland, water body, unused land, and rural and urban settlements), and 25 sub-categories in the original LULC datasets. In order to depict the urban-rural land-use change of the study area in detail, we reclassified the original LULC types into eight classes: farmland, forested land, grassland, water body, unused land, urban settlements, rural settlements, and construction land mainly for mining and transportation. Then, we measured the variations among the eight different LULC types by converting the three LULC vector format maps into raster format with a spatial resolution of 100 by 100 m (the minimum area of land covers in Chongqing is around 1 ha) using ESRI’s ArcGIS spatial analyst module. Fig. 2 illustrates the three gridded and reclassified LULC maps in 1995, 2000 and 2006 in Chongqing. In addition, some time-series socio-economic data on land use and industry [53], were collected from the local government and used to analyze potential driving forces resulting in land-use change in Chongqing. 3.2 Methods The three reclassified and gridded LULC maps (Fig. 2) were mainly used to detect the internal variations of LULC in Chongqing between two different periods: from 1995 to 2000, and from 2000 to 2006. For each pair of gridded datasets, a change matrix was constructed. Then, for each LULC category i in a change matrix A, the change between the two periods was calculated according to the following equation (1), and for each LULC type we calculated the percentage of “conversion loss to” or “conversion gain from,” in relation to the total “loss or gain” conversion of a LULC type according to equation (2) [28].
100/)( ... ×−= iiii pppCH (1)
where iCH is the change of LULC in row i relative to the previous compared year;
.ip is the row total of grid cells for category i ;
ip. is the column total of grid cells for category i .
⎪⎩
⎪⎨⎧
≠×−−=
≠×−−=
jippppP
jippppP
iiijjijigain
iijiijjiloss
100)/((
100)/()(
..),,),(
..,,),( (2)
where jilossP ),( is the percentage taken by type j in the total “conversion loss” of category row i ;
Sensors 2008, 8
686
jigainP ),( is the percentage taken by type j in the total “conversion gain” of category row i ;
jip , and ijp , is the individual entry in a change matrix A.
In order to analyze the ecological effect of land-use change in study area, some indices such as
number of patches (NP), patch density (PD) and aggregation index (AI) are calculated using FRAGSTATS, a spatial pattern analysis program for categorical maps [55].
4. Results
4.1 Land-use change in Chongqing
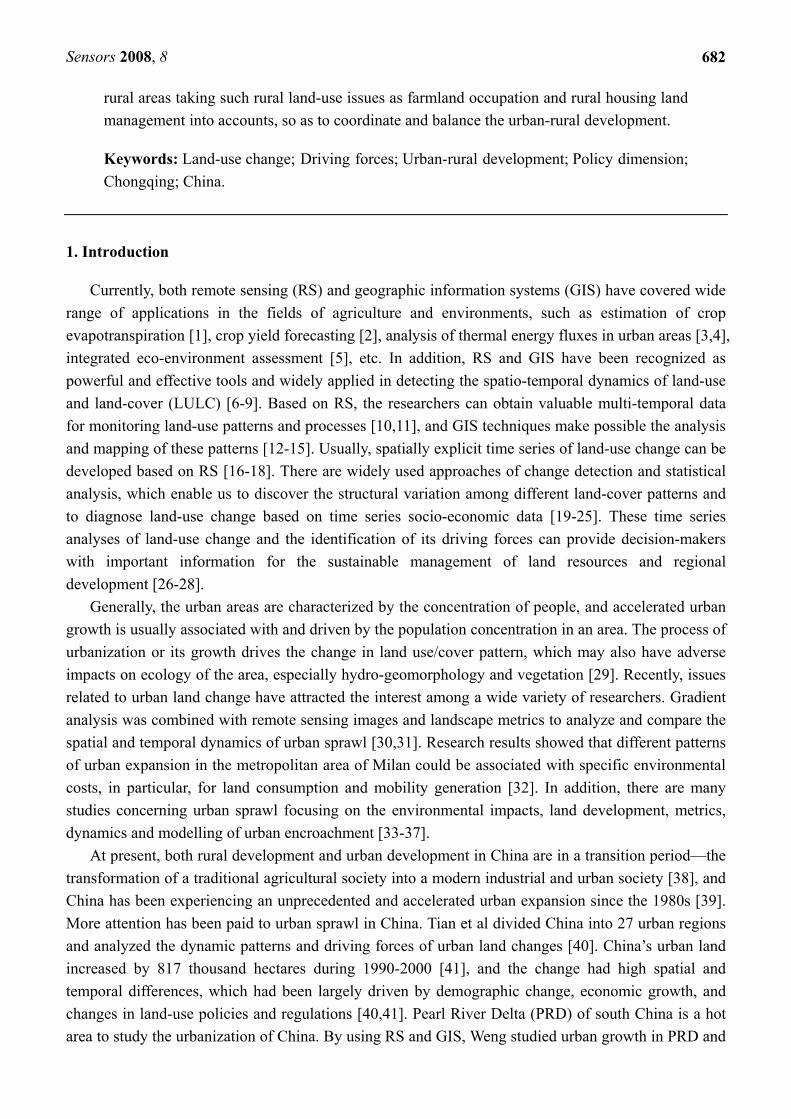
Land use has changed significantly over the period from 1995 to 2006 in Chongqing. From 1995 to 2000, although farmland and forested land decreased by only 0.32% and 0.08%, the decrease quantity amounts to 12 342 ha and 2 633 ha, respectively. In contrast, urban settlements, rural settlements and construction land increased by 20.18%, 23.95% and 55.17%, respectively, in the same period (Table 1). These trends continued in the period from 2000 to 2006 except for the change of forested land (Table 2). The farmland decreased by 0.4%, the speed is a little higher than that of last period. The trend of forested land change is reversed, increasing by 0.11%, from 2000 to 2006. The change trend of urban settlements, rural settlements and construction land is relatively slow, although an increase trend is kept.
Table 1. Change matrix of each compared LULC type in 1995 and 2000, and its changes in 2000 (ha).
LULC type
in 2000
LULC type in 1995 Changesin 2000
(%) FML FL GL WB US RS CL UL Total
FML 3806070 1423 676 56 3808225 -0.32
FL 53 3163241 16228 44 67 3179633 -0.08
GL 113 16677 1022096 35 1038921 -0.06
WB 189 202 123236 123627 0.21
US 8769 479 191 46764 56203 20.18
RS 3574 265 73 16337 20249 23.95
CL 1762 169 104 26 3736 5797 55.17
UL 37 12 13 1128 1190 -3.25
Total 3820567 3182266 1039583 123362 46764 16337 3736 1230 8233845 Note: FML = farmland, FL = forested land, GL = grassland, WB = water body, US = urban settlements, RS = rural settlements, CL = construction land, UL = unused land; the unchanged area of each LULC type was marked in bold.

Sensors 2008, 8
687
Figure 2. Reclassified and gridded LULC types in 1995, 2000 and 2006 in Chongqing.

Sensors 2008, 8
688
Since environmental patterns may strongly influence ecological processes [56], in addition to land-use change, we also analyzed the changes of LULC patches between 1995 and 2006 to assess the structure and function of urban-rural ecosystem. Although many indices are available for assessment of spatial patterns, e.g. fragmentation, in landscape ecology [57], we simply used number of patches, patch density, aggregation index and average patch area to measure the fragmentation and aggregation of LULC in Chongqing. Table 3 shows the changes in different LULC patches from 1995 to 2000, and from 2000 to 2006 in Chongqing. These data were calculated based on the three reclassified vector maps of LULC in Chongqing. From 1995 to 2006, the number of patches of farmland was continuously decreased from 27 821 in 1995 to 27 257 in 2000 and further to 27 151 in 2006; however, that of forested land and grass land were decreased from 1995 to 2000, and increased from 2000 to 2006. The aggregation index of urban settlements and rural settlements shows that local urban-rural development experienced a process of changing from aggregation to decentralization, which can also be proved by the change of average area of patches of urban settlements and rural settlements, increasing from 238.4 ha and 14.6 ha in 1995 to 352.9 ha and 16.2 ha in 2000 then shrunking to 114.9 ha and 13.9 ha in 2006, respectively. The continuously augmented patch density of construction land indicated that the expansion of construction land has been keeping a zooming trend.
Table 2. Change matrix of each compared LULC type in 2000 and 2006, and its changes in 2006 (ha).
LULC type
in 2006
LULC type in 2000 Changesin 2006
(%) FML FL GL WB US RS CL UL Total
FML 3789960 1893 1041 71 53 30 3793048 -0.40FL 6478 3175301 1186 32 3182997 0.11
GL 319 1035860 45 1036224 -0.26
WB 811 525 277 123507 9 24 125153 1.23
US 7266 1462 417 47 56142 40 674 66048 17.52
RS 2088 312 54 20132 231 22817 12.68
CL 1303 119 52 2 52 4862 6390 10.23
UL 21 34 1113 1168 -1.85
Total 3808225 3179633 1038921 123627 56203 20249 5797 1190 8233845
Note: FML = farmland, FL = forested land, GL = grassland, WB = water body, US = urban settlements, RS = rural settlements, CL = construction land, UL = unused land; the unchanged area of each LULC type was marked in bold.
The accelerating urbanization and related rural development process may increase the degree of fragmentation and structural complexity of LULC [58]. Table 4 presents the change of main urban-rural LULC types in Chongqing from 1995 to 2006. Over the period from 1995 to 2000, the increase of urban settlements, rural settlements, and construction land accounted for 71.1%, 29.0%, and 14.3% of the decrease of farmland, respectively. From 1995 to 2000, the reduction of forested land and grassland was mainly due to the reclamation of forested land (52.0%) and grassland (85.0%). However, the expansion of urban settlements, rural settlements, and construction land between 1995 and 2000, occurred mainly at the expense of farmland, which accounted for 92.9%, 91.4%, and 85.5%

Sensors 2008, 8
689
of changes in urban settlements, rural settlements, and construction land, respectively.
Table 3. Changes of LULC patches from 1995 to 2000, and to 2006.
LULC type
Patch density (number/100 ha)
Aggregation index Number of patches Average area (ha)
95 00 06 95 00 06 95 00 06 95 00 06
FML 0.338 0.331 0.330 83.42 84.41 84.11 27821 27257 27151 136.1 142.2 137.0FL 0.158 0.142 0.142 84.41 84.74 84.86 12972 11699 11716 218.9 240.0 245.1
GL 0.081 0.081 0.089 78.53 78.47 77.74 6671 6662 7304 176.6 170.6 137.7
WB 0.013 0.013 0.065 79.77 79.71 71.49 1067 1086 5374 105.4 104.5 111.3
US 0.001 0.001 0.008 85.88 88.04 85.72 100 97 628 238.4 352.9 114.9
RS 0.014 0.016 0.020 63.09 65.08 62.97 1166 1345 1681 14.6 16.2 13.9
CL 0.002 0.003 0.006 72.90 72.05 62.62 147 229 496 30.2 30.4 15.5
UL 0.002 0.002 0.001 58.60 58.40 59.47 144 137 77 15.1 15.1 15.0 Note: FML = farmland, FL = forested land, GL = grassland, WB = water body, US = urban settlements, RS = rural settlements, CL = construction land, UL = unused land.
Table 4. The percentages taken by corresponding types in internal conversions of main LULC types.
Corresponding LULC type
Main urban-rural LULC types (1995-2000) Main urban-rural LULC types (2000-2006)
FML - FL- GL- US+ RS+ CL+ FML- FL+ GL- US+ RS+ CL+
FML 52.0 85.0 92.9 91.4 85.5 136.3* 26.8 73.8 79.2 214.7*
FL -11.1 -67.8 5.1 6.8 8.2 30.2 44.0 14.9 12.1 20.1
GL -4.6 17.1 2.0 1.9 5.0 -4.8 35.3 4.2 2.1 8.8
WB 1.1 -1.7 30.5 1.3 4.9 -15.6 10.3 0.4 -0.9 0.3
US 71.1 18.2 28.9 47.9 -43.5 15.5 -1.6 -104.9
RS 29.0 10.1 11.0 13.4 -9.3 2.0 0.4 -39.0
CL 14.3 6.4 15.7 8.4 -3.5 1.9 6.3 9.0
UL 0.3 -2.1 -3.3 0.3 -0.4 Note: FML = farmland, FL = forested land, GL = grassland, WB = water body, US = urban settlements, RS = rural settlements, CL = construction land, UL = unused land; - conversion loss to, + conversion gain from, * “conversion loss” occurred even the net change was “conversion gain.”
During the period 2000-2006, the trend of internal structural variability of LULC in Chongqing was almost similar to the period before, except for the change of forested land. The decrease of farmland was caused mainly by the conversion of farmland to forested land and the expansion of urban settlements, rural settlements and construction land. Although the expansion of urban settlements, rural settlements, and construction land may have taken up some part of previous grassland and forested land, most of these changes occurred on farmland, which accounted for 73.8%, 79.2%, and 214.7% of
Sensors 2008, 8
690
the increases of these LULC types, respectively (Table 4). 4.2 Policy dimensional driving forces of land-use change
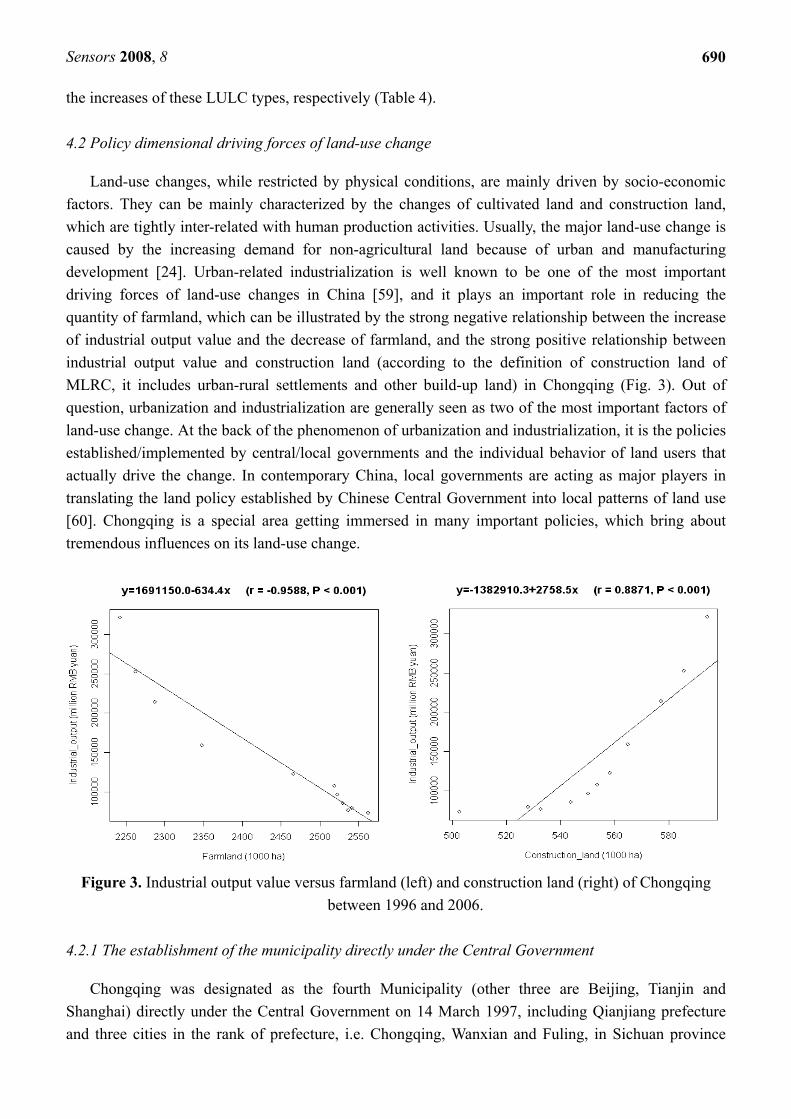
Land-use changes, while restricted by physical conditions, are mainly driven by socio-economic factors. They can be mainly characterized by the changes of cultivated land and construction land, which are tightly inter-related with human production activities. Usually, the major land-use change is caused by the increasing demand for non-agricultural land because of urban and manufacturing development [24]. Urban-related industrialization is well known to be one of the most important driving forces of land-use changes in China [59], and it plays an important role in reducing the quantity of farmland, which can be illustrated by the strong negative relationship between the increase of industrial output value and the decrease of farmland, and the strong positive relationship between industrial output value and construction land (according to the definition of construction land of MLRC, it includes urban-rural settlements and other build-up land) in Chongqing (Fig. 3). Out of question, urbanization and industrialization are generally seen as two of the most important factors of land-use change. At the back of the phenomenon of urbanization and industrialization, it is the policies established/implemented by central/local governments and the individual behavior of land users that actually drive the change. In contemporary China, local governments are acting as major players in translating the land policy established by Chinese Central Government into local patterns of land use [60]. Chongqing is a special area getting immersed in many important policies, which bring about tremendous influences on its land-use change.
Figure 3. Industrial output value versus farmland (left) and construction land (right) of Chongqing between 1996 and 2006.
4.2.1 The establishment of the municipality directly under the Central Government
Chongqing was designated as the fourth Municipality (other three are Beijing, Tianjin and Shanghai) directly under the Central Government on 14 March 1997, including Qianjiang prefecture and three cities in the rank of prefecture, i.e. Chongqing, Wanxian and Fuling, in Sichuan province
Sensors 2008, 8
691
formerly. By so doing, Chongqing will be expected to be an economic center serving the needs of southwest China and an engine driving the growth of China’s vast western region. Chongqing is now the only municipality directly under the Central Government in western China, and is southwest China’s biggest industrial and commercial center, communication hub and inland port. The direct result of urbanization was the reduction of farmland by increasing urban settlements. The area of urban settlements in Chongqing increased by 20.18% from 1995 to 2000, and 17.52% from 2000 to 2006 (Table 1 and Table 2). In China, there are two forms of urbanization: the growth of cities following urban economic development and population concentration, and rural urbanization based on the growth of smaller towns in rural areas [61]. In Chongqing, with the setup of municipality, these two forms of urbanization are coexisting. From 1995 to 2000, the first form of urban sprawl is obvious pushed forward by the new policy, as evidenced by the average area of urban settlements was enlarged greatly to 352.9 ha in 2000, compared to 238.4 ha in 1995 (Table 3). Constrained by local terrain, to great extent, the urbanization of Chongqing has turned to the growth of smaller towns since 2000, which can be illustrated by the increase of the patches of urban settlements from 97 in 2000 to 628 in 2006, and the decline of the average area of urban settlements (114.9 ha in 2006) (Table 3).
With the establishment of the municipality, a number of large and small infrastructure projects have been implemented in Chongqing through intensive investment from both the central and municipal governments. In terms of the transportation network, five new bridges were built over the Yangtze River in 1998, and another three were rebuilt on the Yangtze and Jialing rivers. Three key expressways (Yu-chang highway, Chang-pei highway and Yu-qian highway) are under construction in 2000 [52,62]. These three expressways are the first step in building up the north-east and southeast corridors. As a result, the construction land of Chongqing increased by 55.17% from 1995 to 2000 (Table 1), driven by this policy.
4.2.2 The Three Gorges Dam Project
The Three Gorges Dam, located on the portion of the Yangtze River Basin between Chongqing and Yichang City (in Hubei province), is the largest hydroelectric dam in the world, more than five times the size of the Hoover Dam. It is expected to harbor the largest hydropower plant in the world, contribute to flood control in the middle and lower reaches of the Yangtze River, solve the energetic scarcity of the region, and improve the river navigability. Its construction, however, would also imply a series of negative consequences, such as the loss and fragmentation of many habitats and other effects on the biodiversity and ecological processes in the region, the loss of many archaeological and cultural sites, and the forced displacement of about 1.13 million people [63,64]. The building of the Three Gorges Dam, planned to require 18 years to complete, was separated into three distinct phases [64]: Phase I – Planning activities (1994–1997); Phase II – Dam construction and partial implementation of hydroelectric power facilities (1998–2003); and Phase III – Full implementation of hydroelectric facilities (2003–2009). The project was started on December 14, 1994, and the Three Gorges Reservoir began to hold water in June 2003. Structural work was finished on May 20, 2006, nine months ahead of schedule. However, several generators still have to be installed, and the dam is expected to become fully operational in 2008 (http://www.ibiblio.org/chinesehistory/contents/07spe/specrep01.html).
The total area of the Three Gorges Reservoir Region is approximately 58 000 km2, including the entire inundated area and 19 administrative units (counties and cities) on both sides of the river [63].
Sensors 2008, 8
692
The Chongqing section of the Three Gorges Reservoir Region includes 18 counties of Chongqing and covers about 46 000 km2, which accounts for 55.8% of Chongqing’s total land. The direct impacts of this great project on land-use change are the increase of water body. From 2000 to 2006, water body increased by 1.23%. The increased 1 526 ha water body is mainly from forested land and grassland, as well as some urban settlements and rural settlements in the inundated area (Table 2). With the displacement of the population in the inundated area, some farmland beyond the inundated area will be naturally returned to forested land or grassland.
4.2.3 The Western China Development Program
At the turn of the century, the Chinese government launched the Western China Development Program, aiming to reorient the growth vigor towards the western region (Here, the Western China includes Shaanxi, Gansu, Qinghai, Sichuan, Yunnan, Guizhou, Ningxia, Xingjiang, Tibet and Chongqing). A series of fiscal initiatives and institutional innovations have been proposed and implemented to boost the region’s development prospects and close the income gaps between the western inland provinces and the rest of China. Till now, China’s development strategy for its western region has mainly focused on infrastructure construction and protection of the ecological environment and obtained great progress [65]. According to the data provided by the Western China Development Office of the State Council, 36 major projects started in 2000-2002, with a total investment of more than 600 billion RMB yuan. In the list, there are 10 key infrastructure projects, in which the first one is the ‘light rail’ railway project in Chongqing. Over the period from 2000 to 2006, the construction land in Chongqing increased by 10.23% (Table 2), most of which are due to infrastructure construction of the Western China Development Program. As for protection of the ecological environment, this program includes such projects as returning farmland reclaimed from forests, the protection of natural forests, and sandstorm control and prevention, which are also the contents of another important policy called “Grain-for-Green Programme.” 4.2.4 The Grain-for-Green Programme
China has 6.067 million hectares of steep-sloping farmlands of over 25 degrees, most of which is located in the Yangtze River and Yellow River basins [66]. Farming on deforested sloping lands usually led to accelerated rates of soil erosion in China. In order to bring sandstorm, soil erosion and frequent flooding under control, the Chinese Government initiated the Grain-for-Green Programme, also called the Conversion of Cropland to Forests and Grassland Programme [67,68]. The main feature of this programme is the provision of free grain and cash payments for participating farmers if they convert cultivated and grazing land to forests and grassland [69]. Under the circumstance of the decreasing farmland due to rapid industrialization and urbanization and increasing population size, from 30.02 million in 1995 to 31.99 million in 2006, forested land and grassland were changed to farmland to meet the needs for grain production and peasants’ making a living. In the period from 1995 to 2000, 1 423 ha forested land and 676 ha grassland were changed to farmland (Table 1). The Grain-for-Green Programme has been implemented in Chongqing since 2000, and it proceeded smoothly, as evidenced by the conversion of 6 478 ha and 319 ha farmland to forested land and grassland over the period from 2000 to 2006, respectively (Table 2).

Sensors 2008, 8
693
4.3 Implications for the new policy of ‘Urban-rural Integrated Reform’
The State Development and Reform Commission selected Chongqing as the only provincial-level Piloting City of Comprehensive Reform for Coordinated and Balanced Urban-rural Development in China, authorized by the Chinese State Council on June 7, 2007. Locating in western China, Chongqing is featured by an urban-rural binary structure, the co-existence of large urban area, large rural area and large area along the Three Gorges Project. Approximately 73.6% of the over 31 million registered populations in Chongqing are rural people. The per capita net income of Chongqing’s farmers was 2 874 RMB yuan in 2006, while the per capita disposable income of urban residents was 11 570 RMB yuan, about 4 times that of farmers [53]. This situation brings to Chongqing unusual difficulties in coordinating and balancing the urban and rural development. According to the new development plan, Chongqing will be built into a metropolis, and its urbanization level is expected to reach upwards of 70% by 2020 (http://en.ce.cn/Life/society/200710/11/t20071011_13196203.shtml). With this reform, a large-scale urbanization process is expected to take place in Chongqing in the coming years. Reforms in such areas as household registration systems, land management, social security and government administration will be initiated firstly to push forward comprehensive reforms and to achieve coordinated and balanced development between urban and rural areas (http://en.ec.com.cn/article/biznews/govtaffairs/200706/401753_1.html).
As far as land management is concerned, some implications for the new policy of ‘Urban-rural Integrated Reform’ can be obtained from the analysis of land-use change in Chongqing. On the one hand, it can be seen from table 4 that urbanization and rural development accounted for 71.1% and 29% (during 1995-2000), and 47.9% and 13.4% (from 2000 to 2006) of the decrease of farmland, respectively. On the other hand, Chongqing’s rural settlements increased by 39.66%, from 16 337 ha in 1995 to 22 817 ha in 2006 (Table 1 and Table 2); however, its rural population decreased by 3.64%, from 24.42 million in 1995 to 23.54 million in 2006 [53]. Combining with field investigation, we found that there is more idle rural housing land, vacant rural housing, and often one household owns two or more houses, either because the owners are rural-urban migrators or live permanently in urban areas, which resulted in a serious waste of land resources.
Therefore, the tasks of land management of local governments need to pay more attentions to curbing excessive and idle rural housing and consolidating rural construction land. Consolidating rural construction land has the same effects as the scheme of ‘shooting three birds with one stone’ does. First, farmland may be increased (returning rural housing land to farmland by carrying out land consolidation) or ‘new’ construction land may be available for meeting the needs of future economic development, which can also reduce the conversion of farmland in the future. Second, consolidating rural construction land is an effective prescription of changing the appearance of “dirty, disorderly and bad” in rural China. Finally, it can improve the villagers’ living conditions.
Urban sprawl is increasingly considered a significant and growing problem that entails a wide range of social and environmental costs [70]. However, China’s rural areas had to pay the bill for these costs due to lacking early planning. When some loads resulting from urban expansion were shifted upon rural area, the rural area had no choice but to take over the heavy burden, although without any preparation. Although Chongqing is rapidly transforming itself from an agricultural into an industrial city, sustainable rural development will be an important theme for a long time. To push forward the
Sensors 2008, 8
694
‘Urban-rural Integrated Reform,’ it is indispensable to lay out a scientific land-use plan for its rural areas taking such rural land-use issues as farmland occupation and rural housing land management into accounts, which has long been overlooked. In addition, the plan for Chongqing’s rural development needs to pay more attentions to making the rural have certain functions serving for the urban, e.g. accepting some transferred industries, providing ecological and other kinds of services for urban population.
5. Conclusions
This paper analyzed the urban-rural land-use change of Chongqing and its policy dimensional driving forces from 1995 to 2006, using remote sensing data and socio-economic data from both research institutes and government departments. Land use has changed significantly over the period from 1995 to 2006 in Chongqing. Urban-rural land-use change in Chongqing can be characterized by two major trends: First, the non-agricultural land (urban and rural settlements, construction land) increased substantially from 1995 to 2006, thus causing agricultural land especially farmland to decrease continuously. Second, the aggregation index of urban settlements and rural settlements shows that local urban-rural development experienced a process of changing from aggregation (1995-2000) to decentralization (2000-2006).
Land-use changes, while restricted by physical conditions, are mainly driven by socio-economic factors. They can be mainly characterized by the changes of cultivated land and construction land, which are tightly inter-related with human production activities. Although urbanization and industrialization are generally seen as two of the most important factors of land-use change, it is the policies established/implemented by central/local governments and the individual behavior of land users that actually drive the change, at the back of the phenomenon of urbanization and industrialization. Chongqing is a special area getting immersed in many important policies, which bring about tremendous influences on its land-use change. The areas of urban settlements and construction land in Chongqing increased by 20.18% and 55.17% from 1995 to 2000, and 17.52% and 10.23% from 2000 to 2006, respectively, due to the establishment of the municipality directly under the Central Government and the Western China Development Program. The direct impacts of the building of the Three Gorges Dam Project on land-use change are the increase of water body, which increased by 1.23% from 2000 to 2006. Since 2000, the implementation of the Grain-for-Green Programme has converted 6 478 ha and 319 ha farmland to forested land and grassland over the period from 2000 to 2006, respectively.
Rural development and urbanization are closely interrelated in the aspects of land use and natural environments. Urban-rural planners can make use of remotely sensed imagery, on which they can then superimpose other socio-economic or geographic information to provide a more detailed and insightful picture of the human landscape [71]. By analyzing urban-rural land-use change in Chongqing during 1995-2006, some implications for the new policy of ‘Urban-rural Integrated Reform’ are obtained. On the one hand, the tasks of land management of local governments need to pay more attentions to curbing excessive and idle rural housing and consolidating rural construction land. On the other hand, to push forward the ‘Urban-rural Integrated Reform,’ it is indispensable to lay out a scientific land-use plan for its rural areas, taking such rural land-use issues as farmland occupation and rural housing land management into accounts.
Sensors 2008, 8
695
Acknowledgements
This work was supported by the National Natural Science Foundation of China (Grant no. 40771014 and 40635029) and the Ministry of Science and Technology of China (Grant no. 2007BAC03A11-01). We thank Jian Zou at Peking University for his support of this study. The insightful and constructive comments of two anonymous reviewers are appreciated.
References
1. Ray, S.S.; Dadhwal, V.K. Estimation of crop evapotranspiration of irrigation command area using remote sensing and GIS. Agricultural Water Management 2001, 49(3), 239-249.
2. Jiang, D.; Yang, X.H.; Nicholas, C.; Wang, N.B. An artificial neural network model for estimating crop yields using remotely sensed information. International Journal of Remote Sensing 2004, 25(9), 1723-1732.
3. Kato, S.; Yamaguchi, Y. Estimation of storage heat flux in an urban area using ASTER data. Remote Sensing of Environment 2007, 110(1), 1-17.
4. Weng, Q.H.; Quattrochi, D.A. Thermal remote sensing of urban areas: an introduction to the special issue. Remote Sensing of Environment 2006, 104(2), 119-122.
5. Li, Z.W.; Zeng, G.M.; Zhang, H.; Yang, B.; Jiao, S. The integrated eco-environment assessment of the red soil hilly region based on GIS—a case study in Changsha City, China. Ecological Modelling 2007, 202(3-4), 540-546.
6. Fazal, S. Urban expansion and loss of agricultural land - a GIS based study of Saharanpur City, India. Environment and Urbanization 2000, 12, 133-149.
7. Weng, Q.H. Land use change analysis in the Zhujiang Delta of China using satellite remote sensing, GIS and stochastic modelling. Journal of Environmental Management 2002, 64, 273-284.
8. Liu, J.Y.; Liu, M.L.; Zhuang, D.F.; Zhang, Z.X.; Deng, X.Z. Study on spatial pattern of land-use change in China during 1995-2000. Sciences in China (Series D) 2003, 46, 373-378.
9. Nagendra, H.; Munroe, D.K.; Southworth, J. From pattern to process: landscape fragmentation and the analysis of land use/land cover change. Agriculture Ecosystems & Environment 2004, 101, 111-115.
10. Lambin, E.F.; Turner, B.L.; Geist, H.J.; Agbola, S.B.; Angelsen, A.; Bruce, J.W.; Coomes, O.T.; Dirzo, R.; Fischer, G.; Folke, C.; George, P.S.; Homewood, K.; Imbernon, J.; Leemans, R.; Li, X.B.; Moran, E.F.; Mortimore, M.; Ramakrishnan, P.S.; Richards, J.F.; Skanes, H.; Steffen, W.; Stone, G.D.; Svedin, U.; Veldkamp, T.A.; Vogel, C.; Xu, J.C. The causes of land-use and land-cover change: moving beyond the myths. Global Environmental Change-Human and Policy Dimensions 2001, 11, 261-269.
11. Yildirim, H.; Ozel, M.E.; Divan, N.J.; Akca, A. Satellite monitoring of land cover/land use change over 15 years and its impact on the environment in Gebze/Kocaeli-Turkey. Turkish Journal of Agriculture and Forestry 2002, 26, 161-170.
12. Giri, C.; Defourny, P.; Shrestha, S. Land cover characterization and mapping of continental Southeast Asia using multi-resolution satellite sensor data. International Journal of Remote Sensing 2003, 24, 4181-4196.

Sensors 2008, 8
696
13. Zhang, B.P.; Yao, Y.H.; Cheng, W.M.; Zhou, C.H.; Lu, Z.; Chen, X.D. Human-induced changes to biodiversity and alpine pastureland in the Bayanbulak Region of the East Tianshan Mountains. Mountain Research and Development 2002, 22, 1-7.
14. Walker, R. Mapping process to pattern in the landscape change of the Amazonian frontier. Annals of the Association of American Geographers 2003, 93, 376-398.
15. Xie, Y.C.; Fang, C.L.; Lin, G.C.S.; Gong, H.M.; Qiao, B. Tempo-spatial patterns of land use changes and urban development in globalizing China: a study of Beijing. Sensors 2007, 7, 2881-2906.
16. Moglen, G.E.; Beighley, R.E. Spatially explicit hydrologic modeling of land use change. Journal of the American Water Resources Association 2002, 38, 241-253.
17. Poyatos, R.; Latron, J.; Liorens, P. Land use and land cover change after agricultural abandonment - the case of a Mediterranean Mountain Area (Catalan Pre-Pyrenees). Mountain Research and Development 2003, 23, 362-368.
18. Himiyama, Y. Land use cover changes in Japan: from the past to the future. Hydrological Processes 1998, 12, 1995-2001.
19. Chen, J.; Gong, P.; He, C.Y.; Pu, R.L.; Shi, P.J. Land-use/land-cover change detection using improved change-vector analysis. Photogrammetric Engineering and Remote Sensing 2003, 69, 369-379.
20. Liu, Y.S.; Gao, J.; Yang, Y.F. A holistic approach towards assessment of severity of land degradation along the Greatwall in northern Shaanxi province, China. Environmental Monitoring and Assessment 2003, 82, 187-202.
21. Hietel, E.; Waldhardt, R.; Otte, A. Analysing land-cover changes in relation to environmental variables in Hesse, Germany. Landscape Ecology 2004, 19, 473-489.
22. Kaufmann, R.K.; Seto, K.C. Change detection, accuracy, and bias in a sequential analysis of Landsat imagery in the Pearl River Delta, China: econometric techniques. Agriculture Ecosystems & Environment 2001, 85, 95-105.
23. Krausmann, F.; Haberl, H.; Schulz, N.B.; Erb, K.H.; Darge, E.; Gaube, V. Land-use change and socio-economic metabolism in Austria - Part I: driving forces of land-use change: 1950-1995. Land Use Policy 2003, 20, 1-20.
24. Verburg, P.H.; Veldkamp, A.; Fresco, L.O. Simulation of changes in the spatial pattern of land use in China. Applied Geography 1999, 19, 211-233.
25. Aspinall, R. Modelling land use change with generalized linear models--a multi-model analysis of change between 1860 and 2000 in Gallatin Valley, Montana. Journal of Environmental Management 2004, 72, 91-103.
26. Kelly, P.F. Urbanization and the politics of land in the Manila region. Annals of the American Academy of Political and Social Science 2003, 590, 170-187.
27. Alig, R.J.; Kline, J.D.; Lichtenstein, M. Urbanization on the US landscape: looking ahead in the 21st century. Landscape and Urban Planning 2004, 69, 219-234.
28. Long, H.L.; Tang, G.P.; Li, X.B.; Heilig, G.K. Socio-economic driving forces of land-use change in Kunshan, the Yangtze River Delta Economic Area of China. Journal of Environmental Management 2007, 83(3), 351-364.

Sensors 2008, 8
697
29. Jat, M.K.; Garg, P.K.; Khare, D. Monitoring and modelling of urban sprawl using remote sensing and GIS techniques. International Journal of Applied Earth Observation and Geoinformation 2008, 10(1), 26-43.
30. Luck, M.; Wu, J. A gradient analysis of urban landscape pattern: a case study from the Phoenix metropolitan region, Arizona, USA. Landscape Ecology 2002, 17, 327-339.
31. Yu, X.J.; Ng, C.N. Spatial and temporal dynamics of urban sprawl along two urban–rural transects: A case study of Guangzhou, China. Landscape and Urban Planning 2007, 79(1), 96-109.
32. Camagni, R.; Gibelli, M.C.; Rigamonti, P. Urban mobility and urban form: the social and environmental costs of different patterns of urban expansion. Ecological Economics 2002, 40, 199-216.
33. El-raey, M.; Fouda, Y.; Gal, P. GIS for environmental assessment of the impacts of urban encroachment on rosetta region, Egypt. Environmental Monitoring and Assessment 2000, 60, 217-233.
34. Martinuzzi, S.; Gould, W.A.; Gonzalez, O.M.R. Land development, land use, and urban sprawl in Puerto Rico integrating remote sensing and population census data. Landscape and Urban Planning 2007, 79, 288-297.
35. Sudhira, H.S.; Ramachandra, T.V.; Jagadish, K.S. Urban sprawl: metrics, dynamics and modelling using GIS. International Journal of Applied Earth Observation and Geoinformation 2004, 5(1), 29-39.
36. Hathout, S. The use of GIS for monitoring and predicting urban growth in East and West St Paul, Winnipeg, Manitoba, Canada. Journal of Environmental Management 2002, 66, 229-238.
37. Herold, M., Goldstein, N.C., Clarke, K.C. The spatiotemporal form of urban growth: measurement, analysis and modeling. Remote Sensing of Environment 2003, 86, 286-302.
38. Long, H.L.; Heilig, G.K.; Li, X.B.; Zhang, M. Socio-economic development and land-use change: analysis of rural housing land transition in the Transect of the Yangtse River, China. Land Use Policy 2007, 24(1), 141-153.
39. Deng, X.Z.; Huang, J.K.; Rozelle, S.; Uchida, E. Growth, population and industrialization, and urban land expansion of China. Journal of Urban Economics 2008, 63, 96-115.
40. Tian, G.J.; Liu, J.Y.; Xie, Y.C.; Yang, Z.F.; Zhuang, D.F.; Niu, Z. Analysis of spatio-temporal dynamic pattern and driving forces of urban land in China in 1990s using TM images and GIS. Cities 2005, 22(6), 400-410.
41. Liu, J.Y.; Zhan, J.Y.; Deng, X.Z. Spatio-temporal patterns and driving forces of urban land expansion in China during the economic reform era. Ambio 2005, 34, 450-455.
42. Li, X.; Yeh, A.G.O. Analyzing spatial restructuring of land use patterns in a fast growing region using remote sensing and GIS. Landscape and Urban Planning 2004, 69, 335-354.
43. Seto, K.C., Kaufmann, R.K. Modeling the drivers of urban land use change in the Pearl River Delta, China: integrating remote sensing with socio-economic data. Land Economics 2003, 79, 106-121.
44. Weng, Q.H.; Yang, S.H. Managing the adverse thermal effects of urban development in a densely populated Chinese city. Journal of Environmental Management 2004, 70(2), 145-156.
45. Weng, Q.H.; Yang, S.H. An approach to evaluation of sustainability for Guangzhou’s urban ecosystem. International Journal of Sustainable Development & World Ecology 2003, 10, 69-81.
Sensors 2008, 8
698
46. Walcotta, S.M.; Pannell, C.W. Metropolitan spatial dynamics: Shanghai. Habitat International 2006, 30, 199-211.
47. Tan, M.H.; Li, X.B.; Xie, H., Lu, C.H. Urban land expansion and arable land loss in China – a case study of Beijing–Tianjin–Hebei region. Land Use Policy 2005, 22, 187-196.
48. Xiao, J.Y.; Shen, Y.J.; Ge, J.F.; Tateishi, R.; Tang, C.Y.; Liang, Y.Q.; Huang, Z.Y. Evaluating urban expansion and land use change in Shijiazhuang, China, by using GIS and remote sensing. Landscape and Urban Planning 2006, 75, 69-80.
49. Zhang, L.C.; Zhu, T.M.; Yao, S.M. Evolvement of urban spatial structure and main drives in Wuxi, China. Chinese Geographical Science 2005, 15(4), 309-314.
50. Xie, Y.C.; Yu, M.; Bai, Y.F.; Xing, X.R. Ecological analysis of an emerging urban landscape pattern—desakota: a case study in Suzhou, China. Landscape Ecology 2006, 21, 1297-1309.
51. Wu, Q.; Li, H.Q.; Wang, R.S.; Paulussen, J.; He, Y.; Wang, M.; Wang, B.H.; Wang, Z. Monitoring and predicting land use change in Beijing using remote sensing and GIS. Landscape and Urban Planning 2006, 78(4), 322-333.
52. Han, S.S.; Wang, Y. City profile: Chongqing. Cities 2001, 18(2), 115-125. 53. Chongqing Statistical Bureau (CSB). Chongqing Statistical Yearbook. Chinese Statistical
Publishing House: Beijing, 1996-2007. 54. The Ministry of Land and Resources of China (MLRC). Reports on China’s land-use survey and
update. China Land Press: Beijing, 2002-2006. 55. McGarigal, K.; Cushman, S.A.; Neel, M.C.; Ene, E. FRAGSTATS: Spatial Pattern Analysis
Program for Categorical Maps, 2002. 56. Turner, M.G. Landscape ecology: the effect of pattern on process. Annual Review of Ecology and
Systematics 1989, 20, 171-197. 57. Sleeman, J.C.; Kendrick, G.A.; Boggs, G.S.; Hegge, B.J. Measuring fragmentation of seagrass
landscapes: which indices are most appropriate for detecting change? Marine and Freshwater Research 2005, 56, 851-864.
58. Jenerette, G.D.; Wu, J.G. Analysis and simulation of land-use change in the central Arizona-Phoenix region, USA. Landscape Ecology 2001, 16, 611-626.
59. Wu, L.X.; Sun, B.; Zhou, S.L.; Huang, S.E.; Zhao, Q.G. A new fusion technique of remote sensing images for land use/cover. Pedosphere 2004, 14, 187-194.
60. Skinner, M.W.; Kuhn, R.G.; Joseph, A.E. Agricultural land protection in China: a case study of local governance in Zhejiang Province. Land Use Policy 2001, 18, 329-340.
61. Cui, G.; Ma, L.J.C. Urbanization from below in China: its development and mechanisms. Acta Geographica Sinica 1999, 54, 106-115 (in Chinese).
62. Chongqing Construction Committee. Chongqing Construction Industry Report in Year 2000. Chongqing, 2000.
63. Wu, J.G.; Huang, J.H.; Han, X.G.; Gao, X.M.; He, F.L.; Jiang, M.X.; Jiang, Z.G.; Primack, R.B.; Shen, Z.H. The Three Gorges Dam: an ecological perspective. Frontiers in Ecology and the Environment 2004, 2, 241-248.
64. Marta, P.; Jordi, L.P. The Three Gorges Dam Project in China: history and consequences. Revista HmiC 2006, VI, 151-187.

Sensors 2008, 8
699
65. Wang, L.L.; Wei, H.K. Progress of Western China Development Drive, and Evaluation of the Results. China & World Economy 2004, 12(2), 20-33.
66. State Forestry Administration (SFA). China Forestry Development Report in 2000. Chinese Forestry Press: Beijing, 2000.
67. Feng, Z.M.; Yang, Y.Z.; Zhang, Y.Q.; Zhang, P.T.; Li, Y.Q. Grain-for-green policy and its impacts on grain supply in West China. Land Use Policy 2005, 22, 301-312.
68. Wang, X.H.; Lu, C.H.; Fang, J.F.; Shen, Y.C. Implications for development of grain-for-green policy based on cropland suitability evaluation in desertification-affected north China. Land Use Policy 2007, 24, 417-424.
69. Long, H.L.; Heilig, G.K.; Wang, J.; Li, X.B.; Luo, M.; Wu, X.Q.; Zhang, M. Land use and soil erosion in the upper reaches of the Yangtze River: some socio-economic considerations on China’s Grain-for-green Programme. Land Degradation & Development 2006, 17, 589-603.
70. Bengston, D.N.; Fletcher, J.O.; Nelson, K.C. Public policies for managing urban growth and protecting open space: policy instruments and lessons learned in the United States. Landscape and Urban Planning 2004, 69, 271-286.
71. Carlson T. Applications of remote sensing to urban problems. Remote Sensing of Environment 2003, 86, 273-274.
© 2008 by MDPI (http://www.mdpi.org). Reproduction is permitted for noncommercial purposes.